e-governance - harvard university divide? pippa norris - chapter 6 - page 1 11 /20 2000 7:00 pm...
TRANSCRIPT
DIGITAL DIVIDE? PIPPA NORRIS - CHAPTER 6 - PAGE 1 11/20/2000 7:00 PM
Chapter 6
e-Governance
Cyber-optimists are hopeful that the development of interactive services, new
channels of communication, and efficiency gains from digital technologies will contribute
towards revitalizing the role of government executives in representative democracies,
facilitating communications between citizen and the state. In contrast cyber-pessimists
express doubts about the capacity of governments to adapt to the new environment. After
reviewing theories about these issues, this chapter will examine the evidence and compare
the causes and consequences of the rise of e-governance in terms of three core questions:
? ? Where and what type of government departments are online around the globe?
? ? To evaluate the consequences of the rise of e-governance, what are the democratic
functions of government websites; in particular how far do they provide transparent
information about government activities and opportunities for interactive communication
between citizens and the state?
? ? What explains the growth of e-governance and, in particular, how far does
democratization drive this process, or is socioeconomic or technological
development more important?
Theories about the Impact of e-Government
Like other political institutions, government departments and official agencies have
adapted to the Information Society during the last few years, albeit at a more cautious pace
than the private sector. The main potential of digital technologies for government,
cyberoptimists suggest, lies in strengthening policy effectiveness, political accountability, and,
to a lesser extent, public participation1. E-governance holds great promise for the delivery of
many types of public services from housing and welfare benefits to community health care
and the electronic submission of tax returns, reconnecting official bureaucrats with citizen-
customers2. The Internet can serve multiple functions: disseminating information about the
operation of government as well as public services, facilitating public feedback mechanisms
like emails to government agencies, enabling more direct participation into the decision-
making process including consultation exercises at local level, and providing direct support
for the democratic process, such as the efficient administration of electoral registration or
online voting3. There is widespread concern that the public has lost faith in the performance
of the core institutions of representative government, and it is hoped that more open and
DIGITAL DIVIDE? PIPPA NORRIS - CHAPTER 6 - PAGE 2 11/20/2000 7:00 PM
transparent government and more efficient service delivery could help restore public
confidence4. In developing societies, the Internet can potentially help with the multiple
challenges facing the effective delivery and administration of basic government services such
as health and education, especially given the global reach that the technology provides,
connecting medical professionals, local officials and university teachers in Oslo, Cambridge
and Geneva with those in Nepal, Bangalore, and Havana.
For all these reasons, cyber-optimists have high hopes about the democratic
potential of digital technologies. Yet such visions are tempered by more cautious voices
stressing that it is naïve to expect technology to transform government departments as
organizations that are inherently conservative, hierarchical and bureaucratic. Official
documents can be published online, but it still often requires considerable knowledge and
technical skills to negotiate the complexities of these information resources. An OECD
study of e-governance, based on a series of interviews with information specialists, public
officials and the policymaking community in eight post-industrial societies in 1996-7,
presents a pessimistic scenario. The report found that new technologies had had little impact
on the way that governments gathered information for policy analysis, since traditional
methods like letters, written submissions and informal meeting continued to predominate5.
Digital technologies like email have had greater impact in the dissemination of information
to senior decision-makers and policy elites, although even here traditional channels remained
most popular, including press releases, official Gazettes and face-to-face meetings. The
report concluded that the overall impact of the Internet has failed to increase access to
policymakers, to improve the transparency of government decision-making, or to facilitate
public participation in policymaking.
Similar concerns have been expressed elsewhere. Many observe that although
governments have developed websites to promote ‘top down’ publicity, and even state
propaganda, there are few opportunities so far via these media for genuine ‘bottom up’
interaction, public criticism, or discursive deliberation6. Advocates of direct or ‘strong’
democracy frequently critique the ‘failure’ of the reality of digital politics to live up to their
expectations, and then conclude that because political participation has not been
transformed, the internet represents ‘politics as usual’ and nothing significant has changed7.
But the key issue here is whether the Internet provides an effective means of government
communication and information supplementing traditional channels. In terms of the overall
opportunities for political information and communication, are we better off or worse off in
the Internet Age than say ten, twenty or thirty years ago? To evaluate these issues this

DIGITAL DIVIDE? PIPPA NORRIS - CHAPTER 6 - PAGE 3 11/20/2000 7:00 PM
chapter starts by mapping where government departments have moved ahead into the
Internet age and where governments continue to lag behind around the globe.
The Rise of e-Governance
The full range of new information technologies may serve multiple internal
administrative and organizational functions for governments, linking horizontally as well as
vertically. These technologies include the proliferation of fax machines, beepers and mobile
phones, email, listservs and Intranets binding together internal communications between
departments or branches, as well as the use of computers in government offices. Email
communications are particularly important for strengthening one-to-one communications
and group networks within established political organizations, as in the corporate world and
local community, as well as linking citizens and government8. But technologies like fax
machines and mobile phones usually serve to supplement or replace older machines, just as
photocopies replaced roneoed stencils, and stencils replaced carbon paper, altering the speed
and convenience without essentially changing the function or contents of communications.
Being able to communicate faster does not necessarily mean that this will be to greater
effect. Detailed case studies and network analysis are useful tools to study the internal use of
these private forms of communications within government departments, drawing on the
growing literature in organizational theory and management studies on the use of digital
technologies in business and the non-profit sector9. Initiatives in e-governance by local, state
and national agencies have attracted considerable interest in public administration and
management studies, such as comparisons by the 20-nation Government Online (GOL)
survey and OECD Public Management report10. Much of the interactive government activity
conducted via digital means, including the most effective forms of interpersonal persuasion
and deliberation, may be underestimated since it occurs within communities behind closed
doors.
Government websites - the primary focus of this chapter - are the most important
public face of the Internet. Building on the literature, a simple mapping exercise helps to
establish where e-governance has developed most fully. Two sources are used. The first
estimate of the total number of all government websites in 179 countries, excluding
dependent territories, is derived from Governments on the WWW. This source provides the
most comprehensive list worldwide, and the accuracy of the list was confirmed and checked
using common search engines like Yahoo11. The analysis based on this list summarizes the
total number of all official government websites in each country, broadly defined to include
those for the national executive (such as ministries, departments, offices, agencies, institutes,
councils and committees), as well as for the legislative branch, state and local governments,
DIGITAL DIVIDE? PIPPA NORRIS - CHAPTER 6 - PAGE 4 11/20/2000 7:00 PM
all political party websites (including at regional as well as national levels), the law courts,
government representatives in foreign countries including embassies and consulates, and
other official institutions. Some of the cross-national variations may be due to specific
administrative policies, such as whether government websites are hosted from one central
server or dispersed across more autonomous agencies at different levels.
This initial estimate provides a comprehensive overview of all official sites but it
does not distinguish between different agencies, although politically it is far more important
for the transparency of government and the accountability of officials that citizens can find
out about central government ministries and the core executive rather than, say, travel and
tourism information from embassies. To focus on national-level government agencies such
as Cabinet ministries the chapter draws on a second source of data, from the Cyberspace
Policy Research (CyPRG) group12. This database has systematically monitored ministerial-
level national government departmental websites around the world since 1997. The latest
year of data that is available (1999) identified 2941 such websites in 105 nations.
[Table 6.1 and Figure 6.1 about here]
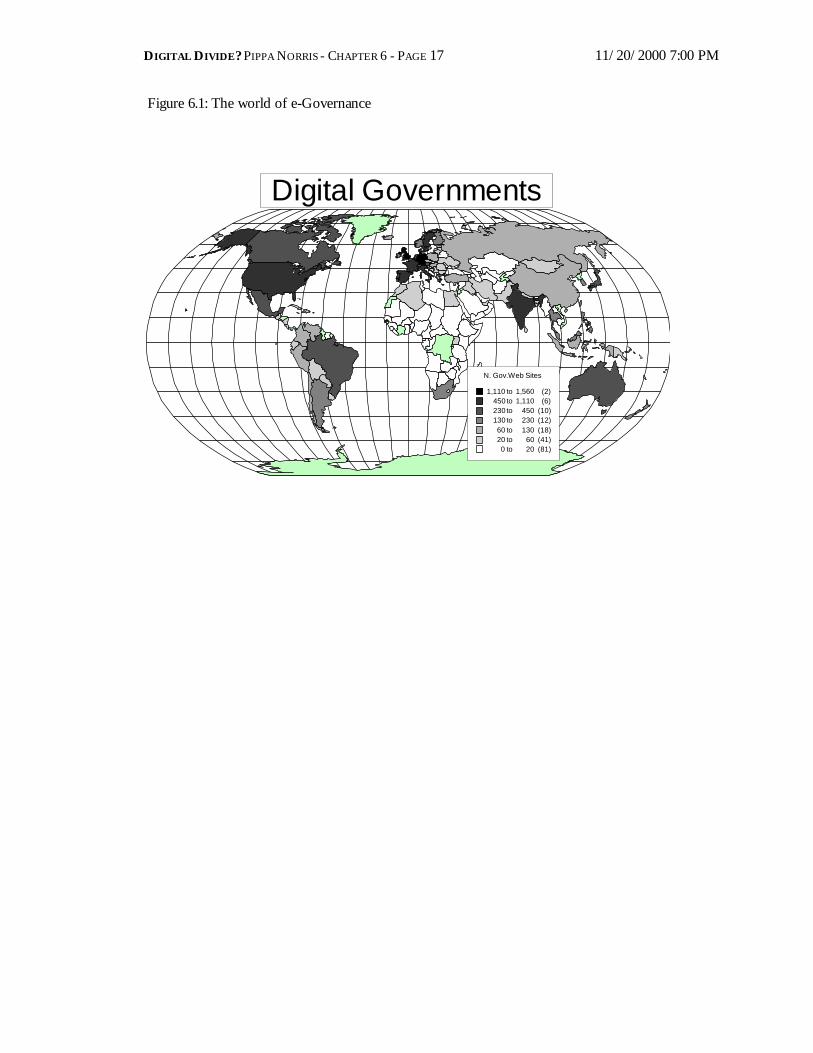
The map of e-governance around the globe is illustrated in Figure 6.1. Worldwide in
total over fourteen thousand government agencies were found online in mid-2000, a
remarkable number given that the World Wide Web is a relatively recent development.
North America and Western Europe lead the world in the spread of e-governance, followed
by Scandinavia, with the Middle East and Sub-Saharan Africa ranking last. The comparison
of the total number of government webs ranked by individual countries shows that Germany
tops the list, in part because of the extensive development of websites at Lander level in the
federal system. Other leading countries include the UK, US, France, Italy, Spain, and
Sweden, all affluent post-industrial societies, but also, perhaps more unexpectedly, India
(ranked 7th) and Brazil (ranked 9th). These exceptions strongly suggest that government
priorities, telecommunication strategies, and the structure of federalism in the political
system may help to drive this process, since some developing societies with relatively low
levels of connectivity but a decentralized political system have forged ahead in digital
government. Further down the rankings, Mexico, Taiwan and Malaysia also have far more
government websites than would be expected by their levels of socioeconomic development
alone. Yet the presence of these outliers should not be exaggerated since the overall
contrasts between developing and industrialized nations are marked; on average, only eight
government department or agencies maintain a website in each of the poorest nations
whereas in contrast 240 such sites were found in each of the more affluent societies.
DIGITAL DIVIDE? PIPPA NORRIS - CHAPTER 6 - PAGE 5 11/20/2000 7:00 PM
The more limited comparison of ministerial or national-level government websites
from the CyPRG data confirms a similar pattern, with almost 3000 departmental websites
online, representing on average about 27 per country. Again there are marked contrasts by
levels of human development, with only three departments online in the poorest nations
compared with 45 in the most developed. The disparities by level of democratization are also
clear, with a dozen departments online under non-democratic regimes compared with more
than three times as many (39) in the most democratic states. The regional comparison
displays a familiar picture although fewer central departments in Central and Eastern Europe
have ventured online than might be expected from other indicators of technological
diffusion, and in contrast more government ministries in the Middle East have moved into
e-governance.
The Democratic Functions of Government Websites
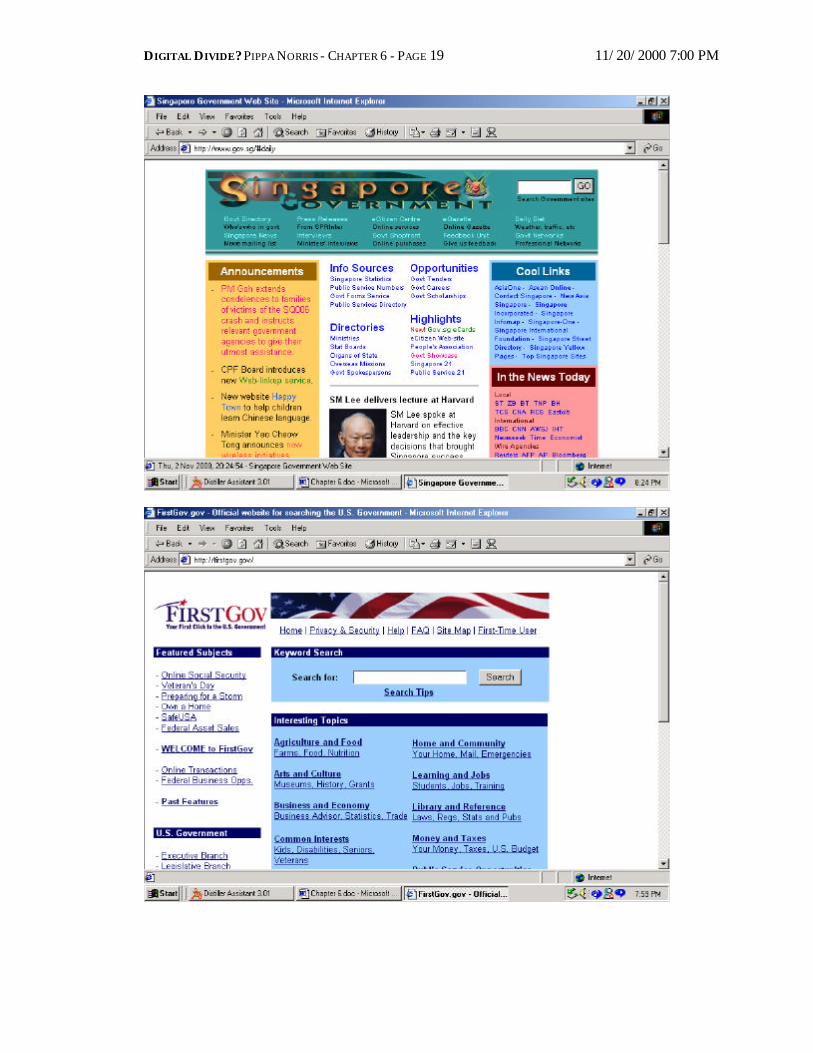
The government websites that have been launched vary substantially in their levels
of information and interactivity, as well as in how far there has been an attempt at linking all
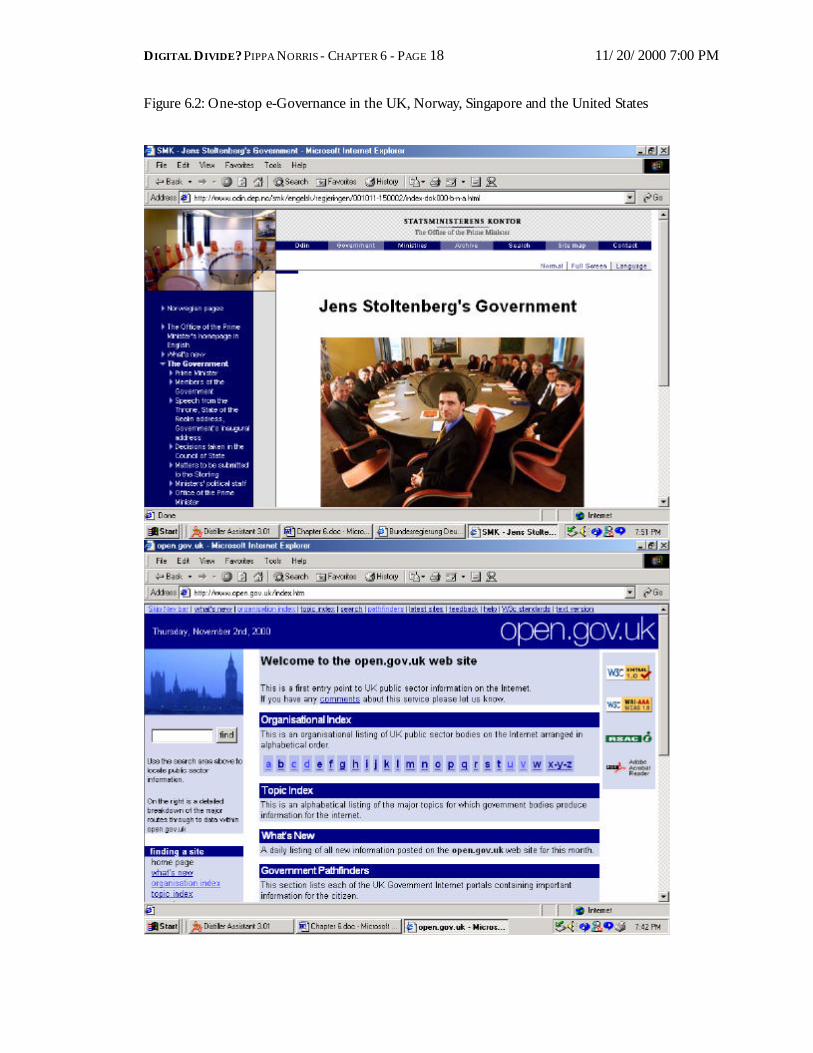
the available official sources into a client-oriented portal. As illustrated in Figure 6.2, some
websites like that illustrated for the Norwegian government continue to be organized
traditionally by ministries or agencies, which requires users to understand the responsibilities
and functions of different institutions. Countries like the UK have adopted a ‘one-stop shop’
approach attempting to tie together multiple government departments and agencies at all
levels. The aim is to allow citizens to find the information and transactions they need in one
searchable integrated database, as well to strengthen linkages between departments, and to
encourage ‘joined-up’ government13. Other innovative designs, such as FirstGov.gov site in
the United States and the Singapore government website, aim to provide a more customer-
oriented approach organized by topics and issues, stressing how to deal with government
services and regulations, such as those concerning jobs, health or taxes.
[Figure 6.2 about here – illustrated together]
To analyze which departments were online, and to consider the role of these
websites more systematically, this study can draw on the content analysis data collected by
the Cyberspace Policy Research (CyPRG) group14. The database has systematically examined
the contents and format of national-level government department websites around the
world. The analysis classifies the contents according to two principle criteria: the informational
transparency of the website based on indicators such as the site ownership, contact details,
organizational information, and freshness of updated material, and the communication
interactivity of the website based on the provision of links and opportunities for input. Table
6.2 shows the worldwide distribution in 1999 of almost 3000 government department
DIGITAL DIVIDE? PIPPA NORRIS - CHAPTER 6 - PAGE 6 11/20/2000 7:00 PM
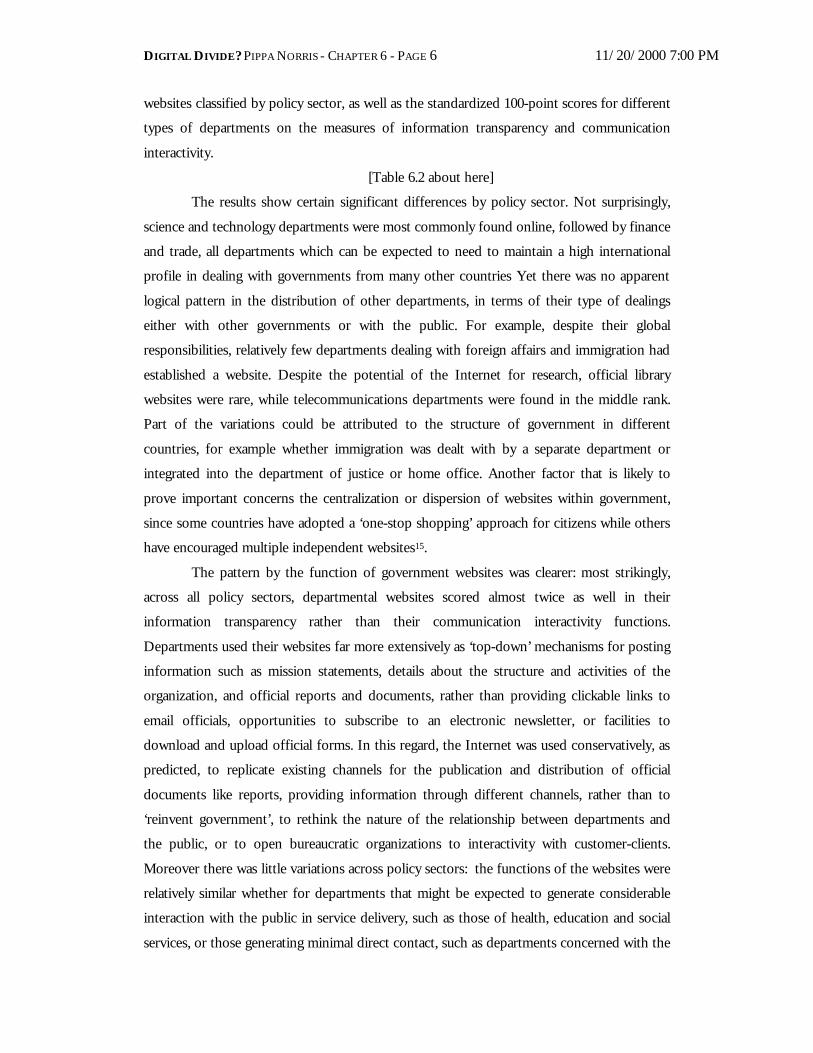
websites classified by policy sector, as well as the standardized 100-point scores for different
types of departments on the measures of information transparency and communication
interactivity.
[Table 6.2 about here]
The results show certain significant differences by policy sector. Not surprisingly,
science and technology departments were most commonly found online, followed by finance
and trade, all departments which can be expected to need to maintain a high international
profile in dealing with governments from many other countries Yet there was no apparent
logical pattern in the distribution of other departments, in terms of their type of dealings
either with other governments or with the public. For example, despite their global
responsibilities, relatively few departments dealing with foreign affairs and immigration had
established a website. Despite the potential of the Internet for research, official library
websites were rare, while telecommunications departments were found in the middle rank.
Part of the variations could be attributed to the structure of government in different
countries, for example whether immigration was dealt with by a separate department or
integrated into the department of justice or home office. Another factor that is likely to
prove important concerns the centralization or dispersion of websites within government,
since some countries have adopted a ‘one-stop shopping’ approach for citizens while others
have encouraged multiple independent websites15.
The pattern by the function of government websites was clearer: most strikingly,
across all policy sectors, departmental websites scored almost twice as well in their
information transparency rather than their communication interactivity functions.
Departments used their websites far more extensively as ‘top-down’ mechanisms for posting
information such as mission statements, details about the structure and activities of the
organization, and official reports and documents, rather than providing clickable links to
email officials, opportunities to subscribe to an electronic newsletter, or facilities to
download and upload official forms. In this regard, the Internet was used conservatively, as
predicted, to replicate existing channels for the publication and distribution of official
documents like reports, providing information through different channels, rather than to
‘reinvent government’, to rethink the nature of the relationship between departments and
the public, or to open bureaucratic organizations to interactivity with customer-clients.
Moreover there was little variations across policy sectors: the functions of the websites were
relatively similar whether for departments that might be expected to generate considerable
interaction with the public in service delivery, such as those of health, education and social
services, or those generating minimal direct contact, such as departments concerned with the

DIGITAL DIVIDE? PIPPA NORRIS - CHAPTER 6 - PAGE 7 11/20/2000 7:00 PM
management of internal government operations or defense. While the design usually proved
conservative, the provision of electronic information resources may still have certain
important consequences, since the distribution of electronic information resources becomes
equally available to all actors, whether professional lobbyists or activist volunteers, the costs
of access are sharply reduced, resources are searchable, and the information is in real-time
for pending proposals. Those seeking to challenge the authorities on current issues of
concern, -- including think-tank policy analysts, professional advocates, backbench
politicians, small opposition parties, journalists, and organizational activists, -- can use these
resources to be as well briefed as government ministers and civil servants about official
reports, government proposals, administrative decisions, and pending legislation. Making
sense of the materials remains a demanding process, but the provision of more official
documents and search facilities via the Internet loosens some of the government’s control
over information resources and augments the transparency of the decision-making process.
Explaining the Rise of e-Governance
What helps to explain the rise of e-governance? It might be anticipated that the type
of political system would be one of the leading candidates, in particular e-governance could
plausibly be expected to have developed furthest in long-established democratic states which
are committed to open government and freedom of information, such as Norway, Canada
and Australia, rather than in consolidating and transitional democracies like Russia, Sri Lanka
and Tanzania, and the contrasts are likely to be even stronger with the availability of official
information online in one-party regimes and authoritarian states. Yet there may also be
many exceptions to this pattern since general levels of socioeconomic development and the
broader process of technological diffusion may also influence the rise of e-governance.
Government departments may have developed few websites in many poorer societies
lagging behind the Internet revolution in sub-Saharan Africa and South East Asia, including
democracies like Mali and Bangladesh, while in contrast more public services may have
transferred online to streamline administrative efficiency and maximize bureaucratic control
in affluent but non-democratic countries, such as Singapore, Malaysia and Saudi Arabia.
Therefore levels of democratization, technological diffusion, and socioeconomic
development are all factors that may plausibly explain the distribution of government
websites worldwide. Following the logic discussed in the previous chapter, the models in this
DIGITAL DIVIDE? PIPPA NORRIS - CHAPTER 6 - PAGE 8 11/20/2000 7:00 PM
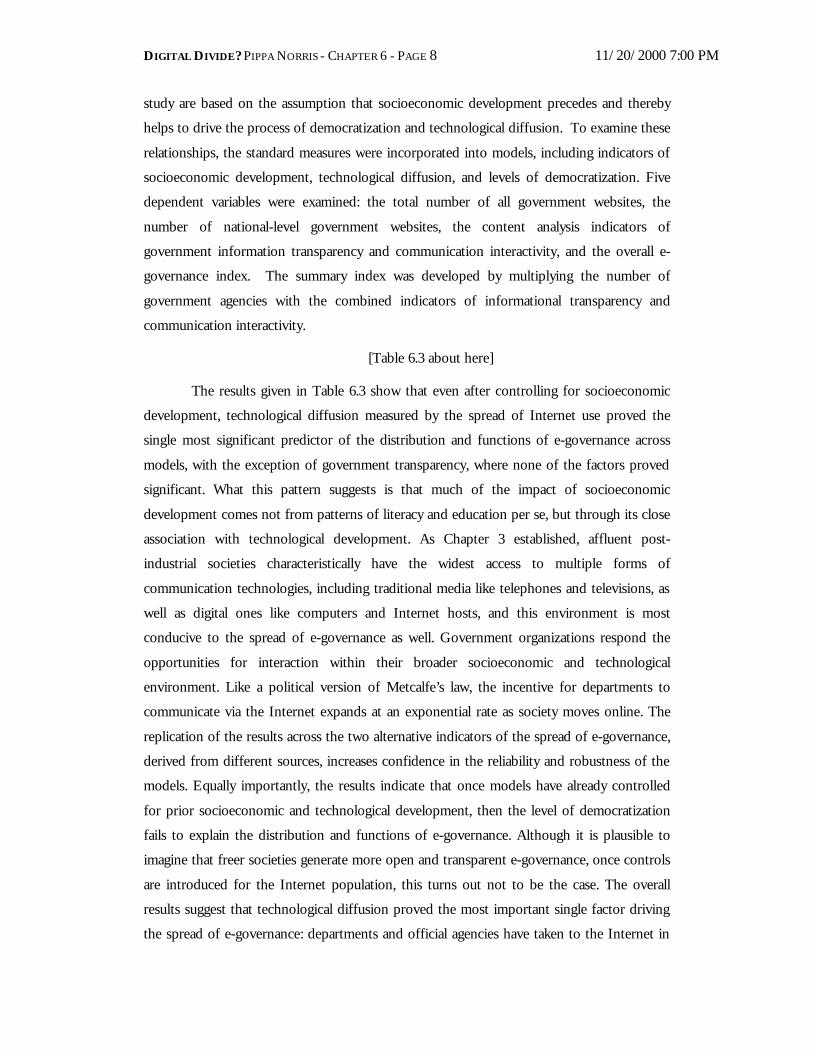
study are based on the assumption that socioeconomic development precedes and thereby
helps to drive the process of democratization and technological diffusion. To examine these
relationships, the standard measures were incorporated into models, including indicators of
socioeconomic development, technological diffusion, and levels of democratization. Five
dependent variables were examined: the total number of all government websites, the
number of national-level government websites, the content analysis indicators of
government information transparency and communication interactivity, and the overall e-
governance index. The summary index was developed by multiplying the number of
government agencies with the combined indicators of informational transparency and
communication interactivity.
[Table 6.3 about here]
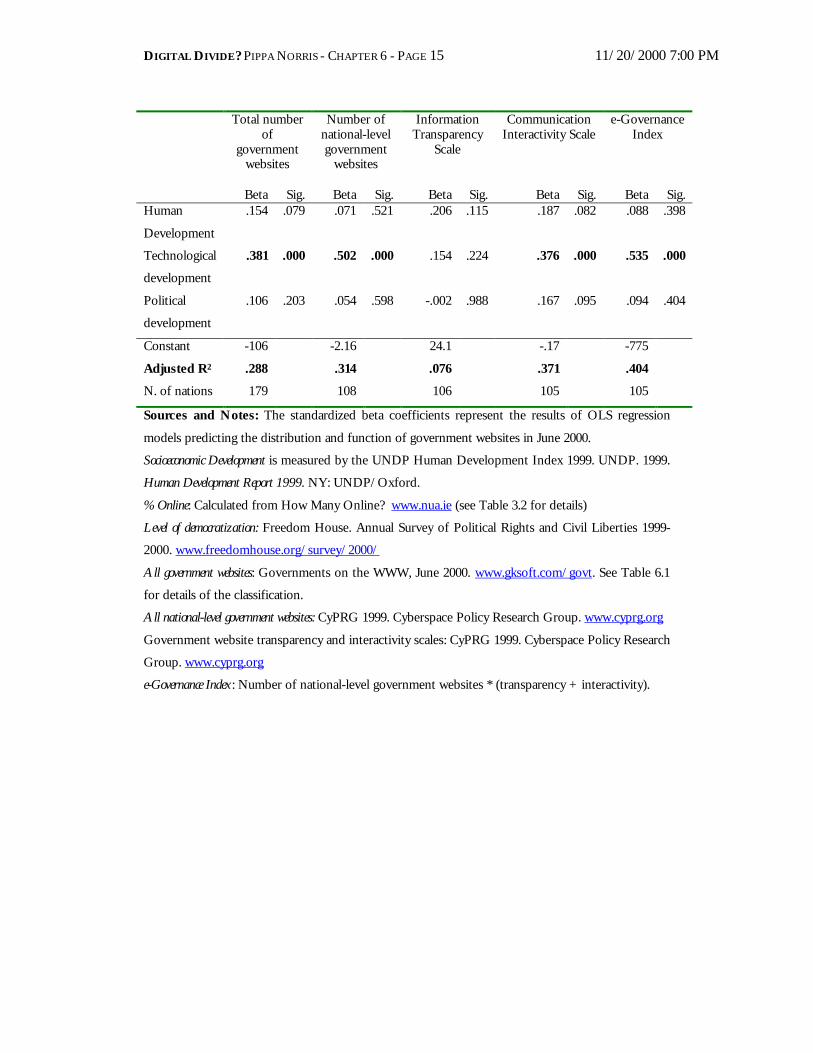
The results given in Table 6.3 show that even after controlling for socioeconomic
development, technological diffusion measured by the spread of Internet use proved the
single most significant predictor of the distribution and functions of e-governance across
models, with the exception of government transparency, where none of the factors proved
significant. What this pattern suggests is that much of the impact of socioeconomic
development comes not from patterns of literacy and education per se, but through its close
association with technological development. As Chapter 3 established, affluent post-
industrial societies characteristically have the widest access to multiple forms of
communication technologies, including traditional media like telephones and televisions, as
well as digital ones like computers and Internet hosts, and this environment is most
conducive to the spread of e-governance as well. Government organizations respond the
opportunities for interaction within their broader socioeconomic and technological
environment. Like a political version of Metcalfe’s law, the incentive for departments to
communicate via the Internet expands at an exponential rate as society moves online. The
replication of the results across the two alternative indicators of the spread of e-governance,
derived from different sources, increases confidence in the reliability and robustness of the
models. Equally importantly, the results indicate that once models have already controlled
for prior socioeconomic and technological development, then the level of democratization
fails to explain the distribution and functions of e-governance. Although it is plausible to
imagine that freer societies generate more open and transparent e-governance, once controls
are introduced for the Internet population, this turns out not to be the case. The overall
results suggest that technological diffusion proved the most important single factor driving
the spread of e-governance: departments and official agencies have taken to the Internet in

DIGITAL DIVIDE? PIPPA NORRIS - CHAPTER 6 - PAGE 9 11/20/2000 7:00 PM
societies leading the digital revolution. E-governance may help to strengthen
democratization, but the process of democratization does not appear to be its primary cause.
[Figures 6.4 and 6.5 on the same page near here]
To confirm that this interpretation was not just a statistical artifact, or a by-product
of the sequential ordering of the variables in the models, and to identify any particular
anomalies to this pattern, the main relationships were also examined graphically by using
scatterplots. The pattern comparing the level of democratization with the index of e-
governance shown in Figure 6.5 confirms the models, and explains some of the reasons for
the poor fit. It is true that established democracies like Germany, the UK and the United
States are ahead in e-governance, yet some comparable democracies such as Greece and
Belgium continue to lag far behind. The most plausible reason is that the broader structure
of the Information Society is poorly institutionalized in democracies like Greece, where
relatively few people are online, and, given Metcalf’s law about the value of networks, this
context creates minimal incentives for official departments to venture online. Similar
contrasts can be drawn within every category of democratization, such as between India and
the Philippines, between Brazil and the Ukraine, between Egypt and Algeria. In contrast, the
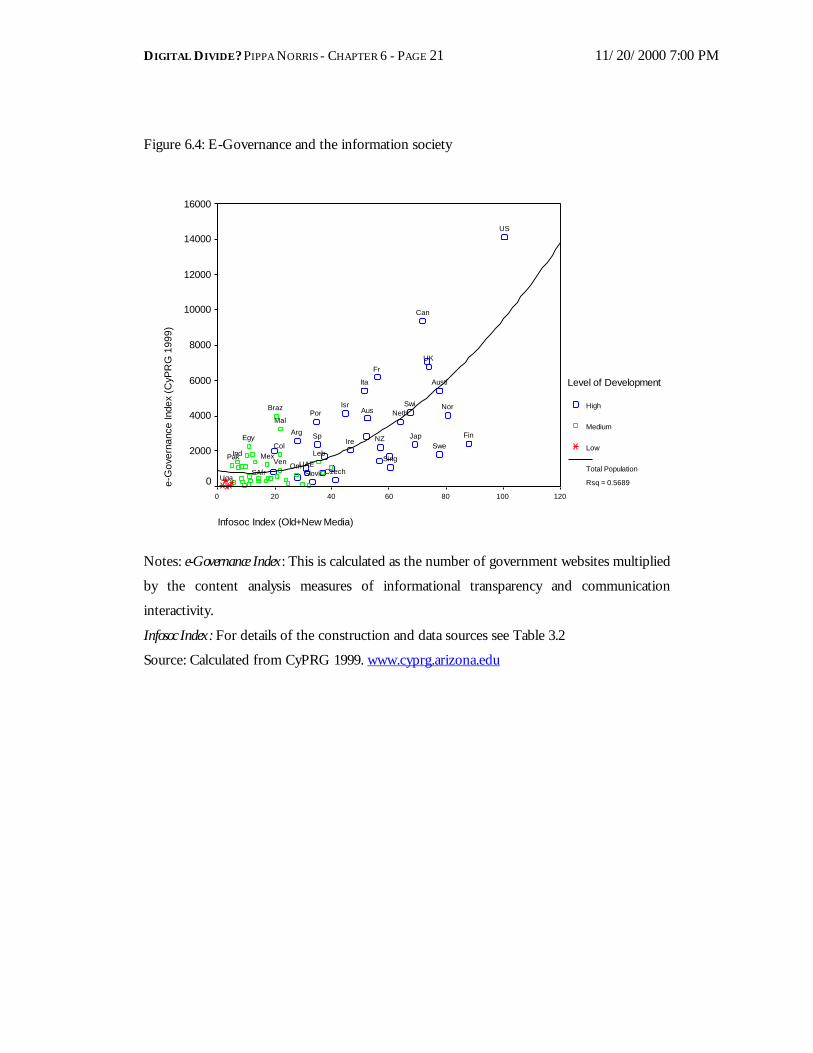
scatter plots of e-governance compared against Information Society index displays a closer,
although admittedly far from perfect, fit to the data. The relationship proved robust since
similar patterns were found if the number of government agencies online was compared,
rather than the composite index of e-governance.
[Table 6.3 about here]
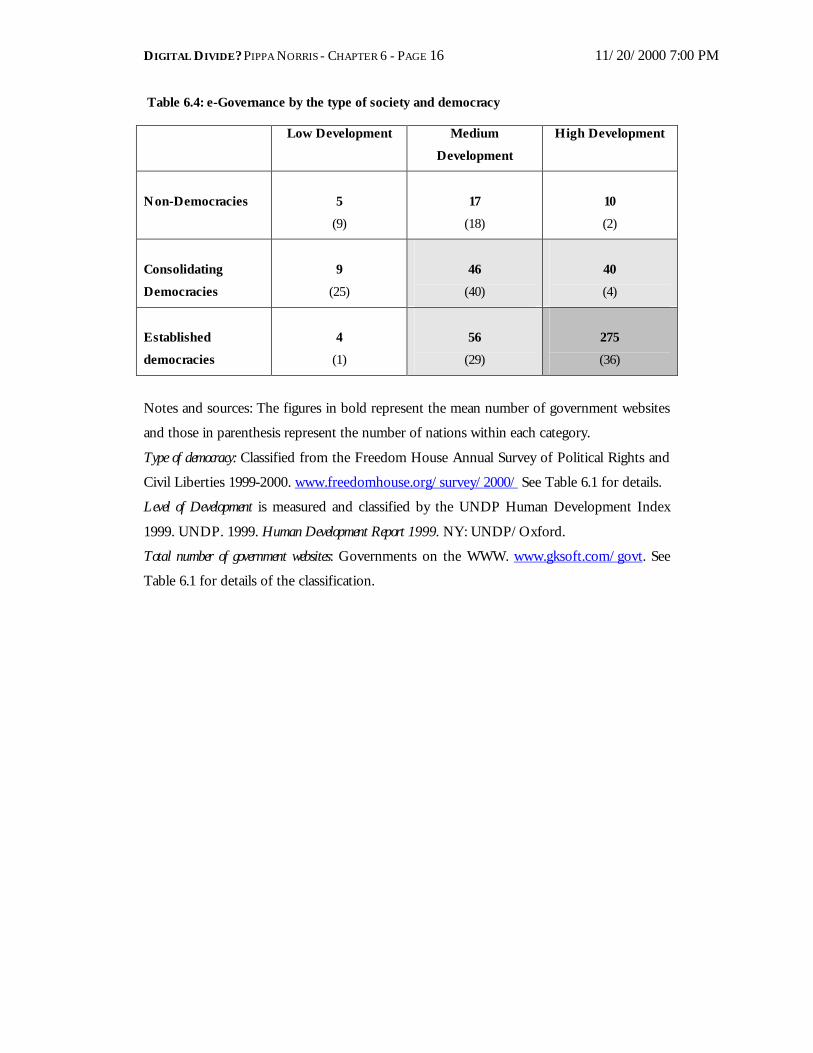
To check further, the overall pattern was also examined using a simple cross-
tabulation of the density of e-governance in rich and poor democracies (in Table 6.3). The
results show that government websites were by far the most common in the richest
established democracies. The poorest societies had few such webs and there was little
difference in this between countries ruled by despots or democrats. The comparison of all
these different indicators strongly suggests that the distribution and functions of e-
governance reflects levels of technological development first and foremost: this is the single
most consistent pattern to be found across all the data. Countries that have forged ahead
with the distribution of computers access and online use are also the foremost societies in e-
governance. The gradual diffusion of the Internet into people’s everyday lives is the bigger
ocean within which government organizations swim. Without wishing to suggest a strong
version of technological determinism, the analysis leads towards the conclusion that so far
the rise of the Information Society has had important consequences for the ability of citizens
DIGITAL DIVIDE? PIPPA NORRIS - CHAPTER 6 - PAGE 10 11/20/2000 7:00 PM
to communicate with government via the Internet, and therefore for how far digital
technologies promote the process of democratization, more than democracy has driven the
rise of e-governance.
Conclusions
The importance of transparency in government is widely acknowledged, both to
promote greater public confidence in the policymaking process and to maximize
accountability. The evidence demonstrates that more and more government departments
and public sector agencies are using the web to publish and distribute official information
and, to a lesser extent, to facilitate the delivery of online services. As noted earlier, the full
consequences of this process remain under development. At present, societies are
experiencing a transition process where governments work simultaneously with paper and
electronic formats, duplicating rather than replacing channels of information and
communication. Potentially the gains in administrative efficiency, effective service delivery,
transparency, and accountability could be substantial, although governments are still learning
by trial and error how best to employ digital technologies16.
What will be the consequences of these developments for representative
democracy? Any evaluative judgments relate to broader visions of democracy and the
appropriate functions of governments. Many accounts assume that the Internet can by itself
reinvent government, transforming old-fashioned bureaucracies into agencies of direct
democracy. Which, most authors conclude, it fails to do. It seems more appropriate and
realistic to start from the premise that governments are core institutions of representative
democracy, and to compare their online activity with their role in the non-virtual world. In
this regard, government websites should be evaluated in terms of the quality and
effectiveness of their informational and communication functions.
The criteria of transparent information is important to representative government
because citizens can only make effective electoral decisions if they can evaluate the record
and performance of the government, as well as the programs of the alternative parties and
candidates competing for office. People can thereby cast informed ballots that accurately
match their political preferences. Information can and does come from multiple sources,
more commonly the news media, as well as many unmediated channels of political
communications such as political advertisements and personal discussions. This comparison
shows that the most effective government websites provide detailed and comprehensive
policy-relevant information and the ability to research the most abstruse legislative
proposals, White Papers and official reports. The content analysis found that government
websites scored roughly twice as well on the criteria of the transparency over interactivity.
DIGITAL DIVIDE? PIPPA NORRIS - CHAPTER 6 - PAGE 11 11/20/2000 7:00 PM
For those who are interested, more timely unmediated information about the public
policymaking process is more easily available via the Internet than before. The ability to
research policy issues in real-time holds potentially strengthens organizations seeking to
challenge those in authority, such as non-profit advocates, journalists, policy think tanks,
challenger parties and opposition movements. Insofar as much of this information is often
not easily available elsewhere, and so long as the information can be compared across a
variety of alternative sources, this process can strengthen the intermediary institutions of
civic society in representative democracies, and therefore, in a two-step trickle-down
process, ordinary citizens as well. Departmental transparency in the timely and equitable
release of official records, policy proposals, and administrative decisions serves the public
interest. Ordinary citizens will rarely make direct use of most of these facilities, but the
potential for more efficient and targeted service delivery is illustrated by the popularity of
online electronic filing of routine forms, such for taxes or motor registration.
Yet representative democracy requires two-way communication as well as information,
at regular intervals beyond elections, so that political leaders receive feedback and maintain
contact with the grassroots. Many commentators who advocate ‘strong’ or ‘direct’
democracy commonly argue that these functions are not well served by e-governance, and
this criticism has some value if judged by government websites alone. The opportunities for
‘bottom up’ interactivity in communicating with official departments are far fewer than the
opportunities to read ‘top down’ information. It could be that at present communications
among between citizens and officials is more easily facilitated through more private
electronic communications, such as one-to-one or small group emails. Government websites
rarely facilitate unmoderated public feedback, for example few published public reactions to
policy proposals, or used discussion forums, list-servs and bulletin boards, although there
have been occasional experiments with interactive formats. In the UK, for example, the
Central Computing and Telecommunications Agency (CCTA) established a number of open
discussion groups to discuss issues ranging from open government to ethics, the family and
women. E-governance is open to criticism that agencies have been more willing to carry out
traditional functions via electronic means, rather than using digital technologies to reinvent
how they conduct business, to reconnect with citizens as customers, and to strengthen
public participation in government. But, given the multiple demands on the executive
branch, should forms of public interactivity be the primary function of official government
departments or of the broader public sphere? Public deliberation may well be more
effectively organized and run by the extensive network of non-governmental non-profit
organizations that host policy discussion groups, such as UK Citizens Online Democracy or

DIGITAL DIVIDE? PIPPA NORRIS - CHAPTER 6 - PAGE 12 11/20/2000 7:00 PM
the Minnesota Electronic Democracy Experiment, not to speak of the thousands of political
listservs and multiple chat rooms that exist in cyberspace. Later chapters consider the
potential impact of the new communication processes for civic society, including the major
intermediaries between citizens and the state, namely parties, interest groups, new social
movements, and the news media. Before considering these issues, the next chapter turns to
consider how far parliamentary institutions have adapted to the digital age.

DIGITAL DIVIDE? PIPPA NORRIS - CHAPTER 6 - PAGE 13 11/20/2000 7:00 PM
Table 6.1: The World of e-Governance, 2000
All government websites (i) National-level Government Websites
(ii) Total number Mean number per
nation Mean number per
nation All 14,484 82 27
North America 1,283 428 132
Western Europe 6,060 404 45
Scandinavia 1,156 231 41
Asia-Pacific 2,555 75 33
South America 1,378 46 17
Central and Eastern Europe 1,015 41 8
Middle East 446 32 22
Sub-Saharan Africa 599 12 11
High human development 10,073 240 45
Medium human development 3,788 43 16
Low Human development 272 8 3
Established democracies 11,771 163 39
Consolidating democracies 2,294 32 15
Non-Democracies 419 13 12
Notes and sources: Columns (i) in the table summarize the distribution of 14492 official
government websites for the national executive (ministries, departments, offices, agencies, institutes,
councils and committees), the legislative branch, state and local governments, political party websites
at national and regional level, the law courts, government representatives in foreign countries
including embassies and consulates, and other government related institutions found in 176 nations as
at June 2000, according to Governments on the WWW. www.gksoft.com/govt/.
Column (ii) in the table summarizes the distribution of 2941 national-level government agency
websites in 105 nations in 1999, according to Cyberspace Policy Research Group, 1999
www.cybrg.org.
Level of human development was derived from the UNDP Human Development Index 1999. UNDP
Human Development Report 1999. New York: Oxford University Press/UNDP.
Type of Democracy: The level of democracy for each country was classified according to Freedom House
7-point scale of political rights and civil liberties. Countries were then classified as established
democracies (1.0 to 2.5), consolidating democracies (3.0 to 4.5) and non-democracies (5.0 to 7.0).
Freedom House Survey of Political Rights and Civil Liberties 1999-2000. www.freedomhouse.org.

DIGITAL DIVIDE? PIPPA NORRIS - CHAPTER 6 - PAGE 14 11/20/2000 7:00 PM
Table 6.2: e-Governance by Policy Sector, 1999
Policy Sector Number of
departments online
Mean Transparency
Index
(Information)
Mean
Interactivity
Index
(Communications)
Science & Technology 236 42 25
Finance 200 43 24
Trade 193 40 21
Defense 172 36 17
Government Operations 141 37 19
Justice 139 36 20
Interior 138 37 18
Culture 135 37 23
Health 134 42 24
Environment 133 37 21
Industry 132 39 18
Education 121 39 21
Agriculture 118 41 23
Social Services 115 41 22
Telecommunications 112 40 22
Transportation 107 36 20
Miscellaneous 101 35 21
Executive 95 32 16
Foreign 94 41 22
Legislative 84 40 23
Regional/Local 77 39 26
Labor 77 39 22
Energy 66 43 22
Library 26 36 22
Immigration 19 41 22
State 11 36 20
Total 2976 39 21
Note: All indices have been standardized to 100-point scales for ease of interpretation. For the
methodology classifying the Transparency and Interactivity Indexes see www.cybrg.org.
Data Source: Cyberspace Policy Research Group, 1999 www.cybrg.org
Table 6.3: Explaining e-Governance
DIGITAL DIVIDE? PIPPA NORRIS - CHAPTER 6 - PAGE 15 11/20/2000 7:00 PM
Total number
of government
websites
Number of national-level government
websites
Information Transparency
Scale
Communication Interactivity Scale
e-Governance Index
Beta Sig. Beta Sig. Beta Sig. Beta Sig. Beta Sig. Human
Development
.154 .079 .071 .521 .206 .115 .187 .082 .088 .398
Technological
development
.381 .000 .502 .000 .154 .224 .376 .000 .535 .000
Political
development
.106 .203 .054 .598 -.002 .988 .167 .095 .094 .404
Constant -106 -2.16 24.1 -.17 -775
Adjusted R2 .288 .314 .076 .371 .404
N. of nations 179 108 106 105 105
Sources and Notes: The standardized beta coefficients represent the results of OLS regression
models predicting the distribution and function of government websites in June 2000.
Socioeconomic Development is measured by the UNDP Human Development Index 1999. UNDP. 1999.
Human Development Report 1999. NY: UNDP/Oxford.
% Online: Calculated from How Many Online? www.nua.ie (see Table 3.2 for details)
Level of democratization: Freedom House. Annual Survey of Political Rights and Civil Liberties 1999-
2000. www.freedomhouse.org/survey/2000/
All government websites: Governments on the WWW, June 2000. www.gksoft.com/govt. See Table 6.1
for details of the classification.
All national-level government websites: CyPRG 1999. Cyberspace Policy Research Group. www.cyprg.org
Government website transparency and interactivity scales: CyPRG 1999. Cyberspace Policy Research
Group. www.cyprg.org
e-Governance Index: Number of national-level government websites * (transparency + interactivity).
DIGITAL DIVIDE? PIPPA NORRIS - CHAPTER 6 - PAGE 16 11/20/2000 7:00 PM
Table 6.4: e-Governance by the type of society and democracy
Low Development Medium
Development
High Development
Non-Democracies
5
(9)
17
(18)
10
(2)
Consolidating
Democracies
9
(25)
46
(40)
40
(4)
Established
democracies
4
(1)
56
(29)
275
(36)
Notes and sources: The figures in bold represent the mean number of government websites
and those in parenthesis represent the number of nations within each category.
Type of democracy: Classified from the Freedom House Annual Survey of Political Rights and
Civil Liberties 1999-2000. www.freedomhouse.org/survey/2000/ See Table 6.1 for details.
Level of Development is measured and classified by the UNDP Human Development Index
1999. UNDP. 1999. Human Development Report 1999. NY: UNDP/Oxford.
Total number of government websites: Governments on the WWW. www.gksoft.com/govt. See
Table 6.1 for details of the classification.
DIGITAL DIVIDE? PIPPA NORRIS - CHAPTER 6 - PAGE 17 11/20/2000 7:00 PM
Figure 6.1: The world of e-Governance
N. Gov.Web Sites
1,110 to 1,560 (2)450 to 1,110 (6)230 to 450 (10)130 to 230 (12)
60 to 130 (18)20 to 60 (41)
0 to 20 (81)
Digital Governments
DIGITAL DIVIDE? PIPPA NORRIS - CHAPTER 6 - PAGE 18 11/20/2000 7:00 PM
Figure 6.2: One-stop e-Governance in the UK, Norway, Singapore and the United States
DIGITAL DIVIDE? PIPPA NORRIS - CHAPTER 6 - PAGE 19 11/20/2000 7:00 PM

DIGITAL DIVIDE? PIPPA NORRIS - CHAPTER 6 - PAGE 20 11/20/2000 7:00 PM
Figure 6.3: E-Governance and democratization
Level of Democratization (Freedom House 1999)
87654321
e-G
over
nanc
e in
dex
(CyP
RG
199
9)
20000
10000
5000400030002000
1000
500400300200
100
50403020
10
Level of Developmen
High
Medium
Low
Total Population
Rsq = 0.2550
Yem
Ven
Uzb
US
UAE
Ukr
Uga
Tun
Sur
Sing
Sene
Rus
Rom Pol
Phil
Peru
Para
Pak
Om
Nor
NZ
Nep
Mex
Mal
Mal
Mac
Lith
Leb
Kyr
Kuw
IsrIndia
Ice
Hon
Gre
Ger
Fr
Est
ElSal
Egy
Dom
Den
Cyp
Cro
Col
ChinaChil
Can
Bul
Bru
Braz
Bhu
Beli
Belg
Bela
Bah
Aze
Arg
Ang
Alb
Notes and sources:
e-Governance Index: This is calculated as the number of national-level government websites
multiplied by the content analysis measures of their informational transparency and
communication interactivity. Calculated from CyPRG 1999. www.cyprg.arizona.edu
Levels of Democratization: Reversed Freedom House 7-point scale of political rights and civil
liberties, 1999. www.freedomhouse.org
DIGITAL DIVIDE? PIPPA NORRIS - CHAPTER 6 - PAGE 21 11/20/2000 7:00 PM
Figure 6.4: E-Governance and the information society
Infosoc Index (Old+New Media)
120100806040200
e-G
over
nanc
e In
dex
(CyP
RG
199
9)
16000
14000
12000
10000
8000
6000
4000
2000
0
Level of Development
High
Medium
Low
Total Population
Rsq = 0.5689
Ven
US
UK
UAE
Uga
Swi
SweSp
SAfr Slovk
Sing
Por
PakOm
Nor
NZ
Neth
Mex
Mal
Leb
Jap
Ita
Isr
Ire
Ind
Fr
FinEgy
Czech
Col
Can
Braz Aus
Austl
Arg
Notes: e-Governance Index: This is calculated as the number of government websites multiplied
by the content analysis measures of informational transparency and communication
interactivity.
Infosoc Index: For details of the construction and data sources see Table 3.2
Source: Calculated from CyPRG 1999. www.cyprg.arizona.edu
DIGITAL DIVIDE? PIPPA NORRIS - CHAPTER 6 - PAGE 22 11/20/2000 7:00 PM
1 For a discussion, see Christine Bellamy and John A. Taylor. 1998. Governing in the
Information Age. Buckingham: Open University; G.N.L. Stowers. 1999. 'Becoming
Cyberactive: State and Local Governments on the World Wide Web.' Government Information
Quarterly. 16(2): 111-127; GOL. G-8 Government On-line Project. April 1999
www.open.gov.uk/govonline/isw2.doc; The US Office of Intergovermental Solutions.
http://Policyworks.gov/org/main/mg/intergov/home.htm; OECD Public Management
and Public Management Service. 1999. Impact of the Emerging Information Society on the Policy
Development Process and Democratic Quality. www.oecd.org/puma; Chris C. Demchak, Christian
Friis, Todd M. La Porte. 1998. ‘Configuring Public Agencies in Cyberspace: Openness and
Effectiveness.’ www.cyprg.arizona.edu/Tilburg98F.htm; Todd M. La Porte, Chris C.
Demchak, Martin de Jong and Christian Friis. 2000. ‘Democracy and Bureaucracy in the Age
of the Web: Empirical Findings and Theoretical Speculations.’ Paper presented at the
International Political Science Association World Congress, Quebec, August 2000; G.D. Garson.
2000. Handbook of Public Information Systems. New York: Marcel Dekker.
2 See Stavros Zouridis and Victor Bekkers. 2000. ‘Electronic Service Delivery and the
democratic relationships between government and its citizens.’ In Jens Hoff, Ivan Horrocks
and Pieter Tops. Eds. Democratic Governance and New Technology. London: Routledge; Rob
Atkinson. 2000. ‘Creating a Digital Federal Government.’ IMP: Information Impacts Magazine.
October. www.cisp.org/imp
3 See Elisabeth Richards. 1999. ‘Tools of Governance’ and Eileen Milner. 1999. ‘Electronic
Government: More than Just a Good Thing?’ In Digital Democracy: Discourse and Decision
Making in the Information Age. Ed. Barry N. Hague and Brian D. Loader. NY: Routledge;
Christopher Weare, J. Musso, M.L. Hale. 1999. ‘Electronic democracy and the diffusion of
municipal web pages in California.’ Administration & Society. 31(1): 3-27; Chris C. Demchak,
Christian Friis, Todd M. La Porte. 1998. ‘Configuring Public Agencies in Cyberspace:
Openness and Effectiveness.’ www.cyprg.arizona.edu/Tilburg98F.htm; Jerry Mechling.
1994. ‘A Customer service manifesto: using IT to improve government services.’ Government
Technology. 1:S27-33; Dan Jellinek. 2000. ‘E-Government – Reality or Hype?’ iMP: Information
Impacts Magazine. October. www.cisp.org/imp
4 Pippa Norris. 1999. Critical Citizens: Global Support for Democratic Governance. Oxford: Oxford
University Press; C. Thomas. 1998. ‘Maintaining and restoring public trust in government
agencies and their employees.’ Administration and Society. 30: 166-193.

DIGITAL DIVIDE? PIPPA NORRIS - CHAPTER 6 - PAGE 23 11/20/2000 7:00 PM
5 OECD Public Management and Public Management Service. 1999. Impact of the Emerging
Information Society on the Policy Development Process and Democratic Quality. www.oecd.org/puma
6 This criticism is pervasive throughout the literature. See, for example, Paul Nixon and
Hans Johansson. 1999. ‘Transparency through technology: the Internet and political parties.’
In Digital Democracy: Discourse and Decision Making in the Information Age. Ed. Barry N. Hague
and Brian D. Loader. NY: Routledge.
7 Michael Margolis and David Resnick. 2000. Politics as Usual: The Cyberspace ‘Revolution’.
Thousand Oaks, CA: Sage. 8 C. Richard Neu, Robert H. Anderson and Tora K. Bikson. 1999. Sending your Government a
Message. Rand. www.rand.org/publications/MR/MR1095. 9 See, for example, P.J. Jackson. 1999. Virtual Working: Social and Organizational Dynamics.
London: Routledge; J. Hagel and A.G.Armstrong. Eds. 1997. Net.Gain: Expanding Markets
through Virtual Communities. Cambridge, MA: Harvard Business School; T. McEachern and B.
O’Keefe. 1998. Re-Wiring Business: Uniting Management and the Web. Chichester: Wiley.
10 GOL. G-8 Government On-line Project. April 1999 www.open.gov.uk/govonline/isw2.doc;
The US Office of Intergovermental Solutions.
http://Policyworks.gov/org/main/mg/intergov/home.htm ; OECD Public Management
Service (PUMA). 1999. Impact of the Emerging Information Society on the Policy Development Process
and Democratic Quality. Paris: OECD. www.oecd.org/puma.
11 Governments on the WWW. www.gksoft.com/govt/
12 I am most grateful to the CyPRG group, particularly Todd M. La Porte (George Mason
University), Chris C. Demchak (University of Arizona), Martin de Jong (University of
Amsterday) and Christian Friis (University of Roskilde) for access to this database for
secondary analysis. Full details about the methodology and coding are available from
www.cyprg.arizona.edu. For more details of the results see Todd M La Porte, Chris C.
Demchak, Martin de Jong and Christian Friis. 2000. ‘Democracy and Bureaucracy in the Age
of the Web: Empirical Findings and Theoretical Speculations.’ Paper presented at the
International Political Science Association World Congress, Quebec, August 2000; Chris C.
Demchak, Christian Friis, Todd M. La Porte. 1998. ‘Configuring Public Agencies in
Cyberspace: Openness and Effectiveness.’ www.cyprg.arizona.edu/Tilburg98F.htm
13 UK Online www.Open.gov.uk
DIGITAL DIVIDE? PIPPA NORRIS - CHAPTER 6 - PAGE 24 11/20/2000 7:00 PM
14 I am most grateful to the CyPRG group, particularly Todd M. La Porte (George Mason
University), Chris C. Demchak (University of Arizona), Martin de Jong (University of
Amsterday) and Christian Friis (University of Roskilde) for access to this database for
secondary analysis. Full details about the methodology and coding are available from
www.cyprg.arizona.edu. For more details of the results see Todd M La Porte, Chris C.
Demchak, Martin de Jong and Christian Friis. 2000. ‘Democracy and Bureaucracy in the Age
of the Web: Empirical Findings and Theoretical Speculations.’ Paper presented at the
International Political Science Association World Congress, Quebec, August 2000; Chris C.
Demchak, Christian Friis, Todd M. La Porte. 1998. ‘Configuring Public Agencies in
Cyberspace: Openness and Effectiveness.’ www.cyprg.arizona.edu/Tilburg98F.htm
15 GOL. G-8 Government On-line Project. April 1999 www.open.gov.uk/govonline/isw2.doc;
The US Office of Intergovermental Solutions.
http://Policyworks.gov/org/main/mg/intergov/home.htm
16 See, for example, the UK National Audit Office. 1999. GovernmentsOntheWeb.
www.GovernmentsOntheWeb.org; Australian National Audit Office. 1999. Electronic Service
Delivery, including Internet Use, by Commonwealth Government Agencies. www.anao.gov.au