e ects of class size on achievement of college students · effects of class size on achievement of...
TRANSCRIPT

MPRAMunich Personal RePEc Archive
Effects of Class Size on Achievement ofCollege Students
Maria De Paola and Vincenzo Scoppa
Department of Economics and Statistics, University of Calabria(Italy)
25. August 2009
Online at http://mpra.ub.uni-muenchen.de/16945/MPRA Paper No. 16945, posted 26. August 2009 13:42 UTC
1
Effects of Class Size on
Achievement of College Students
Maria De Paola, Vincenzo Scoppa∗
Department of Economics and Statistics, University of Calabria
Abstract: In this paper we investigate the effects of class size on the achievements of a sample of college students enrolled at a middle-sized Italian public university. To estimate the effects of class size we exploit the exogenous variations in class size determined by a maximum class size rule introduced by the 2001 Italian university reform. From our analysis it emerges that large teaching classes produce negative effects on student performance measured both in terms of the grades obtained in exams and the probability of passing exams. These results are robust to the use of a matching estimator.
JEL Classification: C23; I21; J24. Keywords: Class size; student achievement; educational production function.
1. Introduction
The effects on student achievement of the resources devoted to education are a central concern
in the economic and political debate on educational policies. Starting with the controversial
Coleman Report (1966), a number of empirical studies have investigated the effects of class
size, teaching experience and ability, peer characteristics and school resources on the skills
acquired by students. In spite of the conspicuous amount of research, the results obtained are far
from conclusive.
The main findings of the Coleman Report showing that inputs into schooling have
negligible effects on student achievement were confirmed by Hanushek’s (1986) influential
survey of the economic research on the subject. Hanushek concludes that there does not appear
to be a strong, systematic relationship between school resources and student performance.
Class size is one of the main factors which has been analysed in the educational
production function. Whereas a number of studies point out that a reduction in class size has
positive effects on student performance, other analyses find that the effects are negligible and
not statistically significant.
∗ E-mail addresses: [email protected]; [email protected]. We would like to thank Alessandra Antonelli, Maurizio Franzini, Michela Ponzo, Valeria Pupo, seminar participants at the University of Calabria, the editor Martyn Andrews and three anonymous referees for useful suggestions. We are also grateful to the administration of the University of Calabria for providing access to the relevant data and to Monya Perricone for assisting in the use of the data. The usual disclaimer applies.

2
In traditional studies estimates of class size effects are often plagued by thorny
endogeneity problems which produce biased estimates. In assessing the effect of an intervention
such as a reduction in class size, the researchers are typically not able to observe all the other
factors entering into the student learning process, such as student effort and family support,
teaching quality etc. These inputs may be related both to the intervention itself and to student
performance. In fact, inputs into schooling are often the result of choices made by parents,
school administrators, teachers and students. For instance, some parents may choose schools
with smaller class size for their offspring and invest more of their personal time in their
children’s education (creating an upward bias in the estimated effect of class size); on the other
hand, some parents who have chosen schools with smaller classes may decide to invest less time
in their children’s education (creating a downward bias). Furthermore, a downward bias in
estimates would also emerge if school administrators tended to assign pupils from
disadvantaged backgrounds or with learning difficulties to smaller classes or if better teachers
were assigned to larger classes.
To handle this kind of econometric problem, recent works investigating class size
effects rely on identification strategies based on exogenous variations produced by controlled or
natural experiments (for a recent survey see Webbink, 2005). For example, Krueger (1999) and
Krueger and Whitmore (2001) exploit exogenous variations in class size by focusing on the
famous Tennessee Student/Teacher Achievement Ratio experiment (STAR project) which
randomly assigned students to classes of different size. Other works use instrumental variables
based on administrative rules which impose maximum class size limits, generating exogenous
variations in class size (Angrist and Lavy, 1999; Browning and Heinesen, 2007; Leuven,
Oosterbeek and Ronning, 2008). 1
Another important source of exogenous variation comes from natural experiments:
Hoxby (2000), for example, studies the effects of class size on student performance relying on
random population variations, while Case and Deaton (1998) base their analysis on the fact that
the apartheid regime in South Africa did not allow black people to move from one district to
another nor to influence school resources. Urquiola (2006) uses variations in population size
between schools in small community schools in Bolivia, where class size is mainly determined
by cohort size.
Some of these studies (Krueger, 1999; Krueger and Whitmore, 2001; Angrist and Lavy,
1999; Browning and Heinesen, 2007; Urquiola, 2006) find that smaller classes increase student
achievement, while others (Hoxby, 2000; Dobbelsteen, Levin, and Oosterbeek, 2002; Leuven,
Oosterbeek and Ronning, 2008) show that the effects of class size are not significantly different
from zero.
1 See also Boozer and Rouse (1995) who construct instruments considering the maximum special education class size as dictated by state law and Dobbelsteen, Levin and Oosterbeek (2002) who use an instrument based on rules in Dutch education.

3
Literature on the subject typically analyses the impact of class size on primary and
secondary education, while little work has been done regarding college students. However, class
size is also a relevant issue for post-secondary education. Due to the expansion of the higher
education systems over the last two decades and to the limited financial resources available to
universities, university courses are increasingly taught in large classes. This is particularly true
for the Italian tertiary educational system, where teaching classes often have a very high number
of students especially on introductory courses and Degree Courses with particularly highly
demand.
Even though the optimal class size is higher in tertiary education (Lazear, 2001), very
large classes may create negative externalities for students, due to noise or disruptive behaviour
(congestion effects), and students may benefit less from teacher explanations and have fewer
opportunities for interactive discussion or to ask for clarification. In addition, instructors facing
larger classes may be unable to identify the ability and interests of the average student. On the
other hand, students and instructors may compensate for larger classes by providing more effort,
for example students may spend more time in the library and instructors may prepare better
teaching material.
A recent study by Bandiera, Larcinese and Rasul (2008) investigates the effects
produced by these opposing forces by analysing class size effects on college student
performance. Using data from a leading UK university, they show a negative and significant
effect of class size for the smallest and largest ranges of class size, while the effect for
intermediate class sizes (from 33 to 104 students) is not significantly different from zero.
Similar results are found by Kokkelenberg, Dillon and Christy (2008) in analyzing
academic results obtained by students at a US public university. They show that class-size
negatively affects students’ grades, in particular when class-size becomes larger than twenty.
Furthermore, a work by Bedard and Kuhn (2008), investigating the effect of class size on
student evaluations of instructor effectiveness, shows a large negative impact, which is robust to
the inclusion of course and instructor fixed effects.
Our work contributes to this emerging literature by providing evidence of class size
effects among Italian college students. We use data on students enrolled in the academic years
from 2001/02 to 2005/06 on the First Level Degree in Law and Economics, at the University of
Calabria, a middle-sized Italian University located in the South of Italy.
In the sample under study, class size depends on the number of students enrolled each
year and on the necessity to teach courses in single classes or to split them into different
teaching classes. Both of these aspects are exogenously given, since, as we will explain in detail
in the next section, they depend on rules established by the 2001 reform of the Italian University
System which established the maximum number of students that can be enrolled (given the
number of permanent professors) and the maximum class size for each Degree Course. These

4
rules introduced exogenous variability in the class size of the courses we consider: for the
academic years when the number of enrolled students was lower than the maximum class size,
courses were taught in a single class, while for years in which the number of students exceeded
the class size limits, courses were split into different teaching classes.
In order to avoid problems that may confound the effect of class size with effects due to
teaching quality or grading policies, we only consider courses that were taught by the same
instructors over the years. In fact, this strategy prevents any problem deriving, for example,
from teachers being assigned to classes of different sizes according to their ability.
However, in our data set student characteristics are not well balanced across small and
large classes. This is due to the fact that the Law and Economics Degree Course accepted
students by ranking them on the basis of their High School Grade. As a consequence, in the
years when a relatively small number of students were enrolled and classes were not split, a
better group of students was admitted, while in years when the number of enrolled students was
higher, leading to split classes, students with lower observed abilities were also accepted. Since
the positive relationship between average student abilities and class size is due to a selection
policy based on an observable variable, the selection bias can be solved using regression and
matching techniques (Angrist, 1998).
Moreover, we are confident that student self-selection is a minor problem in our
analysis, since Italian students exhibit very low mobility. typically enrolling at a university
located near to their place of residence (see Brunello and Cappellari, 2007). In addition, the
number of applications received each year by the Degree course we are considering in this study
does not seem to depend on the expected class size (see Table 1 in Section 2).
We analyse the effects of class size on two different measures of student performance:
the grades obtained at each exam and the probability that the student will pass an exam during
the first year of his/her academic career.
In order to examine the effect of class size on grades, we estimate both a simple OLS
model and a Tobit model, which takes into account the fact that grades are left censored at the
passing line and right censored at the maximum grade (in Italy college students are evaluated at
exams on a scale from 18 to 30). Once we control for a number of individual characteristics and
for courses fixed effects, it clearly emerges from our estimates that larger classes produce a
negative effect on grades obtained by students (but the magnitude is small).
Subsequently, we use a probit model to examine the effect of class size on the
probability of passing exams. Results of our estimates show that students who have attended
courses in larger classes have a lower probability of passing an exam. The effect on the
probability of reaching the pass mark is considerable: an increase of 50 students in a class size
reduces the probability of passing an exam by about 9 percentage points.

5
The negative effect of class-size on student performance is robust to the use of a
matching estimator (Rosenbaum and Rubin, 1983; Abadie and Imbens, 2006) where we assume
that – conditional on the observable variables (in particular High School Grade and type of
school attended) – the assignment to the treatment is not related to potential outcomes
(“Selection on Observables”), that is, that after conditioning on students’ observed
characteristics, students in small and large classes are comparable. Our matching estimates show
that large classes have a negative and statistically significant effect on student performance,
even if the effect is smaller than that resulting from regression techniques.
The paper is organised in the following way. In the second section we provide some
additional information on the Degree Course in Law and Economics at the University of
Calabria and present some descriptive statistics on our sample of students. Section 3 discusses
OLS and Tobit estimates for the effects of class size on student grades. In section 4 probit
estimates of the students’ probability of passing exams in relation to class size are reported. In
section 5 we present matching estimates. Section 6 concludes.
2. Data and Institutional Framework
Our analysis is based on administrative data from the University of Calabria.2 We consider
students enrolled in the first year of the First Level Degree in Law and Economics (LE
hereafter), in the years from 2001/02 to 2005/06.
This Degree Course was introduced at the University of Calabria in 2001, following the
reform of the Italian University system, which, in 2001, reorganized the Italian University
system into two main levels: First Level Degrees (3 years legal duration) and Second Level
Degrees (2 more years), the so-called “3+2” system. The span of time in our dataset covers the
entire period when the LE Degree was offered at the University of Calabria since, in 2006/2007,
the LE degree was substituted by a new Degree in Law with a total duration of 5 years (“Laurea
in Giurisprudenza”).3
Students enrolled in the first year of the LE Degree are supposed to obtain a total of 60
credits; each exam allows the student to acquire 5 credits. A total of 30 credits have to be
acquired in Economics and quantitative subjects and 30 credits in Law subjects.4
2 The University of Calabria currently has about 33,000 students. This university is ranked first in the 2008 list of Italian public universities of similar size for the relative quality of its services, infrastructure, computerisation and financial support to students. See the ranking at: http://www.unige.it/notizie/strilli/documents/censis_classifiche2008.pdf. 3 In the academic year 2006/07, all the “3+2” Law degrees in Italy were substituted by a new unified Degree Course of 5 years. 4 Economic and Quantitative courses were: Principles of Economics 1 and 2; Mathematics; Statistics; Business 1 and 2. Law courses were: Private Law 1 and 2; Public Law 1 and 2 and Philosophy of Law 1 and 2.
6
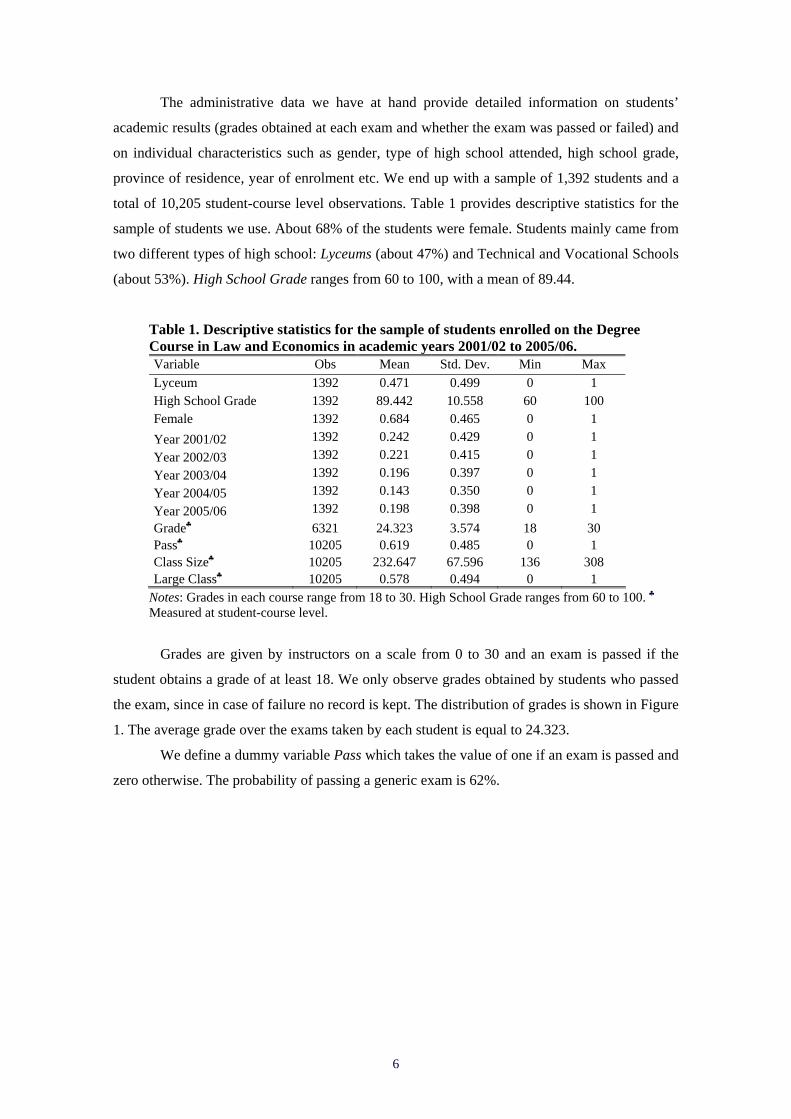
The administrative data we have at hand provide detailed information on students’
academic results (grades obtained at each exam and whether the exam was passed or failed) and
on individual characteristics such as gender, type of high school attended, high school grade,
province of residence, year of enrolment etc. We end up with a sample of 1,392 students and a
total of 10,205 student-course level observations. Table 1 provides descriptive statistics for the
sample of students we use. About 68% of the students were female. Students mainly came from
two different types of high school: Lyceums (about 47%) and Technical and Vocational Schools
(about 53%). High School Grade ranges from 60 to 100, with a mean of 89.44.
Table 1. Descriptive statistics for the sample of students enrolled on the Degree Course in Law and Economics in academic years 2001/02 to 2005/06. Variable Obs Mean Std. Dev. Min Max Lyceum 1392 0.471 0.499 0 1 High School Grade 1392 89.442 10.558 60 100 Female 1392 0.684 0.465 0 1 Year 2001/02 1392 0.242 0.429 0 1 Year 2002/03 1392 0.221 0.415 0 1 Year 2003/04 1392 0.196 0.397 0 1 Year 2004/05 1392 0.143 0.350 0 1 Year 2005/06 1392 0.198 0.398 0 1 Grade♣ 6321 24.323 3.574 18 30 Pass♣ 10205 0.619 0.485 0 1 Class Size♣ 10205 232.647 67.596 136 308 Large Class♣ 10205 0.578 0.494 0 1
Notes: Grades in each course range from 18 to 30. High School Grade ranges from 60 to 100. ♣ Measured at student-course level.
Grades are given by instructors on a scale from 0 to 30 and an exam is passed if the
student obtains a grade of at least 18. We only observe grades obtained by students who passed
the exam, since in case of failure no record is kept. The distribution of grades is shown in Figure
1. The average grade over the exams taken by each student is equal to 24.323.
We define a dummy variable Pass which takes the value of one if an exam is passed and
zero otherwise. The probability of passing a generic exam is 62%.

7
0.1
.2.3
.4D
ensi
ty
15 20 25 30Grade
Figure 1. The distribution of grades obtained at exams.
In the attempt to guarantee educational quality, the 2001 University reform established
some standards in terms of the maximum number of students that can be enrolled on each
Degree Course (given the number of tenured professors) and a maximum number of students for
teaching classes (which varies according to the subject). More specifically, these rules establish
that Law courses can not be taught in classes above a maximum of 300 students, while courses
in Economics, Business, Statistics and Mathematics have a maximum class size of 230 students.
As a consequence, the effective class size on the courses offered was defined by the number of
students enrolling each year and by the rule establishing the maximum number of students for
teaching class.
As shown in Table 2, the number of applications received from those wishing to enrol
on the LE Degree Course was always well above the number of places offered. The number of
students enrolled on the LE Degree Course in the years we consider ranges from 199 to 337,
with an average number of students enrolled of 278.5
Table 2. Number of enrolled students, class size and average student ability Academic
Year Applications Enrolled Students Average Student
Ability Class Size
Economics Courses Class Size
Law Courses 2001/02 469 337 81.83 168; 169 168; 169 2002/03 586 308 86.56 308 308 2003/04 735 273 93.82 136; 137 273 2004/05 687 199 97.10 199 199 2005/06 595 275 92.05 137; 138 275
Variations in the number of students enrolled each year were due to changes over time
in the number of tenured professors involved with the First Level Degree. For example, the
reduction in the number of enrolled students observed in the academic year 2004/05 was due to
the fact that a Second Level Degree in LE was offered from that year and some tenured
5 These numbers are slightly lower compared to the places offered since a small number of students who were accepted decided not to enrol.

8
professors initially involved in the First Level Degree became engaged in the Second Level
Degree.6 Students enrolment rose again in 2005/06 thanks to the recruitment of new professors.
Given the number of enrolled students, the rule establishing a maximum class size of
300 and 230 students respectively for Law and Economics-Quantitative courses was always
respected with the exception of the academic year 2002/03: in this year, due to financial
constraints the Board of the Degree Course in LE obtained authorisation to organise all the first
year courses into single teaching classes from the University Minister.
On the basis of enrolment and the maximum class size rule, class sizes for Economics
and Quantitative courses range from 136 to 308, with an average class size of 189 students. On
the other hand, the average class size for Law courses was 272 students, with a minimum of 168
students and a maximum of 308 students. Variations in class size were jointly determined by the
restrictions on enrolment – which reflected the recruitment of professors – and by the fact that
the reform imposed a maximum class-size rule. For example, in the year 2004/2005 class size
was 199 because of the low number of professors available for this Degree Course and because
the maximum class size limits were not reached. Moreover, the difference between class size in
2001/2002 (168) and class size in 2005/2006 (137) was not due to the splitting rule (which was
applied in both years), but to a different number of students enrolled.
Our measures of class size do not refer to the effective student attendance, but to the
number of students who were supposed to attend first year courses (“official” class-size).7 As
argued by Bandiera, Larcinese and Rasul (2008) focusing on this kind of measure is particularly
relevant for policy implications, since the official class size can be modified by universities,
while interventions aimed at regulating the physical attendance of students may be much more
complex.
In our analyses we measure class size both as the number of potential students attending
each class (Class Size) and also – following Krueger (1999) – by defining a dummy Large Class
which we set equal to 1 for classes with 199 or more students and zero otherwise. The number
of students attending courses in Large Class is on average 286 while those in small classes are
160.
The LE Degree Course ranked applicant students according to their High School Grade
and, starting with the students with the highest grades, accepted them until all available places
are assigned. As a consequence of the admission policy followed, the average ability of students
in each year (as measured by their High School Grade) was inversely related to the number of
students enrolled. Since classes were typically split when enrolment is high, we should observe
a positive relationship between class size and average student quality.
6 When the reform was introduced, many Italian universities decided to devote their resources to offer First Level Degrees and only later did they also begin to offer Second Level Degrees. This was because only students who had acquired a First Level Degree could enrol at a Second Level Degree. 7 Data on attendance are not available in our dataset. However, according to some surveys on teaching effectiveness conducted by some instructors, 80-85% of students attend classes.

9
In order to analyse the relationship between class size and student characteristics better,
we regress Class Size on the High School Grade and on the dummies Lyceum and Female.
Table 3. Endogeneity checks Class Size Class Size Large Class Large Class (1) (2) (3) (4) High School Grade 0.18026 1.02869*** 0.01122*** 0.01892*** (0.11318) (0.08949) (0.00088) (0.00088) Lyceum 3.08762 0.53087 -0.00861 -0.02352 (2.46284) (2.23148) (0.01797) (0.01973) Female 4.52696 0.79126 0.03072 0.02039 2.77270 (2.49509) (0.02051) (0.02235) Constant 205.95885*** 105.90313*** -0.43337*** -1.22311*** (10.38691) (7.51471) (0.07703) (0.07428) Observations 2784 2168 2784 2168 Sample Full Year 2002-03
excluded Full Year 2002-03
excluded R-squared 0.00141 0.04271 0.06753 0.16370 Note: In these regressions for each student we consider two observations: one for the Economics courses and one for Law courses.
In columns (1) and (2) of Table 3 we use Class Size as dependent variable whereas we
use the dummy Large Class in columns (3) and (4). In columns (2) and (4) we exclude
observations for the year 2002-03 when classes were exceptionally not split up resulting in a
large class size and a relatively low average student ability.
Our estimation results show that the High School Grade is strongly positively correlated
with Class Size.8 Therefore, a lower average ability of students is found in small classes. On the
other hand, we do not observe any statistical significant association between class size and the
type of school attended by students, which represents an additional measure of student ability
(although not used in the admission policy). Moreover, gender composition is not associated
with class size.
Notwithstanding the fact that class-size was not randomly distributed between students
of different ability due to the admission policy followed by the LE Degree Course, the selection
of students was made solely on the basis of an observable variable for which we can control. In
fact, we control both for individual student ability and for the average ability of students in each
class.
As argued by Angrist (1998), the potential selection bias induced by the screening
carried out through the admission policy can be solved using regression techniques or by
matching on the covariates used in the screening process. Therefore, we estimate the effect of
class-size by using both OLS, controlling for the observable variable High School Grade on the
basis of which selection is made, and using a matching estimator.
8 The correlation between class size and the High School Grade is positive but marginally insignificant in column (1), where we consider the full sample of students: this is due to the effect produced by the year 2002-03.

10
As regards other confounding factors that may bias the estimated effect, we have no
reason to think, given the rules followed by the University in assigning financial resources to
different Degree Courses, that the availability of other educational resources is correlated with
class-size. Financial resources are distributed to each Degree Course on the basis of the number
of students enrolled: therefore, when the number of students enrolled is large, a proportional
larger amount of resources is assigned, implying an approximately constant amount of resources
per student.9 However, as said before, Degree Courses are not free to change the number of
enrolled students, since this number is strictly related to the number of tenured professors
(which also changes slowly in relation to decisions taken at central level by the Minister of
Education).
In order to avoid problems that may confound the effects of class size with effects due
to teaching quality or grading policies, for example because instructors might be assigned to
classes of different size according to their ability or according to their grading policy, we only
deal with student performance in those courses for which the instructors did not change for at
least two academic years. A total of 11 courses with these characteristics are considered. For
some subjects (e.g., Principles of Economics 1 and 2) we cover every year from 2001/02 to
2005/06, since instructors did not change over time, while for some other courses we only
consider two adjacent years.
In this way we observe the same faculty member teaching the same course to classes of
different sizes and we are able to control for instructor (course) fixed effects that should capture
unobserved time invariant characteristics of the teaching staff. In addition, since most of the
examinations are based on multiple choice tests or on computer-marked tests, time variant
factors, due for example to the fact that faculty members may change their evaluation criteria
according to the class size they face, are not a major concern in our analysis.
We consider the grades obtained at each exam and student probability of passing a
given exam during the first year as measures of student performance. Using course fixed effects,
we identify the effects of class size thanks to the variations in the performance of students
attending the same course (with the same instructor) in teaching classes of different sizes.
3. Class Size and Student Grades In this section we estimate the following simple model of student grades:
(1) ijtjtjtiijt DESizeClassXY εψγφβα +++++= _
where ijtY is the grade obtained by student i at the exam j in year t, iX is a vector of the
individual characteristics of i (measures of his/her ability and personal characteristics),
jtSizeClass _ is the class size of course j in year t, tE is a vector of variables capturing year-
9 The availability of classrooms has never been a problem since the University of Calabria is a new structure and plenty of spaces are available.

11
specific effects, jD are dummies for courses, to control for course fixed effects and ijtε is an
error term.
In order to take into account the fact that the performance of students in the same class
may be affected by common shocks, we assume that the error term is given by ijtjtijt u+= µε ,
where jtµ is a class-specific random component, and we cluster by course-academic year in
calculating the standard errors.
The model expressed by equation (1) represents an educational production function
relating student performance to pre-determined characteristics and educational inputs
(Hanushek, 1986; Hanushek, 1999). A great deal of literature has used a similar specification in
order to study how teachers’ characteristics (education, experience, salary etc.), school
expenditure, class-sizes, peer effects, family background and so on affect student performance.
For the sake of simplicity, we assume a linear relationship between inputs and output. Since we
control for grades obtained at High School, the function is a sort of value-added function,
showing how students skills are affected in relation to class-size by controlling for previous
achievement.
We estimate this model by using both OLS (neglecting that Grade is a censored
variable) and Tobit.
OLS estimates
Table 4 shows the estimated class size coefficients from OLS regressions based on equation (1).
All estimates include course fixed effects (11 categories) and dummies for terms when the
courses were taught (4).
We control for terms because student performance may be different on courses held
during the first term, for which there were 5 exam sessions available (starting from November to
September), and courses held, for example, in the fourth term for which only 2 exam sessions
were available. This is particularly relevant not only for the probability of passing an exam,
since we only consider exams taken within the first year, but also for grades obtained at exams
since in the Italian University system students can decide to turn down the grade awarded and
sit the exam again in a subsequent session.

12
Table 4. OLS estimates of the effect of class size on academic achievement. Dependent variable: Student grades in first year exams. (1)
(2) (3) (4) (5)
Class Size -0.00507** -0.00376* -0.00507** -0.01125*** (0.00219) (0.00215) (0.00219) (0.00175) Large Class -0.69335** (0.30122) Lyceum 0.70786*** 0.70832*** 0.70786*** 0.54125*** 0.70786*** (0.10886) (0.10793) (0.10886) (0.11520) (0.10886) High School Grade 0.10610*** 0.10642*** 0.10610*** 0.09951*** 0.10610*** (0.00619) (0.00612) (0.00619) (0.00771) (0.00619) Lyceum*HS Grade (mean centred)
0.03266*** 0.03275*** 0.03266*** 0.02847*** 0.03266***
(0.00803) (0.00803) (0.00803) (0.00863) (0.00803) Female 0.27751** 0.27824** 0.27751** 0.52212*** 0.27754** (0.11719) (0.11740) (0.11719) (0.10062) (0.11719) Enrolment 0.00655 (0.00498) Year-specific Average ability
0.09122**
(0.04124) Constant 14.72650*** 13.35152*** 5.05552 17.12537*** 13.18118*** (0.79421) (0.62331) (4.57216) (0.77300) (0.55364) Observations 6321 6321 6321 4323 6321 Sample Full Full Full Year 2002-03
excluded Full
R-squared 0.26206 0.26015 0.26206 0.25535 0.26205 Notes: In all the regressions we include course fixed effects and dummies for terms (not reported). Robust standard errors – clustered by course-academic year – are reported in parentheses. The symbols ***, **, * indicate that coefficients are statistically significant, respectively, at the 1, 5, and 10 percent level.
In columns (1) and (2), results for our basic specifications are reported. In the first, we
control for terms when courses were taught and the second is estimated without these controls.
In both specifications, it emerges that the effect of class size on student grades is negative and
significant. Point estimates range from 0.005 to 0.004, significant at the 5 per cent level,
implying that an increase of 50 students in class size determines a reduction in grades obtained
at examinations ranging from 0.25 to 0.20.
In order to avoid possible biases in the estimated effect, deriving from correlation of
class size with the average quality of students enrolled or with their total number, we control in
column (3) for these two variables. As it is possible to see in column (3), the total number of
students enrolled (Enrolment) in each year does not seem to produce any statistically significant
effect on student performance, while cohorts of higher quality (measured considering the High
School Grade) produce a positive effect (statistically significant at the 5% level).
Notwithstanding these additional controls, the class size effect is still negative and highly
significant.
In column (4), we exclude from our sample those students who enrolled in the academic
year 2002/03, when the rule for the maximum class size was not respected. In this case, we find
a larger effect of class size: an increase in class size of 50 students led to a reduction in grades

13
of 0.55. A possible explanation for this larger effect might be that that the negative effect of
class-size is stronger until class size reaches certain levels, becoming less intense subsequently.
Non-linear effects are also found by Bandiera, Larcinese and Rasul (2008) and by
Kokkelenberg, Dillon and Christy (2008).10
In column (5) instead of using the number of students as the measure of class size, we
consider the dummy Large Class (as in Krueger 1999), in which we group together classes with
199 or more students. We find that attending courses in large classes reduces grades by about
0.70. This effect, which is larger than previous estimates, is due to the fact that the increase in
the number of students in passing from a small to a large class is 126 on average. Results remain
substantially unchanged when we control for Enrolment and cohort quality (not reported).
As far as the other explanatory variables are concerned, it emerges that students with a
higher High School Grade obtained much better grades. In addition, students who had attended
a Lyceum perform much better than students who come from Vocational or Professional High
School. The dummy Female is positive and statistically significant. We have also included
among our regressors an interaction term between High School Grade and Lyceum which turns
out to be positive and highly significant, implying that the high school grade increases academic
performance significantly more for Lyceum students.
These results can be interpreted either as a consequence of student ability or in relation
to family background. In fact, in Italy, after compulsory education, students can choose between
a “generalist track” (Lyceum), or a more labour market orientated track (vocational track). Since
Lyceums provide more academic skills, students from this type of school may be endowed with
abilities that are particularly useful for post-secondary education. This may explain the positive
coefficient shown by the interaction term between High School Grade and Lyceum. On the other
hand, as has been documented by many works (see Checchi, 2006), students with “better”
family backgrounds enrol in Lyceums, while students with “worse” family backgrounds
typically choose vocational schools. Therefore, the positive coefficient on Lyceum may be
related to the well known effect of family background on student performance.11
Tobit estimates
In this sub-section we take into account the fact that student Grade is left and right censored. In
fact, for students who failed to pass an exam the grade is not recorded and, furthermore, grades
cannot be higher than 30. Therefore, we proceed by estimating a Tobit model, indicating 17 as
the lower limit for left censoring and 30 as the upper limit for right censoring.
10 Unfortunately, our data dos not allow us to investigate this aspect further. 11 We have also experimented by including provinces of residence among our controls but results are very similar (not reported).

14
Table 5 reports Tobit estimates using the same specifications as in Table 4. With all the
specifications it emerges that class size has a negative and statistically significant impact on
student achievement. These estimates are much larger than the OLS estimate, as they include
the pass probability, for which the effect of class-size is larger (see below Table 6).12
On the basis of the Tobit estimation, we can determine the marginal effect of class size
on the probability that a student will pass an exam (that is the effect on the probability that grade
is greater than 17): this effect is equal to -0.00143, which implies that increasing class size by
50 additional students reduces the probability of passing an exam by 7.2 percentage points. This
effect is similar to that emerging from probit estimates (8.7 percentage points, see Table 6).
Moreover, given that a student has passed the exam (i.e., he/she is not censored) we can
calculate the marginal effect of class size on the expected grade: a class with 50 additional
students lowers the expected grade of each student by 0.57.
Table 5. Tobit estimates of the effect of class size on academic achievement. Dependent variable: Student grades in first year exams. (1) (2) (3) (4) (5) Class Size -0.02394*** -0.01794*** -0.02394*** -0.02166*** (0.00820) (0.00599) (0.00820) (0.00507) Large Class -3.28510*** (1.12699) Lyceum 1.49843*** 1.49947*** 1.49843*** 1.27685*** 1.49844*** (0.21219) (0.21210) (0.21219) (0.18809) (0.21219) High School Grade 0.22758*** 0.22783*** 0.22758*** 0.21800*** 0.22758*** (0.01590) (0.01590) (0.01590) (0.01890) (0.01591) Lyceum*HS Grade(mean centered)
0.06447*** 0.06428*** 0.06447*** 0.05681*** 0.06447***
(0.01461) (0.01452) (0.01461) (0.01737) (0.01461) Female 0.32798 0.32881 0.32798 0.84391*** 0.32801 (0.20336) (0.20365) (0.20336) (0.19470) (0.20336) Enrolment 0.01231 (0.01131) Year-specific Average ability 0.09967 (0.12000) Constant 6.28715** 4.50395*** -6.01732 8.93655*** -1.02053 (2.72143) (1.58186) (11.92731) (2.43654) (1.57808) Observations 10205 10205 10205 6817 10205 Pseudo R-squared 0.07688 0.07632 0.07688 0.06864 0.07688 Sample Full Full Full Year 2002-
03 excluded Full
Log-likelihood -21780.326 -21793.647 -21780.326 -14891.866 -21780.389 Left cens. obs: 3884 3884 3884 2494 3884 Uncensored obs: 5724 5724 5724 3927 5724 Right cens. obs: 597 597 597 396 597 Notes: In all the regressions we include course fixed effects and dummies for terms (not reported). Robust standard errors – clustered by course-academic year – are reported in parentheses. The symbols ***, **, * indicate that coefficients are statistically significant, respectively, at the 1, 5, and 10 percent level.
12 We have also estimated the Tobit model with left censoring only. Results (not reported) are very similar.

15
4. Class Size Effects on the Probability of Passing the Exams
The Italian University system is afflicted by the excessive duration of student academic careers. A
large proportion of students fail to accomplish their Degree Course within its legal duration. In our
sample of students, about 38% of the exams that students were supposed to complete within their
first year were not passed.
In this Section we examine the impact of class size on students’ probability of passing
exams. Our dependent variable ijtPass takes the value of one if student i passes the exam j in year t,
and 0 otherwise. We estimate by Maximum Likelihood the following probit model:
(2) )_()|1( jtjtiijt DESizeClassXXPassP ψγφβα ++++Φ==
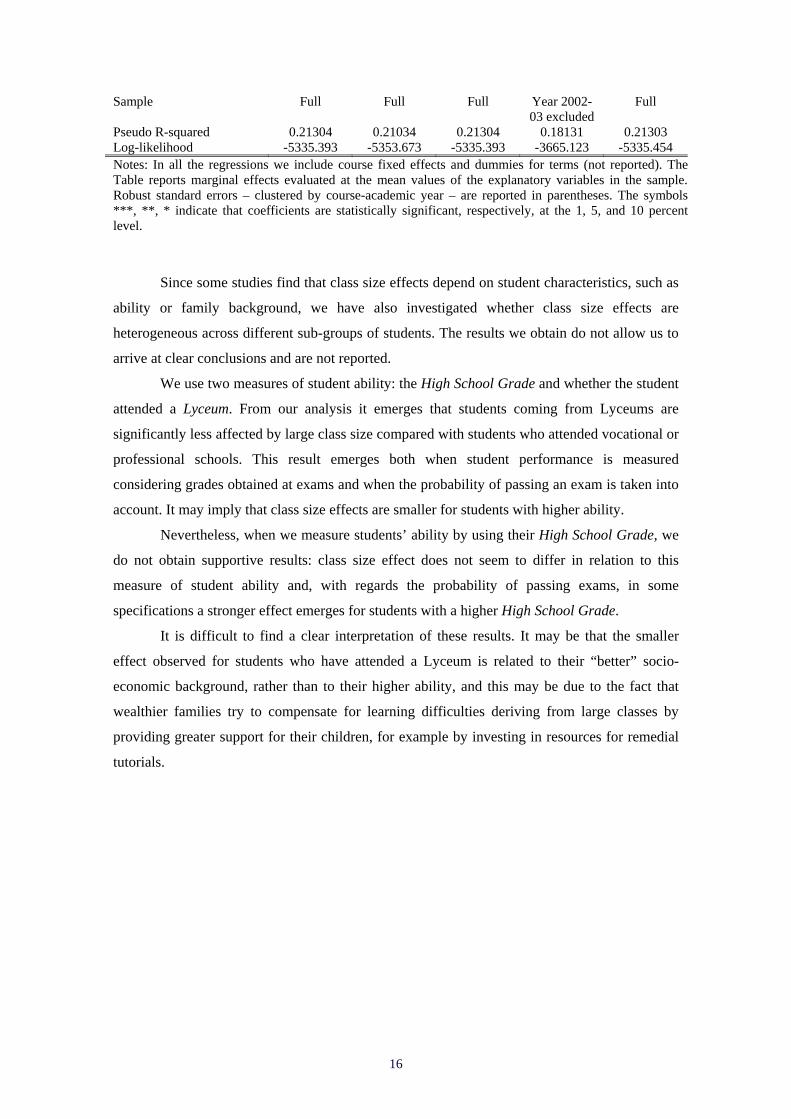
In Table 6, estimates are reported for different specifications of our model (marginal effects
evaluated at the mean values of the explanatory variables). Similarly to Table 5, in column (1)
we present the baseline specification, in column (2) we do not control for terms, in column (3)
we control for Enrolment and the Year-Specific Average Ability, in column (4) we exclude data
regarding the academic year 2002/03 and in column (5) we consider the dummy variable Large
Class instead of Class Size. All in all, it emerges from probit estimates that an increase in class
size produces a statistically significant negative effect (at the 1 percent level) on the probability
of passing first year exams.
The effect is quite considerable: an increase of 50 students in class size reduces the
student’s probability of passing an exam by about 8.7 percentage points. The other explanatory
variables show the usual effects.
Table 6. Probit estimates of the effect of class size on academic achievement. Dependent variable: Probability of passing an exam (1) (2) (3) (4) (5) Class Size -0.00171** -0.00134*** -0.00171** -0.00088** (0.00068) (0.00050) (0.00068) (0.00038) Large Class -0.22666*** (0.08684) Lyceum 0.07422*** 0.07390*** 0.07422*** 0.06674*** 0.07422*** (0.01200) (0.01190) (0.01200) (0.01220) (0.01200) High School Grade 0.01367*** 0.01363*** 0.01367*** 0.01307*** 0.01367*** (0.00073) (0.00073) (0.00073) (0.00096) (0.00073) Lyceum*HS Grade(mean centered)
0.00260*** 0.00257*** 0.00260*** 0.00248** 0.00260***
(0.00091) (0.00089) (0.00091) (0.00105) (0.00091) Female 0.01711 0.01707 0.01711 0.04459** 0.01711 (0.01575) (0.01571) (0.01575) (0.01820) (0.01575) Enrolment 0.00052 (0.00112) Year-specific Average ability
-0.00003
(0.00960) Observations 10205 10205 10205 6817 10205
16
Sample Full Full Full Year 2002-03 excluded
Full
Pseudo R-squared 0.21304 0.21034 0.21304 0.18131 0.21303 Log-likelihood -5335.393 -5353.673 -5335.393 -3665.123 -5335.454 Notes: In all the regressions we include course fixed effects and dummies for terms (not reported). The Table reports marginal effects evaluated at the mean values of the explanatory variables in the sample. Robust standard errors – clustered by course-academic year – are reported in parentheses. The symbols ***, **, * indicate that coefficients are statistically significant, respectively, at the 1, 5, and 10 percent level.
Since some studies find that class size effects depend on student characteristics, such as
ability or family background, we have also investigated whether class size effects are
heterogeneous across different sub-groups of students. The results we obtain do not allow us to
arrive at clear conclusions and are not reported.
We use two measures of student ability: the High School Grade and whether the student
attended a Lyceum. From our analysis it emerges that students coming from Lyceums are
significantly less affected by large class size compared with students who attended vocational or
professional schools. This result emerges both when student performance is measured
considering grades obtained at exams and when the probability of passing an exam is taken into
account. It may imply that class size effects are smaller for students with higher ability.
Nevertheless, when we measure students’ ability by using their High School Grade, we
do not obtain supportive results: class size effect does not seem to differ in relation to this
measure of student ability and, with regards the probability of passing exams, in some
specifications a stronger effect emerges for students with a higher High School Grade.
It is difficult to find a clear interpretation of these results. It may be that the smaller
effect observed for students who have attended a Lyceum is related to their “better” socio-
economic background, rather than to their higher ability, and this may be due to the fact that
wealthier families try to compensate for learning difficulties deriving from large classes by
providing greater support for their children, for example by investing in resources for remedial
tutorials.
17
5. Robustness Checks: Matching Estimates of Class Size Effects
As discussed in Section 2, our sample of students attending courses in small classes is
characterised by a lower average ability (as measured by their High School Grade). In this
section, to take into account the bias that may derive from systematic selection, we undertake an
additional estimation strategy, using a matching estimator to estimate the average treatment
effect of attending a given course in a large class on the grades obtained by students at an exam
and on their probability of passing the exam.
Since it is not possible to observe student outcomes on a given course both when the
course is taught in a small class and when it is taught in a large class, matching estimators
compute the differences in the academic achievements of “treated” students (attending courses
in large classes) and “control” students (in small classes) that have the same covariate values
and, then, average these differences by determining the Average Treatment Effect (ATE).
Matching estimators identify and consistently estimate the treatment effect of interest
under the assumption that – conditional on the observable variables – the assignment to the
treatment is not related to potential outcomes (“Conditional Independence Assumption” or
“Selection on Observables”) (see Rubin, 1977). While these assumptions are inconsistent in
many evaluation exercises, since individuals select into the programme on the basis of
unobservable (to the researcher) components of outcomes, in our case, the selection of students
in smaller or larger classes is based on their High School Grade, which we can observe. In other
words, after conditioning on students’ observed characteristics, students in small and large
classes are comparable. One of the main advantages of using a matching estimator is that it is
not necessary to specify the functional form of the outcome equation and, therefore, it does not
hinge on the linearity assumption of regression methods.
We use the specific matching estimator developed in Abadie and Imbens (2006) and
implemented in Abadie et al. (2004) to estimate the Average Treatment Effect on Grade and on
Pass of the binary treatment Large Class.13 We use High School Grade, Lyceum, Female and
Dummies as matching variables for each course. The procedure imputes the potential outcome
not realised for each student by using average outcomes for students in the control group with
similar values of the covariates. The method allows individuals to be used as a match more than
once, so one has to decide on how many non-treated individuals to match to a single treated
individual. Increasing the number of matches lowers the bias but increases the variance. We
experiment by using both a single match and four matches. Since as shown by Abadie and
Imbens (2006), the simple matching estimator will be biased in finite samples when the
matching is not exact, we estimate the ATE with bias-adjustment. In addition, we estimate the
standard errors allowing for heteroskedasticity.
13 We also estimate the Treatment Effect for the Treated (ATT) and the Treatment Effect for the Controls (ATC). We find that these effects are similar to ATE.

18
The average treatment effect of a large class on student probability of passing an exam
and on grades obtained at exams are shown in Table 7. The effect on the probability of passing
an exam is negative and statistically significant, but lower compared to the effect estimated
using probit (see column 5 of Table 6). We also find a positive and statistically significant effect
on the grade obtained at exams when we assign a grade of 17 to students who did not achieve
the minimum pass mark. The effect is positive but not statistically significant (not reported)
when we restrict our analysis to grades obtained by students who passed the exam.
Table 7. Matching estimates of the Average Treatment Effect (ATE) of Large Class on academic achievement. Probability of passing the exam Grades Number of matches (m)= 1 –0.10234***
(0.00971) –0.64073***
0.08821 Number of matches (m)= 4 –0.10098***
(0.00912) –0.62341***
(0.08817) Observations 10205 10205 Notes: Dependent variables: column (1): Probability of passing the exams; column (2): Grades obtained at exams. The Table reports the average treatment effect (ATE) of Large Class. Matching variables: High School Grade, Lyceum, Female, Dummies for each course. Robust standard errors are reported in parentheses. The symbol *** indicate that coefficients are statistically significant at the 1 percent level. 6. Concluding Remarks Class size effects have been analysed focusing mainly on primary and secondary education,
whereas few studies have dealt with class size effects at post-secondary education level.
However, understanding the effects of large classes on student achievement is becoming
increasingly important for the organisation of the University system. The large growth in
student enrolment recorded over the last few decades and limited financial resources have
induced many Universities to offer courses which are organised into very large teaching classes
with unknown effects on students’ learning processes.
This paper adds to the emerging literature investigating the effects of educational inputs
on the achievement of college students. Using administrative data on students enrolled at the
University of Calabria, we analyse the effects of class size on student performance measured
both in terms of the probability of passing exams and the grades obtained.
Our identification strategy exploits arguably exogenous variations in class size deriving
from the enforcement of rules imposed by the 2001 reform of the Italian University System. In
particular, the Law imposes a maximum number of students who can be enrolled for each
Degree Course, given the number of permanent professors involved in the Degree Course, and a
maximum class size (which varies according to the subject taught).
These rules introduced exogenous variability in class size for two reasons: 1) the total
number of students enrolled has changed over time because of changes in the number of
professors with a permanent position; 2) in years when the number of enrolled students was
below the maximum class size, courses were taught in a single class, while in years when the

19
number of students exceeded the class size limits, courses were split into different teaching
classes.
Due to the admission policy followed by the LE Degree Course, students’
characteristics are not well balanced between large and small classes and therefore a positive
correlation between class size and student average ability emerges. We handle the potential
selection bias created by the screening carried out the admission policy by using regression
techniques (controlling for High School Grade and average student ability) and by matching on
the covariates at the basis of the screening process.
In order to avoid bias from heterogeneity in instructor ability or in grading policies
influencing the estimates of the effect under examination, we only focus on courses taught by
the same instructor in different academic years. From our analysis it emerges that, once we
control for a number of individual characteristics and for course fixed effects, larger classes
produce a negative effect on grades obtained by students. In addition, students who have
attended courses in larger classes have a significantly lower probability of passing an exam.
While the effect of class size on grades is small, the effect on the probability of reaching the
pass mark is considerable: an increase of class size by 50 students reduces the probability of
passing the exam by about 9 percentage points. These results are robust to the use of a matching
estimator, which confirms the negative and highly significant effect of large classes on student
performance.
Nevertheless, as these findings pertain to just one university and to first year courses, it
is not possible to derive a general conclusion and additional research is necessary to understand
class-size effects at college level and mechanisms that drive them.
References Abadie, A., Drukker, D., Leber Herr, J., and Imbens, G., (2004), “Implementing Matching
Estimators for Average Treatment Effects in Stata”, Stata Journal, 4, pp. 290–311. Abadie, A., and Imbens, G. (2006), “Large Sample Properties of Matching Estimators for
Average Treatment Effects”, Econometrica, 74, pp. 235–67. Angrist, J. (1998), “Estimating the Labor Market Impact of Voluntary Military Service Using
Social Security Data on Military Applicants”, Econometrica, 66 (2), pp. 249-288. Angrist, J. and Lavy, V., (1999), Using Maimonides’ rule to estimate the effect of class size on
scholastic achievement, Quarterly Journal of Economics, 114 (2), pp. 533-575. Bandiera, O., Larcinese, V., Rasul, I. (2008), Heterogeneous Class Size Effects New Evidence
from a Panel of University Students, Department of Economics, London School of Economics and Political Science, mimeo.
Bedard, K., Kuhn, P. (2008), Where class size really matters: Class size and student ratings of instructor effectiveness, Economics of Education Review, 27, pp. 253–265.
Boozer, M. and Rouse, C. (1995), Intraschool variation in class size: patterns and implications, NBER Working Paper 5144.
Browning, M. and Heinesen, E. (2007), Class size, teacher hours and educational attainment, Scandinavian Journal of Economics, 109(2), pp. 415-438.

20
Brunello, G. and Cappellari, L., (2007), The labour market effects of Alma Mater: Evidence from Italy, Economics of Education Review, 27(5), pp. 564-574.
Case, A. and Deaton A. (1999), School Quality and Educational Outcomes in South Africa, Quarterly Journal of Economics, 114(3), pp. 1047–1084.
Checchi, D., (2006), The Economics of Education: Human Capital, Family Background and Inequality, Cambridge University Press.
Coleman, et al., (1966), Equality of Educational Opportunity, Washington, DC: U. S. Government Printing Office.
Dobbelsteen, S., Levin, J. and Oosterbeek, H. (2002), The causal effect of class size on scholastic achievement: distinguishing the pure class size effect from the effect of changes in class composition, Oxford Bulletin of Economics and Statistics, 64, pp. 17–38.
Hanushek, E. (1986), The economics of schooling: Production and efficiency in public schools, Journal of Economic Literature, 24, pp. 1141–1177.
Hanushek, E. (1999), What education production functions really show: a positive theory of education expenditures, Economics of Education Review, 18(2), pp. 223-239.
Hoxby, C. (2000), The effects of class size on student achievement: New evidence from population variation, Quarterly Journal of Economics 115, pp. 1239-1285.
Kokkelenberg, C., Dillon, M. and Christy S. (2008), “The Effects of Class Size on Student Grades at a Public University”, Economics of Education Review…..
Krueger A. and Whitmore D. (2001), The Effect of Attending a Small Class in the Early Grades on College-test Taking and Middle School Test Results: Evidence from Project Star, Economic Journal, 111(468), pp.1-28.
Krueger, A. (1999), Experimental estimates of educational production functions, Quarterly Journal of Economics 114 (2), pp. 497-532.
Lazear, E. (2001), Educational production, Quarterly Journal of Economics 116 (3), pp. 777-803.
Leuven E., Oosterbeek H. and Ronning M. (2008), Quasi-experimental estimates of the effect of class size on achievement in Norway, Scandinavian Journal of Economics, 110(4), pp. 663-693.
Rosenbaum P. and Rubin D. (1983), The central role of the propensity score in observational studies for causal effects, Biometrika, 70(1), pp. 41-55.
Rubin D. (1977), Assignment to Treatment Group on the Basis of a Covariate, Journal of Educational Statistics, 2(1), pp. 1-26.
Urquiola, M. (2006), Identifying class size effects in developing countries: Evidence from rural Bolivia, Review of Economics and Statistics, 88(1), pp. 171–176.
Webbink, D., (2005), “Causal Effects in Education”, Journal of Economic Surveys , 19, 4, pp. 535-560.