academic achievement motivation in hispanic students
TRANSCRIPT
Eastern Illinois UniversityThe Keep
Masters Theses Student Theses & Publications
1994
Academic Achievement Motivation in HispanicStudentsLisa A. SchuckThis research is a product of the graduate program in School Psychology at Eastern Illinois University. Findout more about the program.
This is brought to you for free and open access by the Student Theses & Publications at The Keep. It has been accepted for inclusion in Masters Thesesby an authorized administrator of The Keep. For more information, please contact [email protected].
Recommended CitationSchuck, Lisa A., "Academic Achievement Motivation in Hispanic Students" (1994). Masters Theses. 2074.https://thekeep.eiu.edu/theses/2074

L
THESIS REPRODUCTION CERTIFICATE
TO: Graduate Degree Candidates who have written formal theses.
SUBJECT: Permission to reproduce theses.
The University Library is receiving a number of requests from other institutions asking permission to reproduce dissertations for inclusion in their library holdings. Although no copyright laws are involved, we feel that professional courtesy demands that permission be obtained from the ·author before we allow theses to be copied.
Please sign one of the following statements:
Booth Library of Eastern Illinois University has my permission to lend my thesis to a reputable college or university for the purpose of copying it for inclusion in that institution's library or research holdings.
Date Author
I respectfully request Booth Library of Eastern Illinois University not allow my thesis be reproduced because --------------
Date Author
m
Academic Achievement Motivation
in Hispanic Students (TITLE)
BY
Lisa A. Schuck
THESIS
SUBMITTED IN PARTIAL FULFILLMENT OF THE REQUIREMENTS
FOR THE DEGREE OF
Specialist in School Psychology
IN THE GRADUATE SCHOOL, EASTERN ILLINOIS UNIVERSITY
CHARLESTON, ILLINOIS
1994 YEAR
I HEREBY RECOMMEND THIS THESIS BE ACCEPTED AS FULFILLING
THIS PART OF THE GRADUATE DEGREE CITED ABOVE
L
TABLE OF CONTENTS
List of Tables. . . . . . . . . . . . . . . . . . . . . . . . . . . . . . . . . . . . . . . . . ii
Acknowledgements. iii
Abstract . ........... . iv
Introduction and Review of Literature.................. 1
Purpose of Study................... . . . . . . . . . . . . . . . . . . . . 21
Hypotheses. 23
Method. . . . . . . . . . . . . . . . . . . . . . . . . . . . . . . . . . . . . . . . . . . . . . . . . 2 5
Subjects ....
Instruments.
Procedure.
25
26
34
Re su 1 ts . . . . . . . . . . . . . . . . . . . . . . . . . . . . . . . . . . . . . . . . . . . . . . . . 3 7
Discussion. . . . . . . . . . . . . . . . . . . . . . . . . . . . . . . . . . . . . . . . . . . . . 59
References. . . . . . . . . . . . . . . . . . . . . . . . . . . . . . . . . . . . . . . . . . . . . 7 4
i

LIST OF TABLES
Table Page
1 Means and Standard Deviations for TRAAM
Factors and Total Score, AMS Subscales
and Total Score, OLSAT Scores, SAT
Scores, and Grades. . . . . . . . . . . . . . . . . . . . . . . . . . . . 38
2 Correlations Between TRAAM Factors and Total
Score and AMS Subscale and Total Score ........ 41
3 Correlations Between TRAAM Factors and Total
Score and Group Achievement Scores and
Grades. . . . . . . . . . . . . . . . . . . . . . . . . . . . . . . . . . . . . . . . 42
4 Regressions Predicting Group Achievement Scores
and Grades; TRAAM and AMS as Predictors ....... 44
5 Regressions Predicting Group Achievement Scores
and Grades; TRAAM, AMS, and IQ as Predictors .. 49
6 Regressions Predicting Group Achievement Scores
and Grades; TRAAM, AMS, IQ, and Achievement
Scores as Predictors .......................... 56
ii

L
ACKNOWLEDGEMENTS
I would like to thank the principal, Mr. John
Hoekstra, the teachers, and the students of Kerr
Intermediate School in Blue Island Illinois for their
cooperation, time and effort in participating in this study.
I would like tho thank my thesis committee, Dr. Judy
Oehler-Stinnett, Dr. Terry Stinnett, and Dr. Linda Leal, for
their direction and assistance. Special thanks for sharing
their knowledge with me and for showing me how enjoyable and
exciting it is to conduct research. I would like to
especially acknowledge Dr. Judy Oehler-Stinnett whose time
and encouragement was greatly appreciated.
I would like to express my sincere admiration and
respect for Dr. Luis Felipe Clay-Mendez whose kindness and
wisdom is truly an inspiration. My deepest gratitude for
introducing me to the Spanish language and Hispanic culture,
and for assisting me with the translations for this study.
I would like to thank my parents, Edward and Blanche
Schuck, and my sister, Linda Minas, for their endless love
and support, for their faith in me, and for always making me
feel proud of my accomplishments.
iii

L
Abstract
There is a lack of research on academic achievement
motivation in Hispanic students, and instruments which
measure achievement motivation have not been validated with
Hispanic students. Fifteen regular-education teachers rated
67 third through fifth grade Hispanic students on the
Teacher Rating of Academic Achievement Motivation (TRAAM) .
Students completed the Achievement Motivation Scale (AMS) .
Construct validity was investigated by examining the
relationship of the TRAAM with the AMS. Criterion-related
validity was established by examining the relationship of
the TRAAM with Stanford Achievement Test (SAT) scores and
grades. The TRAAM, AMS, Otis-Lennon School Ability Test
(OLSAT) scores, and grades were used to predict academic
achievement. Pearson product-moment correlations indicate
that the TRAAM is a valid measure of academic achievement
when used with Hispanic students. Stepwise multiple
regression analysis revealed that the TRAAM was the best
predictor of grades and it accounted for a significant
portion of variance in standardized achievement scores.
iv

CHAPTER 1
Introduction
1
According to the U.S. Bureau of Census, it is estimated
that by the year 2020 as much as 37% of the total population
in this country could be Hispanic (cited in Figueroa, 1990).
The annual growth rate for Hispanics exceeds the annual
growth rate for Blacks and Whites, and school-age Hispanic
children may be the largest growing group in the United
States (Geisinger, 1992). It is imperative that school
psychologists and educators have knowledge of the patterns
of achievement motivation in Hispanic children, the factors
that motivate Hispanic children to achieve, and ways to
measure and promote achievement motivation in these
students. Achievement motivation is believed to be an
important factor in children's personalities that affects
functioning, especially in educational setting. How
children develop the desire to undertake certain tasks and
to do well in school should be of extreme interest to school
psychologists. There is currently a lack of research
concerning academic achievement motivation in Hispanic
students. The Teacher Rating of Academic Achievement
Motivation (TRAAM), developed by Stinnett and Oehler
Stinnett (1993), may be a useful instrument for identifying
Hispanic students with low academic achievement motivation.

2
Literature Review
Academic Achievement Levels of Hispanic Students
There is little debate over the fact that Hispanic
students fail to do well on standardized tests of academic
achievement, generally achieve at a lower rate than white
students, experience grade repetitions more frequently than
white students, and have disproportionately high drop out
rates compared to white students (Carter & Segura, 1979;
Cervantes & Bernall, 1977; Stevenson, Chen, & Uttal, 1990).
According to Costantino (1992) Hispanic students have the
highest high school dropout rate of all ethnic-racial
groups. After conducting an extensive review of the
literature on the school achievement of Mexican Americans,
Cervantes and Bernall (1977) concluded that as a group,
Mexican Americans achieve considerably below the level of
white students and some other minority groups. Carter and
Segura (1979) report that although there is evidence that
Hispanic students start school fairly close to white
students in the areas of measured achievement, patterns of
low achievement in Hispanic children tend to appear in
elementary school and persist throughout high school.
According to Figueroa, Sandoval, and Merino (1984), Hispanic
pupils may continue to be overrepresented in classes for the
mentally handicapped and underrepresented in classes for the
learning disabled and gifted.
Some recent research suggests that minority children's

L
performance in school has improved over the past 15 years.
However, other studies support the notion that the
differences in achievement among ethnic groups are still
large. Humphreys (1988), in his summary of results of
national surveys, has documented considerable evidence that
there has been and continues to be differences in the
academic achievement of Hispanic students and white
students.
3
Historically, low levels of achievement in Hispanic
children have been attributed to numerous factors. The most
recent and acceptable perspective is that low achievement is
not attributed to innate ability or characteristics of
Hispanic individuals, or factors inherent in the Hispanic
culture. It is believed that underachievement in Hispanic
students is a result of inappropriate educational practices
due to limited funding and/or the failure of schools to
adapt to the needs of Hispanic students (Anderson & Safar,
1971; Cervantes & Bernall, 1977; Hernandez, 1973). However,
the investigation of individual and cultural factors has
lead to contradictory and inconclusive studies.
Familial and Cultural Variables
Numerous studies have attempted to link low achievement
with various familial and cultural variables. One variable
that has perhaps received the most amount of attention is
socioeconomic status (SES). Baral (1977), and White (1982)
reviewed many studies that have confirmed a strong

L
4
relationship between SES and academic achievement. However,
some researchers conclude that SES is not a significant
predictor for achievement in Mexican American students, and
that correlations between SES and academic achievement are
moderate to very weak (Hernandez, 1973; White, 1982) .
Baral (1977) reports that several studies indicate a
relationship between the education level of Mexican American
parents and the academic achievement of their children. One
popular traditional notion is that Hispanics hold
unfavorable attitudes toward education. After reviewing the
literature, Cervantes and Bernall (1977) conclude that
findings with respect to the school attitudes of Mexican
Americans are inconclusive. In a study of beliefs toward
academic achievement, Stevenson and Uttal (1990) found that
beliefs of Mexican American children and their mothers are
similar to those associated with higher, not lower levels of
achievement. Anderson and Johnson (cited in Hernandez,
1973) found that Mexican-American children revealed a
significantly strong desire to achieve, and reported
experiencing the same degrees of encouragement at home as
their Anglo peers. Fyans, Maehr, Slili, and Desai (1983)
report a variation in the meaning of achievement across
cultural groups. However, the idea that Hispanics hold a
different meaning of achievement in comparison to other
Americans has not been substantiated.
In an extensive review of the literature, Hernandez

(1973) discusses many cultural variables such as values,
acculturation and gender roles. However, it is reported
that no clear relationship exists between these variables
and achievemen't. One variable that has received a
considerable of attention is native language. The primary
language for many Hispanic people in this country is
Spanish. For most of the century, bilingual education was
denounced as contrary to American patriotism, and was
regarded as a source of underachievement (Figueroa, 1990;
Chamberlin & Medinos-Landurand, 1991). However, the
relationship between use of a native language and lowered
achievement has not been established. Furthermore, use of
native language does not appear to interfere with other
cognitive processes such as acquiring a second language.
The majority of current empirical literature supports the
notion that instruction in the primary language is the most
appropriate and effective way for educating bilingual
children (Figueroa, 1990).
Another cultural variable that has been given a
considerable amount of attention, and relates directly to
the concept of intrinsic and extrinsic motivation is locus
of control. It has been proposed and widely accepted that
Hispanics stress fate over individual responsibility and
therefor lack a sense of control over the environment and
their academic achievement (Grossman, 1984; Chamberlin &
Medinos-Landur.and, 1991). However, after a review of the
5

L
6
literature, Baral (1977} concluded that studies concerning
locus of control are not consistent. There may be little if
any relationship between Mexican American's sense of control
over the environment and their academic achievement.
Psychological Variables
Another line of research attempted to link individual
or psychologic.al variables to achievement. The earliest
researchers attempted to link low achievement of minority
students to inferior cognitive abilities or low IQ's. Lavin
(cited in Baral, 1977} conducted an extensive survey and
concluded that ability accounts for less than half of the
variation in school achievement among students. This notion
may have led researchers to focus on the non-intellectual
characteristics of individuals that correlate with academic
achievement. According to Cervantes and Bernal (1977),
considerable theoretical attention has been given to these
variables but there is a lack of empirical studies
researching the relationship between psychological variables
and achievement. Furthermore, is it often difficult to
distinguish psychological variables from cultural variables.
Numerous studies have investigated the notion
that Hispanic children have negative self-concepts compared
to their peers and that this low self esteem leads to low
achievement. The precise relationship between self-concept
and achievement has not been established, and there has not
been enough evidence to substantiate the claim that Hispanic
students have negative self-concepts (Baral, 1977;
Cervantes, & Bernall, 1977; Hernandez, 1973). Significant
negative relationships between anxiety in minority students
and performance in school have been reported. Few studies
have investigated anxiety as a factor that affects
achievement of Hispanic pupils (Hernandez, 1973). However,
Willig, Harnish, Hill and Maehr (1983) found that Hispanic
students demonstrated higher test anxiety than other groups
of students, and concluded that high anxiety is predictive
of negative attributions and low school performance.
Studies have indicated that differences exist between
the cooperative and competitive behaviors of Hispanic
children and white children, with Hispanic children being
significantly less competitive than white children of
comparable ages (Mcclintock, 1974). These results may be
applied to achievement motivation since schools in this
country generally value, encourage, and reward competitive
behavior. On the contrary, Kagen, Zahn, and Gealy (1977)
report that the less competitive social orientation of
Mexican-American children is not necessarily a disadvantage
with regard to school achievement.
7
Motivation has proven to be one of the most critical
psychological or non-intellectual factors related to
achievement (Atkinson, 1964; Bandura, 1969; Maehr, 1974;
McClelland, 1965). However, few studies have investigated
academic achievement motivation in Hispanic children. In an

8
attempt to identify differences in motivation between
Mexican-American and Anglo-American students, Johnson (cited
in Hernandez, 1973) concluded that overall differences in
motivational levels between these two groups are not
significant.
Theories of Motivation
Drive Theory
An abundance of literature has focused on motivation.
Most contemporary theories of achievement motivation have
developed from the earlier drive theories which celebrated
their popularity in the 1950's and early 1960's. The tenant
of the early drive theories was that behavior is organized
by powerful yet basic needs such as hunger and thirst.
Later, researchers such as McClelland and Atkinson
expanded on this theory to include learned drives and
psychological motives such as the need for approval,
belongingness, and achievement. According to the learned
drive theory of achievement motivation, need for achievement
results from a conflict between striving for success and
avoiding failure. Resolution of this conflict depends to a
large degree on the individual's childhood experiences;
primarily patterns of rewards and punishments delivered by
parents and teachers, and the development of positive self
regard (Covington, 1984). Research has shown that parents
of achievement-oriented children reward performances that
are successful, and remain neutral toward performances that

L
9
fall short of success. Parents of failure-avoidant children
tend to punish their children's failures while remaining
neutral in the event of success (cited in Covington, 1984).
Social Learning Theory
Social learning theorists such as Bandura and Rotter
generally agree that determinants of behavior are learned
and that the learning processes is influenced by perceptions
of the actions of others. External situations play an
important role in determining behavior, and an individual's
behavior varies greatly depending on the situation. Rotter
has expanded on this notion, and proposes that behavior is
determined by the expectancy of goal attainment and by the
value of the reinforcer. What an individual expects in a
particular situation is based on prior reinforcement
received in that situation. On the basis of a variety of
learning experiences, belief systems develop within the
individual. These beliefs influence behavior in specific
situations (Weiner, 1985) .
An area of research that has developed from Rotter's
idea and has received a great deal of attention is locus of
control. Rotter has argued that an internal locus of
control is a feeling that one is self-determining, and
competent. This orientation develops as a result of
positive successful encounters with the environment.
According to this view, an external locus of control is
developed as a defense to failure (Harter, 1978).

L
10
A related area of research that has grown out of
Rotter's theory is the study of intrinsic versus extrinsic
motivation (Weiner, 1985) . It has been suggested that
individuals who are primarily intrinsically motivated as
opposed to extrinsically motivated are more confident in
their abilities. This has important implications for
children in academic settings. Theorists suggest that some
children engage in activities that are novel and that
enhance their competence and effectiveness in the
environment. These children obtain a greater level of
satisfaction through interacting with the environment and
are therefore more motivated to engage in challenging
activities (Atkinson, 1964; Das, Schokman-Gates, & Murphy,
1985; Kagen 1972). Some researchers claim that extrinsic
rewards may undermine intrinsic motivation. Harter has
found that school grades attenuate intrinsic motivation by
decreasing the pleasure derived from challenge, reducing the
degree of challenge chosen by the child, and evoking concern
and anxiety over possible failure (cited in Harter, 1978).
Self-efficacy Theory
White challenged the drive theorists and argued that
certain behaviors that are pertinent to achievement
motivation such as curiosity, mastery, play, and the need to
deal competently with one's environment could not be
adequately explained in terms of the drive theories (White,
1959; Harter, 1978). Self-efficacy theorists have expanded

L
11
on White's ideas and contend that motivation is based on a
feeling of confidence that is developed within the
individual while he/she masters tasks in the environment.
They stress the importance of satisfaction and enjoyment in
mastering these tasks as an underlying component of
competence (Bandura, 1982; White, 1959). The feeling of
efficacy associated with mastery of the environment leads to
continuing interest in a task, or motivation. White (1959)
suggests that motivation develops through the intrinsic need
to deal effectively with the environment. When this need is
gratified it produces inherent pleasure for the
individual.
Attribution Theory
In the 1970's, researchers such as Weiner brought a
great deal of attention to the role of attributions in
achievement motivation (Covington, 1984) . Attribution
theorists investigate the perception of causality, or the
judgment of why a particular event occurred. Attribution
theory contends that an individual perceives causes for
personal success and failure, and that future actions are
determined by the previous attributions made by the
perceiver. Perceptions of these causal factors have
important implications for academic achievement. Common
ascriptions for success and failure include ability, effort,
task difficulty, and luck. Reduced academic performance,
and expectations for the future can be due to past

L
12
experiences of failure, especially if this failure is
attributed to some unchangeable factor such as ability.
Empirical findings suggest a relationship between causal
ascription and achievement striving. For example, low
achievers tend to attribute their failure to lack of ability
rather than effort, and attribute success to luck rather
than ability or effort (Wagner, Powers & Irwin, 1985;
Wiener, 1974, 1979).
Cognitively oriented theorists such as Fontaine, Valle
and Frieze (cited in Covington, 1984), expanded on these
ideas and placed heavy emphasis on the role of effort in
achievement motivation. It is proposed that perceptions of
one's effort is the most important cause of future
achievement motivation. Research has shown that individuals
who try hard and fail are more likely to remain optimistic
about future success, and have increased pride in the event
of success. Additionally, Omelich and Covington (cited in
Covington, 1984) found that regardless of whether students
are considered to be bright, students who are perceived by
teachers as having tried hard are rewarded more when they
succeed and are punished less when they fail than students
who are perceived as not tying hard.
Covington (1984) has proposed a self-worth theory of
achievement motivation which combines elements of the
cognitive approach and the drive theory. In contrast to the
cognitively oriented theory which proposes that positive

L
13
feelings toward accomplishments are based on effort, this
theory assumes that the need for students to protect their
sense of worth is the central part of all classroom
achievement. This theory stresses that personal worth
depends on one's accomplishments, that ability is a prime
component of success, and that inability is a prime
component of failure. Students are driven to approach
success, and to avoid failure since failure causes feelings
of worthlessness and social disapproval. Therefore,
students who exhibit achievement behavior do so in order to
maintain a reputation of competency. This sense of
competency leads to self-worth. Effort is also important to
the development of the feeling of self-worth. For example,
research has indicated that a combination of high effort and
failure leads to suspicions of low ability. Although high
effort reduces guilt, it increases humiliation in the event
of failure. According to this theory, students are likely
to endure guilt (not trying) rather than being humiliated
(trying hard and failing) (cited in Covington, 1984) .
Behavioral Perspectives
Maehr (1974) suggests that since a desire or motive is
not something that can be directly observed, we must look at
the aspects of behavior that elicit concern with motivation.
Activity, direction, and persistence are the three
behavioral categories related to motivation. What
determines these patterns of activity, direction, and

persistence depends on personality, situation, and
interaction between the two.
14
Some researchers have used this behavioral approach to
study achievement motivation in terms of acquiring and
performing necessary skills. Bandura has underlined the
difference between problems in acquiring a behavior and
problems with performing a behavior. He has described and
differentiated these two concepts. Skills (acquisition)
deficits occur when the actual skills needed to successfully
perform a task are not present. Performance deficits occur
when the skill is in the individual's behavioral repertoire,
but the individual fails to perform what is necessary to
successfully c.omplete the task (Bandura, 1969, 1977). The
distinction between skill and performance deficits has
important implications for academic achievement motivation
and should be made in academic settings prior to diagnostic
and treatment procedures. It is appropriate to approach
problems with academic achievement motivation in terms of
academic performance deficits (Stinnett, Oehler-Stinnett, &
Stout, 1990).
Achievement Motivation
It is difficult to separate motivation and achievement.
It is widely assumed that achievement is not just a function
of intellectual capacity, opportunity, or good fortune.
While there is no commonly accepted definition of
achievement motivation, researchers have tended to agree

15
that achievement is associated with some type of performance
that occurs in a situation in which there is a standard of
excellence. The behavior is therefore measurable and
typically involves some uncertainty as to the outcome or
quality of the accomplishment (Maehr, 1974; McClelland,
1965) . Achievement motivation has typically been viewed as
an important developmental personality variable, and an
enduring characteristic of the individual (Atkinson, 1964;
Maehr, 1974; McClelland, 1965). According to Smith (1969),
achievement related motives refers to the personality
factors that are necessary and utilized when an individual
undertakes a task at which he/she will be evaluated, enters
into any competitive situation with other people, or strives
to attain some standard of excellence.
Murray was one of the earliest researchers to focus on
achievement motivation. In 1938 he devised a taxonomy that
included twenty basic human needs and was the first to call
attention to the fact that achievement is a basic human
need. He recognized the importance of assessing need states
and developed the Thematic Apperception Test (TAT); a
projective test used to infer individual's motivational
concerns (Weiner, 1985).
Atkinson (1962) developed an early theory of
achievement motivation. His theory stresses that
achievement related behavior is the result of a conflict of
a between a hope of success (approach motivation) and a fear

L
16
of failure (avoidance motivation) . Humans feel a need for
achievement while they feel anxiety about failure. Atkinson
suggests that the incentive value of a task is determined by
the probability of success. Therefore, whether an
individual approaches or avoids a task depends on a
combination of the need for achievement, anxiety about
failure, the probability of success, and the incentive value
of the task.
McClelland has contributed a great deal of research to
the area of achievement motivation and economic development,
and has placed a great deal of stress upon learned inner
drives and culturally derived personality patterns. His
ideas have lead to numerous sociological and anthropological
investigations of achievement motivation. He noted that
various societal groups exhibit differential degrees of
drive and productivity. This is partly due to the variable
opportunities presented to these groups as well as their
capacities to capitalize on them. According to McClelland,
families and child rearing practices that emphasize
independence, ~astery of tasks, and competition with
standards of excellence produce children with high
achievement motivation (McClelland, 1965) . McClelland has
shown that an increase in achievement motivation leads to
economic growth. Conversely, a decrease in achievement
motivation leads to economic decline. Maehr (1974) contends
that this theory has given limited attention to the
L
situational contexts that affect achievement, and it has
been too readily concluded by researchers that certain
cultural groups are lacking in motivation as far as
achievement is concerned.
Academic Achievement Motivation in Children
17
Many researchers have focused on academic achievement
motivation in children, and some important developmental
trends have been noted. Harter's findings (1981) indicate
that there is a gradual shift from intrinsic motivation in
younger children to extrinsic motivation in older children
when considering academic behaviors that children like to
and prefer to do. Covington (1984) suggests that the
importance of ability and effort depends on the age of the
learner. Young children perceive trying hard (effort) as
the most important factor in a successful performance. In
fact, simply trying hard in and of itself constitutes a
successful performance for many young children. However, as
individuals grow older, competency (ability) becomes the
central component of a successful performance. Research has
indicated that younger children tend to judge themselves by
comparing their performance to their own prior performance
(cited in Covington, 1984) . Young children are pleased with
their own performance if their achievement improves over
time. Howeve~, as children get older, they begin to make
self-comparisons and their sense of worth comes from doing
better that others (Covington, 1984) .

L
18
Some researchers suggest that sex differences exist in
terms of attributional tendencies. Boys are more likely to
attribute failure to unstable factors such as lack of
effort, or bad luck. These attributions lead to increased
effort in the event of failure. However, girls tend to
attribute failure to lack of ability which leads to a lack
of persistence in the event of failure (cited in Dweck and
Gilliard, 1975) .
Assessment of Academic Achievement Motivation
Information regarding a student's level of academic
achievement motivation and orientation toward academic
achievement motivation can be an important resource in
designing interventions to enhance academic success.
Various self-report measures of academic achievement
motivation have been developed to gather such information.
Gottfried (1985) has developed the Children's Academic
Intrinsic Motivation Inventory (CAIMI) . This scale is based
on the theory that academic intrinsic motivation involves
enjoyment of school learning characterized by an orientation
toward mastery, curiosity, persistence, task-endogeny, and
the learning of challenging, difficult, and novel tasks. It
not only assesses academic intrinsic motivation, but also
assesses motivation in four subject areas: reading, math,
social studies, and science. Gottfried (1985, 1988) found
that academic intrinsic motivation was significantly and
positively correlated with children's school achievement and

perceptions of academic competence. Findings also suggest
that academic intrinsic motivation is differentiated into
school subject areas of math, reading, science, and social
studies.
19
Harter (1978, 1981) has constructed the Scale of
Intrinsic versus Extrinsic Orientation in the Classroom
(SIEOC) that purports to measure the level of a child's
motivational orientation in the classroom setting. This
scale is based on the effectance motivation theory. Harter
views effectance motivation as a continuum from intrinsic to
extrinsic, and this instrument was designed to reflect both
poles of this continuum. Five specific dimensions of
intrinsic versus extrinsic academic achievement motivation
have been identified, and findings suggest that the
motivation construct includes two separate components:
motivation, and cognitive/information. Curiosity,
challenge, and mastery dimensions reflect what the child
wants to do, likes to do and prefers to do (motivation) .
Judgement and criteria dimensions reflect what the child
knows, the basis for his/her decision making, and what the
child has learned about the rules of school
(cognitive/information) .
Bracken (1990) developed the Achievement Motivation
Scale (AMS) . This scale was designed to combine three major
areas of motivation and is comprised of three motivations
subdomains. The subdomains assess an individual's

20
perceptions of attribution, reinforcement, and efficacy.
Teacher ratings can be accurate, reliable, and
expedient ways to collect information concerning academic
achievement motivation (cited in Stinnett, Oehler-Stinnett,
and Stout, 1990) . The Teacher Rating of Academic
Achievement Motivation (TRAAM) was developed by Stinnett and
Oehler-Stinnett (1993) . All items were devised to reflect
major dimensions of academic achievement motivation and are
based on a skill versus performance deficit model. Factor
analysis of the original scale revealed four factors, School
Performance, Mastery, Work Orientation, and Academic Skills,
which accounted for 68% of the variance in teacher ratings
of white middle-class children (Stinnett, Oehler-Stinnett,
and Stout, 1990) . The current TRAAM is a modified version
of the original TRAAM which includes a larger sample size
than the original scale, and yields a factor structure that
is different from the original scale. Factor analysis of
the revised scale revealed six factors, Mastery-Effort, Work
Completion, Academic Skill-Ability, Competition,
Cooperation, and High Effort-Low Ability that accounted for
66.5% of the variance in teacher ratings (Stinnett, Oehler
Stinnett, & Stout, 1993) . (For a more extensive review of
the TRAAM, see Method section) .
The TRAAM has been successful in predicting achievement
level of students and in identifying students with low
academic achievement motivation (Stinnett, Oehler-Stinnett,
21
and Stout, 1990). Based on the factors that have been
revealed, the TRAAM can provide educators with insight into
a child's orientation toward motivation. It may also be used
to reveal deficit areas which can assist educators in
intervention and remediation.
Purpose of the Study
This study will focus on achievement motivation in
academic settings displayed by Hispanic children. The word
"hispanic" is often loosely and inappropriately used to
specify race. In this country, Hispanic individuals are a
cultural group, comprised of a diverse g+oup of people. A
cultural group is a group of individuals whose attitudes,
customs and beliefs are distinguished from other groups of
people (Hirsch, Kett, & Trefil, 1988). Hispanic is a broad
term that should be used to refer to people of Latin
American (Mexican, Central American, West Indian, and South
American) origin who are usually Spanish-speaking, and live
in the United States. It is suggested that professionals
working with Hispanic children be knowledgeable about
Hispanic culture, but also keep in mind that many traits
attributed to the culture are broad generalizations that may
not be accurate in terms of individuals or specific families
(Grossman, 1984).
Most of the research on academic achievement motivation
has been done on white middle-class children, and there is
currently a lack of research concerning academic achievement

22
motivation in Hispanic children. In fact, there are no
reliable and valid instruments that measure academic
achievement motivation in Hispanic students. Therefore,
effective intervention strategies that may be used with
Hispanic students have not been developed, and there are no
reliable ways to measure treatment effects of these
strategies even if they were available. Hispanic children
can achieve if we recognize patterns of low motivation and
respond to variables that will enhance academic achievement
motivation. Consistent with current ideation, the
assumption should be that Hispanic children as a group do
not display a lack of motivation, or atypical motivational
styles, but that schools are unable to identify Hispanic
children that display low motivation, and are not responding
to the factors that motivate these children.
The purpose of this study is to validate the Teacher
Rating of Academic Achievement Motivation (TRAAM) using a
sample of Hispanic children. The Hispanic students in this
study, as is the case with most studies (Hernandez & Nagel,
1993), are of Mexican-American origin. Construct validity
will be examined by answering the following question: Are
teacher ratings of motivation (TRAAM) related to student's
self reports of academic achievement motivation as measured
by the Achievement Motivation Scale (AMS)? Criterion
related validity will be examined by answering the following
questions: 1. Will the TRAAM be useful for predicting

L
23
achievement levels (Stanford Achievement Test scores and
grades) of Hispanic students? 2. Is the TRAAM a better
predictor of academic achievement (Stanford Achievement Test
scores and grades) than the AMS? 3. When an IQ measure
(Otis-Lennon School Ability Test) is included with
motivational variables, can the TRAAM account for variance
in academic achievement? 4. When an IQ measure (Otis
Lennon School Ability Test) and group achievement (Stanford
Achievement Test) scores are included with motivational
variables, can the TRAAM account for variance in student
grades? If the TRAAM proves to be valid when used with
Hispanic students, teachers may be able to use the scale to
identify Hispanic students who display low academic
achievement motivation. School psychologists and teachers
can then intervene by providing appropriate educational
experiences and programs that meet the child's needs.
Hypotheses
It is hypothesized that there will be significant
correlations between the ratings on the TRAAM and the AMS,
and that the TRAAM will be successful at predicting group
achievement scores (SAT) and grades. It is predicted that
the TRAAM will be a better predictor of the student's SAT
scores and grades than will the AMS. It is also hypothesized
that the TRAAM will be a significant predictor of SAT scores
and grades even with OLSAT scores included in the prediction
equation, and that the TRAAM will be a significant predictor

24
of student grades even when OLSAT scores and SAT scores are
included in the prediction equation.

Subjects
CHAPTER 2
Method
25
Sixty-seven students from grades three through five
participated in the study. The students were enrolled in a
public school located in a south suburb of Chicago. There
were 16 third graders (7 male, 9 female), 29 forth graders
(13 male, 16 female), and 22 fifth graders (10 male, 12
female). The average age of the students was 10.01 yrs.,
S.D. = .79. Only students who were enrolled in regular
education classrooms were included. The students reported
devoting an average of 2 hours and 18 minutes of time per
day to homework.
Only students who have at least one biological Hispanic
parent were included (Hispanic individuals from this area
are of Mexican origin). Twenty-four (35.8%) of the children
were born outside of the United States. The children born
outside of the· United States had been in this country an
average of 5.37 years. Sixty-four (91.2%) of the children
lived with both parents, and twenty-nine (42.6%) of the
children had one or more extended family members living in
their home. Fifty-two (76.4%) of the children had between 1
and 3 siblings in their home, and 15 (22%) of the children
had between 4 and 9 siblings in their home. Fifty-four
(80.5%) of the children reported that their fathers were
employed, 39 (58.2%) of the children reported that their

mothers were employed outside of the home.
For the purposes of this study, students who were
considered to be proficient in English (according to
district criteria) participated. However, some of the
students were bilingual. English was the primary language
for fifty-eight (85.3%) of the students. Forty-eight
(70.6%) of the students reported they were bilingual.
26
Eighteen (26.5%) of the students reported being able to
speak "some" Spanish. Fifty-eight (85.3%) of the students
reported that Spanish was the primary language spoken at
home by their parents, and 34 (50%) of the children reported
that they had received help at school in learning how to
speak English, and are now proficient in English. An
Analysis of Variance computed on the TRAAM and AMS yielded
no significant differences on the two motivation scales
between students who had received help learning to speak
English and those who had not.
Instruments
Teacher Rating of Academic Achievement Motivation
(TRAAM) . The TRAAM is a 50-item rating scale that is still
in research form. The TRAAM purports to measure six factors:
Mastery-Effort (Factor 1), Work Completion (Factor 2),
Academic Skill-Ability (Factor 3), Competition (Factor 4),
Cooperation (Factor 5), and High-Effort-Low Ability (Factor
6). Factors 1 through 6 contributed to 50%, 6.6%, 3%, 2.6%,
2.4% and 1.9% of the variance respectively in teacher's

ratings. The scale also yields a Total Score (Stout,
Stinnett, & Oehler-Stinnett, 1993).
27
Factor 1 (Mastery-Effort) reflects student behaviors
that are critical to the maintenance of effort even when the
student is confronted with a difficult task. These
behaviors include persistence, direction, and attention.
Factor 1 reflects the student's level of curiosity and
tendency to approach new and difficult tasks. Students who
are confident in their abilities are likely to take on
challenging tasks (Bandura, 1982; White, 1959). Therefore,
it is suggested that mastery is related to the student's
perception of competence and self-efficacy (Stinnett &
Oehler-Stinnett, 1993).
Factor 2 (Work Completion) reflects a range of school
performance behaviors such as a student's tendency to work
to the best of his or her ability, give good effort, and
complete assignments without teacher prompting. This factor
may assist educators in differentiating between skills
deficits and performance deficits, and identifying children
that have performance deficits. If a student is viewed as
having the skills to perform a task and does not perform the
task, then it is likely that the child has a performance
deficit and will be rated low on this factor (Stinnett &
Oehler-Stinnett, 1993) .
Factor 3 -(Academic Skill-Ability) items reflect the
child's academic and cognitive skill. Scores on this factor

28
indicate the child's ability to keep up with classroom tasks
and instruction, and to succeed. If a child lacks the
knowledge necessary to complete a task, then he/she is
considered to have a skill deficit (Bandura, 1969; 1977) .
It is suggested that this factor be used to identify
children who h.ave skill deficits as opposed to performance
deficits. Therefore, this factor is considered to be less
motivational in nature (Stinnett & Oehler-Stinnett, 1993).
Factor 4 (Competition) reflects the child's preference
for competitive tasks, while Factor 5 (Cooperation) reflects
the child's preference for cooperative tasks. Covington
(1984) suggested that children develop a sense of self worth
from doing better than their peers. In competitive
situations, students tend to attribute success to stable
internal traits and attribute failure to external sources.
It is suggested that successful students enter into
competitive classroom situations in order to increase their
sense of self worth, which leads to increased effort on
future tasks. However, for children who are frequently
unsuccessful, competitive classroom situations may lead to a
reduced sense of self worth, and lowered effort. It has been
suggested that children who have low achievement motivation
should be in cooperative classroom settings, and be
encouraged to attribute failure to changeable factors such
as effort Factor 6 (High Effort-Low Ability) reflects
whether a student gives good effort even when he/she lacks

the skills that are required to complete school related
tasks (Stinnett & Oehler-Stinnett, 1993) .
29
The TRAAM is designed for use by teachers to rate
students grades three through six on academic achievement
motivation. Some items on the TRAAM reflect motivated
behavior and other items reflect a lack of motivated
behavior toward academic achievement. The teacher rates
each student on each item using a five point (1-5) Likert
format. Raw scores for the six factors on the scale, and the
Total Score are computed by summing the items. High scores
reflect motivated behavior. Norms for standard scores have
not been established.
In a study that examined the technical qualities of the
original scale, it was revealed that the TRAAM has excellent
internal consistency reliability: School Performance (.95),
Mastery (.97), Work Orientation (.79), Academic Skills
(.98), and Total score (.98) (Stinnett, Oehler-Stinnett, &
Stout, 1990) . The TRAAM is also reliable in terms of
stability across time and agreement between raters. Test
retest reliability coefficients ranged from .85 to .96.
Inter-rater reliability was .74, .70, .46, .72, and .77 for
TRAAM factors 1 through 4 and the Total Score respectively
(Stinnett, Pitcher, & Oehler-Stinnett, 1992) . These results
are based on research done on the original 44-item TRAAM.
There is also evidence that the original scale has
construct and criterion-related validity. Construct
30
validity was demonstrated by investigating the relationship
between the TRAAM and the SIEOC, CAIMI, and the Social
Skills Rating System-Teacher (SSRS-T) . Correlations between
the TRAAM scores and the SIEOC ranged from .17 to .48 and
were significant (£ < .001). Correlations between the TRAAM
scores and the CAIMI ranged from .17 to .49 and were also
significant (£ < .001). Correlations between the TRAAM
scales and the SSRS-T Social Skills scales revealed a
positive relationship. Coefficients ranged from .42 to .88
and were significant (£ < .001). Correlations between the
TRAAM scales and the SSRS-T Problem Behavior scales revealed
a negative relationship. Coefficients ranged from -.32 to -
.71 and were ~ignificant (£ < .001) (Sinnett & Oehler
Stinnett, 1991; Stinnett, Pitcher & Oehler Stinnett, 1992).
Criterion related validity was initially investigated
by correlating the TRAAM with teacher judgements of student
academic performance, and with the Wide Range Achievement
Test-Revised (WRAT-R) . Correlation coefficients for the
TRAAM factors and teacher judgements ranged from .41 to .78
and were significant (£ < .001). Correlation coefficients
for the TRAAM factors and the WRAT-R subtests ranged from
.33 to .42 (£ < .001). Criterion-related validity was
further demonstrated by correlating TRAAM factor and Total
Score with CAIMI, SIEOC, and specific subtest of the SSRS-T
in an attempt to predict problem behaviors and academic
achievement. The TRAAM was a strong predictor of problem

31
behaviors and academic achievement (Stinnett & Oehler
Stinnett, 1991; Stinnett, Pitcher & Oehler-Stinnett, 1992).
Further studies that provide reliability and validity data
on the current version of the TRAAM are needed.
Achievement Motivation Scale. The AMS developed by
Bracken (1990), is a 90-item self report measure of academic
achievement motivation that is still in research form.
Standardization information is not yet available. This scale
is comprised of three subscales. The Reinforcement subscale
assesses the child's perception of reinforcement that he/she
receives from parents and teachers for engaging in
academically oriented tasks. The Attribution subscale
assesses the student's feeling of personal responsibility
for outcomes of school tasks. The Efficacy subscale
assesses the student's academic skills that are critical to
success in school such as persistence, organization and
study habits, willingness to follow directions and complete
assignments (Wanat, 1993) .
A modified Likert-type format, with no neutral point is
used. Items are presented as statements with either positive
or negative connotations. Item raw scores are summed for
the three subscales which include Reinforcement,
Attribution, and Efficacy, and the Total Test.
According to Bracken (1993) raw score means and
standard deviations are consistent across the three
subscales: Reinforcement (M = 95.41; SD= 12.93),

L
32
Attribution (M = 96.37; SD= 12.93), Efficacy (M = 91.04; SD
= 13.70). Concurrent validity of the AMS was investigated
by correlating the AMS with the CAIMI-General score.
Correlations were positive and significant (.49, E < .01).
Itercorrelations of the AMS subscales Reinforcement,
Attribution, and Efficacy range from .56 to .61 respectively
(E < .001). The shared variance among the subscales ranges
from 31 to 37%. The specific variance for each subscale is
approximately 63%. This indicates that each subscale is
making a unique contribution to the total test score (Wanat,
1993) . In a recent study of high achieving eighth grade
students, Coefficient alphas for each scale were calculated:
Reinforcement (.95), Attribution (.93), Efficacy (.94), and
Total Scale (. 97) (Bracken, 1990).
Student Profile. The Student Profile is a twelve-item
self report questionnaire that was developed for use with
this study. Items reflect demographic variables such as age,
sex, and parent's occupation. It also reflects language
factors such as the language (English or Spanish) that is
used in the ch.ild' s home, if the child is bilingual, and the
child's primary language. A multiple choice and open-ended
format is used.
Otis-Lennon School Ability Test. The OLSAT, developed
by Otis and Lennon (1979), is a group intelligence test
designed for use in grades 1 through 12. Abilities assessed
by the OLSAT include detecting similarities and differences,

33
defining words, following directions, classifying,
sequencing, solving arithmetic problems, and completing
analogies. Performance may be reported in standard scores,
percentile ranks, and stanines by age and grade level. The
standardization of the OLSAT was adequate and was based on
the 1979 U.S. Census (Q = 130,000).
Internal-consistency reliability coefficients reported
for age and grade level exceed .90. Test-retest reliability
coefficients for students in grades 1, 2, 4, 7 and 10 ranged
from .84 to .92. Correlations between the OLSAT and teacher
assigned grades and Metropolitan Achievement Test (MAT)
scores are acceptable and suggest concurrent and predictive
validity (Cohen, Montague, Nathanson, & Swerdlik 1988) .
Stanford Achievement Test-Eighth Edition. The SAT
Eight Edition is a standardized group achievement test.
There are two forms (J and K), and eight levels of the SAT:
Primary (1, 2, 3), Intermediate (1, 2, 3), and Advanced (1,
2). Subjects in this study were administered levels Primary
2 (appropriate for children grades 2.5 to 3.5), Primary 3
(appropriate for children grades 3.5 to 4.5), Intermediate 1
(appropriate for children grades 4.5 to 5.5), and
Intermediate 2 (appropriate for children grades 5.5 to 6.5).
Among the scores yielded by these four levels of the test
are Reading (includes Word Study Skills, and Reading
Comprehension), Listening (includes Vocabulary and Listening
Comprehension) Language (includes Spelling and Language
Usage), Mathematics (includes Concepts of Numbers, Math
Computation, and Math Application), Social Science, and
Science. Performance is described by percentile ranks,
stanines, scaled scores, normal curve equivalents, grade
equivalents, a·nd ability/achievement comparisons.
34
The standardization sample was representative of the
U.S. population in terms of school district size, geographic
area, and socioeconomic status (g = 215,000). Reliability
coefficients for each test and subtest, and for each form
and level are all .80 or higher. Correlations between SAT
and the Otis-Lennon School Ability Test are .60 or higher
and provide some support of construct validity (Conoley,
Kramer, & Murphy 1989) .
Procedure
Parent permission forms were sent home with students;
only students who returned parent permission forms were
included. Data were collected the second semester of the
1992-1993 school year to insure that teachers had adequate
experience with the students. Each teacher who participated
in the study completed a TRAAM on each Hispanic child in
their classroom who was included in the study. Students at
each grade level who participated in the study were
administered the AMS during school hours by their classroom
teachers. Each child also completed a Student Profile.
OLSAT scores, SAT scores, and grades were collected by
reviewing each child's school records. SAT scores used in

35
this study include Total Reading, Total Mathematics,
Language, Listening, Social Science, and Science. Students
were administered the SAT with the OLSAT in the spring, and
the 1993 results were used in this study. The grades used
in this study were final semester (4th quarter) grades that
were assigned by the student's classroom teacher. Grades
were reported in academic subjects areas of Reading,
Language, Spelling, Math, Social Studies, and Science.
Grades were converted to numerical grade points using a 4.0
scale.
Data Analysis.
Pearson-product moment correlations of the six TRAAM
factors and Total Score, and the three AMS subscales and
Total Score were calculated to investigate construct
validity and to determine if teacher ratings of academic
achievement motivation (TRAAM) are related to student's
self-reports of academic achievement motivation (AMS) .
Pearson product moment correlations were also calculated
between the TRAAM and children's group achievement scores
(SAT) and grades to examine the scale's criterion-related
validity. Multiple regression analysis was also used to
support criterion-related validity and to determine which
instrument (TRAAM or AMS) could best predict SAT scores and
grades. Multiple regression analysis of the TRAAM, AMS, and
Otis-Lennon (OLSAT) scores was conducted to determine if the
TRAAM would contribute significantly in predicting
36
achievement with OLSAT scores also entered into the
equation. Additionally, multiple regression analysis of the
TRAAM, AMS, OLSAT, and SAT were conducted to determine if
the TRAAM contributes significantly in predicting grades
when OLSAT scores and SAT scores were entered into the
equation.

CHAPTER 3
Results
Table 1 presents all raw score means and standard
deviations for TRAAM factors and the Total Score, AMS
subscales and the Total Score, and means and standard
deviations for OLSAT Test scores, SAT scores and grades.
Construct Validity
37
Correlations among the TRAAM scores and the AMS scores
are presented in Table 2. Inspection of the Pearson
product-moment correlations among the TRAAM and AMS revealed
that teacher ratings of motivation (TRAAM) were minimally
related to student's self reports of academic achievement
motivation as measures by the AMS. Correlations among the
TRAAM Factors and the AMS subscales range from .27 to .31, E
< .05 and .31 to .34, E < .01. The correlation between the
TRAAM Total Score and the AMS Total Score was .26, E < .05.
Criterion-Related Validity
Pearson Product-Moment Correlations
Pearson product-moment correlations between the TRAAM
Factors and Total Score and SAT scores (presented in Table
3) were moderate. TRAAM Factors 1 and 3 were related to
Reading, Language, Math, and Social Studies achievement
scores: £'S ranged from .34 to .46, and .39 to .47
respectively. Correlations were also significant between
TRAAM Factor 4 and Language achievement scores (£ = .39),
TRAAM Factor 6 and Reading (L = .38), Language (£ = .37),

Table 1
Means and Standard Deviations for TRAAM Factors and Total
Score, AMS Subscales and Total Score, OLSAT Scores, SAT
Scores and Grades
n = 67
n = 67
TRAAM
Fl F2 F3 F4 F5 F6
47.67 35.37 39.97 13.87
12.47 10.22 9.85 7.44
Reinforcement
108.19
84.45
AMS
Attribution
97.43
13.74
14.44
9.85
13.28
8.38
Efficacy
100.68
32.46
TS
195.49
47.23
TS
299.12
53.51
Note. All TRAAM and AMS Means and Standard Deviations are
based on raw scores.
38

Table 1 continued
fl = 62
Otis- Lennon School Ability Test
(OLSAT)
M 101. 36
SD 9.54
n 62
M
SD
Stanford Group Achievement Test Scores
(SAT)
Read
621.52
25.84
List
616.93
23.95
Lang
637.46
32.00
Math
628.10
38.00
Soc
619.77
26.03
39
Sci
624.66
26.58
Note. OLSAT Means and Standard Deviation are based on
Standard Scores (M = 100, SD= 16), SAT Means and
Standard Deviations are based on Standard Scores (M =
500, SD = 100).

Table 1 Continued
!l = 62
M
SD
Read
3.21
1. 40
Lang
3.13
1. 38
Grades
Spell
3.35
1. 40
Math
3.15
1. 41
Soc
3.31
1. 37
Note. Grades are based on a 4-point scale.
Sci
3.19
1. 39
40
41
Table 2
Correlations Between TRAAM Factors and Total Score and
AMS Subscales and Total Score
RFT ATTRB EFFIC AMS TS
TRAAM 1 .34** .27* .15 .31*
TRAAM 2 .14 .05 .10 .14
TRAAM 3 .27* .16 .15 .24
TRAAM 4 .13 -.09 -.04 .01
TRAAM 5 -.05 -.06 -.07 -.07
TRAAM 6 .15 .13 .08 .14
TRAAM TS .31 ** .18 .14 .26*
Note. * = £ < .05, ** = E < .01
RFT (AMS Reinforcement subscale), ATTRB (AMS
Attribution subscale), EFFIC (AMS Efficacy subscale),
AMSTS (AMS Total Score). TRAAM 1 (Mastery-Effort),
TRAAM 2 (Work Completion), TRAAM 3 (Academic Skill
Ability), TRAAM 4 (Competition), TRAAM 5 (Cooperation),
TRAAM 6 (High Effort-Low Ability), TRAAM TS (Total
Score) .

42
Table 3
Correlations Between TRAAM Factors and Total Score and SAT
Scores and Grades
Fl F2 F3 F4 F5 F6 TS
SAT SCORES
Read .3493* .2799 .3900* -.1321 -.1002 .3766* .3425*
List .1212 .1405 .1737 -.1373 -.1243 .1388 .0978
Lang .4641** .3971* .4687* -.1366 -.1216 .3657* .4642**
Math .3364* .2399 .4097** -.1897 -.2189 .2358 .2995
Soc .3429* .2906 .4139** -.0190 .0255 .4914** .3970*
Sci .2118 .2734 .2742 -.1229 -.0463 .3588* .2514
GRADES
Read .4185** .3603* .4665** .0382 -.0780 .1536 .4823**
Lang .6307** .6203** .6794** .0052 -.1007 .3442* .7217**
Sp el .4787** .3944* .4918** .0646 .0634 .4341** .5331**
Math .6396** . .5107** .6122** -.1312 -.2004 .2126 .6344**
Soc .5725** .4550** .5916** -.0977 -.1674 .1937 .5713**
Sci .4885** .3597* .4415** -.1319 -.1603 .0307 .4504**
Note. 1-tailed significance: * = E < .01, ** = E < .001
Fl= Mastery-Effort, F2= Work Completion, F3= Academic Skill
Ability, F4= Competition, F5= Cooperation, F6= High Effort
Low Ability

43
Social Studies (£ = .49) and Science (£ = .38)
achievement scores, and TRAAM Total Score and Reading
(£ = .34), Language (£ = .46), and Social Studies (£ =
.39) achievement scores.
Pearson product-moment correlations (presented in
Table 3) revealed a significant relationship between
TRAAM Factors 1, 2, 3 and Total Score and Reading,
Language, Spelling, Math, Social Studies and Science
grades: £'s range from .42 to .64, .36 to .62, .44 to
.68, and .45 to .72 respectively. There was also a
relationship between TRAAM Factor 4 and Language (£ =
.34) and Spelling (£ = .43) grades.
Multiple Regression Analysis
TRAAM and AMS as predictors of SAT Scores.
When the TRAAM and the AMS were used as predictor
variables, the TRAAM proved to be a better predictor of
SAT scores than the AMS (See Table 4).
TRAAM Factor 3 was the best predictor of Reading
achievement scores and accounted for 15% of the
variance. The next best predictor of Reading
achievement scores was the TRAAM Factor 6 which
accounted for an additional 9% of the variance.
The two predictors combined accounted for 24% of the
variance in Reading achievement scores. No other variables
were statistically significant predictors of
Reading achievement scores.

44
Table 4
Regressions Predicting SAT Scores and Grades; TRAAM and AMS
as Predictors
SAT Reading
Steps/Predictors
TRAAM 3 .39
TRAAM 6 .50
SAT Listening
Steps/Predictors
ATTR .35
SAT Language
Steps/Predictors
TRAAM 3 .47
TRAAM 6 .55
SAT Math
Steps/Predictors
TRAAM 3 .41
SAT Soc. Sci.
Steps/Predictors
TRAAM 6 .49
TRAAM 3 .59
ATTR .64
R2
Adj
.15
.24
.12
.22
.30
.17
.24
.35
. 4 0
B2
change
.09
.08
.11
.05
F E Overall
F* to-enter
3.11 .003 9.67
2.59 .0005 8.70
2.74 .008 7.56
3.89 .0003 15.19
2.45 .0001 11. 32
3.30 .0017 10.89
4.15 .0001 17.19
2.95 .0000 14.17
2.21 .0000 11.77
45
Table 4 Continued
SAT Science
Steps/Predictors
TRAAM 6 .39 .15 3.07 .0033 9.44
TRAAM 5 .51 . 2 6 .11 -2.78 .0004 9.17
Reading Grades.
Steps/Predictors
TRAAM TS .48 .23 4.05 .0002 16.37
AMS TS .54 .30 .07 2.11 .0001 10.92
Language Grades
Steps/Predictors
TRAAM TS .72 .52 7.66 .0000 58.70
EFFIC .74 .56 .04 2.08 .0000 33.05
Spelling Grades
Steps/Predictors
TRAAM TS .53 .28 4.63 .0000 21. 44
TRAAM 6 .60 .35 .07 2.43 .0000 14.65
Math Grades
Steps/Predictors
TRAAM 1 .64 .41 6.11 .0000 37.38
Social St. Grades
Steps/Predictors
TRAAM 3 .59 .35 5.39 .0000 29.07
Science Grades
Steps/Predictors
TRAAM 1 .49 .24 4.11 .0000 16.92
46
Table 4 Continued
Note. RFT (AMS Reinforcement subscale), ATTRB (AMS
Attribution subscale), EFFIC (AMS Efficacy subscale), AMSTS
(AMS Total Score). TRAAM 1 (Mastery-Effort), TRAAM 2 (Work
Completion), TRAAM 3 (Academic Skill-Ability), TRAAM 4
(Competition), TRAAM 5 (Cooperation), TRAAM 6 (High Effort
Low Ability), TRAAM TS (Total Score).

47
TRAAM Factor 3 was the best predictor of Language
achievement scores and accounted for 22% of the variance.
TRAAM Factor 6 was the next best predictor of Language
achievement scores accounting for an additional 8% of the
variance. Combined the two factors accounted for 30% of the
variance in Language achievement scores. No other variables
were statistically significant predictors of Language
achievement scores.
TRAAM Factor 3 was also the best predictor of Math
achievement scores and accounted for 17% of the
variance. No other variables were statistically
significant predictors of Social Studies achievement scores.
TRAAM Factor 6 was the best predictor of Social Science
achievement scores and accounted for 24% of the variance.
TRAAM Factor 3 was the next best predictor of Social Science
achievement scores and accounted for an additional 11% of
the variance. AMS Attribution subscale was the third best
predictor of Social Studies achievement score accounting for
an additional 5% of the variance. Combined the three
predictors accounted for 40% of the variance in Social
Studies achievement scores. No other variables were
statistically significant predictors of Social Studies
achievement scores.
TRAAM Factor 6 was also the best predictor of Science
achievement scores, accounting for 15% of the variance.
TRAAM Factor 5 was the next best predictor of Science

48
achievement scores and accounted for an additional 11% of
the variance. The two predictors combined accounted for 26%
of the variance in Science achievement scores. No other
variables were statistically significant predictors of
Science achievement scores.
AMS Attribution subscale was the best predictor of
Listening achievement scores accounting for 12% of the
variance. No other variables were statistically significant
predictors of Listening achievement scores.
TRAAM, AMS, and OLSAT scores as predictors of SAT
scores. Using OLSAT scores, TRAAM factors, and AMS
subscales as predictors of SAT scores, OLSAT scores were the
best predictor of SAT scores. However, the TRAAM still
accounted for a significant portion of the variance in SAT
scores (See table 5) .
The OLSAT was the best predictor of Reading achievement
accounting for 36% of the variance. TRAAM Factor 6 and
Factor 4 were the next best predictors of Reading
achievement scores accounting for an additional 11% and 6%
of the variance. Combined the predictor variables
accounted for 52% of the variance. No other variables were
statistically significant predictors of Reading achievement.
The OLSAT was the best predictor of Listening
achievement scores accounting for 46% of the variance. No
other variables were statistically significant predictors of
Listening achievement scores.

Table 5
Regressions Predicting SAT Scores and Grades; TRAAM, AMS,
and OLSAT Scores as Predictors
SAT Reading
Steps/Predictors
OLSAT .59
TRAAM 6 .68
TRAAM 4 .72
SAT Listening
Steps/Predictors
OLSAT .68
SAT Language
Steps/Predictors
OLSAT .62
TRAAM 6 .69
TRAAM 1 .73
SAT Math
Steps/Predictors
OLSAT .66
B2
Adj
.36
.46
.52
.46
.38
.47
.53
.46
change to-enter
5.60 .0000
.10 3.30 .0000
.06 -2.48 .0000
6.90 .0000
5.91 .0000
.09 3.08 .0000
.06 2.73 .0000
6.86 .0000
Overall
.[*
31.14
23.76
19.37
47.71
34.96
24.82
20.94
47.00
49

50
Table 5 Continued
SAT Soc. Sci.
Steps/Predictors
OLSAT .54 .30 4.86 .0000 23.57
TRAAM 6 .70 .49 .19 4.51 .0000 26.05
AMS TS .73 .53 .04 2.11 .0000 19.95
SAT Science
Steps/Predictors
OLSAT .59 .34 5.43 .0000 29.45
TRAAM 6 .67 .46 .12 3.35 .0000 23.01
TRAAM 4 .71 .51 .05 -2.47 .0000 18.79
Reading Grades
Steps/Predictors
TRAAM TS .32 .10 2.61 .0114 6.81
AMS TS .40 .16 .06 2.03 .0057 5.64
Language Grades
Steps/Predictors
TRAAM TS .. 39 .16 3.33 .0015 11. 08
Spelling Grades
Steps/Predictors
TRAAM TS .36 .13 2.97 .0043 8.82
Math Grades
Steps/Predictors
TRAAM TS .39 .15 3.31 .0016 10.92

51
Table 5 continued
Social St. Grades
Steps/Predictors
TRAAM TS .35 .12 2.88 .0055 8.31
Science Grades
Steps/Predictors
TRAAM 1 .30 .09 2.45 .0173 5.99
Note. RFT (AMS Reinforcement subscale), ATTRB (AMS
Attribution subscale), EFFIC (AMS Efficacy subscale), AMSTS
(AMS Total Score). TRAAM 1 (Mastery-Effort), TRAAM 2 (Work
Completion), TRAAM 3 (Academic Skill-Ability), TRAAM 4
(Competition), TRAAM 5 (Cooperation), TRAAM 6 (High Effort
Low Ability), TRAAM TS (Total Score).
52
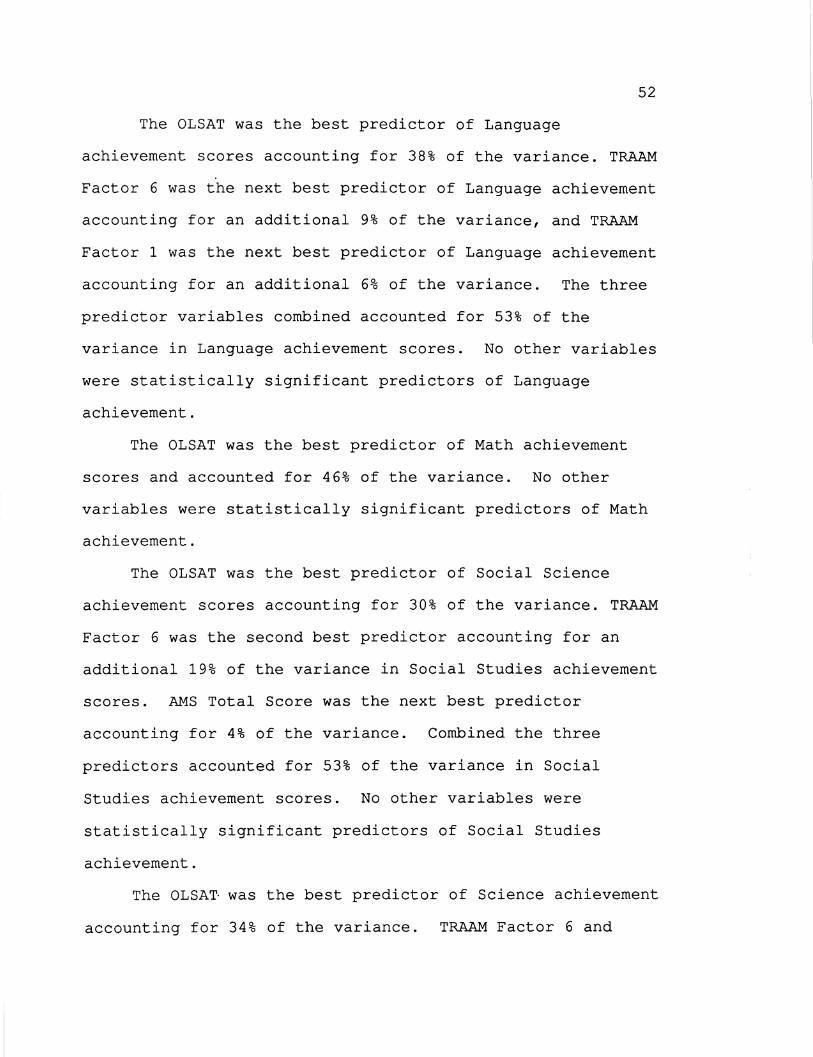
The OLSAT was the best predictor of Language
achievement scores accounting for 38% of the variance. TRAAM
Factor 6 was the next best predictor of Language achievement
accounting for an additional 9% of the variance, and TRAAM
Factor 1 was the next best predictor of Language achievement
accounting for an additional 6% of the variance. The three
predictor variables combined accounted for 53% of the
variance in Language achievement scores. No other variables
were statistically significant predictors of Language
achievement.
The OLSAT was the best predictor of Math achievement
scores and accounted for 46% of the variance. No other
variables were statistically significant predictors of Math
achievement.
The OLSAT was the best predictor of Social Science
achievement scores accounting for 30% of the variance. TRAAM
Factor 6 was the second best predictor accounting for an
additional 19% of the variance in Social Studies achievement
scores. AMS Total Score was the next best predictor
accounting for 4% of the variance. Combined the three
predictors accounted for 53% of the variance in Social
Studies achievement scores. No other variables were
statistically significant predictors of Social Studies
achievement.
The OLSAT· was the best predictor of Science achievement
accounting for 34% of the variance. TRAAM Factor 6 and

53
TRAAM Factor 4 accounted for an additional 12% and 5% of the
variance in Science achievement scores. The three predictors
combined accounted for 51% of the variance in Science
achievement scores. No other variables were statistically
significant predictors of Science achievement scores.
TRAAM, and AMS as predictors of grades. As previously
mentioned, the TRAAM was the best predictor of SAT scores
when the TRAAM and the AMS were used as predictor variables.
Additionally, when these same two instruments were used as
predictor variables, the TRAAM was also the best predictor
of grades (See Table 4) .
TRAAM Total Score was the best predictor of Reading
grades, accounting for 23% of the variance. AMS Total Score
was the next best predictor of Reading grades and accounted
for an additional 7% of the variance. Combined, the two
predictors accounted for 30% of the variance in Reading
grades. No other variables were statistically significant
predictors of Reading grades.
TRAAM Total Score was also the best predictor of
Language grades and accounted for 52% of the variance. AMS
Efficacy subscale was the second best predictor of Language
grades and accounted for an additional 4% of the variance.
The two predictors combined accounted for 56% of the
variance in Language grades.
TRAAM Total Score was also the best predictor of
Spelling grades, accounting for 28% of the variance. TRAAM

Factor 6 was the next best predictor of Spelling grades,
accounting for an additional 7% of the variance. Combined
the two predictors accounted for 35% of the variance in
Spelling grades. No other variables were statistically
significant predictors of Spelling grades.
54
TRAAM Factor 1 was the best predictor of Math grades,
accounting for 41% of the variance. No other variables were
statistically significant predictors of Math grades. TRAAM
Factor 1 was also the best predictor of Science grades and
accounted for 24% of the variance. No other variables were
statistically significant predictors of Science grades.
TRAAM Factor 3 was the best predictor of Social Studies
grades, accounting for 35% of the variance. No other
variables were statistically significant predictors of
Social Studies grades.
TRAAM, AMS, and OLSAT scores as predictors of grades.
Not only did the TRAAM account for a significant
portion of the variance in SAT scores when OLSAT scores were
in the equation, but the TRAAM was still the best predictor
of all grades (See Table 5) .
The TRAAM Total Score was the best predictor of Reading
grades accounting for 10% of the variance. AMS Total Score
was the next best predictor of Reading grades accounting for
an additional 6% of the variance. These predictor variables
combined accounted for 16% of the variance in Reading
grades. No other variables were statistically significant

predictors of Reading grades.
TRAAM Total Score was also the best predictor of
Language, Spelling, Math, and Social Studies grades and
accounted for 16%, 13%, 15%, 12% of the variance. No other
variables were statistically significant predictors of
Social Studies grades.
55
TRAAM Factor 1 was the best predictor of Math grades
accounting for 9% of the variance. No other variables were
statistically significant predictors of Math grades.
TRAAM, AMS, OLSAT scores, and SAT scores as predictors
of grades. When the TRAAM, AMS, OLSAT scores, and SAT
scores were used as predictor variables, the TRAAM was still
the best predictor of grades (See Table 6) .
TRAAM Total Score was the best predictor of Reading
grades accounting for 26% of the variance. The OLSAT was
the second best predictor of Reading grades accounting for
an additional 12% of the variance. AMS Efficacy subscale
was the next best predictor and accounted for 5% of the
variance. Combined the three predictor accounted for 43% of
the variance in Reading grades.
TRAAM Total Score was the best predictor of Language
grades accounting for 54% of the variance. Language
achievement score was the next best predictor of Language
grades accounting for an additional 9% of the variance.
TRAAM Total Score and Language achievement score combined
accounted for 63% of the variance in Language grades.

56
Table 6
Regressions Predicting Grades; TRAAM, AMS, OLSAT Scores, and
SAT Scores as Predictors
Overall
Adj change to-enter F*
Reading Grades
Steps/Predictors
TRAAM TS .51 .26 4.42 .0000 19.49
OLSAT .62 .38 .12 3.35 .0000 17.15
EFFIC .65 .43 .05 2.06 .0000 13.52
Language Grades
Steps/Predictors
TRAAM TS .73 .54 8.17 .0000 66.73
SAT LANG .79 .63 .09 3.64 .0000 47.17
Spelling Grades
Steps/Predictors
SAT LANG .42 .41 6.39 .0000 40.80
TRAAM TS .70 .50 .09 3.06 .0000 28.07
Math Grades
Steps/Predictors
TRAAM 1 .66 .44 6.59 .0000 43.54

57
Table 6 Continued
Social St. Grades
Steps/Predictors
TRAAM 3 .58 .34 5.41 .0000 29.27
OLSAT .64 .42 .08 2.60 .0000 19.54
Science Grades
Steps/Predictors
TRAAM 1 .48 .23 4.14 .0001 17.15
Note. RFT (AMS Reinforcement subscale), ATTRB (AMS
Attribution subscale), EFFIC (AMS Efficacy subscale), AMSTS
(AMS Total Score). TRAAM 1 (Mastery-Effort), TRAAM 2 (Work
Completion), TRAAM 3 (Academic Skill-Ability), TRAAM 4
(Competition), TRAAM 5 (Cooperation), TRAAM 6 (High Effort
Low Ability), TRAAM TS (Total Score). SAT LANG (SAT Language
score) .

58
SAT Language score was the best predictor of Spelling grades
accounting for 44% of the variance. TRAAM Total Score was
the next best predictor of Spelling grades and accounted for
9% of the variance. Combined the two variables accounted for
50% of the variance in Spelling grades. No other variables
were statistically significant predictors of Spelling
grades.
TRAAM Factor 1 was still the best predictor of Math and
Science grades accounting for 43% and 23% of the variance.
No other variables were statistically significant predictors
of Math and Science grades.
TRAAM Factor 3 was the best predictor of Social Studies
grades accounting for 34% of the variance. The OLSAT was
the next best predictor of Social Studies grades accounting
for an additional 8% of the variance. Combined the
predictors accounted for 42% of the variance in Social
Studies grades. No other variables were statistically
significant predictors of Social Studies grades.

CHAPTER 4
Discussion
Correlations Between TRAAM and AMS
59
The hypothesis that there would be significant
correlations between the ratings on the TRAAM and the AMS
was supported. The correlation between the TRAAM Total
score and the AMS Total Score was positive and significant
(£ = .26, E < .05}. While statistically significant, this
low correlation contributes little evidence for the
construct validity of these two scales. The TRAAM and the
AMS purport to measure the same construct (academic
achievement motivation} but differ in their theoretical
orientation. Therefore, the low correlations between the
TRAAM scores and the AMS scores may reflect this theoretical
difference. Low correlations between the TRAAM and the
AMS are consistent with previous findings. Wanat (1993}
reported moderate correlations between the AMS and the
CAIMI. Additionally, Stinnett and Oehler-Stinnett (1991}
reported that correlations among the TRAAM, SIEOC, and CAIMI
are small to moderate.
Correlations Between TRAAM, SAT Scores and Grades
Criterion related validity was supported through
Pearson product-moment correlations between the TRAAM
Factors and SAT scores, and between TRAAM Factors and
grades. The hypothesis that the TRAAM would be successful
at predicting group SAT scores was supported. Inspection of

60
the correlations reveals that Factors 1 (Mastery-Effort) and
3 (Academic Skill-Ability) appear to be important Factors on
the scale due to their significant relationship with the
standardized achievement scores across four of the six
subject areas. These two Factors both had significant low
to-moderate positive correlations with Reading, Language,
Math, and Social Studies achievement scores (£'S ranged from
.34 to .39, E < .01 and .41 to .46 E < .001). It is likely
that children who score higher on these Factors have higher
achievement scores. This is not surprising given that these
Factors reflect effort, and academic and cognitive skill.
It is expected that students who give good effort, and who
are bright will perform well on standardized tests of
achievement. Factor 3 had the highest correlations with the
areas of Reading, Language (£ = .39, .46, E < .01
respectively) and Math (£ = .41, E < .001) indicating that
on standardized tests of achievement, these subject areas
are affected by a child's cognitive and academic skill.
Factor 6 (High Effort-Low Ability) had the highest
correlation with Social Studies (£ = .49, E < .001)
indicating that on standardized tests of achievement, this
subject area is related to effort as opposed to ability.
There were no significant correlations between Factor 4
(Competition), Factor 5 (Cooperation) and any of the
achievement subject areas. Behaviors associated with being
either competitive or cooperative appear to have no

61
relationship with a child's performance on standardized
achievement tests. Additionally, there were no significant
correlations between any of the Factors with the Listening
and Science achievement score areas. Academic skills
manifested in the Listening and Science subtests of this
standardized achievement test appear to be unrelated to any
of the motivation-oriented behaviors reflected by the TRAAM.
The hypothesis that the TRAAM would be successful at
predicting grades was supported. Consistent with
correlations between the TRAAM and SAT scores, TRAAM Factors
4 (Competition) and 5 (Cooperation) were not related to
grades in any subject area. Competitive and cooperative
behaviors appear unrelated to the actual grade that a child
earns. Factors 1 (Mastery-Effort), 2 (Work Completion), 3
(Academic Skill-Ability), and the Total Score were related
to student grades in all subject areas (Reading, Language,
Spelling, Math, Social Studies, and Science). Correlations
ranged from .34 to .39, £ < .01 and .41 to .72, £ < .001.
Closer inspection reveals that the Total Score had the
highest correlation with Reading, Language and Spelling
grades, r =.48, .72, .53, E < .001 respectively. Children
who score high overall on the TRAAM and who posses many of
the achievement motivation-related behaviors reflect by the
TRAAM are likely to have good grades in these areas. TRAAM
Factor 1 (Mastery-Effort) has the strongest relationship
with Math and Science grades, r = .64, .49, E < .001

62
respectively. These two subject areas are usually
challenging to children in that they require a good amount
of reasoning skills, attention and concentration. It is not
surprising that there is a relationship between a child's
grades in these areas and his/her level of curiosity and
maintenance of effort when confronted with difficult tasks.
Factor 3 (Academic Skill-Ability) had the strongest
relationship with Social Studies grades, £ = .59, E < .01.
While a child's Social Studies achievement score seems
related to effort, a child's Social Studies grades appears
related to cognitive and academic skill.
The TRAAM was more strongly related to grades than SAT
scores. Higher correlations between the TRAAM with grades
than the TRAAM with standardized achievement scores are
expected and can be explained in terms of the fact that both
TRAAM scores and grades are based on teacher judgement.
Overall, the TRAAM is useful for predicting achievement
levels (both standardized scores and grades) of Hispanic
students.
TRAAM and AMS as Predictors of SAT Scores and Grades
Criterion-related validity was also strongly supported
through stepwise multiple regression analysis using the
TRAAM and the AMS as predictor variables. The hypothesis
that the TRAAM would be a better predictor of student's SAT
scores and grades than the AMS was supported. The TRAAM
outperformed the AMS in prediction of all SAT areas with the

63
exception of Listening achievement. Additionally, the TRAAM
outperformed the AMS in prediction of all grades.
Factors 3 (Academic Skill-Ability) and 6 (High Effort
Low Ability) appear to be very important Factors in
predicting achievement test scores. The recurrence of
Factors 3 and 6 in the prediction of SAT scores suggests
that on standa'rdized group achievement tests, bright
children will succeed as well as children who have low
ability yet remain motivated. Both Factors were good
predictors of Reading and Language achievement. Combined
with the AMS Attribution subscale, they were very strong
predictors of Social
Science achievement test scores. Factor 3 was a fair
predictor of Math achievement test scores with no other
Factor or AMS subscale contributing to the variance. This
indicates that cognitive and academic skill is important in
predicting Math achievement test scores. Factor 6 combined
with Factor 5 (Cooperation) were good predictors of Science
achievement test scores indicating that low-ability children
who remain cooperative and motivated do well in the area of
Science on standardized achievement tests.
TRAAM Total Score was the best predictor of Reading,
Language and Spelling grades. TRAAM Total Score combined
with the AMS Total Score were good predictors of Reading
grades indicating that teachers' overall perception of
achievement motivation combined with students' overall self-
I
l
64
perception of achievement motivation are good indicators of
anticipated Reading grades. TRAAM Total Score combined with
the AMS Efficacy subscale were very strong predictor of
Language grades indicating that teachers' perception of
achievement motivation combined with how a child feels about
his/her ability to master the environment are related to
grades in the area of Language. TRAAM Total Score combined
with Factor 6 (High Effort-Low Ability) were good predictors
of Spelling. This indicates that teachers' perceptions of
overall achievement motivation combined with their
perceptions of how well low-ability children are at
remaining motivated, are useful at predicting Spelling
grades.
Factor 1 (Mastery-Effort) was a strong predictor of
Math grades and a good predictor of Science grades with no
other Factors or AMS subscales contributing to the variance.
This indicates that children who maintain effort, are
curious, and approach new and challenging tasks will receive
good math grades. Interestingly, effort and mastery of
school-related demands (Factor 1) was meaningful in
predicting Math grades whereas cognitive and academic skill
(Factor 3) was meaningful in predicting Math achievement
test scores. As discussed previously, teacher perception of
student effort may have an influence on the grades they
assign.
Factor 3 was a good predictor of Social Studies grades

65
with no other Factors or AMS subscales contributing to the
variance. This suggests that academic and cognitive skill
is meaningful in predicting a child's Social Studies grades.
TRAAM, AMS, and OLSAT Scores as Predictors of SAT Scores and
Grades
Additional support for the criterion related validity
of the TRAAM was provided through stepwise multiple
regression analysis using the TRAAM, AMS, and the OLSAT as
predictors of SAT scores and grades. The hypothesis that the
TRAAM would be a significant predictor of SAT scores and
grades even with OLSAT scores included in the prediction
equation was supported. When the OLSAT was included with
the motivational variables, the TRAAM still accounted for a
significant portion of variance (15 to 19%) in SAT scores.
Additionally, with the OLSAT scores in the equation, the
TRAAM alone was the best predictor of grades. It is not
surprising that a standardized measure of ability (OLSAT)
would best predict standardized achievement scores (SAT),
and that teacher ratings of achievement motivation (TRAAM)
would best predict teacher assigned grades.
The OLSAT was the best predictor of all SAT subject
areas and was the only significant predictor of the Math and
Listening achievement test scores. However, with the
exception of Math and Listening achievement, Factor 6 (High
Effort-Low Ability) was consistently the second-best
predictor of achievement test scores. The OLSAT, Factors 6

L
and 4 (Competition) were very strong predictors of Reading
and Science achievement. OLSAT scores, Factors 6 and 1
(Master-Effort) were very strong predictors of Language
achievement. OLSAT scores, Factors 6 and the AMS Total
Score were very strong predictors of Social Science
achievement. This interesting pattern suggests that
cognitive ability is important, but it is not the only
meaningful variable in predicting achievement test scores.
A child's ability to try hard and put forth effort
(reflected in Factor 6), even when ability is lacking, is
also a crucial component of achievement test scores.
66
The current results suggest that in terms of the actual
grades that a child earns, the TRAAM Total Score alone was a
fair predictor of Language, Spelling, Math, and Social
Studies grades. The TRAAM Total Score and the AMS Total
Score were fair predictors of Reading grades, and TRAAM 1
(Mastery-Effor.t) was a fair predictor of Science grades.
The OLSAT was not a meaningful variable in predicting
achievement in terms of grades.
TRAAM, AMS, OLSAT Scores, and SAT Scores as Predictors of
Grades
The hypothesis that the TRAAM would be a significant
predictor of student grades, even with OLSAT scores and SAT
scores included in the prediction equation, was supported.
This also lends further support to the criterion related
validity of the scale. With the exception of Spelling

67
grades, the TRAAM was consistently the best predictor of all
grades.
TRAAM Total Score, OLSAT scores and AMS Efficacy were
strong predictors of Reading grades, suggesting that
motivation, ability and a feeling of efficacy are important
behaviors that predict Reading grades. TRAAM Total Score
and Language achievement scores were excellent predictors of
Language grades, and were strong predictors of Spelling
grades.
Factor 1 (Mastery-Effort) alone was a strong predictor
of Math grades, and a good predictor of Science grades.
Factor 1 has consistently shown up through the multiple
regressions as a predictor of Math and Science grades. It
appears that behaviors such as maintenance of effort,
curiosity and a desire to engage in challenging activities
are important in predicting grades in these subjects.
Factor 3 (Academic Skill-Ability) and OLSAT scores were
strong predictors of Social Studies grades indicating that
cognitive and academic skill is important in predicting
Social Studies grades.
Consistent with previous research, ability seems to be
an important predictor of academic achievement (Wanant,
1991). Based on her findings, Wanant (1991) concluded that
self-report measures of achievement motivation do not
meaningfully contribute to the explanation of achievement,
and that ability remains the strongest and clearest variable

68
in predicting academic achievement. However, results of
this study strongly support previous findings that indicate
that teachers' judgements of achievement motivation are
valid and useful ways to collect information concerning
academic achievement motivation (Stinnett, Oehler-Stinnett,
and Stout, 1990}. Additionally, the results of this study
indicate that the combination of teacher ratings of student
motivaation (TRAAM}, and ability (OLSAT}, is a crucial
component of predicting a child's achievement test scores.
Both of these variables must be taken into account when
explaining and predicting the achievement levels of a child.
Furthermore, when concerned with predicting the actual
grades that a child will earn, teachers' perceptions of
student motivation as apposed to cognitive ability, appears
to be the most important variable.
Based on the theoretical orientation of the TRAAM, it
is the intention of the authors to not only predict academic
achievement motivation, but to differentiate skill from
performance deficits (Stinnett, Oehler-Stinnett & Stout,
1990} . The results of this study suggest that the TRAAM is
useful at providing information about a student's overall
level of academic achievement motivation. Additionally, the
individual Factors appear useful in providing information
about a student's orientation toward academic achievement
motivation. It is quite possible that based on the scores
obtained on the TRAAM, educators will be able to determine
69
if low achievement is due to lack of motivation (performance
deficit), or a lack of knowledge acquisition (skill
deficit) . For example, high scores on the TRAAM Total Score
(reflective of motivated behavior) combined with continued
low academic achievement would imply that the student does
not have the skills to complete the academic work. Only
when a performance deficites is confirmed, it is appropriate
to approach problems in terms of academic achievement
motivation. This type of information is a crucial component
to any assessment. However, further factor analytic data is
needed to support this notion.
The TRAAM is currently recommended for research
purposes only (Stinnett & Oehler-Stinnett, 1991).
Limitations of this study support this recommendation,
especially in terms of using the scale with Hispanic
students. One limitation of this study is that the sample
small is very regionalized. Additionally, the Hispanic
students in this study are all English-proficient Mexican
American children. The majority of the children were born in
the United States. These facts do not allow
generalizability of the findings to other Hispanic children
(i.e. Puerto Rican, Cuban etc.), Hispanic children who have
limited English proficiency, and Hispanic children who are
foreign-born and/or have not become acculturated. Another
limitation of this study is that no exceptional children
were included in the sample. Furthermore, the sample was

not randomized; only students who were given permission to
participate were included in the study.
70
In spite of these limitations of this study, the TRAAM
is currently the only device that promises to be a reliable
and valid instrument for use in assessing academic
achievement motivation in Hispanic students. The results
of this study indicate that once norms for standard scores
are established the TRAAM will be an appropriate and
essential instrument for assessing motivation. School
psychologists may be able to use the scale to differentiate
between skill deficits and performance deficits in Hispanic
students, to identify Hispanic students who display low
academic achievement motivation, to predict future academic
success, to assist in intervention plans, and to measure the
treatment effects of intervention programs.
Based on the estimated growth rate of the Hispanic
population and the fact educators continue to struggle with
ensuring that they succeed, it is essential that we have the
means to properly assess academic achievement motivation in
Hispanic students.

References
Atkinson, J. (1964). An introduction to motivation.
Princeton, NJ: Van Nostrand.
Anderson, J. G., & Safar, D. (1971). The influence of
differential community perceptions on the provisions of
equal education opportunities. In N.N. Wagner, & M.J.
Haug, Chicanos: Social and psychological perspectives
(pp.244-252). St. Louis: C.V. Mosby Company.
Bandura, R. (1969). Principles of behavior modification.
New York: Holt, Rinehart, & Winston.
Bandura, R. (1977). Social learning theory. Eglewood
Cliffs, NJ: Prentice Hall.
71
Bandura, A. (1982). Self-efficacy mechanism in human agency.
American Psychologist, ~' 122-147.
Baral, D. P. (1977). Achievement levels among foreign-born
Mexican-American students. San Francisco CA: R & E
Research Associates.
Bracken, B. A. (1991). Achievement Motivation Scale.
Unpublished test, Memphis State University.
Bracken, B. A. (1992). [Achievement Motivation Scale
scores]. Unpublished raw data.
Carter, P. T., & Segura, R. D. (1979). Mexican Americans in
school: A decade of change. New York: College Entrance
Examination Board.

L
Cervantes, R. A., & Bernal, H. H. (1977) . Psychosocial
growth and academic achievement motivation in Mexican
American students. San Antonio, TX: Developmental
Associates.
72
Chamberlin, P., & Medinos-Landurand, P. (1991). Practical
considerations for the assessment of LEP students with
special needs. In E. V. Hamayan & J. S. Damico, Limiting
bias in the assessment of bilingual students (pp. 112-
155) . Austin, TX: Pro-ed.
Conoley, J. C., Kramer, J. J., Murphy L. L. (Eds.). (1989).
The tenth mental measurements yearbook. University of
Nebraska Press.
Cohen, R. J., Montague, P., Nathanson, L. S., Swerdlik, M.
E. (1988). Psychological testing: An introduction to
tests & measurement. Mountain View, California: Mayfield
Publishing Company.
Costantino, G. (1992) . Overcoming bias in the educational
assessment of Hispanic students. In K. F. Geisinger
(Ed.), Psychological testing of Hispanics (pp. 89-99).
Washington, DC: American Psychological Association.
Covington, M. V. (1984). The self-worth theory of
achievement motivation: Findings and implications. The
Elementary School Journal, 85(1), 5-20.

Das, J. P., Schokman-Gates, K., & Murphy, D. (1985). The
development of intrinsic and extrinsic motivational
orientation in normal and disabled readers. Journal of
Psychoeducational Assessment, i, 297-312.
73
Dweck, C. S., & Gilliard, D. (1975). Expectancy statements
as determinants of reactions to failure: Sex differences
in persistence and expectancy change. Journal of
Personality and Social Psychology, 32(6), 1077-1084.
Fayans, L. J., Maehr, M. L., Slili, F., & Desai, K. A.
(1983) . A cross-cultural exploration into the meaning of
achievement. Journal of Personality and Social
Psychology, ,ii, 1000-1117.
Figueroa, R. A. (1990) . Best practices in the assessment of
bilingual children, in A. Thomas & J. Grimes (Eds.), Best
Practices in School Psychology, Washington D.C.: National
Association of School Psychologists.
Figueroa, R. A., Sandoval, J., & Mereno, B. (1984). School
Psychology and limited-English-proficient children: New
competencies. Journal of School Psychology, 22, 131-144.
Geisinger, K. F. (1992). Fairness and selected psychometric
issues in the psychological testing of Hispanics. In K.
F. Geisinger (Ed.). Psychological testing of Hispanics
(pp. 17-43). Washington, DC: American Psychological
Association.
74
Gottfried, A. E. (1985). Academic intrinsic motivation in
elementary and junior high school students. Journal of
Educational Psychology, 11(6), 631-645.
Gottfried, A. E. (1988), Academic intrinsic motivation in
young elementary school children. Journal of Educational
Psychology, .f!l., 525-532.
Grossman, H. (1984). Educating Hispanic students.
Springfield, IL: Thomas Books.
Harter, S. (1978). Effectance motivation reconsidered:
Toward a developmental model. Human Development, 21, 34-
64.
Harter, S. (1981). A new self-report scale of intrinsic
versus extrinsic orientation in the classroom:
Motivational and informational components. Developmental
Psychology, 11.(3), 300-312.
Hernandez, N. G. (1973). Variables affecting achievement of
middle school Mexican-American students. Review of
Educational Research, 43, 1-39.
Hernandez, M. E., Nagel, R. J. (1993, April).
Methodological critigue of articles on Hispanics in
school psychology journals. Paper presented at the
National Association of School Psychologists annual
convention,. Washington DC.
Hirsch, E. D., Kett, J. F., & Trefil, J. (1988). The
Dictionary of Cultural Literacy. Boston: Houghton
Mufflin Company.

Humphreys, L. G. (1988). Trends in levels of academic
achievement of blacks and other minorities.
Intelligence, ~' 231-260.
Kagan, J. (1972). Motives and development. Journal of
Personality and Social Psychology, .££, 51-66.
Kagan, G., Zahn, L., & Gealy, J. (1977). Competition and
school achievement among Anglo-American and Mexican
American children. Journal of Educational Psychology,
.2.2,(4), 432-441.
Maehr, M. L. (1974). Culture and achievement motivation.
American Psychologist, 29, 87-97. Maehr, M. L. (1974).
Sociocultural origins of achievement. Montery, CA:
Brooks/Cole Publishing Company.
75
McClelland, D. C. (1965). Toward a theory of motive
acquisition. American Psychologist, lQ., 321-333.
McClintock, c. G. (1974). Development of social motives
in anglo-american and mexican-american children. Journal
of Personality and Social Psychology, 29(3), 348-354.
Phillips, R., Stinnett, T. A., & Oehler-Stinnett, J. J.
(1992) . Test-retest reliability of the Teacher Rating of
Academic Achievement Motivation (TRAAM) . Unpublished
master's thesis, Eastern Illinois University,
Charleston.
Smith, C. P. (1969). Achievement-related motives in
children. New York: Russell Sage Foundations.

Stevenson, H. W., Chen, C., & Uttal, D. H. (1990).
76
Beliefs
and achievement: A study of Black, White, and Hispanic
children. Child Development, .§1., 508- 523.
Stinnett, T. A., Oehler-Stinnett, J. J. (1991). Validation
of the Teacher Rating of Academic Achievement Motivation.
Journal of Educational Psychology, lQ, 276-290.
Stinnett, T. A., & Oehler-Stinnett, J. J. (1993). Teacher
Rating of Academic Achievement Motivation. Unpublished
test, Eastern Illinois University, Charleston.
Stinnett, T. A., & Oehler-Stinnett, J. J. (1993). Purpose
of the TRAAM and scale description. Unpublished
manuscript, Eastern Illinois University, Charleston.
Stinnett, T. A., Oehler-Stinnett, J. J., & Stout, L. J.
(1990) . Development of the Teacher rating of Academic
Achievement Motivation: TRAAM. School Psychology Review,
£Q., 609-622.
Stout, L. J., Stinnett, T. A., & Oehler-Stinnett, J. J.
(1993, April) . Derived factors of the Teacher Rating of
Academic Achievement Motivation: TRAAM-50. Paper
presented at the National Association of School
Psychologists annual convention, Washington DC.
Wanat, M. (1993). The combined roles of achievement
motivation and intelligence in the explanation of
academic achievement. Unpublished master's thesis,
Memphis State University, TN.

77
Wagner, M. J., Powers, S., & Irwin, P. (1985). The
prediction of achievement motivation using performance
and attributional variables. The Journal of Psychology,
119, 595-598.
Weiner, B. (1979). A theory of motivation for some
classroom experiences. Journal of Educational
Psychology, l, 3-25.
Weiner, B. (1985). Achievement motivation and attribution
theory. New Jersey: General Learning Corporation.
White, R. W. (1959). Motivation reconsidered: the concept
of competence. Psychological Review, ~' 297-331.
White, K. R. (1982) . The relation between socioeconomic
status and academic achievement. Psychological Bulletin,
21 (3), 461-481.
Willig, A. C., Harnish, D.L., Hill, K. T., & Maehr, M. L.
(1983) . Sociocultural and educational correlates of
success-failure attributions and evaluation of anxiety in
the school setting for Black, Hispanic, and Anglo
children. American Educational Research Journal, £Q.,
385-410.