e- cloud machine studies-systematic study of single bunch tunes i. pinger timing effect on single...
TRANSCRIPT

e- Cloud Machine Studies-Systematic Study of Single Bunch Tunes
I. Pinger timing effect on single bunch tunesII. Vertical/horizontal pinger high voltage effect on single bunch tunesIII. Vertical/horizontal feedback amplitude dependence on single bunch tunesIV. Vertical/horizontal tune setting dependence on single bunch tunes
These results are from measurements made by G. Dugan, J. Calvey, M. Palmer, and R. Holtzapple on 10/29/2008.

I. Pinger timing-Varied the pinger timing in thirteen steps and measured the tunes twice at each step•The vertical tune shift along the 10 bunch train did not change over this timing scan.•The spectrum peak amplitude did not change over this timing scan. •Our step size is either too course/fine or we did not adjust the correct timing signal. We must try this again in January.

II. Vertical pinger high voltage adjustment-Varied the vertical pinger high voltage from 204cu to 20cu in six steps and measured the tunes twice at each step•The vertical tune shift along the 10 bunch train does not vary with the pinger HV.•At the lower voltage settings the tune was not detected for several bunches.

Vertical spectrum for 10 bunch trains at six different vertical pinger high voltage settings.• Spectrum peak changed with pinger amplitude as expected.
HV=204cu HV=100cu HV=46cu
HV=30cu HV=20cu HV=73cu

Movie (click to start) of the vertical spectrum for bunches 1-10 at the six vertical pinger settings (sequence 204, 100, 46, 30, 20, 73cu).• The vertical tune shifts along the 10 bunch train at each pinger amplitude.
Movie (click to start) of the vertical position at the beam position monitor for bunch 1-10 at the six vertical pinger settings (sequence 204, 100, 46, 30, 20, 73cu).• The vertical amplitude dependence with pinger amplitude.

Horizontal pinger high voltage adjustment -Varied the horizontal pinger high voltage from 150cu to 100cu in three steps and measured the tunes twice at each step•The horizontal tune along the 10 bunch train does not vary with the pinger high voltage.•At the 100cu voltage settings the tune signal was weak.
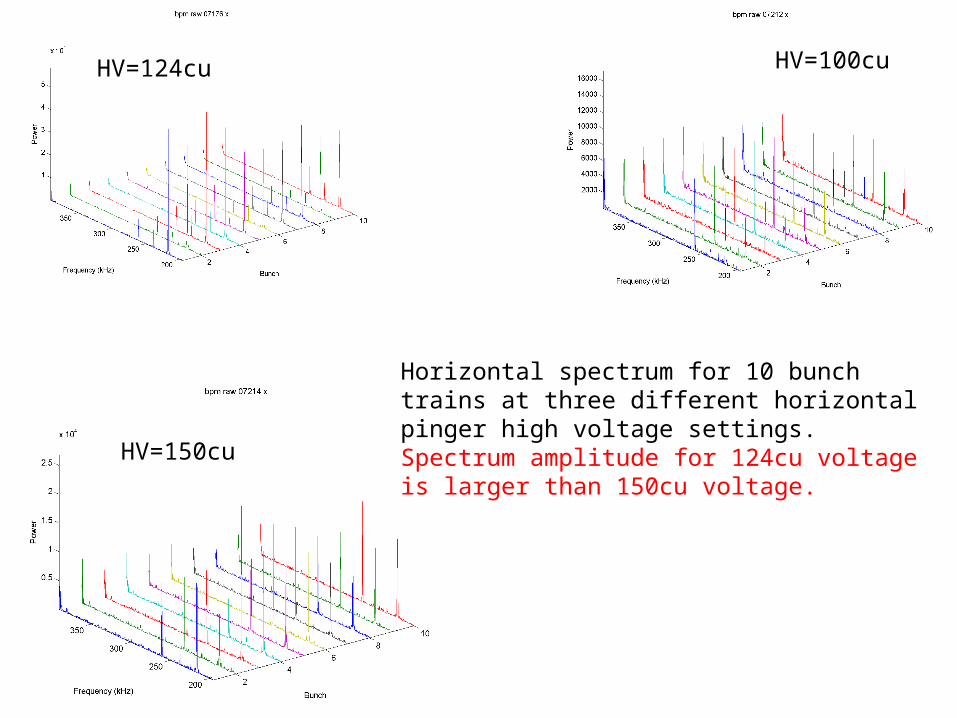
HV=124cu HV=100cu
HV=150cu
Horizontal spectrum for 10 bunch trains at three different horizontal pinger high voltage settings. Spectrum amplitude for 124cu voltage is larger than 150cu voltage.

Movie (click to start) of the horizontal spectrum for bunches 1-10 at the three horizontal pinger settings (sequence 124, 100, 150cu).• There is no horizontal tune shift along the train.
Movie (click to start) of the horizontal position at the beam position monitor for bunch 1-10 at the three horizontal pinger settings (sequence 124, 100, 150cu). • Horizontal amplitude is greater at 124cu than 150cu setting-confirms spectrum amplitude difference.

III. Vertical feedback adjustment -Varied the vertical feedback amplitude from -1000cu to 0cu (off) in five steps and measured the vertical tune twice at each step. The vertical pinger HV was set to 69cu at each feedback setting.•The vertical tune shift along the 10 bunch train does not vary with vertical feedback.

Vertical spectrum for 10 bunch trains at five vertical feedback amplitude settings.• The vertical spectrum increases as the feedback amplitude is reduced.
Vert. feedback@-1000cu Vert. feedback@-500cu
Vert. feedback@-250cu Vert. feedback@-100cu Vert. feedback@0cu

Movie (click to start) of the vertical spectrum for bunches 1-10 at the five vertical feedback settings (sequence -1000, -500, -250, -100, and 0cu). • Notice the vertical tune shift along the train.• The width of the tune signal increases near the end of the 10 bunch train.
Movie (click to start) of the vertical position at the beam position monitor for bunches 1-10 at the five vertical feedback settings (sequence -1000, -500, -250, -100, and 0cu). • Vertical amplitude increases as the feedback amplitude is reduced. A vertical instability is noted when the vertical feedback is turned off (the vertical amplitude does not damp).

Horizontal feedback adjustment -Varied the horizontal feedback amplitude from 1000cu to 0cu (turned off) in four steps and measured the horizontal tune twice at each step. The horizontal pinger high voltage was set to 150cu at each feedback setting.•The horizontal tune along the 10 bunch train does not vary much along the train by varying the horizontal feedback.

Horizontal spectrum for 10 bunch trains at five vertical feedback amplitude settings.• The horizontal spectrum peak increases as the feedback amplitude is reduced.
Horz. feedback@1000cu Horz. feedback@500cu
Horz. feedback@250cu Horz. feedback@0cu

Movie (click to start) of the horizontal spectrum for bunches 1-10 at the four horizontal pinger settings (sequence 1000, 500, 250, and 0 cu).• There is no horizontal tune shift along the train.• The peak spectrum signal increases as the feedback amplitude is reduced.
Movie (click to start) of the horizontal position at the beam position monitor for bunch 1-10 at the four horizontal feedback settings (sequence 1000, 500, 250, and 0cu). • When the horizontal feedback is turned off, several of the bunches appear to be horizontally unstable.

IV. Horizontal Tune Scan-Measured the horizontal tune ate five different tune locations. The vertical feedback was set at -500cu and the vertical tune was set to ~237kHz.•No large variation in the horizontal tune shift was measured at the different tune locations.

Qx=216kHz Qx=225kHz
Qx=231kHz Qx=220kHz Qx=205kHz
Horizontal spectrum for 10 bunch trains at the five different tune settings.• The horizontal spectrum amplitude changes depending on the horizontal tune location. Near 231kHz, sidebands pop up near the horizontal tune.

Movie (click to start) of the horizontal spectrum for bunches 1-10 at the five different horizontal settings (sequence 216, 225, 231, 220, and 205kHz).• There is no horizontal tune shift along the train at any of the tune settings.• A signal in the spectrum appears at ~238kHz when the tune is set to 231kHz.
Movie (click to start) of the horizontal position at the beam position monitor for bunch 1-10 at the five different horizontal settings (sequence 216, 225, 231, 220, and 205kHz).• The horizontal amplitude varies along the ten bunch train at several of the tune settings.

Vertical Tune Scan-Measured the vertical tune at three different tune locations. The vertical feedback was set at -500cu and the horizontal tune was at 217kHz.•At each tune setting, a vertical tune shift along the 10 bunch train is measured.

Vertical spectrum for 10 bunch trains at the three different tune settings.• The vertical spectrum amplitude changes depending on the vertical tune location.
Qy=237kHz Qy=228kHz
Qy=245kHz

Movie (click to start) of the vertical spectrum for bunches 1-10 at the three different horizontal settings (sequence 237, 228, and 245kHz).• A vertical tune shift along the train is denoted at each tune settings.• The width of the tune signal increases for bunches near the end of the 10 bunch train.
Movie (click to start) of the vertical position at the beam position monitor for bunch 1-10 at the three different vertical settings (sequence 237, 228, and 245kHz).• The vertical amplitude varies along the ten bunch train at several of the tune settings.