dynamics of hydraulic properties of puddled soils
TRANSCRIPT

2
Dynamics of Hydraulic Properties of Puddled Soils
K. B. Singh Krishi Vigyan Kendra, Moga
Punjab Agricultural University, Ludhiana India
1. Introduction
Rice-wheat system has emerged as the dominating cropping system in South and South East
Asia and Indo-Gangetic plains, because of favourable soil and climatic factors, suitable high
yielding varieties, subsidized resource availability in terms of power and fertilizers and
remunerative support purchase prices backed by the procurement system. The
sustainability of this system in many areas is threatened by the rising water table and
salinization, declining water tables and deterioration of both the chemical and the physical
fertility of soil. Chemical fertilizers, appropriate tillage operations and addition of organic
amendments supplement the low nutrient supplying capacity of the soil and can maintain
favourable soil physical conditions. But there is no substitute of water for crop production.
Rice being grown under submerged conditions requires high amount of irrigation water. In
India, about 50% of the total irrigated area is under rice cultivation and hence, 50% of
irrigation water is used for rice crop. On an average, farmers apply 32 irrigations to rice in
Indian Punjab and assuming each irrigation to be of 7 cm, a total of 224 cm water is
required. In many areas of Punjab and Haryana in India withdrawal of ground water
exceeds its recharge which leads to lowering of ground water table. In central Punjab having
good quality ground waters, the areas with water table below 10 m depth increased from 3%
in 1973 to 76% in 2002 (Hira et al. 2004). Eighty percent area of the Punjab state is facing a
rapid decline in water table which is quite alarming to the sustainability of the rice
production. Competing demands of water for domestic use, sanitation, industrial and
recreational purposes also make it all the more essential to maximize the efficiency of water
for crop production. Since, rice is the lowest productive crop per unit of water consumed
amongst cereals, therefore, optimum water management and cultural practices need to be
followed to ensure minimum losses of water. In India, about 15000 liters of water is used for
the production of one kg of rice (Sharma 1992). This low water use efficiency is because of
high (55 to 80 percent) water losses through deep percolation (Singh, 1998). Though
percolation is gain to water table but high amount of energy is required for lifting the
underground water to meet irrigation requirements of rice - wheat system. Singh et al (1990)
has shown that irrigation consumes the maximum energy in farm operations for both rice
(82%) and wheat (38%). Therefore, water and energy are main elements for the sustainability
of the rice-wheat system. Hence, to maintain desired yield levels while conserving the scarce
www.intechopen.com

Hydraulic Conductivity – Issues, Determination and Applications
30
water resources and to make the system energy efficient, it is essential to increase the
productivity of rice and wheat per unit of water use. This can be achieved by curtailing the
unproductive water losses such as evaporation and deep percolation. Soil evaporation can
be manipulated by varying irrigation scheduling in wheat and staggering the date of
transplanting of rice to the period of lower climatic evaporative demand (Singh et al, 2001).
Most popularly, the deep percolation of water is controlled by manipulating hydraulic
properties of soils through puddling.
2. Mechanism of puddling
Puddling (a most common method of land preparation for transplanting of rice seedlings) is associated with the soil disturbance through tillage operations, at or near saturation soil moisture content. The puddling tillage usually comprises one or two ploughing to a depth of 0.15 m and two or more harrowings and a final leveling. In puddling process the soil is submerged under standing water to promote soil chemical reduction, reduce soil mechanical strength and hence reduce the force and energy required for the puddling tillage. Two forces are applied to the soil during the puddling: one is ploughing to loosen and break clods in soils and the other is compaction of the sub-soil due to machinery used for tillage. Puddling leads to break down of soil aggregates into ultimate micro aggregates and individual particles forming a muddy suspension having dispersed fine particles. The degree of dispersion is dependent on the structural stability of the soil. Different research workers have shown that as compared to unpuddled, in puddled soils about 40 % of the aggregates were completely broken down to fractions less than 0.05 mm and all the aggregates were smaller than coarse sand (Naphade and Ghildyal, 1971). Due to differential settling the larger particles of soil in the suspension settle first and the finer ones later. Therefore, the sand fraction settles first from the muddy water and gradually is covered by finer silt and clay, resulting in a thin layer of low permeability due to clogging of macro pores at the surface. The thickness of the layers depends on the original texture. In sandy soils, the clay cover is thin. In fine clay soils there may be no coarse layer. In medium textured mineral soils stratification is well developed, with a fine textured surface layer a few mm thick that overlies 1-2 cm of almost pure sand (Moorman & Van Breemen, 1978).The clogging process is similar to filtration. Three mechanisms may be involved in filtration including surface clogging (large soil particles fail to pass through pore and deposit on the soil surface area), strain filtration (soil particle moves into pore space and is retarded by shear stress among other particles) and physical-chemical filtration (soil particle adsorbed onto the particle surface by surface reaction). If the soil texture is not uniform and contains a certain amount of clay particles, it is easy to develop plough sole by strain and physical-chemical filtrations. A Japanese study showed that the upper 0-15 mm of the puddled layer is composed of fine particles, the middle layer is thin and porous with sandy shingles, and the lowest layer is massive without particle differentiation (Saito and Kawaguchi, 1971). Closely packed parallel particles in puddled soils reduce saturated hydraulic conductivity (Singh et al 2001). The amount of dispersed clay or silt +clay increases with increasing puddling energy applied. Bodman and Rubin (1948) suggested the term puddlability, a measure of susceptibility of soil to puddling, to mean the change in apparent specific volume of soil per unit work extended in causing such change. From a farmer point of view, puddling is mixing soil with water to make it soft for transplanting and impervious to water. The ease and degree of puddling depend on moisture content, soil
www.intechopen.com

Dynamics of Hydraulic Properties of Puddled Soils
31
type, tillage implement, and cultural practices. Maximum puddling occurs at moisture content between field capacity and saturation. High clay content facilitates puddling. Soils with predominantly kaolinitic clay are more difficult to puddle than those with montmorillonitic clay (Sharma and De Datta, 1985). The sodium saturated clays are easier to puddle than calcium saturated clays owing to their dispersed nature in the former type of soil. During the puddling operation the soil layer just below the puddled soil is stamped down by the puddling equipment. This causes crushing and blocking of the pores in the lower unpuddled layer and results in reduction of saturated hydraulic conductivity. A portion of clay fraction from the surface puddled horizon is also deposited as clay-skins along pore surfaces at the top fringe of the compacted unpuddled subsurface layer. These processes reduce macro pore volume in the upper portion of the soil profile while increasing the bulk density in the compacted, anthropogenic subsurface horizon that is alternately termed the plough sole or tillage pan or hardpan. The formation of hardpan in the subsoil below the puddled layer is variable in different soils. It may take 3 to 200 years for a hardpan to form depending on soil type, climate, hydrology and puddling frequency (Moormann and van Breeman, 1978). Subsurface hardpans develop from physical compaction and precipitation of Fe, Mn and Si (Sharma and De Datta, 1985). This hardpan has lower saturated hydraulic conductivity. The non-puddled subsoil beneath this less permeable layer usually has a higher hydraulic conductivity and consequently there can be non-saturated subsoil flow in conjunction with saturated flow in the puddled and compact layers. Therefore a typical soil profile of a puddled rice soil consists of a (i) ponded water layer, (ii) a muddy layer with little resistance to water flow, (iii) a compacted hard layer with large resistance to water flow and (iv) non puddled subsoil with high saturated conductivity having unsaturated flow of water.
3. Effect of puddling on soil hydraulic properties
Puddling results changes in porosity and pore size distribution of the soil. Therefore water
retention and movement under saturated and unsaturated conditions are highly affected by
puddling.
3.1 Soil water retention
Puddling decreased pores >30 µm (transmission pores) by about 83% and increased pores of 0.6-30 µm (storage pores) and < 0.6 µm (residual pores) by 7% and 52% respectively (Sharma and De Datta, 1985). Eliminating non capillary pores in puddled soils usually lowers water retention for potentials above -0.01 MPa. At lower potentials (-0.01 to -1.5 MPa) water retention in puddled soils was more than non-puddled soils (Gupta et al, 1984). Water retention at lower (-0.01 to -1.5 MPa) potentials in puddled soils always exceeds than that of non-puddled soils depending on soil texture and initial aggregation (Taylor 1972 and Yunsheng 1983). The change in water status is defined by the difference between the previous and the current water contents in the paddy system when all the inflows and outflows have been accounted for. It is therefore, the residual amount of water in the paddy system, which can be positive or negative. Mohanty et al. (2003) reported that at harvest, on the average, the puddled soil maintained 25% more water than the unpuddled one. Puddling markedly increases soil water retention in soils, dominated by 2 : 1 swelling clays and the effect was less in soils dominated by kaolinitic clays (Sanchez 1973). Increase in water retention of 0-15 cm soil depth with puddling has also been reported by Sur et al
www.intechopen.com

Hydraulic Conductivity – Issues, Determination and Applications
32
(1981). Puddling increases the water-holding capacity of soils because of compaction, settling, and flocculation of dispersed clay particles (Sharma and De Datta, 1985). The dispersion of soil aggregates during puddling destroys macro pore volume within soil aggregates (Moorman and van Breemen, 1978). Puddling changes the water content-tension relationship with more easy-to-extract water being available in puddled soils. Measurements of water-release characteristics showed that puddling increased storage porosity from 6 to 16 % and residual porosity from 34 to 43 % at the expense of transmission porosity, which declined from 26 to 4 % (Painuli et al 1988).
Porosity contributed to the 5-15 cm layer by pores wider than 30 µm (regardless of shape)
was decreased by roto tiller puddling under standing water, and the number of pores per
standard area were proportionally more affected (Pagliai et al ., 1987). The distribution of
porosity among pores of different shapes and sizes in the 0-5 cm layer of puddled soil
showed that elongated pores dominated the porosity, though they were in fact fewer in
number. Porosity was less in puddled than in non-puddled soil in all shape categories in 0-
20 cm, but below 20 cm there was no statistical or practical difference. Effect of puddling on soil water retention depends upon climate, soil texture, soil depth,
intensity of tillage, use of green and farmyard manures and crop residues incorporated into
the soil.
3.1.1 Climate, texture and soil depth
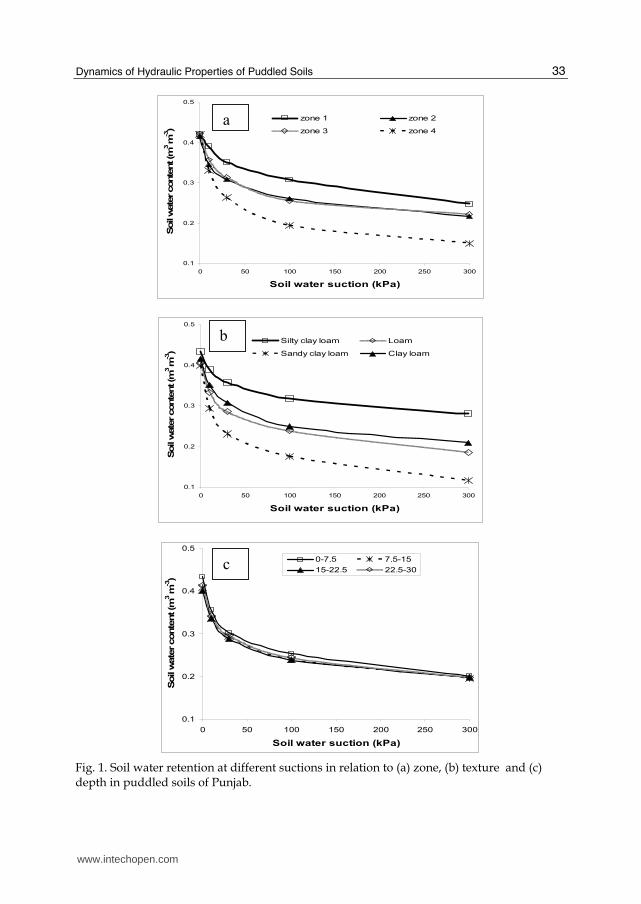
Water retained by different soils at varying suctions in the four agro climatic zones of
Punjab where puddling has been continuous from more than 15 years is reported by Singh
et al (2009). Water retention was higher in zone 1(undulating sub region), followed by zone 2
(piedmont alluvial plains) and zone 3 (central alluvial plains) and least in zone 4
(southwestern alluvial plains) (Figure 1a). These trends are in accordance with amount of
organic carbon (OC) and silt + clay contents. More the silt + clay and OC content in the soil,
more will be water retention at a given level of suction. The textural class of silty clay loam
retained more water at all the suctions which were followed by clay loam, loam and sandy
clay loam soils (Figure 1b and ‘a’ values of soil moisture content (θ) vs. suction (Ψ) relations
in Table 1). More water retention in fine textured soils is due to more micro as well as total
porosity.
Soil texture θ vs. Ψ
a B R2
Sandy clay loam 0.3028 0.0035 0.83
Loam 0.3384 0.0022 0.82
Clay loam 0.3538 0.0020 0.80
Silty clay loam 0.3919 0.0012 0.81
Soil Depth (cm)
0-7.5 0.3602 0.2132 0.81
7.5-15 0.3415 0.2054 0.80
15-22.5 0.3365 0.1965 0.79
22.5-30 0.3455 0.2051 0.80
Table 1. Parameter’s of the equation y = a exp b θ, θ vs. Ψ.
www.intechopen.com
Dynamics of Hydraulic Properties of Puddled Soils
33
0.1
0.2
0.3
0.4
0.5
0 50 100 150 200 250 300
Soil water suction (kPa)
Soil w
ate
r conte
nt (m
3 m
-3)
zone 1 zone 2
zone 3 zone 4
0.1
0.2
0.3
0.4
0.5
0 50 100 150 200 250 300
Soil water suction (kPa)
Soil w
ate
r conte
nt (m
3 m
-3)
Silty clay loam Loam
Sandy clay loam Clay loam
0.1
0.2
0.3
0.4
0.5
0 50 100 150 200 250 300
Soil water suction (kPa)
Soil w
ate
r conte
nt (m
3 m
-3)
0-7.5 7.5-15
15-22.5 22.5-30
Fig. 1. Soil water retention at different suctions in relation to (a) zone, (b) texture and (c) depth in puddled soils of Punjab.
a
b
c
www.intechopen.com
Hydraulic Conductivity – Issues, Determination and Applications
34
Water retention in different layers showed that water retention was highest in 0-7.5 cm soil layer and lowest in 15-22.5 cm soil layers at all the suctions applied viz. 1, 3, 10 and 30 k Pa as shown in Figure 1c and ‘a’ values of (θ) vs. (Ψ) relations Table 1. More volumetric water content in 0-7.5 cm soil layer may be attributed to its higher OC which improves aggregation status of the soil and hence its water retention capacity. Lowest water retention in 15-22.5 cm soil layer was due to its lower porosity (caused by more compaction) and OC contents as compared to other layers.
3.1.2 Intensity of tillage Yoshida and Adachi (2002) studied the influence of puddling intensity on the water retention characteristics of a clayey paddy soil. Low intensity (one time puddling, P1), medium intensity (two time puddling, P2) and high intensity puddling (three time puddling, P3) were compared. They observed that at the surface layer (0-4 cm), the water content increased over the whole range of suction and the increment of water content at a suction of 100 kPa depended significantly on puddling intensity. Moisture content was reduced linearly with time (Mausavi et al 2009). The line slope for P0 treatment (no puddling) is more than P1, P2 and P3. This shows that unpuddled soil dried faster than puddled soils. Ten days after puddling, soil moisture was reduced by 11.4, 8.3, 5.2 and 5.1 % respectively in P0, P1, P2 and P3 treatments. This may be attributed to the greater proportion of pore volume occupied by micro pores in the puddled soils. The effect of puddling intensity on water retention in soil was significant up to a suction of 90 kPa (in laboratory study) and up to 500 kPa in field study. Soil moisture retention in P1 is much higher than P2
but P2 is not very much different from P3 treatment. Higher number of micro pores in highly puddled soil is an important factor. Puddled soils dry more slowly than unpuddled soils, probably because of higher unsaturated hydraulic conductivity of puddled soils can keep surface soil wet during evaporation by supplying water from lower layers. Also because of increased water retention at a given suction, more energy is required to evaporate the same amount of water from a puddled soil than from an unpuddled soil. Thus a puddled soil may take several weeks or even months to dry and reach workable moisture content (Gupta and Jaggi, 1979).
3.1.3 Organic manures Singh et al (2000) studied the effect of incorporation of green manure (Sesbania rostrata) @ 10.4 Mg ha-1 and farmyard manure (FYM) @ 6.5 Mg ha-1 on dry weight basis before rice transplanting in combination with 100% recommended NPK for 3 years in silty loam soil. They found that in 0-15cm soil layer, water retained at field capacity in green manured plots increased from 28.36% (100% NPK alone treatment) to 30.87%, and in FYM treated plots to 32.33%, when measured after harvest of wheat crop. Tiwari et al (2000) reported that incorporation of green manure (Sesbania rostrata) before puddling of loam soil for 2 years along with 50% recommended N increased the water holding capacity of the soil from 36.45% (initial) to 37.10%, when measured after harvest of rice crop. Biswas et al (1970) in a 10-year study on alluvial sandy loam soil found that, incorporation of green manure (equivalent to 45kg N ha-1) increased water retention from 14.4 % to 18.0% at 33 kPa tension. However, at 1500 kPa tension increase was very small i. e. from 3.8% to 4.6%.
3.1.4 Residue incorporation
Pandey et al (1985) studied the water retention of the soil at 33 kPa suction in rice residue management experiment. It was 23.2% in control treatment, and increased to 26.3% in rice
www.intechopen.com

Dynamics of Hydraulic Properties of Puddled Soils
35
straw incorporation treatment and up to 26.8% in wheat straw incorporation treatment, when measured at harvest of succeeding wheat crop. Under all treatments, water content decreased abruptly up to 20 kPa suction and beyond this value decrease in water content was gradual. Bhagat and Verma (1991) in a 5-year study on silty clay loam soil found that straw incorporation @ 5Mg ha-1 plus farmyard manure treatment retained the highest, whereas in control and straw burnt the lowest water content, at all suction values between 0 and 1500 kPa. At 33 and 1500 kPa, the straw incorporation plus farmyard manure treatment had about 0.055 m3 m-3 and 0.030 m3 m-3 higher water content, respectively, compared to the control and straw burnt. The straw incorporation alone treatment had intermediate water retention compared to the above two sets of treatments, at all the suction values.
3.2 Saturated hydraulic conductivity In puddled soil some soil physical characteristics which determine water conductivity are the total porosity, the distribution of pore sizes and the pore geometry of the soil. Thus structural destruction due to puddling may not be of much important in reducing water flux through the soil. Saturated hydraulic conductivity (Ks) is a quantitative measure of ability of saturated soil to transmit water under the hydraulic head difference. It defines the linear relationship between flux and hydraulic gradient. So it is the slope of line showing relationship between flux and hydraulic gradient. If the same hydraulic gradient is applied to two different soils, the soil from which the greater quantity of water is collected/discharged, is more conductive means have more flow rate. Mostly sandy soils yield higher flux (i.e. more conductive) than the clayey soils. Saturated hydraulic conductivity is affected by soil and fluid properties. It depends on the soil pore geometry as well as the fluid density. Flux is numerically equal to Ks only when the hydraulic gradient is equal to one. Flux is a dependent variable & hydraulic gradient is the driving force (i.e. independent variable) and Ks is the proportionality constant that defines the relationship between two. Puddling altered the nature of water flow, particularly in silty clay loam (Fig. 2). At lower hydraulic gradients the specific discharge versus hydraulic gradient curve does not remain a straight line, hence Darcy Law does not hold good under puddled conditions. However, as the gradient exceeds 1, the relationship assumes the form of a straight line. It therefore seems that puddling induces non-Darcian flow at lower hydraulic gradients. Evidently in puddled fine-textured soils a critical hydraulic gradient must exist beyond which the water flux is Darcian and before which it remains non-Darcian (Fig. 2). Since puddling reduces the non-capillary pore spaces, a closer packing of soil particles results in higher bulk density. Reduction on the pore volume, in turn, decreases the hydraulic conductivity and free percolation of water. Studies on laterite sandy loam soils indicated that hydraulic conductivity of a field puddle decreased from 0.192 to 0.054 cm h-1, causing a reduction of 72 % from the unpuddled soil. Climate, soil texture, depth and intensity of puddling, bulk density, type of implement used for puddling, structural regeneration, organic manures applied and crop residue incorporation into the puddled soil etc determine the effect of puddling on soil hydraulic properties.
3.2.1 Climate
Saturated hydraulic conductivity of sandy clay loam soil (Fig 3) generally decreased from agro climatic zone 2 to zone 4 in soil depths because of changes in temperature which resulted into decrease of organic carbon content in the surface soil layers and increase in the
www.intechopen.com

Hydraulic Conductivity – Issues, Determination and Applications
36
y = 0.047x - 0.1406
R2 = 0.9538
0
0.05
0.1
0.15
0.2
0.25
0.3
0.35
0.4
0 2 4 6 8 10 12
Gradient
Flu
x (
x1
0-2
cm h
-1)
Fig. 2. Relationship between flux and gradient in puddled silty clay loam soil.
0
20
40
60
80
100
120
140
160
Zone-2 Zone-3 Zone-4
Sa
tura
ted
hy
dra
uli
c co
nd
uct
ivit
y
( x
10
-2 c
m h
-1)
0-7.5 cm7.5-15 cm15-22.5 cm22.5-30 cm
Fig. 3. Saturated hydraulic conductivity of sandy clay loam.
bulk density of subsoil layers (Singh et al, 2009). Hence better puddling for reducing water flux is difficult to achieve in the soil having high organic carbon leading to high structural stability index. Therefore, the high content of organic matter increases resistance of the soil to puddling. Dominance of loam and sandy clay loam textures in agro climatic zone 2 of Punjab compared to other zones resulted in significantly higher Ks (Table 2). Amongst the textural class, saturated hydraulic conductivity was significantly more in sandy clay loam due to more sand content in the soil (66 per cent) than other classes, where it ranged from 31-55 per cent. Saturated hydraulic conductivity was more in the surface soil (due to more organic carbon and less bulk density) and it decreased with depth and was lowest in 15-22.5 cm soil layer, where bulk density and organic carbon were having reverse trend than the surface soil (Singh et al, 2009).
www.intechopen.com

Dynamics of Hydraulic Properties of Puddled Soils
37
Variables Saturated hydraulic conductivity (mm h-1)
Agro climatic Zones Zone 1 0.77a
Zone 2 4.32b
Zone 3 1.77a
Zone 4 1.06a
Textures Silty clay loam 1.05a
Loam 2.06a
Sandy clay loam 4.85b
Clay loam 1.38a
Soil depths 0-7.5 cm 4.2a
7.5-15 cm 2.02b
15-22.5 cm 1.20b
22.5-30 cm 1.91b
Rows having different letters are significantly different
Table 2. Averaged effects of agro climatic zones, textures and soil depths on saturated hydraulic conductivity.
3.2.2 Soil texture The decrease in hydraulic conductivity due to puddling was greater in sandy loam and clay loam soils than in clay soil (Mambani et al., 1989). Thus the benefits of puddling as well as dynamics of pan formation are dependent on soil type. Adachi (1990) reported that with the same intensity of puddling in clayey soils the downward flow rate declined slowly compared to coarse textured soils. In coarse textured soils, flow rate after puddling declined quickly with soil consolidation. In medium textured soils, decrease in flow rate just after puddling was caused by the consolidation in the lower part of the mixed layer and filling of that layer by fine particles. Then from series of field and laboratory studies, Adachi (1992) concluded that depth of least permeable layer and its formation mechanism due to puddling depended upon texture of the soil (Table 3). For fine textured soils, the most important mechanism for decreasing percolation rate was the blocking of layer just below the puddled soil by fine dispersed particles. In medium textured soils the decrease in percolation rate is because of increased bulk density at the lower part of puddled layer. In coarse textured soils the reduction is mainly due to a very clayey layer formed in the top 0-1, 2 cm of puddled layer. A large reduction in Ks of puddled soil was due to the disaggregation induced by puddling. The greater the soil dispersion, the lower is the Ks. High clay content facilitates puddling. Soils with predominantly kaolinitic clay are more difficult to puddle than those with montmorillonitic clay. The sodium saturated clays are easier to puddle (owing to their dispersed nature) than the calcium saturated clays. Saturated hydraulic conductivity was exponentially related with silt content in both silty clay loam(y =2238e-
0.1616X, r2=0.8469) and sandy clay loam (y = 355.18 e-0.1858X, r2 = 0.86) soils of Punjab (Singh, K.B, Personnel Communication).
3.2.3 Depth and intensity of puddling
The resistance to water flow, as evidenced by specific discharge, was increased in all the
soils following puddling. The reduction in specific discharge (cm h-1) after first puddling
varied from 6 to 10 times at different hydraulic gradients in sand. In sandy loam it was
small, especially at lower gradients. In silty clay loam soil the reduction was marginal. The
www.intechopen.com

Hydraulic Conductivity – Issues, Determination and Applications
38
Soil layers
Saturated hydraulic conductivity (cm sec-1)
Heavy clay Clay loam Loamy sand
Initial 4x10⁻² 4x10⁻³ 1x10⁻²
Upper part of puddled layer
2x10⁻⁶ 2x10⁻⁵ 4x10⁻⁴
Lower part of puddled layer
2x10⁻⁷ 2x10⁻⁶ 3x10⁻³
Just below the puddled layer
8x10⁻⁸ 2x10⁻⁶ 1x10⁻²
Lower layer 4x10⁻⁶ 3x10⁻⁴ 1x10⁻²
Table 3. Effect of soil texture on saturated hydraulic conductivity (cm sec-1).
second puddling was less effective than the first in reducing specific discharge except in
sandy loam soil where the second puddling might have resulted in more uniform sealing of
pores. The results of the third puddling were not any different from the second. The amount
of dispersed clay or silt + clay increased with increasing puddling energy applied (Bakti et
al 2010). Saturated hydraulic conductivity decreased rapidly when the soil was puddled
with only 50-100 Joule energy input. When the soil is puddled with greater energy (100-200
Joule) however, the additional reduction in Ks was small. Sharma and Bhagat (1993)
reported that greater the depth of puddling, the smaller is the hydraulic head gradient
across the puddled soil layer and hence smaller is the water flux. They further found that
puddling was effective in decreasing water permeability of soils, if their sand content was
less than 70% and the finer fraction was dominated by clay (13-20%). On texturally different
soils about 95% reduction in flux due to per unit increase in puddling depth was explained
by the linear function of clay content of the soil. At a given puddling depth, the relative
water flux (flux of puddled/non puddled) decreased exponentially with the increase in clay
content, the effect was more pronounced at greater puddling depths. They also reported
that relatively shallower puddling depth was required in fine textured soils. Effect of
intensity of puddling was also found to be significant on hydraulic conductivity. With
increased level of puddling there was breakdown of natural aggregates due to which the
apparent specific volume of soil decreased which in turn decreased its hydraulic
conductivity (Naphade and Ghildyal 1971). Saturated hydraulic conductivity was highest
with the moldboard treatment followed by that with mouldboard + puddling and
conventional tillage treatments (Akhtar and Qureshi, 1999). Saturated hydraulic
conductivity of the native profile, which represented by conventional tillage was 3.0 cm day-
1 in the 0-20 cm layer, 1.2 cm day-1 in 20-35 cm layer and 0.7 cm day-1 in 35-75 cm layer
whereas the corresponding values of saturated hydraulic conductivity for deep tilled plots
were 7.6, 4.1 and 1.4 cm day-1 respectively. Puddling after mouldboard resulted in
reduction in saturated hydraulic conductivity to the level of conventional tillage.
Saturated hydraulic conductivity of 0-20 cm layer was 3.0, 1.0 and 0.1 mm h-1 under deep
tillage, deep tillage+ puddling and conventional tillage treatments respectively. Singh et al
(2001) have found that increase in puddling intensity substantially decreased Ks in puddled
layer in sandy loam and silty clay loam soils. Generally Ks was more in the surface layers
and decreased with soil depth down to 25 cm depth with minimum at 15-20 cm (Table 4).
www.intechopen.com

Dynamics of Hydraulic Properties of Puddled Soils
39
Texture & Soil depth (cm)
Saturated hydraulic conductivity
LSD(0.05) No puddling
Puddling 2 times with disc harrow
Puddling 4 times with disc harrow
Sandy loam 0-5 7.7(0.6) 1.0(0.58) 0.5(0.12) 2.1 5-10 5.3(1.84) 1.0(0.09) 0.9(0.02) 1.8
10-15 2.5(0.42) 0.8(0.20) 0.7(0.08) 1.0 15-20 2.3(0.89) 0.7(0.18) 0.4(0.17) 1.2 20-25 2.2(0.13) 1.1(0.10) 1.0(0.27) NS 25-30 1.3(0.54) 1.3(0.54) 1.3(0.54) NS
Silty clay loam 0-5 5.2(0.60) 1.1(0.18) 0.8(0.39) 1.4 5-10 2.1(0.72) 1.0(0.05) 0.4(0.04) 0.8
10-15 1.6(0.19) 0.8(0.20) 0.4(0.10) NS 15-20 0.8(0.43) 0.7(0.07) 0.4(0.20) NS 20-25 1.0(0.28) 1.0(0.28) 0.4(0.08) NS 25-30 1.1(0.78) 1.1(0.78) 1.1(0.45) NS
Figure in parenthesis are standard deviation from mean based on 18 replications.
Table 4. Effect of puddling intensity on laboratory measured saturated hydraulic conductivity (cm day-1).
Saturated hydraulic conductivity was significantly decreased with puddling intensity in all
layers upto 20 cm depth in sandy loam and upto 10 cm depth in silty clay loam. The less
effect of puddling (upto 10 cm) in decreasing Ks in silty clay loam soil is due to less depth of
puddling compared to sandy loam (Table 4). The decrease in Ks with puddling levels was
more in surface layers (0-20 in sandy loam and 0-15 in silty clay loam) compared to lower
layers. In 0-5 cm soil layer Ks decreased 7.7 times with P2 (two time puddling) and 15.4
times with P4 (Four time puddling) in sandy loam and 4.7 times with P2 and 6.5 times with
P4 in silty clay loam respectively, compared to P0 (unpuddled control). However differences
in Ks between P2 and P4 were non significant on both soils, throughout the profile (0-30 cm).
The decrease in Ks with puddling levels in due to closely packing of soil particles in parallel
orientation because of differential settling, and breakage of soil aggregates and elimination
(sealing) of non capillary pores responsible for water transmission through soils (Sharma
and De Datta, 1985 and Adachi, 1992).
3.2.4 Bulk density
Since puddling reduces the non-capillary pore spaces, a closer packing of soil particles results in high bulk density. Reduction in the pore volume i.e increase in dry bulk density, in turn, decreases the saturated hydraulic conductivity of water. Studies on laterite sandy loam soils (Naphade and Ghildyal, 1971)indicated that hydraulic conductivity of field puddle decreased from 0.192 to 0.054 cm h-1, causing reduction of 72% from the unpuddled soil. The apparent specific volume (reciprocal of bulk density) decreased from 0.714 to 0.591 cm3 g-1 and hydraulic conductivity from 0.192 to 0.019 cm h-1 when the soil was puddled with 0 to 2.700 watt hour energy input. The decrease in the apparent specific volume and saturated hydraulic conductivity with decreased degree of puddling was remarkable
www.intechopen.com

Hydraulic Conductivity – Issues, Determination and Applications
40
initially. However, the magnitude of decrease in hydraulic conductivity exceeded the apparent specific volume. The apparent specific volume and the hydraulic conductivity of the field puddle were 0.615 cm3 g-1 and 0.054 cm h-1 respectively. The reduction in the apparent specific volume and the hydraulic conductivity of field puddle when compared with the unpuddled soil was 13.9 and 71.9 percent respectively. These values were closely related to those observed for the soil puddle with 0.450 watt hour indicating that puddling the soil to this energy in the laboratory represented field puddle. The results of apparent specific volume and Ks under different degrees of puddling were correlated significantly. The coefficient of correlation (r=0.9292 ) was significant at 5 percent level and the regression of apparent specific volume (X) on the hydraulic conductivity (Y) was: Y=6.17 X-3.41. An empirical relationship (Ks= 0.3266 bd-0.1404) was established between bulk density(bd)
and hydraulic conductivity (Ks) (Behra et al, 2009). As bulk density increased hydraulic
conductivity decreased but at higher bulk density the rate of decrease of hydraulic
conductivity was low. The correlation coefficient (R2 = 0.7821) was found significant at 5 %
level of significance. Singh, K.B (Personnel Communication) has observed a linear
relationship between bulk density and saturated hydraulic conductivity (Table 5). Increase
in bulk density has resulted linear decrease in Ks.
Soil texture a b R2
Silty clay loam 108.88 60.799 0.904
Clay loam 213.54 112.55 0.893
Loam 521.59 285.87 0.834
Sandy clay loam 554.88 303.81 0.881
Table 5. Saturated hydraulic conductivity (x10-2 cm h-1) as function of bulk density (Mg m-3) (Ks = a – b (Bulk density) in texturally different soils.
3.2.5 Type of implement used for puddling
Tyagi et al (1975) found that in loamy sand soil puddling with power tiller having a
rotovator resulted in the maximum reduction in saturated hydraulic conductivity when
compared with puddling with local plough, the control. The value of hydraulic conductivity
was 0.1971×10⁻² cm h-1 in puddling with power tiller compared to 2.871×10⁻² cm h-1 with
local plough. When compared with control the reduction in hydraulic conductivity was 76%
with power tiller, 74 % with tractor having cage wheel, 34.6% with disc-harrow and only
18% with mould-board plough. Minimum hydraulic conductivity of 0.257 mm hr-1 was
found in case of two passes of peg type puddler which was significantly lower than that of
one pass of peg type puddler (0.315 mm hr-1) but statistically at par with one pass of rotary
puddler (0.270 mm hr-1) at 30 days after puddling (Behra et al 2009). At 60 days after
puddling, there was no appreciable variation in hydraulic conductivity over that of 30 days
after puddling. The hydraulic conductivity depends upon the amount and size of coarse
pores (transmission pores) in the soil. Saturated hydraulic conductivity was significantly
reduced due to puddling by angular bladed puddler followed by disc harrow, mould board
plough and deshi plough and no puddling treatment (Rane and Varade 1972). All the
treatments differ significantly from each other with respect to hydraulic conductivity. The
percent reduction in hydraulic conductivity over control was 84.87, 74.44, 63.17 and 51.4
percent under angular bladed puddler, disc harrow, mould board plough and deshi plough.
www.intechopen.com

Dynamics of Hydraulic Properties of Puddled Soils
41
3.2.6 Structural regeneration
Wetting/ drying cycles are known to improve the soil structure. Results clearly showed reduction in the amount of silt+clay (<20µm) and clay (<2 µm) dispersed during wetting/drying cycles in clay and sandy loam soil increased Ks (Bakti et al, 2010). Repeated wetting/drying cycles to air dry water contents increased Ks of the puddled soil significantly in the fine textured soil but had little effect on the sandy soil. However in the fine textured soil the recovery of Ks was not significant. This improvement was partly the consequences of rapid wetting. Rapid wetting causes partial slaking by inducing micro-cracks and these micro cracks has the effect of making the soil easily crumbled. The degree of drying has a strong effect on the structural regeneration shown by the decrease in silt+clay. The hydraulic conductivity increases with time after puddling due to regeneration of soil structure through reflocculation of dispersed clays (Pagliai et al, 1990) and greater roots proliferation (Prathapar et al, 1989). However, Tyagi et al (1975) reported that on loamy sand the hydraulic conductivity was higher at the time of puddling and there was a general decrease in its value after 25 and 50 days of transplanting. This decrease in hydraulic conductivity with time was attributed to the sealing effect caused by the settlement of finer particles in course of time.
y = 0.0009x2 - 0.0696x + 3.4095
R2 = 0.7447(No puddling)
y = 0.0005x2 - 0.0402x + 1.7136
R2 = 0.6485 (Two puddling)
y = 0.0003x2 - 0.0173x + 0.7582
R2 = 0.6717(Four puddling)
0
0.5
1
1.5
2
2.5
3
3.5
4
1 6 11 16 21 26 31 36 41 46 51 56 61 66 71 76 81
Days after transplanting
Sat
ura
ted
hy
dra
uli
c co
nd
uct
ivit
y
(cm
da
y-1
)
No puddling Two puddling Four puddling
Fig. 4. Effect of puddling on in situ saturated hydraulic conductivity of sandy loam.
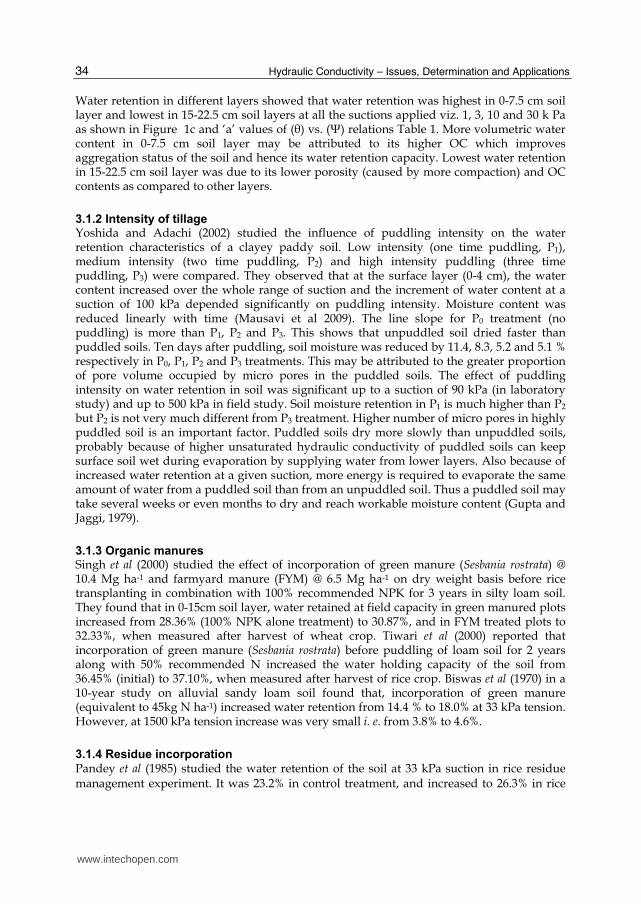
In field conditions saturated hydraulic conductivity (of the puddled 0-20 cm layers) of sandy loam (Fig 4) at 1 day after transplanting(DAT) was 3.8, 2.1 and 1.3 cm day-1 under unpuddled (P0), 2 time puddled(P2) and 4 time puddled(P4) treatments respectively which decreased to almost half after 15 days of transplanting in all puddling treatments. In silty clay loam (Fig 5) the corresponding values of saturated hydraulic conductivity were 2.9, 1.8 and 1.7 cm day-1 which decreased to 2.0, 1.1 and 0.9 cm day-1 in P0, P2 and P4 treatments after 28 DAT (Singh and Manchanda, 2008). This was because of more time taken for settling of clay particles dispersed in suspension during puddling and then clogging of the pores in the top layers and consolidation of the lower layer in silty clay loam. During puddling of silty clay loam, more clay in suspension takes more time for settling. In the fine textured soil, the soil consolidation development slowly from the lower part of the mixed (puddled) layer to the upper part and consequently, the Ks was slowly reduced. However, within the
www.intechopen.com
Hydraulic Conductivity – Issues, Determination and Applications
42
coarse textured soil, the Ks after puddling was quickly reduced with the settling and the settlement rate was approximately constant. Thus it was considered that the soil settlement phenomenon was sedimentation without soil consolidation (Adachi 1992). In sandy loam (> 50 DAT ) and silty clay loam (> 60 DAT), the daily steady water intake rate increased gradually with the increase in root growth in all puddling treatments (Singh and Manchanda, 2008).
y = 0.0009x2 - 0.0693x + 3.3998
R2 = 0.7368 (No puddling)y = 0.0005x2 - 0.0402x + 1.7136
R2 = 0.6485 (Two puddling)
y = 0.0003x2 - 0.0172x + 0.7539
R2 = 0.6695 (Four puddling)
0
0.5
1
1.5
2
2.5
3
3.5
4
1 6 11 16 21 26 31 36 41 46 51 56 61 66 71 76 81
Days after transplanting
Satu
rate
d h
yd
rau
lic
con
du
ctiv
ity
(cm
day
-1)
No puddling Two puddling Four puddling
Fig. 5. Effect of puddling on in situ saturated hydraulic conductivity of silty clay loam.
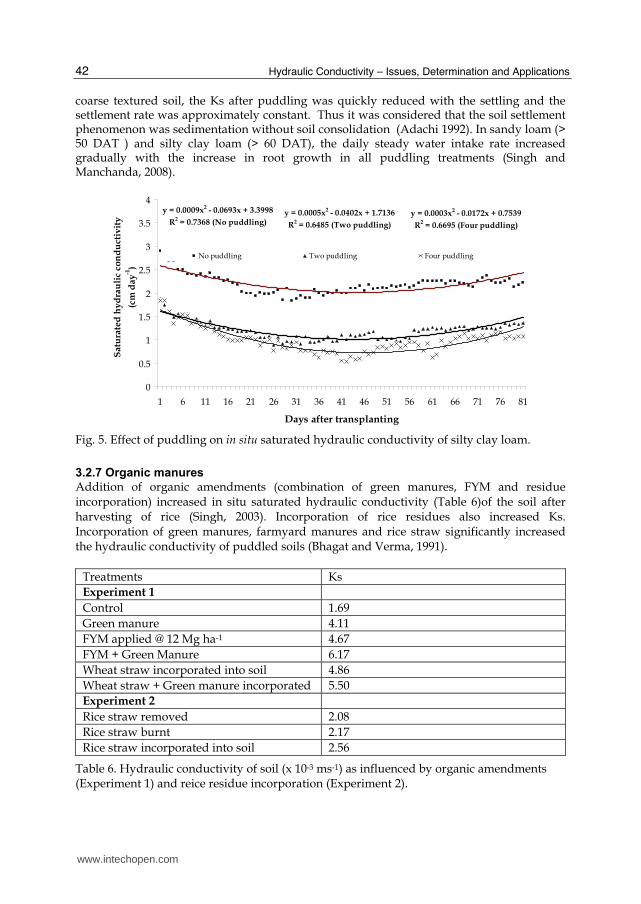
3.2.7 Organic manures
Addition of organic amendments (combination of green manures, FYM and residue incorporation) increased in situ saturated hydraulic conductivity (Table 6)of the soil after harvesting of rice (Singh, 2003). Incorporation of rice residues also increased Ks. Incorporation of green manures, farmyard manures and rice straw significantly increased the hydraulic conductivity of puddled soils (Bhagat and Verma, 1991).
Treatments Ks
Experiment 1
Control 1.69
Green manure 4.11
FYM applied @ 12 Mg ha-1 4.67
FYM + Green Manure 6.17
Wheat straw incorporated into soil 4.86
Wheat straw + Green manure incorporated 5.50
Experiment 2
Rice straw removed 2.08
Rice straw burnt 2.17
Rice straw incorporated into soil 2.56
Table 6. Hydraulic conductivity of soil (x 10-3 ms-1) as influenced by organic amendments (Experiment 1) and reice residue incorporation (Experiment 2).
www.intechopen.com

Dynamics of Hydraulic Properties of Puddled Soils
43
3.3 Unsaturated hydraulic conductivity
For the estimation the retention and movement of water under unsaturated conditions, the knowledge of relationship between soil water pressure, water content and hydraulic conductivity is required. Soil moisture characteristics curve obtained through pressure plate apparatus can be fitted to the desired soil water retention model. Once the retention function is estimated, the hydraulic conductivity and moisture content relationship can be evaluated if the saturated hydraulic conductivity is known. Unsaturated hydraulic conductivity k(θ) as represented by constant ‘b’ of the equation type k(θ) = a exp bθ, increased with fineness of the textural class (Singh et al, 2009). Similarly, higher unsaturated conductivity was observed in 15-22.5 cm soil layer (having high bulk density) as compared to other layers irrespective of the soil texture (Table 7). Wind (1961) also reported higher unsaturated conductivity in finer textured soils in the dry moisture range due to higher micro porosity.
Soil texture K(θ ) vs. θ a (x 10-7) b R2
Sandy clay loam 70 39.33 0.96
Loam 0.8 46.70 0.98
Clay loam 0.1 49.00 0.98
Silty clay loam 0.001 56.28 0.99
Soil Depth, cm
0-7.5 2 42.84 0.99
7.5-15 0.4 48.30 0.98
15-22.5 0.006 52.83 0.98
22.5-30 0.4 47.35 0.98
Table 7. Parameter’s of the equation, y = a exp b θ, for K (θ) vs. θ
Wopereis et al (1992) found that unsaturated flow conditions prevail in the non-puddled subsoil. The least permeable layer within the profile, as determined by the greatest gradient in pressure head was found to be at the interface of puddle topsoil (0-15 cm) and non-puddled subsoil. Average thickness of this layer was about 5 cm. Hydraulic conductivity of the least permeable layer was 0.36 mm day-1 with 95 % confidence limits at 0.27 and 0.45 mm day-1. Unsaturated downward flow of water prevails below the subsoil layer (15-60 cm) having restriction to water. Unsaturated hydraulic conductivities decreased by 3 to 4 orders of magnitude as the soil matric potential decreased from near zero to -700 cm (Hundal & De Datta 1984). The lowest unsaturated hydraulic conductivity was found in the 45-60 cm soil depth. The differences in conductivities observed in different layers are resulted from differences in the pore size distribution of various layers An equation of the form:
K(h)= a(h)b
where ‘h’ represents the soil matric potential in absolute cm, described the K versus h
relation with best fit (Table 8). The power function gave the best fit.
Puddled soils dry more slowly than unpuddled soils probably because the higher
unsaturated hydraulic conductivity of puddled soils can keep surface soil wet during
evaporation by supplying water from lower layers. Also because of increased water
retention at a given suction, more energy is needed to evaporate the same amount of water
www.intechopen.com

Hydraulic Conductivity – Issues, Determination and Applications
44
from puddled than from an unpuddled soil. Thus a puddled soil may take several weeks or
months to dry and to reach workable moisture content.
Soil depth (cm) a b R2
0-15 6.398 x 10³ -2.287 0.95
15-30 1.498 x 101 -1.360 0.92
30-45 0.742 -1.005 0.95
45-60 0.509 -1.104 0.70
60-75 1.175 -1.037 0.87
75-90 1.624 -1.056 0.87
Table 8. Coefficients a and b in the text equation (K(h)= a(h)b )for different soil depths.
3.4 Preferential flow
If clay soils dry long enough, the soft mud cracks and dries to a stiff paste. When the soil floods again, the cracks do not completely close as a result of partial swelling of clays and may cause preferential flow of water and nutrients. Bypass flow may continue unabated until puddling seals the cracks. Introducing discontinuities in soil cracks by shallow surface tillage (0-5 cm) after the first monsoon rain reduced bypass flow and resulted in 45-60 % water savings, thus increasing the retention of water within the topsoil and within the bunded field (Woperis, 1993).
4. Summary
Puddling increases micro porosity of soil which in turn results increase in water retention at lower potentials than unpuddled soils depending on soil texture, initial aggregation. Water retention in puddled soils is in accordance with amount of organic carbon and silt plus clay content. Silty clay loam soil retained more water than, clay loam, loam and sandy clay loam soils at all suctions. Incorporation of green and farm yard manures, rice and wheat straw also increased water retention. Saturated hydraulic conductivity decreased with decrease in organic carbon and increase in bulk density of soil. The decrease in hydraulic conductivity due to puddling was greater in sandy loam and clay loam soils than in clay soil. Increase in depth and intensity of puddling significantly reduced saturated hydraulic conductivity. Reduction in water flux is directly linked with clay content of soil. Increase in bulk density of soil significantly reduced saturated hydraulic conductivity. However with repeated wetting and drying cycles and addition of organic amendments, the soil structure regenerates which results in increase in saturated hydraulic conductivity. Puddling results in close packing of soil particles which increases soil dry bulk density and unsaturated hydraulic conductivity.
5. Future strategies
Quantitative understanding of the puddled soil system and of the influence that soil
management can have on water fluxes and water conservation, would be advanced if the
effect of puddling on the hydraulic conductivity of various layers is better defined. Similarly
in the simulation of rice production crop-water relations and soil water transmission are
crucial components. Many soil-water simulations assume one-dimensional (vertical) water
www.intechopen.com

Dynamics of Hydraulic Properties of Puddled Soils
45
flow through a succession of soil layers, and the hydraulic conductivities of such layers are
needed as parameters in the simulation. Soils with 25-50 % clay in the topsoil and a similar
or somewhat higher clay percentage in the subsoil produce the highest rice yields (Grant,
1965). Therefore, more understanding on soil hydraulic fluxes is required for the
development of mechanistic water flow models to simulate root water uptake and yield
response for increasing water use efficiency of puddled rice system.
6. References
Adachi, K. (1990). Effects of rice-soil puddling on water percolation. In: Proceedings of the
Transactions of the 14th International Congress of Soil Science, Kyoto, Japan, pp.
146-151.
Adachi, K (1992) Effect of puddling on rice soil physics : Softness of puddled soil and
percolation. In: Murty, V.V.N., Koga K. (Eds.). Soil and Water Engineering for
Paddy Field Management. Proceedings of the International Workshop on Soil and Water
Engineering for Paddy Field Management. Asian Institute of Technology, Bangkok, pp.
220-231
Akhtar, M.S. and Qureshi, S. (1999). Soil hydraulic properties and rice root development as
influenced by tillage. Pakistan J. Biological Sci. 2(4):1245-1251
Bakti, L.A.A., Kirchhof, G. and So, H.B. (2010). Effect of wetting and drying on structural
regeneration of puddled soil. Proceedings of 19th World Congress of soil Science,
Soil Solutions for changing World, 1-6 Agust 2010, Brisbane, Australia, Published
on DVD, pp, 17-20.
Behera, B.K, Varshney, B.P, and Goel , A.K. (2009). Effect of puddling on puddled soil
characteristics and performance of self propelled transplanter in rice crop.
Agricultural Engineering International: the CIGR Ejournal, Vol. X. Manuscript PM
08 020, September, 2009.
Bhagat, R. M. and Verma, T. S. (1991) Impact of rice straw management on soil physical
properties and wheat yield. Soil Science 152 (1): 108-14.
Biswas, T. D., Roy, M. R. and Sahu, B. N. (1970) Effect of different sources of organic
manures on the physical properties of the soil growing rice. J Indian Soc Soil Sci 18
(3): 233-42.
Bodman, G.B and Rubin, J. (1948) Soil Puddling. Soil Sci. Soc. Amer. Proc. 13: 27-36
Grant, C. J. (1965). Soil characteristics associated with wet cultivation of rice. In: The mineral
nutrition of the rice plant. Proceedings of a symposium at International Rice
Research Institute, Johns Hopkins Press, Baltimore, Maryland, pp: 15-28
Gupta, R.K and Jaggi, I.K. (1979). Soil physical conditions and paddy yield as influenced by
depth of puddling. J Agron. Crop Sci. 148:329-336
Gupta, R. P., Kumar, S. and Singh, T. (1984) Soil management to increase crop production.
A Consolidated Report 1967-82. ICAR, New Delhi.
Hira, G.S., Jalota, S.K., Arora, V.K. (2004). Efficient management of water resources for
sustainable cropping in Punjab. Technical Bulletin, Department of Soils, Punjab
Agricultural University, Ludhiana, India, pp, 20.
www.intechopen.com

Hydraulic Conductivity – Issues, Determination and Applications
46
Hundal, S.S. and De Datta, S K, (1984) In situ water transmission characteristics of a tropical
soil inder rice based cropping systems. Agricultural Water Management 8:
387-396
Mambani, B., De Datta, S.K. and Redulla, A.C (1989) Soilphysical behaviour and crop
responses to tillage in lowland rice soil of varying clay content. Plant Soil
126(2):227-235
Mohanty, M, Painuli, D.K. and Mandal, K.G. (2003). Effect of puddling intensity on
temporal variation in soil physical conditions and yield of rice (Oryza sativa L.) in
vertisol of central India. Soil Tillage Res. 76:83-94
Moormann, F.R and Van Breemen, N (1978) Rice: Soil, water, land. International Rice
Research Institute, Los Banos, Phillipines.
Mousavi, S.F. Yousefi-Moghadam, S., Mostafazadeh-Fard, B. Hemmat, A. and Yazdani, M.R.
(2009). Effect of puddling intensity on physical properties of a silty clay soil under
laboratory and field conditions. Paddy Water Environ 7: 45-54
Naphade, J. D. and Ghyldyal, B. D. (1971) Effect of puddling on physical properties of rice
soils. Indian J Agric Sci 41 : 1065-67.
Pagliai, M., Painuli, D. K. and Woodhead, T. (1990) Soil Management for Sustainable
Agriculture in the Tropics. Trans 14th Intl congr Soil, Kyoto, Japan, p. 192.
Pagliai, M, Woodhead, T. and Painuli, D.K. (1987). Towards more efficient use of water and
energy in rice-soil puddling: can micromorphometric studies help? Trans XIII
Congress of I.S.S.S. Hamburg, 5:436-448
Painuli, D.K., Woodhead, T and Pagliai. (1988). Effective use of energy and water in rice soil
puddling. Soil Tillage Res. 12: 149-161.
Pandey, S.P., Shanker, H. and Sharma, U. K. (1985) Efficiency of some organic and inorganic
residues in relation to crop yield and soil characteristics. J Indian Soc Soil Sci 33:
179-81.
Prathapar, S. A., Meyer, W. S. and Cook, F. J. (1989). Effect of cultivation on the relationship
between root length density and unsaturated hydraulic conductivity in a
moderately swelling soil. Aust J Soil Res 27 : 645-650.
Rane, D.B, and Varade, S.B. (1972). Hydraulic conductivity as an index for evaluating
performance of different puddlers. J Agrci. Engg. 9(1):11-16
Saito, M, and Kawaguchi, K. (1971). Flocculating tendency of paddy soils. IV Soil structure
of paddy plow layers. J. Sci. Soil Manure, Japan. 42:95-96, Also in Soil Sci. Plant
Nutrition. 18:202(English Abstract).
Sanchez, P. A. (1973) Puddling tropical rice soils II Effects of water losses. Soil Sci 115 :
303-8.
Sharma, B. R. (1992) Water saving techniques for rice production in eastern region. Indian
Farming 42 : 19-21.
Sharma, P. K. and De Datta, S. K. (1985) Puddling influence on soil, rice development and
yield. Soil Sci Soc Am J 49 : 1451-57.
Sharma, P.K. and Bhagat, R.M. (1993). Puddling and compaction effect on water
permeability of texturally different soils. J Indian Soc. Soil Sci. 41:1-6
www.intechopen.com

Dynamics of Hydraulic Properties of Puddled Soils
47
Singh, G. (2003) Physical and hydraulic properties of soil as influenced by organic
amendments in rice-wheat cropping system. M.Sc Thesis, Department of Soils,
Punjab Agricultural University, Ludhiana, Punjab, India
Singh, A. K., Amgain, L. P. and Sharma, S. K. (2000) Root characteristics, soil physical
properties and yield of rice (Oryza sativa) as influenced by integrated nutrient
management in rice-wheat (Triticum aestivum) system. Indian J Agron 45 (2): 217-22.
Singh, K. B. (1998) Quantification of water balance components in rice-wheat system as
influenced by soil and water management. Ph D Thesis, Department of Soils,
Punjab Agricultural University, Ludhiana, Punjab, India
Singh, K. B., Gajri, P. R. and Arora, V. K. (2001) Modelling the effects of soil and water
management practices on the water balance and performance of rice. Agricultural
Water Management 49:77-95
Singh, K. B. and Manchanda, J. S. (2008) Effect of puddling on water intake rate
and root growth of rice and wheat. Environment & Ecology 26(3):1046-
1050
Singh, K. B., Jalota, S. K. and Sharma, B. D. (2009) Effect of continuous rice-wheat rotation on
soil properties from four agro-ecosystems of Indian Punjab. Communications in Soil
Science and Plant Analysis 40:2945-2958
Singh, S., Singh, M. P. and Bakshi, R. (1990) Unit energy consumption for paddy -wheat
rotation. Energy Conserv Magmt 30 : 121.
Sur, H. S., Prihar, S. S. and Jalota, S. K. (1981) Effect of rice-wheat and maize-wheat rotations
on water transmission and wheat root development in a Sandy loam of the Punjab,
India. Soil Tillage Res 1:361-71.
Tiwari, V. N., Tiwari, K. N. and Awasthi, P. N. (2000) Role of Sesbania rostrata and
phosphomicrobe at varying levels of N in sustaining the production and
productivity of soil under rice-wheat/chickpea cropping sequence. J Indian Soc Soil
Sci 48 (2): 257-62.
Taylor, H. M. (1972) Effect of drying on water retention of a puddled soil. Soil Sci Soc Am
Proc 36 : 972-73.
Tyagi, N. K., Acharya, N. and Mohanty, P. C. (1975) Effect of puddling implements on
percolation losses and water use efficiency in rice field. Indian J Agric Sci 45 :
132-35.
Wind, G.P. (1961). Capillary rise and some applications of the theory of moisture in
unsaturated soil. Institute of Land and Water Management Research Technical
Bulletin 22. Wageningen, the Netherlands.
Wopereis, M. C. S., Wosten, J.H.M, Bouman, J., and Woodhead, T. (1992). Hydraulic
resistance in peddle rice soils: measurement and effects on water movement. Soil
Tillage Res. 24 (3):199-209
Wopereis, M.C.S. , Wosten, J.H.M, ten Berge, H.F.M, Woodhead, T. and Agustin, E.M.D.S.
(1993). Comparing the performance of soil water balance model using measured
and calibrated hydraulic conductivity data; A case study for dryland rice. Soil Sci.
156(3):133-140
www.intechopen.com

Hydraulic Conductivity – Issues, Determination and Applications
48
Yoshida, S. Adachi, K. (2002). Influence of puddling intensity on the water retention
characteristics of clayey paddy soil. 17 th WCSS, 14-21 August, Thailand,
Symposium No. 53, Paper No. 235, pp,1-8
Yunsheng, C. (1983) Drainage of paddy soils in Taihu lake region and its effects. Soil Res.
Rept. No. 81. Institute of Soil Science, Academia Sinica, Nanjing, China.
www.intechopen.com

Hydraulic Conductivity - Issues, Determination and ApplicationsEdited by Prof. Lakshmanan Elango
ISBN 978-953-307-288-3Hard cover, 434 pagesPublisher InTechPublished online 23, November, 2011Published in print edition November, 2011
InTech EuropeUniversity Campus STeP Ri Slavka Krautzeka 83/A 51000 Rijeka, Croatia Phone: +385 (51) 770 447 Fax: +385 (51) 686 166www.intechopen.com
InTech ChinaUnit 405, Office Block, Hotel Equatorial Shanghai No.65, Yan An Road (West), Shanghai, 200040, China
Phone: +86-21-62489820 Fax: +86-21-62489821
There are several books on broad aspects of hydrogeology, groundwater hydrology and geohydrology, whichdo not discuss in detail on the intrigues of hydraulic conductivity elaborately. However, this book on HydraulicConductivity presents comprehensive reviews of new measurements and numerical techniques for estimatinghydraulic conductivity. This is achieved by the chapters written by various experts in this field of research into anumber of clustered themes covering different aspects of hydraulic conductivity. The sections in the book are:Hydraulic conductivity and its importance, Hydraulic conductivity and plant systems, Determination bymathematical and laboratory methods, Determination by field techniques and Modelling and hydraulicconductivity. Each of these sections of the book includes chapters highlighting the salient aspects and most ofthese chapters explain the facts with the help of some case studies. Thus this book has a good mix of chaptersdealing with various and vital aspects of hydraulic conductivity from various authors of different countries.
How to referenceIn order to correctly reference this scholarly work, feel free to copy and paste the following:
K. B. Singh (2011). Dynamics of Hydraulic Properties of Puddled Soils, Hydraulic Conductivity - Issues,Determination and Applications, Prof. Lakshmanan Elango (Ed.), ISBN: 978-953-307-288-3, InTech, Availablefrom: http://www.intechopen.com/books/hydraulic-conductivity-issues-determination-and-applications/dynamics-of-hydraulic-properties-of-puddled-soils

© 2011 The Author(s). Licensee IntechOpen. This is an open access articledistributed under the terms of the Creative Commons Attribution 3.0License, which permits unrestricted use, distribution, and reproduction inany medium, provided the original work is properly cited.