dynamics of feeding responses in pieris brassicae linn …
TRANSCRIPT

595.789 :.591.185.31:591.513:591.53
MEDEDELINGEN LANDBOUWHOGESCHOOL WAGENINGEN • NEDERLAND • 72-11 (1972)
DYNAMICS OF FEEDING RESPONSES IN PIERIS BRASSICAE LINN AS A FUNCTION
OF CHEMOSENSORY INPUT: A BEHAVIOURAL, ULTRASTRUCTURAL AND
ELECTROPHYSIOLOGICAL STUDY
MA WEI CHUN
Department of Entomology, Agricultural University, Wageningen, The Netherlands
(Received 3-III-1972)
H. VEENMAN & ZONEN N.V. - WAGENINGEN - 1972

Mededelingen Landbouwhogeschool Wageningen 72-11 (1972)
(Communications Agricultural University is also published as a thesis)

CONTENTS
1. GENERAL INTRODUCTION 1
2. MATERIALS AND REARING METHODS 3 2.1. Experimental animals 3 2.2. Plant material 4 2.3. Chemicals 4
3. ASPECTS OF LARVAL PREFERENCE BEHAVIOUR 5 3.1. Introduction 5 3.2. Materials and methods 5 3.3. Experience-dependent modification of preference behaviour 6 3.4. The effect of mouth part ablation on preference behaviour 14 3.5. Discussion 17
4. QUANTITATIVE STUDY OF BEHAVIOURAL CHEMORESPONSES . . . . 19 4.1. Introduction 19 4.2. Materials and general methods 19 4.3. Results and discussions 20 4.3.1. Observations on behaviour patterns 21 4.3.2. Parameters of larval chemoresponse 23 4.3.3. Behaviour responses to sugars and related compounds 25 4.3.4. The effect of starvation on the response to sucrose 29 4.3.5. Behaviour responses to sinigrin and its interaction with sucrose 32 4.3.6. Stimulating effects of some other chemical compounds 36 4.3.7. The effect of calcium and sodium chloride on response to sucrose . . . . 40 4.3.8. The effect of mouth part ablations 42 4.3.9. Responses of maxillectomized larvae to sugars 44 4.3.10. The effect of mouth part ablation on the response to sinigrin 45 4.3.11. Inhibition of food intake by specific stimuli 48
5. MORPHOLOGICAL AND ANATOMICAL OBSERVATIONS ON SENSORY ORGANS 59 5.1. Introduction 59 5.2. Materials and methods 60 5.3. The maxillary sensilla styloconica 60 5.4. Observations on epipharyngeal sensilla 74 5.5. The sensory structures associated with mandibular fine canals 81 5.5.1. Introduction 81 5.5.2. Materials and methods 82 5.5.3. Results and discussions 82
6. ELECTROPHYSIOLOGICAL STUDIES ON CHEMORECEPTOR RESPONSES 90 6.1. Introduction 90 6.2. Materials and methods 90 6.3. Results and discussions 91 6.3.1. Ss I response to stimulation by carbohydrates 91 6.3.2. Ss II responses to stimulation by carbohydrates 95 6.3.3. Interspecies specificity towards various sugars 95 6.3.4. Ss I chemoreceptor cell sensitive to specific feeding inhibitory compounds . 98 6.3.5. Cellular specificity 98

6.3.6. Electrophysiological properties 102 6.3.7. Discussion 107 6.4. Electrophysiological studies on the contact chemosensory function of the
epipharyngeal papilla-like organs 108 6.4.1. Ep responses to stimulation by some electrolytes 109 6.4.2. Ep responses to stimulation by carbohydrates 113 6.4.3. The effect of sodium chloride on the response of the Ep sugar receptor . . 116 6.4.4. The effect of calcium chloride on the response of the Ep sugar receptor . . 118 6.4.5. Theoretical considerations on sugar receptor stimulation in Ss II and Ep sugar
receptors 119 6.4.6. Responses of Ep to stimulation by specific feeding inhibitors 124 6.4.7. Additional remarks on the Ep innervation 125 6.5. Summary 127
7. THE RELATION BETWEEN BEHAVIOURAL AND PERIPHERAL NEURAL RESPONSES 128 7.1. General considerations 128 7.2. Observations on feeding behaviour 129 7.3. Sensory control mechanisms in feeding behaviour 130 7.4. Mechanisms in inhibition of feeding responses 136 7.5. Final remarks 139
8. SUMMARY 142
9. ACKNOWLEDGEMENTS 146
10. SAMENVATTING 147
APPENDICES 151
REFERENCES 157

1. G E N E R A L I N T R O D U C T I O N
Chemoreception plays a crucial rôle in the interaction of organisms with their environment. In animals and some micro-organisms chemoreception is of paramount importance not only in securing food necessary for the subsistence of the individual organism but also in social and other activities necessary for the maintenance of the species. The present work deals with chemoreception in relation to feeding and food selection behaviour of larvae of Pieris brassicae (Lepidoptera : Pieridae). Apart from mechanisms based on host avoidance (repellence), the determination of food specificity in phytophagous and other animals is caused by discrimination during contact of the substrate with the legs or mouth parts. One of the first to demonstrate experimentally the perception of plant chemicals by phytophagous insects was VERSCHAFFELT (1910) who noticed that food selection by the larvae of P. brassicae and P. rapae was influenced by the presence of a distinct class of chemicals (glucosides of allyliso-thiocyanates) in the natural hostplants (Cruciferae, Tropaeolaceae or Reseda-ceae). Since then numerous reports have appeared on chemoresponses, mainly of phytophagous insects as fostered by the obvious economic relevance (for extensive reviews see BECK, 1965; DETHIER, 1947, 1966; SCHOONHOVEN, 1968). However, besides the thorough studies of tarsal and labellar chemoreceptors of blowflies (reviewed by DETHIER, 1969), insect feeding behaviour has only in a few cases been studied in relation to electrophysiological analysis of chemore-ceptive phenomena. With regard to phytophagous insects such studies are restricted to some lepidopterous larvae (for reviews see SCHOONHOVEN, 1968; DETHIER, 1970) and two coleopterous species, viz. the Colorado beetle Leptino-tarsa decemlineata (STÜRCKOW and QUADBECK, 1958, STÜRCKOW, 1959) and Chrysomela brunsvicensis (REES, 1969). All these studies are more of a qualitative than of a quantitative nature. The lack of more quantitative studies may seem understandable in view of the major difficulties which are related to an attempt to establish a meaningful correlation between quantitative behavioural responses and electrophysiological phenomena in sense organs. One of these problems is caused by the fact that feeding preferences may be altered through experience or learning. As will appear in Chapter 3 feeding preferences in the larvae of P. brassicae are modifiable within certain limits. Another problem arises from the possibility that the outcome of behavioural studies may vary according to the response parameter chosen. These and other difficulties pose special problems as to the choice of experimental designs and response parameters which can be profitably applied to assess larval chemoresponses in a quantitative manner. These issues are dealt with in Chapter 4. In Chapter 5 morphological and anatomical studies of sense organs involved in feeding are described. It will be clear that only an understanding of the organization and function of the complete chemoreceptive system will allow a quantitative interpretation of the observed feeding responses in relation to sensory input. Our
Meded. Landbouwhogeschool Wageningen 72-11 (1972) 1

knowledge of the chemoreceptive system of lepidopterous larvae is only partial and restricted to the maxillary sensilla styloconica and palpi, in spite of irrefutable behavioural evidence (Chapters 3 and 4) that other chemoreceptors are of crucial importance in food discrimination. The sense organs described in Chapter 4 will contribute to narrow this gap in our knowledge. A detailed knowledge of the behaviour of the larvae and of the distribution and innervation of the relevant sense organs is fundamental for electrophysiological investigations. These investigations are described in Chapter 6. Finally, in Chapter 7 the information acquired in the various parts of the experimental work is integrated in a discussion pertaining to mechanisms involved in food intake behaviour and to possible causal relations between larval chemoresponses and chemosensory input.
Meded. Landbouwhogeschool Wageningen 72-11 (1972)

2» MATERIALS AND R E A R I N G M E T H O D S
2.1. EXPERIMENTAL ANIMALS
The continuous stock culture of the European cabbage worm or Large White butterfly Pieris brassicae L. was set up in the laboratory from eggs which were kindly supplied by Philips-Duphar N.V. The original source was the granulosis resistant 'Cambridge strain' described by DAVID & GARDINER (1960). The methods and conditions for breeding P. brassicae in the laboratory on its host plants have been extensively described by DAVID & GARDINER (1952) and DAVID
(1957). In most of the experiments larvae were used which had been reared on a semi
synthetic medium. The composition of this diet was modified after a meridic diet originally developed for saturniid moths (RIDDIFORD, 1968). In comparative rearing experiments the results obtained with this diet proved to be similar to the semi-synthetic diet developed by DAVID & GARDINER (1965). The composition of the semi-synthetic diet used is given in Table 1. The diet was used for routinely rearing the experimental animals but not for maintaining a continuous culture. Each generation of fifth instar larvae used in the experiments was raised from eggs taken from the stock culture reared on Brassica oleracea. This was
TABLE 1. Composition of semi-synthetic diet.
Constituents stock mixture Quantity
Vitamin free casein 350.0 g Wheat-germ 300.0 g Powdered cellulose Alphacel 50.0 g Wesson's salt mixture 100.0 g Sucrose 350.0 g Cholesterol-bèta-sitosterol 50/50 5.0 g Sorbic acid 24.0 g Methyl p-hydroxybenzoate 18.0 g Aureomycin 25.0 g Kanamycin sulfate 1.4 g
The constituents were thoroughly blended and stored in the refrigerator. The preparation of the medium was as follows : 12.5 g granulated agar was dissolved in 300 cc water by heating and subsequently a mixture was added consisting of: 61 g stock mixture, 2 cc formaldehyde (10%), 5 ce KOH (10%), 0.5 cc linseed oil, 7.5 cc vitamin stock suspension and 120 cc water. The constituents were all obtained from Nutritional Biochemical Corporation, Cleveland, Ohio. The vitamin suspension consisted of the Vanderzant vitamin mixture, which was of the following composition: alpha tocopherol, 8 g; ascorbic acid, 270 g; biotin, 20 g; calcium pantothenate, 1 g; choline chloride, 50 g; folic acid, crystalline, 250 g; inositol, 20 g; niacinamide, 1 g; pyridoxine HCl, 250 g; riboflavin, 500 g; thiamine HCl 250 g; vitamin B-12 trituration in mannitol, 2 g (all constituents per 1000 ml. distilled water). The solution was stored under refrigeration.
Meded. Landbouwhogeschool Wageningen 72-11 (1972) 3

done to improve the homogeneity of the experimental animals. Unless otherwise stated the larvae were reared 'ab ovo' in plastic boxes ( 1 5 x 8 x 6 cm) in numbers of 150-250 per box. The medium was changed every other day during the early instars and every day when the larvae had reached the fourth or fifth instar. It was noticed that a daily fluctuating temperature of 22.5 ± 2.5°C during the day and 17.0 ± 2.5°C at night improved larval growth and this was maintained as a standard condition. All rearings were performed under a long photoperiod (18 hrs photophase) in order to prevent diapause.
For comparative purposes some experiments were carried out with last instar larvae of Mamestra brassicae L. (Noctuidae). These larvae were raised on a semi-synthetic medium and were kindly supplied by Dr. L. P. S. van der Geest (Laboratory for applied entomology, University of Amsterdam).
2.2. PLANT-MATERIAL
The plants supplied to stock cultures or to experimental animals were all cultivated in a conditioned greenhouse. Moreover, in the preference tests care was taken to standardize the leaf material as much as possible by choosing definite parts of the plant and by using plants of known age. All plants were grown from seeds except Tropaeolum majus L. which was propagated vegeta-tively. The other plant species used were: Brassica oleracea L. var. gemmifera (DC) Schulz, Hesperis matronalis L., Raphanus sativus L. ('Rota') and Sinapis sinensis L.
2.3. CHEMICALS
Except for 20-hydroxy-ecdysone, ponasterone A, 2ß, 3ß, 14a-trihydroxy-A7-5ß-cholesteen-6-on and 3a, 1 Iß, 17a, 20, 21-pentahydroxypregnaan, which were obtained through the courtesy of Organon, Oss (Holland) all other chemicals were from commercial sources. Amino acids were obtained from Sigma Chemical Company (USA). Salts and sucrose were from Baker Chemicals (Holland). Most sugars were from Nutritional Biochemical Corporation (USA). Trehalose and L-ascorbic acid were from Merck AG (Germany). The mustard oil glucosides used were purchased from Aldrich Chemical Co. Inc. (USA) and the alkaloids from Fluka AG (Switzerland). Inokosterone was obtained from Mann Research Laboratories (USA).
Other specifications of materials, methods and experimental conditions are given at the appropriate places in the text.
Meded. Landbouwhogeschool Wageningen 72-11 (1972)

3. ASPECTS OF LARVAL P R E F E R E N C E BEHAVIOUR
3.1. INTRODUCTION
Preference behaviour of an insect can be influenced by its previous experience with a particular food. Modification of preference, also termed 'preference induction' or 'conditioning' has been observed in many oligophagous as well as polyphagous insect species. In studies with last instar larvae of Manduca sexta (Sphingidae) and Heliothis zea (Noctuidae) it has been found that feeding on different hostplants induced preferences which were specific for the inducting plant species and which were not merely due to a change in the general threshold of food acceptability (JERMY, HANSON and DETHIER, 1968). That pre-imaginal experience can affect behavioural responses in the adult has also been found with nonphytophagous insects (THORPE and JONES, 1937; THORPE, 1963). On the other hand, however, pre-imaginal experience does not seem to have any influence on the host preference of larvae and adults of the Colorado beetle Leptinotarsa decemlineata (BONGERS, 1969).
With larvae of Pieris brassicae, JOHANNSON (1951) found that fifth instar larvae showed preferences for the plant species on which they were collected in nature. Although 'acquired preference' was discussed as a possible cause for this conditioning the question of whether or not biological races were involved could not be answered. In the following study modification of preference during larval growth will be demonstrated and discussed in relation to various aspects of preference behaviour in general.
Preference studies, when combined with ablation experiments, are an important tool for increasing our knowledge of the location and relative importance of parts of the chemoreceptive system. The sensory function of the maxillae in lepidopterous larvae, for example, was elucidated by experiments in which it was found that extirpation of these organs allowed the larvae to feed on several plant species which were normally rejected (TORII & MORII, 1948; DETHIER, 1953; ITO, HORIE & FRAENKEL, 1959; WALDBAUER & FRAENKEL,
1961 ; WALDBAUER, 1962). All these experiments, however, indicated that the gustatory system is by no means limited to the maxillary organs since the majority of the non-host plants were still rejected. In fact, it will be shown in this study that maxillectomy does not influence the specificity of food preference behaviour of P. brassicae larvae.
3.2. MATERIALS AND METHODS
The experiments were conducted using larvae of P. brassicae hatched from eggs obtained from the laboratory stock culture. The culture was continuously
Meded. Landbouwhogeschool Wageningen 72-11 (1972) 5
maintained on Brassica oleracea. Plant species used in the experiments were: Brassica oleracea (B), Hesperis matronalis (H), Raphanus sativus (R), Sinapis sinensis (S) and Tropaeolum majus (T). All of these species belong to the Cruci-ferae, apart from the last-named which is a member of the Tropeaolaceae. The plants were grown in the greenhouse under uniform conditions throughout the experimental period and were used in the preference tests only at a definite (young) phase of growth. The preference tests were set up in an essentially similar fashion to that described by JOHANNSON (1951) and JERMY (1961). For dual-choice tests I used closed glass containers of 12 cm diameter and 6 cm height. For each plant species tested 6 discs of 20 mm diameter were arranged alternately in a circle around the circumference of the container. In multiple choice tests glass containers of 15 cm in diameter and 6 cm in height were used. In tests with five plant species 4 discs (18 mm diameter) of each species were arranged in such a fashion that four quadrants were formed in each of which each species was represented once. Within each quadrant the species were randomly arranged according to a table of random numbers. Each leaf disc was fixed between two small plastic discs 4 mm in diameter and pinned approximately 0.5 cm above the moist filter paper covering the tempex bottom of the container. At the start of the test a larva was placed in the centre of the circle of discs. Unless stated otherwise all preference tests were performed with fifth instar larvae on the third day after the last larval moult. In all experiments each larva was only used once. The areas consumed were visually estimated and recorded at regular time intervals. In the dual choice tests the preference for plant species X in relation to species Y is expressed as the ratio :
area consumed of (X). 100 :—- ,_. , .... ( %). In the multiple choice tests the area consumed
area consumed of (X + Y) is given for each of the test plant species separately. The data for each animal are relevant to the moment when consumption of the total area of leaf discs of any one of the plant species used reached 50 per cent; this was done in order to rule out a possible influence on the outcome due to diminished chance to encounter the particular test plant. All preference tests were performed at a temperature of 21 °C. For statistical treatment of the original data obtained in the choice tests nonparametric methods were used (SIEGEL, 1956).
During extirpation of the maxillae and antennae young fifth instar larvae were immobilized by placing them on ice and the organs were removed under a stereomicroscope by means of microscissors. The larvae were subsequently returned to the same kind of food substrate as given immediately prior to the operation. Preference tests with maxillectomized larvae were usually performed about 36 hours after the operation.
3.3. EXPERIENCE-DEPENDENT MODIFICATION OF PREFERENCE BEHAVIOUR
Larvae of P. brassicae reared on semi-synthetic medium (Chapter 2) had no previous experience in encountering any specific plant component. The prefer-
6 Meded. Landbouwhogeschool Wageningen 72-11 (1972)

ence behaviour of larvae raised under such conditions was therefore taken as a reference in assessing changes in preference induced by the consumption of certain plant species.
Experiment I - The effect of diet on feeding preference In experiment I the preference behaviour of diet-reared larvae and larvae
reared on Brassica oleracea (B) was compared. Dual-choice tests were performed with Brassica oleracea and either one of the following plants: Sinapis sinensis (S), Hesperis matronalis (H), Raphanus sativus (R) and Tropaeolum majus (T). The data given in Fig. 1 indicate that diet-reared larvae (white columns) have a significant preference for (S) above (B) (Mann-Whitney U-test; P < 0.005) while the reverse is true for Brassica-resuced larvae (same tests, P < 0.001; dark columns). This was the only example in which a reversal in preference was found. However, although both diet-reared larvae and Ära^/ca-reared ones had a distinct preference for (B) above (H), (R) or (T), the relative acceptability of species (H) and (T) was significantly lower when the larvae were previously reared on Brassica than when they were grown on artificial medium (P < 0.05) though the difference was not significant when given the choice between (B) and (R) (Mann-Whitney U-test; 0.1 < P < 0.2). The result suggest that one and the same sensory input pattern can result in different types of feeding preference depending on the experience prior to the behavioural test.
FIG. 1. Mean preference ratio (%) for (B) of larvae reared on semi-synthetic medium or on Brassica (white and striped columns respectively) as determined in dual-choice tests with various plant species. Mean values are given with 2. S. E. (N = 22). Abbreviations: (B) Brassica oleracea. (H) Hesperis matronalis, (R) Raphanus sativus, (S) Sinapis sinensis, (T) Tropaeolum majus.
Meded. Landbouwhogeschool Wageningen 72-11 (1972) 7

Experiment I I - Time dependence of preference reversal The preference modification demonstrated above is a gradual and time de
pendent phenomenon. This is shown in experiment II. Diet-reared larvae were transferred to Brassica at different stages of larval development and then given a dual-choice test between (B) and (S) on the third day of the fifth instar. The results (Fig. 2) show that a period of five days, which included one larval moult, is sufficient for completely reversing the preference of diet-reared larvae from the minimum preference ratio for (B) of 41 per cent to a ratio of more than 90 per cent. Since the latter ratio was not higher when the whole larval development was spent on Brassica (see also experiment I) this was the maximum ratio achievable.
m 100
< 80
I I
time (days)
1-z=± _U2.3AS_
FIG. 2. Mean preference ratio for (B) of larvae reared on semi-synthetic medium in relation to experience duration on Brassica before each dual-choice test with (B) and (S). Vertical bars denote 2. S. E. of means (N = 22). Instars and time spent on Brassica are schematically presented at the abscissa.
Experiment I I I - Retention of modified preference This experiment was designed to test whether or not the preference behaviour
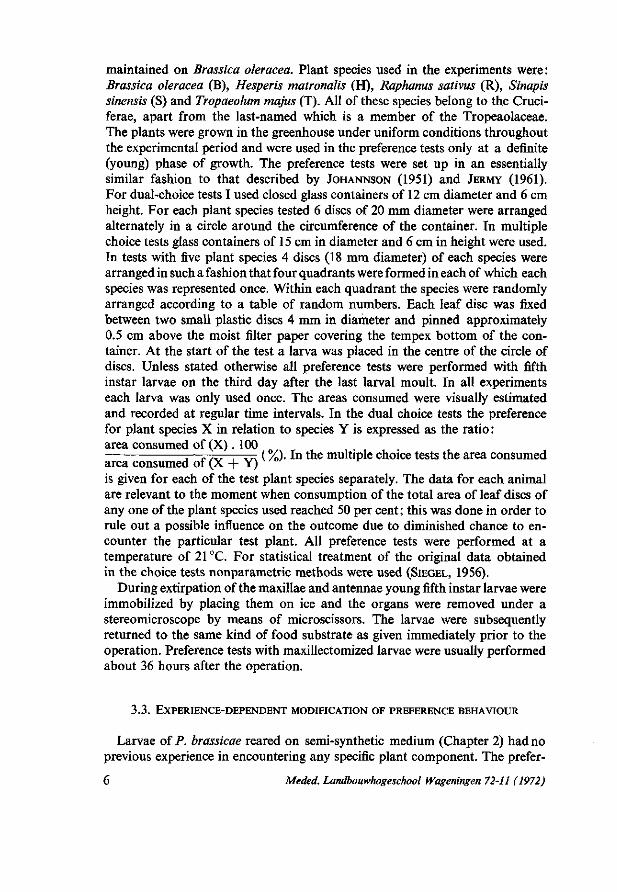
could be retained when the conditioning stimuli were no longer being received. Freshly moulted fourth instar larvae, reared on artificial medium, were allowed to feed on brassica until the last larval moult which occurred three days later. The newly moulted fifth instar larvae were subsequently transferred back to the artificial medium for three days and then given a dual-choice test between (B) and (S). At the same time parallel control tests were run with a) diet-reared larvae which were given only three days Brassica during the fifth instar prior to the preference test and b) diet-reared larvae without any treatment. The results (Fig. 3) indicate that it makes no difference whether the three days on
8 Meded. Landbouwhogeschool Wageningen 72-11 (1972)
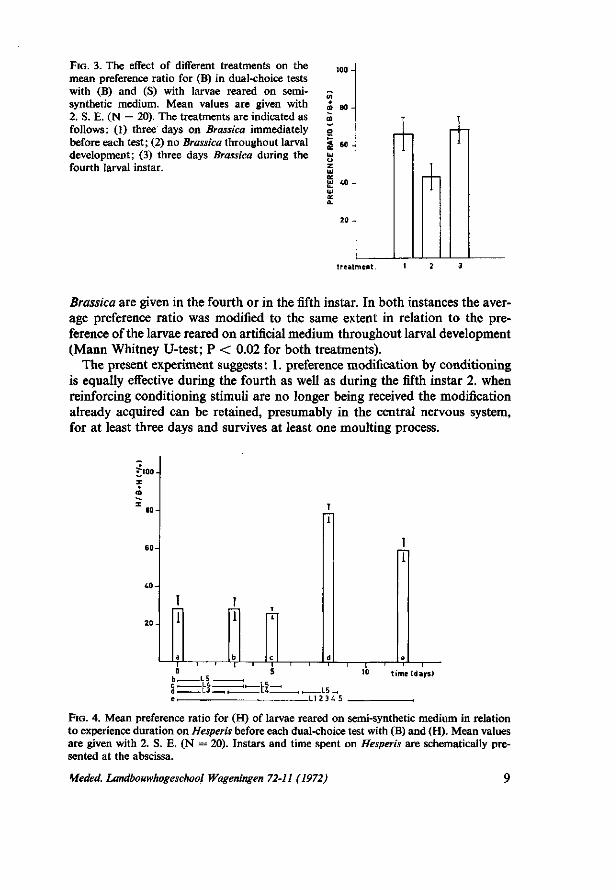
FIG. 3. The effect of different treatments on the mean preference ratio for (B) in dual-choice tests with (B) and (S) with larvae reared on semisynthetic medium. Mean values are given with 2. S. E. (N = 20). The treatments are indicated as follows: (1) three days on Brassica immediately before each test; (2) no Brassica throughout larval development; (3) three days Brassica during the fourth larval instar.
< 60 -
Brassica are given in the fourth or in the fifth instar. In both instances the average preference ratio was modified to the same extent in relation to the preference of the larvae reared on artificial medium throughout larval development (Mann Whitney U-test; P < 0.02 for both treatments).
The present experiment suggests : 1. preference modification by conditioning is equally effective during the fourth as well as during the fifth instar 2. when reinforcing conditioning stimuli are no longer being received the modification already acquired can be retained, presumably in the central nervous system, for at least three days and survives at least one moulting process.
i m
_L5 . _L4 . - L 3 -
10 time (days)
ZÏI=L
FIG. 4. Mean preference ratio for (H) of larvae reared on semi-synthetic medium in relation to experience duration on Hesperis before each dual-choice test with (B) and (H). Mean values are given with 2. S. E. (N = 20). Instars and time spent on Hesperis are schematically presented at the abscissa.
Meded. Landbouwhogeschool Wageningen 72-11 (1972)

C 80-
time (days)
- LI 234.5
FIG. 5. Mean preference ratio for (T) of larvae reared on semi-synthetic medium in relation to experience duration on Tropaeolum before each dual-choice test with (B) and (T). Mean values are given with 2. S. E. (N = 20). Instars and time spent on Tropaeolum are schematically presented at the abscissa.
too
'T.B V H
FIG. 6. Comparison of mean preference ratio for (T) of larvae reared on Tropaeolum (part A) and that of larvae reared on semi-synthetic medium (part B) in dual-choice tests with (T) and either (B), (H) or (R). Mean values with 2. S. E. (N = 20).
Experiments IV-VI - Other experiments on time dependence A similar experiment to experiment II was performed but this time with (H)
as the conditioning plant species and (H) and (B) as choice situation (experiment IV). Diet-reared larvae at different stages of larval development were transferred to (H) and subsequently tested on the third day of the fifth instar.
10 Meded. Landbouwhogeschool Wageningen 72-11 (1972)

Diet-reared larvae without any experience on (H) had a preference ratio for (H) of 23 per cent indicating a preference for (B) above (H) (Fig. 4). This ratio was not altered when (H) was given during the beginning of the fourth instar up to the moment of testing, a total period of five days. However, when the third instar also was included in the conditioning period on (H) the preference ratio increased more than three fold to 79 per cent, thus indicating a reversal to a strong preference for (H) above (B) (P < 0.001).
On the other hand, (experiment V), the relative poor acceptability of (T) for diet-reared larvae could by no means be reversed into a preference for (T) above (B) (Kruskal-Wallis test; 0.1 < P < 0.2). The highest preference ratio obtained (48 ± 4; N = 20) was reached when (T) was given from the beginning of the fourth instar (Fig. 5). The result of experiment V does not necessarily imply that (T) is not able to induce any preference modification. Modification does appear in experiment VI where the preference for (T) was not asessed against (B) but against (H) or (R) (Fig. 6). A distinct shift in the behaviour of diet-reared larvae resulted in a reversal of the relative unacceptability of (T) into a clear preference for (T) (Kruskal-Wallis test; P < 0.005).
Exper iment VII - Enhancement of rejection of Tropcteolum The minimum time needed to induce significant changes in preference ratio
will naturally depend on the plant species used for conditioning and on the choice situation given. In one experiment (VII) it was found that when Tropaeo-/i/m-reared larvae were supplied with Brassica on the third day of the fifth instar the already poor acceptability of (T) in relation to (B) was significantly enhanced when feeding took place for a period as short as 4 hours (Kruskal-Wallis test; P < 0.05). The almost absolute inacceptability of (T) for larvae reared ab ovo on Brassica was, however, not yet reached (Fig. 7).
It has to be pointed out that the preference ratio of 5 per cent determined for Brassica-reaxed larvae in tests between (T) and (B) was entirely due to the observation that on the average one larve out of twenty showed an unexpected high
FIG. 7. Mean preference ratio for (B) in dual-choice tests with (B) and (T) with larvae reared on Tropcteolum and given varying periods on Brassica. The last column indicates the preference ratio of larvae reared on Brassica throughout development. Mean values with 2. S. E. (N = 20).
X. 4 0 -
30-
20 -
10-
Ù (B)
time (hours)
Meded. Landbouwhogeschool Wageningen 72-11 (1972) 11

preference for (T) above (B). The same phenomenon was also met in diet-reared larvae. JOHANNSON (1951) has similarly observed such marked deviations from the average larval acceptance behaviour. It might be an outcome of a genetically determined variability within a population of larvae. In the present study it was not possible to pursue this aspect further.
Experiments VIII and IX - The effect of starvation In experiment I it was established that diet-reared larvae differed from Bras-
sica-reared ones in having a larger tolerance in acceptance of (T). This result was obtained with non-starved animals in choice tests and it has yet to be proved whether this would be valid when the larvae are starved. In order to investigate this point the survival rate of young fifth instar larvae was determined after they had been transferred to Tropaeolum (experiment VIII). The larvae used were either reared on artificial medium, Brassica, or Tropaeolum itself (control). Twenty-five larvae of each group were used and the experiments were performed at 25 CC. After transferring the animals, changes in body weight were followed
T C9 111 S 300 -
FIG. 8. Mean fresh body weight per larva during the time after transfer to Tropea-olum. Larvae were reared on one of the following substrates: (. .) Brassica,
"J ] I ^ J ' (. .) semi-synthetic medium, ( . - . - . -.) days Tropaeolum.
12 Meded. Landbouwhogeschool Wageningen 72-11 (1972)

during each consecutive day until death or until the first incidence of prepupal transformation occurred. As seen in Fig. 8 all diet-reared larvae survived on Tropaeolum although their developmental rate was retarded in comparison with the control (Tropaeolum-reared larvae). On the other hand, all Brassica-reared larvae died from lack of food after 3-4 days.
In the reverse situation (experiment IX) it was found that larvae reared on Tropaeolum could easily adapt after transfer to artificial medium, whereas this was only partly true for Brassica-ieared animals (Fig. 9). In the figure it is shown that all Brassica-reaied larvae showed hardly any food intake during the first day after they were transferred to the semi-synthetic medium. However, under prolonged starvation the larvae could be divided into three groups according to their capability to adapt: about 45 % of the larvae showed a rapid adaptation on the third and following days while another 25% also eventually adapted, albeit more slowly. The remaining 30 %, however, died from lack of food intake.
FIG. 9. Mean fresh body weight per larva during the time course after transfer to semisynthetic medium of larvae reared on different substrates. Rearing substrates are indicated in the same way as in Fig. 8. days
Meded. Landbouwhogeschool Wageningen 72-11 (1972) 13

3.4. THE EFFECT OF MOUTH PART ABLATION ON PREFERENCE BEHAVIOUR
Experiment X - Maxillectomy, in combination with antennectomy Experiment X was performed to determine to what extent maxillectomy
affects the larval preference behaviour. For each group of larvae reared on (S), (T), (H) or artificial medium, one portion was subjected to bilateral maxillectomy and antennectomy while the other was left unoperated. The extirpations were performed in the early stage of the fifth instar and the operated larvae were placed on the original food plant until administration of the preference test. The preference behaviour was assessed in multiple choice tests with (S), (B), (H), (R) and (T) (for details, see 3.2.). All tests were run with both operated and non-operated larvae (22 replicates in each group). The data appear in Figs. 10-13.
50-
= 30-
20
S T B H R S T B H R
FIG. 10. Mean area consumed of each plant species in multiple choice tests by larvae reared on Sinapis. Left part of the figure refers to unoperated larvae, right part represents the preference behaviour of larvae with bilaterally extirpated maxillae and antennae. Mean values are given with 2. S. E. (N = 22).
so so
20
fcttL
FIG. 11. Mean area consumed of each plant species in multiple choice tests by larvae reared on Tropaeolum. For further explanation see Fig. 10.
14 Meded. Landbouwhogeschool Wageningen 72-11 (1972)

50
iß-
= 30-
20
ta-
20
FIG. 12. Mean area consumed of each plant species in multiple choice tests by larvae reared on Hesperis. For further explanation see Fig. 10.
S T B H R S T B H R
50-
!30
40
S T B H R S T B H R
FIG. 13. Mean area consumed of each plant species in multiple choice tests by larvae reared on semi-synthetic medium. For further explanation see Fig. 10.
Maxillectomy (with antennectomy) clearly does not result in a reduction of discriminative ability. This is apparent not only from the complete non-acceptability of (T) by maxillectomized larvae reared on (S) or (H), but also from their ability to make more subtle discriminations between the remaining plant species (S), (R), (B) and (H) (Friedman's test; P < 0.05). Subsequent sign tests showed that the order of preference may be somewhat different between maxillectomized and unoperated larvae. At 5% probability level (same tests) the preference order in larvae reared on (S) was: S = R = B > H > T (unoperated) and S = B = R = H > T (maxillectomized; S > R and B > H). On larvae reared on (H) the order was established as:R = S = H = B > T (unoperated ; R > B) and H = S = R = B > T (maxillectomized; H > R and S > B). In Tropaeo-/«/n-reared larvae the order was: B = T > H = S = R (unoperated) and
Meded. Landbouwhogeschool Wageningen 72-11 (1972) 15

T > B = S = R = H (maxillectomized ; B > R). In diet-reared larvae the order was: R = B = S > H > T (unoperated) andB = S > R = H = T (maxillectomized; R > T). In summary it can be stated that preference for a plant species as induced by feeding on that particular species is not obliterated by maxillectomy but in some cases can become even more pronounced. Since the antennae as well as the maxillae had been removed the sensory information needed in order to make such discrimination possible must have been received by sense organs located inside the buccal cavity.
TABLE 2. Preference of P. brassicae larvae reared on Brassica oleracea (B) after mouth part ablation. Treatment I denotes extirpation of antennae and maxillae (both bilateral) and labrum. Treatment II refers to bilateral extirpation of antennae and maxillae only. The data consist of the percentage consumed of the total area of discs of one of the test plant species in a dual-choice test. Abbreviations: (T), Tropaeolum majus; (V), Vicia faba.
test
animal " no.
1 2 3 4 5 6 7
(T)
50 50 15 50 ---
treatment I
(B)
10 25 50 30
---
(V)
---
50 50 50
(B)
---
50 30 5
test
animal no.
9 10 11 12 13 14 15
(T)
0 0 0 0 0 0 0
treatment II
(B)
50 50 50 50 50 50 50
(V)
0 0 0 0 0 0 0
(B)
50 50 50 50 50 50 50
50 5 16 0 50 0 50
Exper iment XI - Extirpation of antennae, maxillae and labrum Extirpation of a combination of antennae, maxillae and labrum causes a high
incidence of post-operative mortality (see section 4.3.8.). Moreover, feeding usually remained absent among the recovered larvae. The low percentage of larvae which resume feeding prevented extensive studies with preference tests. Eight larvae reared on (B) showed a resumption of feeding activity although the feeding rate was greatly reduced. Two kinds of dual choice tests were carried out with these larvae. Four larvae were given a choice between (T) and (B) while the other four were given a choice test with Vicia faba L. (V) and (B). The preferences were compared with those of maxillectomized larvae. As may be seen from Table 2 the larvae with antennae, maxillae and labrum removed accepted (T) or (V) as readily as (B) on which they had been reared. They appear to have even shown a preference for (T) and (V) above (B), but the number of animals used was too low to derive definite conclusions. By contrast both (T) and (V) are completely unacceptable to larvae having the maxillae and antennae removed. After termination of the tests the animals were checked for the completeness of the extirpations. The results suggest that in absence of any chemosensory input a low percentage of larvae (estimated ten per cent)
16 Meded. Landbouwhogeschool Wageningen 72-11 (1972)

succeeds in a continuation of food intake. The proprioceptive information which these larvae still receive from the mandibular sense organs (see Chapter V) might be responsible for a preference for softer leaf discs. It is realized that the interpretation of the results shown in Table 2 should be treated with caution. As mentioned above the larvae from which all three types of organs had been removed showed a low feeding rate which presumably is due to the fact that they are hampered in their normal food intake behaviour. This reduced feeding rate could be responsible for a lowering of the general acceptance threshold of the animals. On the other hand, however, it may be argued that prolonged starvation has never induced maxillectomized larvae to feed on (V) or (T). In tests with various plant species like Lactuca sativa, Taraxacum officinale, Plantago major, maxillectomy and starvation never resulted in any degree of acceptability. Any induction of acceptance of plants outside the natural food plant range seems to be impossible by these treatments alone. In any case, our morphological evidence (Chapter 5) also is in support of the view that by ablation of the labrum the part of the animal's gustatory system located in the buccal cavity will be destroyed.
3.5. DISCUSSION
The present experiments with P. brassicae larvae show that in this species it is possible to induce modification of preference within one ontogenetic phase. The modification appears to be reinforced with time and retainable during a certain period and, moreover, it is not obliterated by a larval moult. These properties strongly suggest that preference modification implies memory processes in the central nervous system which influence the interpretation of the chemosensory input in terms of acceptance and rejection. An alternative physiological mechanism underlying the behavioural changes would be provided by a modification of the chemosensory input itself as a consequence of changes in chemoreceptor sensitivities. Such changes can be due to alterations in the internal physiological state of the animal (e.g. REES, 1970). On the other hand, it has been found that the behavioural gustatory sensitivity of adult blowflies (Phormia regina) can be markedly affected by the addition of certain sugars to the food consumed during larval development (EVANS, 1961; DETHIER & GOLDRICH, 1971). These changes, the directions of which varied with the kind of sugar involved, were not correlated with any metabolic phenomena. Electrophysiological evidence that the responsiveness of chemoreceptors can be affected by food has been obtained by SCHOONHOVEN (1969b) with larvae of Manduca sexta. Definite chemoreceptors exhibited a significant increase of sensitivity when the larvae were reared on an artificial medium rather than the natural hostplants. This increase in sensitivity was due to the absence of adequate stimuli in the food. The increased acceptability of some non-hostplants by larvae reared on artificial diet (SCHOONHOVEN, 1967b) is explained by an increased sensitivity of the'S' (Stimulant) cell and a decreased sensitivity in the 'D'
Meded. Landbouwhogeschool Wageningen 72-11 (1972) 17

(Deterrent) receptors. As stated by SCHOONHOVEN (1969b) the observed changes in sensitivity of chemoreceptors in larvae of M. sexta do not necessarily exclude the possibility that learning processes in the central nervous system could play a rôle in the behavioural changes observed.
The physiological events underlying these changes in receptor sensitivity are unknown. The fact that a preference once induced in the larva is not wiped out by a larval moult renders it very unlikely that changes in the properties of the receptor cell membranes are involved, since the distal dendritic endings are broken off and cast at ecdysis (see section 5.2.).
In the larvae of P. brassicae peripheral changes have not been observed when the animals are raised on artificial medium instead of on the natural food plant {Brassica oleracea) (Schoonhoven, pers. comm.) Therefore the differences observed in the preference behaviour of diet-grown and brassica-grown larvae may entirely be ascribed to changes in the central nervous system with regard to decision-making. Diet-grown larvae have not been in contact with any plant. They are therefore considered as 'uninduced' or 'naive' and their preference behaviour as 'innate' (JERMY, HANSON & DETHIER (1968). The rigidity of the preference behaviour of the two oligophagous species Manduca sexta and Pieris brassicae shows a remarkable difference. The uninduced larvae of Manduca sexta readily accept various non-hostplants which are also suitable for growth and development (SCHOONHOVEN, 1967b; WALDBAUER, 1962). Since preference induction is not possible with non-hostplants, preference induction will restrict the food plant range only within potential host plants. From comparative experiments involving choice tests between diet-grown larvae and maxillectomized larvae grown on tomato it was concluded that in Manduca sexta the conditioning chemosensory input is exclusively received by the maxillae (Ma, unpubl. res.). The picture obtained with larvae of P. brassicae however, is totally different. In this species the acceptability of non-host plants is changed neither by raising the larvae on semi-synthetic medium nor by removal of the maxillae. Moreover, in contrast to M. sexta a preference modification induced within the host plant range is not drastically eliminated by maxil-lectomy. It may be concluded that:
1. the innate preference behaviour is much more rigid in the larvae of P. brassicae than in those of M. sexta;
2. the strong degree of conditioning to the natural host plant may be largely responsible for the oligophagous character of the food selection of older
larvae of M. sexta. In this species conditioning information is mediated by the maxillae. 3. In the discrimination process the part of the chemoreceptive system located
inside the buccal cavity is in P. brassicae larvae no less important than the maxillary organs. The conditioning information is mediated by the maxillae as well as by the sensory organs in the mouth cavity.
18 Meded. Landbouwhogeschool Wageningen 72-11 (1972)

4. Q U A N T I T A T I V E STUDY OF B E H A V I O U R A L C H E M O R E S P O N S E S
4.1. INTRODUCTION
The fact that older larvae can be strongly conditioned to the food on which they were grown (Chapter 3) poses a problem in methodology. When one wishes to evaluate the effectiveness of pure single compounds in influencing the larval feeding response this bias in taste preference can lead to serious difficulties in finding objective response parameters. Since younger instars are not suitable for electrical recording from the chemosensory organs because of their size, fifth instar larvae had to be used in our behavioural studies. However, the problem could at least be partly circumvented by rearing the experimental animals on the artificial diet given in Chapter 2. The artificial diet consists largely of basic nutrients without any material from the natural foodplants and is therefore unable to bias the taste preference of the larva in the direction of a particular plant species. The experimental design used for measuring the responses of the larvae was adapted so that it closely resembled the circumstances met during larval growth.
The réponse parameters used to quantify the food acceptance behaviour were derived from observations on the feeding behaviour of the larvae. By using different qualities and intensities of stimuli it was attempted to gather sufficient information for correlation studies on the chemosensory input in order to gain some insight into the sensory basis of food acceptance behaviour.
4.2. MATERIALS AND GENERAL METHODS
The experimental animals consisted of fifth instar larvae reared ab ovo on the artificial rearing medium. All egg-batches used originated from the inbred laboratory stock culture reared on leaves of Brassica oleracea. For details concerning rearing methods and conditions see Chapter 2. Prior to each experiment the larvae were weighed and selected from within a weight class of 200-250 mg. Preliminary experiments had shown that larvae of this weight did not undergo transformation into prepupae when deprived of food. Under condition of food deprivation locomotory activity can continue for at least six days. On the other hand it was found that about 70-80% of the larvae in the weight class of 300-350 mg underwent pupal transformation during starvation.
Basic media into which test chemicals were incorporated were prepared from a mixture of 4 % granulated agar (Bacto-Agar, Difco Laboratories, USA) and 4% cellulose powder (Alphacel, Nutritional Biochemical Corp., USA) in distilled water. After heating and solidification the agar-cellulose was cut into
Meded. Landbouwhogeschool Wageningen 72-11 (1972) 19

blocks of 8 X 1 cm. The consistency of this substrate corresponded closely to that of the artificial rearing medium. The observation period started after the larva was transferred to the test medium. Biting would usually start at one of the edges. For practical reasons those larvae which did not start biting within 60 sec were discarded for further experimentation. In general such larvae did not show biting activity even when the observation time was much longer. The percentage of larvae which started biting within 60 sec showed a very high daily variation. With 30 hrs starvation prior to testing the percentage varied from 20-80% per day. Unless stated otherwise the test animals were subjected to 30 hrs period of food deprivation prior to the observations.
The experimental conditons were 20-22°C and about 30% RH. The place of observation was illuminated by diffuse TL-illumination from above. Feeding behaviour was recorded by dictating into a tape recorder, while an UV-writing recorder was used for making actographs.
As one of the parameters tested the frass production per time unit was used. Since there can be a large variability in size of the pellets and since they often are broken the number of frass pellets produced in a given period of time is not always reliable as a measure of the total production (WALDBAUER, 1962). Therefore the dry weight of the total excrements produced was measured. The constitution of the basic medium provided the homogeneity in consistency required by the methods used. In addition both agar and cellulose are compounds which are not metabolized by the larvae and thus appear untransformed in the excrements. The experimental animals were selected on the basis of equal size by using only those which had a body weight between 190-230 mg after 8 hours of starvation. The initial period of 8 hours of starvation was given in order to empty the intestinal tract and to attain a homogeneous physiological state for all the experimental animals. Responses were measured from groups of six larvae. Each group was confined in a closed plastic container measuring 6.5 x 10.0 cm and 4.3 cm in height, of which the walls were coated with moist filter paper in order to maintain a high relative humidity. Two blocks of the agar-cellulose were placed in each container. The experiments were performed at 25 °C. After 24 hrs the frass pellets were collected, oven-dried at 80°C and weighed.
For extirpation of the maxillary palpi or the galeae either microscissors or sharp razor blades were used. The operations were performed on young fifth instar larvae which were previously immobilized by cooling with ice. Anaesthesia by C0 2 had a harmful effect on the larvae. As to the selection and standardization of the animals for the experiments the same procedures were followed as described for non-operated larvae.
4.3. RESULTS AND DISCUSSIONS
Under conditions of excess supplies of palatable food lepidopterous larvae, like many terrestrial invertebrates, exhibit an intermittent pattern of periods
20 Meded. Landbouwhogeschool Wageningen 72-11 (1972)

of intense feeding activity and periods of non-feeding. Normally the larvae of the large white butterfly aggregate around or on the food and spend the non-feeding periods in an immobile state. At the onset of a meal (for a definition of a'meal'see section 4.3.2.) the locomotory activity is accompanied by extensive palpating movements during which the tips of the outstretched palpi and presumably also those of the sensilla styloconica touch the substrate. Besides the palpating movements the exploratory behaviour frequently comprises a typical swaying with the anterior part of the body, movements which facilitate orientation to an odour. The larvae possess the typical 'edge-feeding' behaviour so characteristic for phytophagous insects with a biting-chewing feeding habit. This means that a larva normally does not proceed to bite in a plane surface but at feeding sites located at a (leaf) edge. This behaviour is likely to be initiated by the mechano-sensory input from the tactile hairs on the symmetrical mouth appendages and the tactile setae located at each side of the medial identation of the labrum.
Observations were made on temporal feeding patterns of diet-grown fifth instar larvae on their normal food (semi-synthetic medium) primarily with the aim of deriving some useful bio-assays for quantitative evaluation of larval chemoresponses.
J * * .T , T, T5
FIG. 14. Actograph of a sequence of phases of biting activity (Tl, T2, etc.) recorded during one meal (M). The time calibration mark indicates 30 sec. For further explanation see text.
4.3.1. Observations on behaviour patterns Much information was obtained by analysis of actographs of meals occurring
under ad lib. conditions after 4 hrs of food deprivation. One such actograph is presented in Fig. 14 showing that a meal actually consists of a sequence of phases of biting activity interrupted by phases of non-biting. These within-meal phases of non-biting are to be distinguished from the inter-meal periods of non-biting which are much longer in duration. The relationship between the duration of a sequence of biting phases and the amount of food consumed during the same period is shown in Fig. 17.
A representative recording of a regular time pattern of feeding periods under ad lib. conditions after a 4 hrs period of food deprivation is shown in Fig. 15. (Fora definition of a 'feeding period' see section 4.3.2.) The duration of the first feeding period recorded during the observation time is much longer than the subsequent feeding periods. This is also illustrated in Fig. 16 for four animals. The durations of the feeding periods following the first one fluctuated
Meded. Landbouwhogeschool Wageningen 72-11 (1972) 21

200 240
TIME (min)
FIG. 15. Time pattern of feeding periods recorded under ad libitum conditions after a 4 hrs period of food deprivation. The abscissa gives the time scale of the inter-feeding periods in minutes, the ordinate gives the duration of each feeding period in seconds.
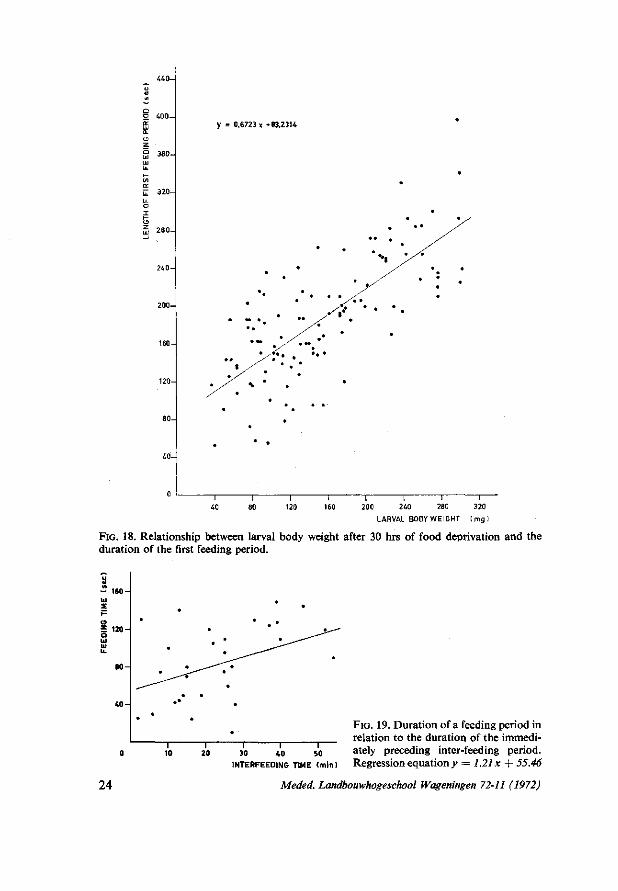
around a mean level (± S.D.) of 77.6 ± 40.2 sec (n = 26), while the duration of the first feeding periods varied between 160 and 210 sec. The duration of the first feeding period recorded after a 4 hrs period of food deprivation largely depended on larval size. This appeared from the positive correlation (r = 0.73) between the duration of the first feeding period and larval body weight (measured after the period of food deprivation). A total number of 116 larvae was used varying in body weight from 30-300 mg. The regression of larval body weight on duration of first feeding period is given in Fig. 18.
— i «o
i 80
—f— 120
1 1 160 200
FEEDING TIME (sec)
FIG. 16. Duration of an inter-meal period in relation to the duration of the immediately preceding feeding period. Data of four larvae starved for 30 hrs. Encircled values represent the duration of the first non-feeding period plotted against the duration of the first feeding period.
22 Meded. Landbouwhogeschool Wageningen 72-11 (1972)

FIG. 17. Relationship between duration of a feeding period and the concomitant change in larval body weight. Regression e-quation y = 18.25 x + 70.85.
—i— MO 220 260 300
BITING SEQUENCE (sec)
The existence of regulation of food intake as suggested by the above data is supported by an analysis of the data of a similar experiment as illustrated by Fig. 16. This time, however, the duration of a feeding period was plotted against the immediately preceding non-feeding time (Fig. 19). In contrast to the results presented in Fig. 16 a positive correlation was demonstrable (rs = 0.35 with P < 0.05 ; Spearman rank correlation test).
From these data it can be concluded that under ad lib. conditions food intake activity is regulated at a certain frequency level of feeding periods.
With regard to parameters and experimental conditions which may be applied during analysis of larval chemoresponses the above results suggest that: 1. recordings of time intervals during which biting sequences are being ob
served could possibly provide a useful basis for evaluation of larval chemoresponses;
2. the animals used for the experiments should preferably be of the same size class ;
3. it would be appropriate to introduce a definite period of food deprivation for each experiment.
4.3.2. Parameters of larval chemoresponse In the experiments on larval chemoresponse each observation period started
after the test animal was transferred to the feeding substrate. The record then began at the onset of the first biting activity and the observation period was ended when biting activity remained absent for longer than 30 seconds. In the mean time the various phases of biting (feeding) activity and non-biting were
Meded. Landbouwhogeschool Wageningen 72-11 (1972) 23
E 320-
y = 0.6723 x »83.2314
- 1 -
40 240 280 200 240 280 320 LARVAL BODY WEIGHT (mg!
FIG. 18. Relationship between larval body weight after 30 hrs of food deprivation and the duration of the first feeding period.
40-
24
10 20 30 40 50 INTERFEEDING TIME (min)
FIG. 19. Duration of a feeding period in relation to the duration of the immediately preceding inter-feeding period. Regression equation y = 1.21 x + 55.46
Meded. Landbouwhogeschool Wageningen 72-11 (1972)

recorded. The actograph shown in Fig. 14 will be taken as a model to illustrate the different terms and response parameters applied. The biting phases are in sequential order designated as Tl, T2, T3, . . . etc. A 'meal' comprises the time interval between the beginning of the first phase and the end of the last phase of biting activity occurring during an observation period. The duration of 30 sec of non-biting taken as a criterion for determination of the end of a meal was based on preliminary experiments which showed that after such a time lapse biting activity normally was not resumed before a period of at least several minutes had passed (see also Fig. 15). Moreover, any biting phase occurring outside the observation was of negligible duration.
The duration of a meal (M) is not a reliable index of actual feeding activity since the durations of the within-meal intervals of non-biting are influenced by the chance that the animal will find the edge of the substrate where biting will take place. Therefore I preferred to use the total time spent by the larva with biting activity as a response parameter. This time interval will be called a 'feeding period' (Ts). In Fig. 14 parameter Ts is thus described as: Ts = Tl + T2 + T3 + ... + T7.
In order to obtain additional information on the behaviour of the larvae two other response parameters were studied also, viz. the duration of the first phase of biting activity (Tl) and the number of phases of non-biting occurring during one meal (Fi). Ts and Tl are both expressed in sec. A fourth response parameter (Fp) is defined as the dry weight (mg) frass production per six larvae during an observation period of 24 hrs. For materials and methods used see section 4.2.
4.3.3. Behaviour responses to sugars and related compounds Exper iment X I I - Selectivity within the carbohydrates
Fp values were determined with a total of twenty different carbohydrates. These compounds have been listed in Table 16. Each compound was presented in two concentrations, viz. 0.01 M and 0.2 M and each observation was made in triplicate. The individual tests were carried out in a random time order. With the exception of sucrose and glucose none of the various pentoses, di- and trisaccharides or polyhydric alcohols evoked a mean Fp value which differed significantly from the values measured with the control medium to which no chemical had been added. Tentatively the result indicated that the larvae possessed a very high selective responsiveness for sucrose and glucose only.
Exper iment X I I I - Relative effectiveness of three sugars This experiment was carried out in order to compare the relative effectiveness
of three sugars in evoking food intake responses. The compounds investigated were sucrose, glucose and fructose. Each compound was presented in eleven different concentrations varying from 0.0005 M to 1.0 M. In order to make the effect per concentration tested directly comparable each concentration was studied individually with all three compounds. Per concentration six replicates were made, spread over different days in random order.
Meded. Landbouwhogeschool Wageningen 72-11 (1972) 25

KO
100
80-
Fp
r -T -H- 0.001 0.002 0.004 0.02 045 0.1 0.2 03
MOLAR CONCENTRATION
FIG. 20. Larval responses to varying concentrations of sucrose (closed circles) and glucose (open cricles) as established for the Fp in experiment XIII. For further explanation see text.
Fructose appeared to be ineffective in inducing a positive Fp over the whole range of concentrations presented. Of the two effective sugars, sucrose proved to be much more powerful in evoking feeding responses than glucose. This difference can be judged from the lower treshold of response of sucrose and its higher maximum Fp value which is achieved at a lower optimal concentration
J^ITULI
.J L
:ULULJ! 1
ni
Hfl ! ! ! .J l l l iUL
(a)
26 Meded. Landbouwhogeschool Wageningen 72-11 (1972)

juuux
j ^ T ^ i m
jn^.._jUL
J U n (b)
TT™TTir_inn H O T i l r wi
J inr inrui JLLTTiii .nr üij__.._
J I TT'lILJLrLTJ
j F T u inr i__.
j ]\ T" IHTLTLTI
(c)
FIG. 21. Examples of actographs recorded at three sucrose concentrations during 6 min. observation periods, (a) —2.5 log mol cone; (b) —1.5 log mol cone; (c) —0.5 log mol concentration. The actographs are all made with individual larvae. Time calibration 30 seconds.
(Fig. 20). The data also indicate that at concentrations higher than 0.3 M the food intake rate shows the tendency to decrease. This and other issues were investigated further by analysis of the behaviour responses to sucrose, glucose and fructose as assessed by the Ts, Tl and Fi variables.
Experiments XIV-XVI - Analysis of actograph recordings In this series of experiments some features of the animal's behavioural
response to sucrose, glucose and fructose were studied by analysis of actograph recordings (experiments XIV, XV and XVI, respectively). Some of these
Meded. Landbouwhogeschool Wageningen 72-11 (1972) 27

TABLE 3. Larval responses to three sugars at various concentrations. Treatment means are given (N = 12) for three response parameters. For further explanations see text.
log molar concentration
Experiment parameter con- —3.0 —2.5 —2.0 —1.5 —1.0 —0.5 trol
XIV (sucrose)
XV (glucose)
XVI (fructose)
Ts T l Fi
Ts T l Fi
Ts T l Fi
8.02 2.99 1.25
8.83 3.62 2.08
8.43 3.83 3.17
10.79 4.18 2.42
14.78 5.62 2.92
8.47 3.69 1.83
12.88 5.49 2.41
10.13 5.03 2.16
9.33 5.73 1.41
29.63 9.10 5.41
13.40 7.01 2.00
8.45 5.13 1.08
120.97 16.27 8.42
12.69 6.75 2.08
8.18 6.66 0.67
136.57 20.00
5.83
23.67 10.25 2.58
11.20 4.57 2.42
161.90 21.60
8.50
92.62 19.26 7.25
8.07 3.56 1.67
83.94 9.43 7.92
86.82 25.28
5.42
9.63 3.83 2.25
recordings are shown in Fig. 21. The effect of the addition to the basic medium of seven concentrations of each sugar on the larval behaviour was investigated. The concentrations were equally distributed over a range varying from 0.001 to 1.0 molar concentration. The experiments were too big to be undertaken at one time and were therefore carried out over a period of days. For each sugar a randomized complete block design was applied in which each block represents a day. Within each block the treatments were assigned randomly to the larvae and presented in random time order. Three blocks of equal size were used in each experiment. Within each block the treatments were replicated four times and thus a total number of 96 larvae were used per experiment. The experimental animals (see section 4.2.) were starved for a period of 30 hrs.
The treatment means of the Fi, Ts and Tl parameters as established for each sugar are given in Table 3. Logarithmic concentrations are applied in view of related studies on sensory reactions. The analysis of variance of each experiment and each parameter were performed on the logarithmically transformed data (In (x + 1)) on basis of the relation between treatment means and variances. The results of the analyses are presented in Appendix I—III. The F-values show that only in a few cases a significant block effect can occur. The F-values for treatments show that a very clear effectiveness of sucrose and glucose is reflected in response parameters Ts and Tl. In experiment XI, however, there is no reason to conclude that fructose has any effect on these variables. These conclusions are in agreement with the results of experiment XIII. With the Fi parameter the results are less conclusive since there are indications of an interaction between blocks and treatments in experiments XV and XVI. In itself it may be an indication of the higher effectiveness of sucrose as compared to glucose. This is also sho wn by Table 4 presenting the lowest concentration of sucrose and glucose which still is significantly effective (Student's t-testat 95 % proba-
28 Meded. Landbouwhogeschool Wageningen 72-11 (1972)

TABLE 4. Threshold concentrations (expressed in log moles/litre) of response established in experiment XIV and XV. One-sided Student's t-tests at 95 % probability level on the transformed data. The outcome of two-sided tests is given in brackets.
Response parameter
Ts Tl Fi
experiments
XIV (sucrose)
-2 .0 (-2.0) -2.5 (-2.0) -2.0 (-2.0)
XV (glucose)
-1 .0 (-1.0) -2 .0 (-1.5) -0 .5 (-0.5)
bility level). With sucrose a lower concentration is found for each of the response parameters.
Another interesting issue pointed out in experiment XIII was the decrease in feeding response observed at high sugar concentrations. In experiments XIV and XV the difference between the effect of the two highest concentrations applied was tested on significance. This difference appeared to be significant in case of sucrose but not of glucose. Significance could only be established for the Ts and Tl parameters (Student's t-test; P = 0.05, two sided). In view of the results presented in Table 3 this difference is due to a decrease in response at high concentration of sucrose.
4.3.4. The effect of starvation on the response to sucrose Since starvation might affect the gustatory sensitivity (for various examples
with insects, see DETHIER and CHADWICK, 1948) the responses to sucrose were examined in relation to different periods of food deprivation. The starvation periods applied varied from 4 to 78 hours. It should be realized that a period of three days is a relatively long time in the larval life (average duration 15 days). During the first three days of starvation the animals showed no mortality. Mortality increased from 10-15 per cent on the fourth day to about 60 per cent on the fifth day of starvation.
Exper iment X V I I - Effect of different concentrations and starvation periods The experiment was carried out in an essentially similar way as described in
experiment XIV. Five sucrose concentrations (0, 0.001, 0.01, 0.1 and 1.0 M) were studied in combination with four starvation periods (4, 30, 54 and 78 hrs). The randomized complete block design consisted of six blocks and twenty treatments per block. Each treatment was replicated twice per block. Thus for the experiment a total number of 240 larvae was used.
The means and standard deviations are shown in Table 5. The data were less suitable for parametric tests since no appropriate transformation existed by which the assumption of homogeneity of variances could be satisfied. The mean values are shown graphically in Figs. 22-24. The results suggest that an interaction exists between the effects of starvation and sucrose concentration. At higher concentrations the effect of starvation seems to be relatively more
Meded. Landbouwhogeschool Wageningen 72-11 (1972) 29

C O O,
•O C
ö,.S Vi (-I u o H a o x o S
•o Ö
CN > —' 'S
II &
w o
H 2 v-i ig
% 3
O vo <n »ri SO ON r-* wi H
-H-H-H 00 ^- P~ r^ oo ^ H
vi r~>' en CN
ON 1— -»
CN' •* O N
NO —i
-H-H-H tri Tf (N r- w-i o *-" -^ o\" O N •—«
00 CS Tl-00 t^ 00 en od »rî r- es
-H-H-H vi o 1^ 0 « H O ON CN
—! C N - H
•* O CN 'S •*• •* NO CM -H-H-H 00 m (•»
^f od a\ CN T-l
c o a
5 T3
* 8.
H m m r-- so so od so m'
-H-H-H Tt OO (M " o n t od o\ Tf'
"o oo m V| N h; H" c4 m*
SO H -H-H-H
r- vi NO'
0\ rt
M > 0
vi ON Tt
+m-H O v i n v-j ^ m oö -^ oo'
" O W N ON •>3- r^
NO N O
-H-H-H « O N m m a\ CN TJ-' K NO NO
£g :
-H-H-H -H-H-H -H-H-H -H-H-H OO l~- «n SO 00 Ol
r-* p»" oi
-H-H-H Tt- TJ- m r t T> rn od r f ^
WÎ - H . -H
H H »H
« N N
m o NO Tf v-i m ON CN' *M
-H-H-H
1 ^ in rn i-î
o\ t> ~* O m 00 ö c4 c4 1—1
-H-H-H "* •* CN NO 00 Tf NO *<ƒ C*S
vi oo r-; Ö ON' -* NO -H-H-H v-i CN oo
vi Ö NO
•q- NO -H CJ O NO •» r~ vi
-H-H-H NO NO (— oo m NO oo CN' vi
Tt »n t~* oo rsj so a\ en en
-H-H-H oo en ON
Tt >o eN
O 00 N so Tt so Tt so ri
-H-H-H N o o m 00 H 00 » t ^ N
O ON V>
NO ON « 00 NO CN CN
-H-H-H 00 o CN r-~ v-> ^ ON 00 en CN
HH'ft. P h f c H H K
30 Meded. Landbouwhogeschool Wageningen 72-11 (1972)

FIG. 22. Effect of four starvation periods on the mean response values to five different concentrations of sucrose as established for the Ts parameter.
T l
A — A 4 h r • — • 30
,A—A 54 o — o 78
o 78
A 54
• 30 A 4
180
160-
100
TS
A—A 4 h r
• — • 30 A—A 54 o — o 78
A54 •30
-3 .0 -2.0 -1.0 0 LOG MOL CONC. SUCROSE
-2.0 -1.0 0 LOG MOL CONC. SUCROSE
FIG. 23. Effect of four different starvation periods on the mean response values to five different concentrations of sucrose as established for the Tl parameter.
Meded. Landbou whogeschool Wageningen 72-11 (1972) 31

A —A 4hr • — • 30 A — i 54 o — o 78
FIG. 24. Effect of four starvation periods on the mean response values to five concentrations of sucrose as established for the Fi parameter.
-2.0 -1.0 LOG MOL CONC. SUCROSE
pronounced than at lower concentrations. The decrease in Ts and Tl response values observed in experiment XIV at high sucrose concentration does not seem to be affected by prolonged starvation. Also the forms of the Fi response curves are in agreement with the results established for the same parameter in experiment XIV. In both cases the decrease in response found with Ts or Tl was not apparent with the Fi parameter.
4.3.5. Behaviour responses to sinigrin and its interaction with sucrose In order to compare the effect ol sucrose with that of mustard oil glucosides
and to investigate the possible interaction between the two types of stimuli the following series of experiments were performed.
32 Meded. Landbouwhogeschool Wageningen 72-11 (1972)

Experiment XVIII - The effect of different concentrations of sinalbin. Fp values were determined for a wide range of concentrations of sinalbin
varying from 2.10-6 M to 5.10-3 M. Each concentration of sinalbin was studied in the presence of two different concentrations of sucrose. Each pair of stimuli was presented simultaneously to the larvae. The sucrose concentrations chosen (0.004 and 0.01 M) were relatively low in order to allow a further increase in feeding rate to occur. Each treatment was replicated at least five times and the various treatments were applied in a random time order. The results (Fig. 25) show that within the concentration range studied the food intake rate remains limited to a relatively low level in comparison with the optimal effective concentration of sucrose. Since the Fp values remain about constant at concentrations of sinalbin higher than about 2.10-5 M the possibility that the concentration range used is sub-optimal can be ruled out. The results rather suggest that the concentration of sucrose applied in this experiment acted as a limiting factor for further increase in food intake rate.
Fp
I . ,—i ' i ' ' ' | 1 ' I ' ' | ' ' T
-°° -5 - 4 -3 LOG MOLAR CONCENTRATION
FIG. 25. Response values to mixtures of sinalbin and sucrose as established for the Fp parameter (experiment XVIII). The concentrations of sinalbin are plotted on the abscissa. Each concentration of sinalbin was presented with either 0.004 M sucrose (•) or with 0.01 M sucrose ( A).
Experiment X I X - The response of sucrose and sinigrin (1) The dependency of larval food intake in the sugar concentration in spite of
the presence of mustard oil glucoside was further demonstrated by studying the effect of sinigrin in relation to different concentrations of sucrose. The experiment was essentially similar to experiment XIII except that each concentration of sucrose was mixed with a concentration of 0.005 M sinigrin. Comparison of the results (Fig. 26) with those presented in Fig. 20 reveals that the maximum Fp values evokable by a combination of sinigrin and sucrose are not different from the maximum Fp values reached with sucrose alone.
Meded. Landbouwhogeschool Wageningen 72-11 (1972) 33

Fp
O 0.0005 0.001 0X102 0,004 0.01 002 0.05 0.1 t
MOLAR CONCENTRATION SUCROSE
FIG. 26. Response values to mixtures of sucrose and sinigrin as established for the Fp in experiment XIX. Each concentration of sucrose applied (plotted on the abscissa) was presented in combination with 0.005 M sinigrin.
In other words sucrose alone is able to induce the maximum food intake rate in the larvae. For this reason the effect of sinigrin becomes discernible only at relatively low concentrations of sucrose (lower than 0.05 M). A special point of interest is that the results seem to indicate that over this low concentration range the larvae tend to have a higher food intake rate when presented with a mixture of sucrose and sinigrin than would be the case when the effects of the single components are merely summated. To investigate this point the effect of sucrose and sinigrin was further compared by studying the behaviour by direct observation.
Exper iment X X - The response to sucrose and sinigrin (2) In this experiment the feeding behaviour of the larvae was studied by the
analysis of actographs (see sections 4.2. and 4.3.2.). Apart from the control (no chemical added to basic medium) the larvae were presented with five other treatments, including one level of sinigrin (0.005 M), two levels of sucrose (0.003 M and 0.3 M) and the three respective combinations of sucrose and sinigrin. The experiment was designed in three randomized complete blocks (days) of equal size. The treatments were randomly assigned to the experimental animals and applied in random time order. Within each block the treatments were replicated four times. Thus a total number of 72 animals were used.
34 Meded. Landbouwhogeschool Wageningen 72-11 (1972)

t>0
g •3 e o D.
8 ~H m O i~ ** •*
NO' NO ^
-H-H-H <N O oo oo m «n c4 ON' vd
0> (1 OJ rn NO O a\ -*t en'
-H-H-H (S ~H in 0\ ON N ^ c4 NO'
ö T3
e
0
3
m Ö
so
.5 50
'S 'w
O N I ^ O -H O ON
ö ri ö
-H-H-H
-H-H-H
-H-H-H
o m ~*
-HHH-H o\ r- »o " " "1 ^ t^- w-î rs
f i h S
o T3
8 Ö
'E
o o ö
5 2-3
<*-< M ei.
g O oi
J* » ^J "-1 o « S a k . " S o S ,_, to
S S. S o « « P S
«8£ 3 — MH
G o .S rt H H > e -S1 u o c
43 O Vi
Meded. Landbouwhogeschool Wageningen 72-11 (1972) 35

The treatment means and standard deviations are given in Table 6. Since the treatment means were positively correlated with the variance the data were examined by analysis of variance on the logarithmically transformed data (In x) (see Appendix IV). The results show that with the three response parameters applied the response of the larvae to sinigrin, when presented as a single compound, does not differ significantly from the control. However, a positive interaction between sinigrin and sucrose effects is apparent when applying the Ts parameter. The interaction between 0.003 M sucrose and 0.005 M sinigrin is close to significance level (P = 0.06) while there is clearly no interaction between 0.3 M sucrose and 0.005 M sinigrin (P = 0.40). In agreement with the results of the foregoing experiment it appears that the values of the Ts, Tl or Fi significantly increase when changing the sucrose concentration from 0.003 M to 0.3 M. This effect remains highly significant for Ts and Tl , though not for Fi, when the responses to the same sucrose concentrations are compared but this time in the presence of sinigrin.
4.3.6. Stimulating effects of some other chemical compounds In a series of experiments (XXI-XXIV) the Fp parameter was used to assess
larval responsiveness to some chemical compounds. Ascorbic acid, which has a general botanical distribution and stimulates feeding in a number of insects (THORSTEINSON, 1958; ITO, 1961) was studied together with the effects of some amino acids and salts.
Exper iment XXI - Response to ascorbic acid. The response to ascorbic acid was investigated by presenting different con
centrations together with a constant amount of sucrose (0.01 M). Simultaneously the effect of 0.01 M sucrose was also assessed without ascorbic acid.
0.0002 0.0005 0.001 0.002 0.005 0.01 molar concentration
FIG. 27. Feeding response to mixtures of 1-ascorbic acid and sucrose. Each concentration of ascorbic acid (plotted on the abscissa) was presented in combination with 0.01 M sucrose. Mean values for the Fp (± 2. S. D.) are shown for the response to mixtures of ascorbic acid and sucrose (dark columns) and for the response to 0.01 M sucrose singly (white columns).
36 Meded. Landbouwhogeschool Wageningen 72-11 (1972)

Fig. 28. Mean response values ( ± 2. S. D.) as established for the Fp to mixtures of sucrose and 1-proline (white columns) or 1-methionine (dark columns). The concentrations of amino acid applied are plotted on the abscissa. Each concentration was presented in combination with 0.004 M sucrose.
0.01 0.02 0.05 0.1
MOLAR CONCENTRATION
The mean Fp values of four replicates per test are shown in Fig. 27 for six different concentrations of ascorbic acid. The choice of the range investigated was based on preliminary experiments which also had revealed that ascorbic acid as a single compound does not induce a positive Fp at any of the concentrations studied. The mean values measured with 0.01 M sucrose remained about constant over the different observations indicating that the time of presentation of the various treatments did not significantly interact with the responsiveness of the larvae. In mixtures with sucrose the mean Fp value was positively related to the concentration of ascorbic acid reaching a maximum at about 0.002 M. A progressive inhibition at higher concentrations eventually resulted in a decrease of the response to 0.01 M sucrose. This inhibition was achieved with a concentration of 0.01 M ascorbic acid. The inhibitory effect could, however, almost be neutralized by increasing the sucrose concentration to 0.1 M.
Exper iment XXI I - Response to amino acids. In preliminary studies tests were made with a number of amino acids using
two concentrations, viz. 0.01 and 0.05 M. The compounds were either mixed with a concentration of 0.004 M sucrose or studied as single compounds. Each test was repeated at least three times. From the results of these tests it was concluded that no significant positive responses could be derived with the following amino acids when presented in the concentrations applied : 1-gluta-mine, 1-glutamine acid, glycine, 1-histidine hydrochloride, 1-homoserine, 1-leucine, 1-lysine, 1-phenylalanine, 1-serine and 1-valine. Positive responses were apparent with 1-proline (in both concentrations) and with 1-methionine (at
Meded. Landbouwhogeschool Wageningen 72-11 (1972) 37

0.05 M concentration), but only when these compounds were mixed with sucrose. The effect of 1-proline and 1-methionine was further studied over a wider concentration range covering 0.002 to 0.1 M. The experimental design was similar to that described in experiment XXI. The treatment means (Fig. 28) show that methionine is less effective which is revealed by a higher treshold value and a lower maximum Fp value than obtained with proline. The two response curves relate to each other in a way which shows resemblance to the relative effectiveness of sucrose and glucose.
Experiments XXIII and XXIV - Response to salts. In these experiments the effects of two salts were compared with each other,
viz. sodium chloride and sodium nitrate (experiment XXIII) and sodium mono-and dihydrogenphosphate (experiment XXIV).
The relative effectiveness of sodium chloride and nitrate was compared by studying a series of five concentrations ranging from 0.01-0.2 M. Each compound was studied singly as well as in combination with 0.004 M sucrose. Treatment means are shown in Fig. 29. The results show that neither sodium chloride nor sodium nitrate stimulated feeding when presented without sucrose. With sucrose present a relation between stimulus concentration and the Fp response parameter appeared. The response thresholds are situated at 0.01 M for both salts; maximum response values are, however, lower with sodium chloride than with sodium nitrate and reached at lower concentration (0.05 and 0.1 M respectively). Sodium chloride at a concentration of 0.1 M is distinctly inhibitory. The stimulus-response relations as suggested in this experiment are thus essentially different from those established with amino acids or sugars.
A
ai
0.05 0.1 O.i
MOLAR C0NC.
FIG. 29. Mean response values (± 2. S. D.) as established for the Fp to mixtures of sucrose and sodium nitrate (white columns) or to mixtures of sucrose and sodium chloride (dark columns). Each concentration of salt was presented in combination with 0.004 M sucrose. The salt concentrations are plotted on the abscissa. The most left column represents the response to 0.004 M sucrose.
38 Meded. Landbouwhogeschool Wageningen 72-11 (1972)

In experiment XXIV a comparison was made between the effect of mono- and dihydrogenphosphate. In aqueous solution the pH over a concentration range from 0.005-0.5 M varied from 8.9-9.2 for Na 2HP0 4 and from 4.83-4.25 for NaH2P04 . The Fp response parameter was applied to evaluate the effect of seven concentrations ranging from 0.005-0.5 M. As usual each concentration was studied singly and in combination with 0.004 M sucrose. The experimental design was similar to that mentioned in experiment XXI. The results (Fig. 30) show that sodium dihydrogenphosphate is ineffective in inducing positive responses regardless of whether it is combined with sucrose or not. Sodium monohydrogen phosphate, however, is able to increase feeding responses when mixed with 0.004 M sucrose. A mixture of 0.05 M with 0.004 M sucrose resulted in a five to six fold increase in feeding rate when compared to the effect of 0.004 M sucrose alone. It might be possible that the acidic character of the dihydrogen phosphate is responsible for its inability to promote feeding or that the observed action of monohydrogen phosphate is related to an interacting effect of the high pH with the stimulating inorganic ions. The observed positive responses to ascorbic acid with a similar pH to dihydrogen phosphate is an argument in favour of the last mentioned possibility.
rti
h
[tl *
0.005 0.01 0.02 0.05 0.1 0.2 0.5
MOLAR CONCENTRATION
FIG. 30. Mean response values (± 2. S. D.) as established for the Fp to mixtures of sucrose and sodium monohydrogen phosphate (white columns) or sodium dihydrogen phosphate (dark columns). The concentrations of sodium salt applied are plotted on the abscissa. Each concentration was presented in combination with 0.004 M sucrose. The most left column represents the response to 0.004 M sucrose.
Meded. Landbouwhogeschool Wageningen 72-11 (1972) 39

4.3.7. The effect of calcium and sodium chloride on response to sucrose. Special attention was paid to the effect of calcium chloride and sodium chlo
ride on the larval feeding behaviour in view of the results obtained in electrophysiological experiments (see Chapter 6). The effect of both salts on the response to sucrose was investigated by analysis of actographs (section 4.2.). For a discussion of the results in relation to electrophysiological data, see Chapter 7.
Exper iment X X V - a ) Effect of calcium chloride The effect of the addition of different concentrations of calcium chloride
(0; 0.05 M; 0.1 M; 0.2 M and 0.4 M) to a feeding substrate (0.1 M sucrose) was investigated using the Ts, Tl and Fi varaibles (section 4.3.2.). The experiment was designed in three complete blocks with four replicates per block. Like in foregoing experiments the treatments were randomly presented to the experimental animals and in a random time order.
The treatment means and corresponding standard deviations appear in Table 7. The Ts values are also graphically shown in Fig. 31. The analysis of variance which was performed on the data after the transformation In (y + 1) applies to the actual concentration of calcium chloride. The values established for the Ts reflect a distinct decrease with increasing concentration of calcium chloride. The course of the response curve can very well be described by a linear function (Appendix V). The Tl values give less conclusive results. Concerning the data established with the Fi response parameter no definite conclusions can be drawn about an effect of calcium chloride in view of the interaction between blocks and treatments.
TABLE 7. Effect of calcium chloride on the feeding response to sucrose (experiment XXV). Mean values and standard deviations (N = 12) are presented as measured by different response parameters.
Response treatments*
Ts Tl Fi
167.75 ± 82.00 42.15 ± 41.21 6.83 ± 4.45
131.40 ± 63.36 38.88 ± 31.56 6.75 ± 4.35
110.92 ± 43.69 30.85 ± 14.59 8.42 ± 3.80
parameter ( 0 ) ( 1 ) ( 2 ) ( 3 ) ( 4 )
87.82 ± 34.26 47.71 ± 14.64 30.17 ± 15.48 19.43 ± 7.10 5.75 ± 3.02 3.83 ± 1.80
* The various treatments are given as follows : (0) 0.1 M sucrose; (1) 0.1 M sucrose and 0.05 M CaCl2; (2) 0.1 M sucrose and 0.1 M CaCl2; (3) 0.1 M sucrose and 0.2 M CaCl2; (4) 0.1 M sucrose and 0.4 M CaCl2. For analyses of variance, see Appendix V.
b) Effect of sodium chloride The effect of sodium chloride was analysed in a way similar to the foregoing
experiment. Equally as in the latter case the concentrations of sodium chloride
40 Meded. Landbouwhogeschool Wageningen 72-11 (1972)

FIG. 31. Concentration effects of calcium chloride on the behavioural response to 0.1 M sucrose as established for the Ts (experiment XXVa). 160-
120-
80-
40-
sucrose 0.1
Mr-0.05 0.1 0.2 0Ä
Cone. CaCl2 (M)
investigated were chosen on basis of electrophysiological data (Chapter 6). Sodium chloride was added to a feeding substrate of 0.1 M sucrose in one of the following concentrations: 0, 0.05 M, 0.2 M, 0.5 M and 2.0 M.
Table 8 presents the treatment means and corresponding standard deviations established f or the various variables studied. The mean Ts values are also plotted in Fig. 32. After analysis of variance (Appendix VI) of the data it is concluded that all parameters show that increasing concentrations of sodium chloride have a progressively suppressing effect on the response to sucrose. In all cases this effect, at least over the concentration range tested, is practically linear.
TABLE 8. Effect of sodium chloride on the response to sucrose (experiment XXVI). Mean values and standard deviations (N = 12) of three variables are shown.
Response parameter
treatments*
(0) (1) (2) (3) (4)
Ts Tl Fi
120.76 ± 58.09 25.59 ± 12.63 8.92 ± 6.69
98.46 ± 101.77 21.67 ± 11.09 7.67 ± 4.96
146.11 ± 89.14 28.70 ± 17.39 11.42 ± 9.32
71.24 ± 67.82 10.60 ± 7.96 19.86 ± 33.57 4.30 ± 2.51 7.41 ± 6.58 2.63 ± 1.75
* The various treatments are represented as follows : (0) 0.1 M sucrose; (1) 0.1 M sucrose and 0.05 M NaCl; (2) 0.1 M sucrose and 0.2 M NaCl; (3) 0.1 M sucrose and 0.5 M NaCl; (4) 0.1 M sucrose and 2.0 M NaCl. For analyses of variance, see Appendix VI.
Meded. Landbouwhogeschool Wageningen 72-11 (1972) 41

160-
120-
80-
40-
FIG. 32. Concentration effects of sodium chloride on the behavioural response to 0.1 M sucrose as established for the Ts (experiment XXVb).
^ 1 1 1 r 0.05 0.2 0.5 2.0
Cone. NaCl (M)
No significant positive interaction is present between the concentrations of sucrose and sodium or calcium chloride used in this experiment (Student's t-test at P = 0.05; two-sided).
4.3.8. The effect of mouth part ablations Before assessing the effect of amputation of certain mouth parts on larval
chemoresponses it was necessary to determine to what extent such ablations could affect the ability of the larvae to feed. Therefore the following experiment was carried out.
Experiment XXVI - Extirpation of different mouth parts. Young fifth instar larvae reared on semi-synthetic diet were subjected to
bilateral ablation of different mouth appendages. The following ablations were performed: 1. antennae and maxillary palpi; 2. maxillary galeae and palpi; 3. antennae, galeae and palpi; 4. labrum; 5. antennae, labrum and palpi; 6. antennae, labrum and maxillae. The percentage of larvae that recovered from an operation varied with the kind of treatment. The survival rate was smallest (about 30 %) after extirpation of all mouth appendages (treatment 6) and highest (100 %) after treatments 1, 2 and 3. The recovery of the larvae was judged from their overall appearance, apparent success of wound healing and locomotory activity. The success of the operation was checked under the stereomicroscope. From those that recovered six larvae were taken after a period of 12 hrs on the food. Subsequent changes in body weight were used as an index for food intake on fresh young cabbage leaves. The body weights were determined at regular time intervals of 12 hrs. The experimental temperature was maintained at 25 °C.
42 Meded. Landbouwhogeschool Wageningen 72-11 (1972)

No increase in body weight occurred after treatment 6 (Fig. 33). These larvae showed characteristic biting activity on the leaves encountered, but apparently the tactile information from the mandibles and peribuccal hairs are, in most larvae, not sufficient to induce actual food intake. A certain minimum amount of positive chemosensory input greatly contributes to a high rate of feeding resumption. This can be inferred from Fig. 33 which shows a lower rate of increase in larval body weight when the operation removes a greater number of important organs. The antennae, however, do not seem to have any influence on larval food intake behaviour.
. . UNOPERATED CONTROL.
» . ANTENNAE AND PALPAE. . . . GALEAE AND PALPAE. . . ANTENNAE. GALEAE AND PALPAE. » LABRUM. . . ANTENNAE. LABRUM.PALPAE. . . ANTENNAE, LABRUM, MAXILLAE.
60 72
T I M E ( h o u r s )
EXTIRPATED ORGANS
FIG. 33. Larval growth on Brassica leaves after extirpation of different mouth parts. Mean fresh body weight of six larvae in mg (ordinate).
Meded. Landbouwhogeschool Wageningen 72-11 (1972) 43
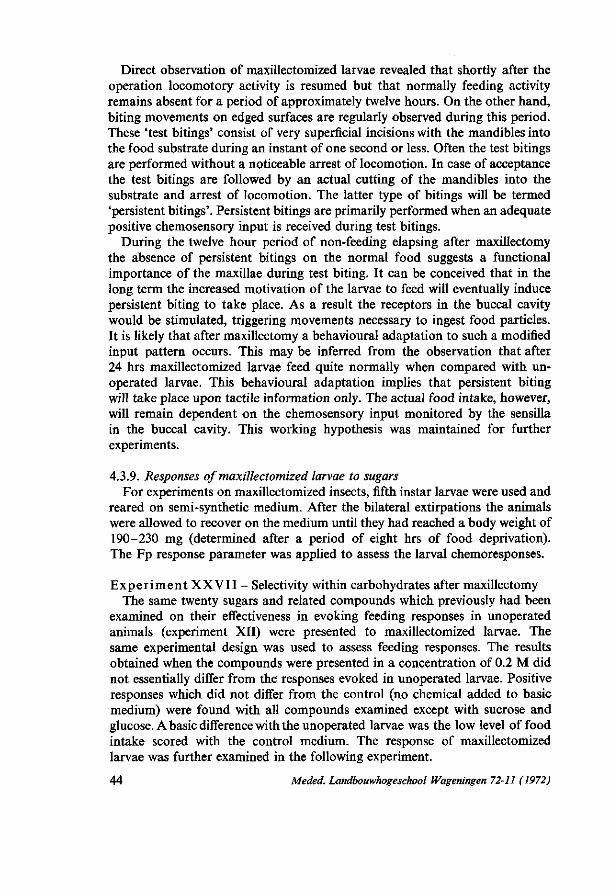
Direct observation of maxillectomized larvae revealed that shortly after the operation locomotory activity is resumed but that normally feeding activity remains absent for a period of approximately twelve hours. On the other hand, biting movements on edged surfaces are regularly observed during this period. These 'test bitings' consist of very superficial incisions with the mandibles into the food substrate during an instant of one second or less. Often the test bitings are performed without a noticeable arrest of locomotion. In case of acceptance the test bitings are followed by an actual cutting of the mandibles into the substrate and arrest of locomotion. The latter type of bitings will be termed 'persistent bitings'. Persistent bitings are primarily performed when an adequate positive chemosensory input is received during test bitings.
During the twelve hour period of non-feeding elapsing after maxillectomy the absence of persistent bitings on the normal food suggests a functional importance of the maxillae during test biting. It can be conceived that in the long term the increased motivation of the larvae to feed will eventually induce persistent biting to take place. As a result the receptors in the buccal cavity would be stimulated, triggering movements necessary to ingest food particles. It is likely that after maxillectomy a behavioural adaptation to such a modified input pattern occurs. This may be inferred from the observation that after 24 hrs maxillectomized larvae feed quite normally when compared with un-operated larvae. This behavioural adaptation implies that persistent biting will take place upon tactile information only. The actual food intake, however, will remain dependent on the chemosensory input monitored by the sensilla in the buccal cavity. This working hypothesis was maintained for further experiments.
4.3.9. Responses of maxillectomized larvae to sugars For experiments on maxillectomized insects, fifth instar larvae were used and
reared on semi-synthetic medium. After the bilateral extirpations the animals were allowed to recover on the medium until they had reached a body weight of 190-230 mg (determined after a period of eight hrs of food deprivation). The Fp response parameter was applied to assess the larval chemoresponses.
Experiment XXVII - Selectivity within carbohydrates after maxillectomy The same twenty sugars and related compounds which previously had been
examined on their effectiveness in evoking feeding responses in unoperated animals (experiment XII) were presented to maxillectomized larvae. The same experimental design was used to assess feeding responses. The results obtained when the compounds were presented in a concentration of 0.2 M did not essentially differ from the responses evoked in unoperated larvae. Positive responses which did not differ from the control (no chemical added to basic medium) were found with all compounds examined except with sucrose and glucose. A basic difference with the unoperated larvae was the low level of food intake scored with the control medium. The response of maxillectomized larvae was further examined in the following experiment.
44 Meded. Landbouwhogeschool Wageningen 72-11 (1972)

Fp
40-
! •—1 1 1 0.001 0.002 0.004
I I I I I 0.01 0.02 0.05 0.1 0.2
MOLAR CONCENTRATION
FIG. 34. Feeding responses of maxillectomized larvae to sucrose (black dots) or to glucose (open circles). Mean values ( ± 2. S. D.) are shown established for the Fp and calculated from 6 sets of data.
Experiment XXVIII - Relative effectiveness of two sugars after maxil-lectomy
Maxillectomized larvae were presented with sucrose or glucose over a wide range of concentrations (0.001-0.2 M). At each concentration sucrose and glucose were simultaneously presented. Each treatment was replicated six times. The results (Fig. 34) indicated that the response curves for sucrose and glucose established with maxillectomized larvae are essentially similar to those of unoperated larvae. In both cases the curve for glucose covered a smaller area, a higher threshold value (about 0.01 M instead of 0.001 M for sucrose) and a lower maximum Fp value (about 60 per cent of the maximum achieved with sucrose). At sub-threshold concentrations, however, the maxillectomized larvae still showed a low level of food intake rate. The rate approximately corresponded with that of unoperated larvae presented with an amount of 0.01-0.02 M sucrose. This signifies that in the absence of chemical sitmulation maxillectomized larvae still show some food intake activity. The results further suggested that chemoreceptors are present in the buccal cavity which are sensitive to sucrose and glucose but which do not respond to other sugars or to sugar alchohols. These receptors thus show a remarkably high specificity.
4.3.10. The effect of mouth part ablation on the response to sinigrin In experiments XVIII-XX it has been found that sinigrin by itself is unable
to evoke a behaviour pattern which may lead to the ingestion of food particles.
Meded. Landbouwhogeschool Wageningen 72-11 (1972) 45

In section 4.3.8. it has been hypothesized that 'actual food intake responses' are likely to be governed by chemosensory input from receptors located in the buccal region, while biting responses are triggered by chemoreceptors associated with the maxillary organs. Evidence substantiating this hypothesis may now be obtained by testing whether or not sinigrin can trigger chemoresponses in maxillectomized larvae or, more specifically, whether the interaction of sinigrin and sucrose is still maintained after maxillectomy.
Experiment XXIX - Effect of maxillectomy on response to sinigrin Maxillectomized larvae were presented with two concentrations of sucrose,
viz. 0.004 and 0.02 M. Each concentration was studied in the presence and absence of 0.005 M sinigrin and the response evaluated by means of the Fp parameter. The experiment was carried out in a complete block design with three blocks (days) and in which each treatment was assessed once per block. The data (Table 9) show that in contrast to the behaviour of unoperated larvae the maxillectomized ones did not react with a higher Fp value when presented with sinigrin. Positive responses were not apparent when sinigrin was mixed with either lower or higher levels of sucrose. The data suggest also that there is little or no difference in food intake rate between maxillectomized and unoperated larvae when they are given a combination of sucrose and sinigrin. It is realized that in any comparison between the responses of operated and control larvae the possible differences in feeding rates due to the ablation have to be taken into account. Such a consideration would, however, not invalidate the interpretation of the results of the experiment that maxillectomized larvae are insensitive to sinigrin. This is because in experiment XXVI it has been found that maxillectomized larvae had a somewhat lower feeding rate than unoperated ones.
Experiment XXX - Effects of galeaectomy, palpectomy and maxillectomy Morphologically each maxilla is composed of two main parts, viz. the galea
TABLE 9. Fp response values to sucrose and sinigrin as determined with maxillectomized or unoperated larvae in experiment XXX.
treatment
maxillectomy
control (unoperated)
block
1 2 3
4 5 6
0.004 sucrose
59.2 56.1 48.0
9.6 9.8
15.2
0.004 sucrose
+ 0.005
sinigrin
45.0 59.9 60.5
61.0 85.6 58.3
0.02 sucrose
87.2 89.9
103.2
44.2 44.7 50.1
0.02 sucrose
+ 0.005
sinigrin
110.8 92.8
113.4
108.7 106.2 117.7
46 Meded. Landbouwhogeschool Wageningen 72-11 (1972)

-100-
UJ _ in o ü-80-Ui o: u z S 60-LL
-40-
20-
A -
-
T
—i—
B
T i
T 1
FIG. 35. The effect of various extirpations on the food intake on 0.004 M sucrose (part A) or on a mixture of 0.004 M sucrose and 0.005 M sinigrin (part B). The treatments consisted of bilateral extirpation of the maxillae (M), galeae (G) or palpi (P). The response of unoperated larvae is represented by (C). Mean Fp values (± 2. S. E.), calculated from 4 sets of data.
which bears two sensilla styloconica and three tactile setae, and the palpus (Fig. 43). Since the sensilla styloconica and the palpus are all chemosensory organs the present experiment was designed to investigate the relative significance of these organs in the perception of sinigrin. Fifth instar larvae reared on artificial medium were subjected to bilateral extirpation of either the galeae (group G), the palpi (group P) or the maxillae (group M). The Fp responses were determined to a concentration of 0.004 M sucrose and to a mixture of 0.004 M sucrose and 0.005 M sinigrin. It was not possible to include all treatments into one block. The various observations were made on each group separately. Each observation was replicated four times. The treatment means are presented in Fig. 35.
Concerning the group of unoperated larvae (group C), the outcome is in agreement with that obtained in experiments XVIV and XX. A strong increase in Fp value is seen when sinigrin is added to a low stimulating level of sucrose (0.004 M). An increase in Fp value is also observed when the response of maxillectomized larvae to 0.004 M sucrose is compared with the response of group C to the same stimulus. No further increase is seen in the response of group M when sinigrin is added. These results are in agreement with those derived from earlier experiments (XXVIII and XXIX). When one compares the feeding responses of galeaectomized (group G) and palpectomized (group P) it is found that both groups are at variance with the results of group M. In comparison with the response of unoperated larvae galeaectomy does not result in an increase of feeding on 0.004 M sucrose. Moreover, the feeding response of group G to stimulation with 0.004 M sucrose is not altered by
Meded. Landbouwhogeschool Wageningen 72-11 (1972) 47

addition of sinigrin. Striking differences are shown on comparison of the behavioural changes induced by galeaectomy and palpectomy. Palpectomized larvae exhibited an increased Fp value when given 0.004 M sucrose. The amount of increase corresponds with the increase caused by extirpation of the whole maxilla. However, in contrast to the behaviour of maxillectomized larvae, the palpectomized larvae have not lost their responsiveness to sinigrin. This is apparent from the observation that the addition of 0.005 M sinigrin to 0.004 M sucrose resulted in a further increase in Fp value with group P but not with group M. The mean Fp value reached with group P on the mixture of sucrose and sinigrin was approximately of the same order of magnitude as measured with group C.
In summary, the outcome of experiments XXIX and XXX suggest that:
1. Loss of responsiveness to sinigrin can be introduced in the larvae either by maxillectomy or galeaectomy but not by palpectomy.
2. Maxillectomy or palpectomy results in a corresponding increase in food intake rate at low stimulating levels of sucrose. Such an effect, however, is lacking upon galeaectomy.
4.3.11 Inhibition of food intake by specific stimuli As pointed out above (section 4.3.6.) feeding can be inhibited by dispropor
tionate concentration ratios of compounds possessing a potential capacity to promote food intake. In Chapter VII the possible mechanisms involved will be discussed. In insects several instances are known in which chemicals with specific inhibitory activity have been identified. These compounds exclusively inhibit food intake. In many of the species investigated the active compounds were of alkaloidal or steroidal nature (STÜRCKOW and Low, 1961; ISHIKAWA,
1966; HARLEY and THORSTEINSON, 1967; LAVIE, JAIN and SHPAN-GABRIELITH,
1967; WADA, MATSUI, ENOMOTO, OGISO and MUNAKATA, 1970). In behavioural studies involving drinking tests EGER (1937) reported a high sensitivity of larvae of Pieris napi for quinine. Most of the other species of lepidopterous larvae, however, showed a relatively high threshold (0.002-0.033 M). According to CROZIER (1922) species as Protoparce celeus, Samia cynthia, S. prometha, Automeris io and Ceratomia catalpae were even observed to accept solutions of strychnine sulphate as high as one per cent. Also FRINGS (1945) observed that last instar larvae of Samia cecropia ate readily from leaves of Platanus occidental treated with saturated solution of strychnine sulphate.
In the context of the present study an interesting question arises as to whether or not receptor cells exist which in the animal exclusively mediate rejection. For the larva of P. brassicae this question has been answered positively in a preliminary report (MA, 1969). As far as is known to us only in two other instances, viz. the silkworm Bombyx mori (ISHIKAWA, 1966) and the tobacco hornworm (SCHOONHOVEN, 1969b) have specific inhibition of feeding responses in insects been correlated with electrophysiological activity in a particular cell type. The present part of our work will deal with the behavioural aspect of feeding inhibition in a more quantitative manner. Also the important question
48 Meded. Landbouwhogeschool Wageningen 72-11 (1972)

as to whether larvae remain sensitive to inhibitors after maxillectomy will be investigated.
Exper iment X X X I - Screening for deterrent action In screening tests several organic compounds were tested for inhibitory
potency in P. brassicae larvae. Attention was especially focused on alkaloids and related compounds. Each compound was applied in a mixture of 0.0001 M with 0.1 M sucrose. The Fp value was determined in four replicates per compound. Of the twenty-two compounds listed in Table 10 twelve appeared to possess a strong feeding inhibiting action. Under the test conditions used none of the compounds caused a mortality during or after a 24 hrs period of contact. The most effective compounds tested possessed an alkaloidal or steroidal structure of high molecular weight. Molecules of simpler structure such as coniine, betulin and purine or pyrimidine derivatives were all inactive even at concentrations as high as 0.1 M. Salicin which proved to be a very effective inhibitor in the silkworm (ISHIKAWA, 1966) was also inactive.
Quinine, strychnine and ecdysterone were selected for a more detailed study of stimulus-response relationships (experiments XXXII-XXXVIII).
TABLE 10. The relative feeding inhibiting effect of some chemicals to P. brassicae larvae as investigated with Fp-parameter. Each compound was mixed with 0.1 M sucrose (control) in a concentration of 0.0001 M.
Compound percentage reduction of Fp value as compared to control
sucrose 0.1 M (control) 0
berberin hydrochloride 100 betulin 0 caffein 0 colchicine 80 conessine 100 coniine 0 d-salicin 0 ecdysterone 100 inokosterone 100 morin 0 morphine hydrochloride 90 naringin 0 Pilocarpin hydrochloride 25 Picrotoxin 60 ponasterone A 90 quinine hydrochloride 100 solanine 100 sparteine sulphate 100 strychnine nitrate 100 2-thio uracil 0 tomatine 100 uric acid 0
Meded. Landbouwhogeschool Wageningen 72-11 (1972) 49

Exper iment XXXI I - Effect of quinine The percentage reduction of Fp value vs. a positive response to a concentra
tion of 0.1 M sucrose was determined for quinine, strychnine and ecdysterone. The compounds were studied over a wide range of concentrations. Each concentration together with a control was included in one single observation and the observation replicated three times. The results established with quinine are shown in Fig. 36. A progressive reduction in stimulating activity of sucrose was found within the range 10_8-10~6 M of quinine sulphate and 10~7-3.10 - 6 M of quinine hydrochloride. By interpolation of data a 75 per cent reduction is obtained with approximately 1.5 X 10 ~6 M and 4 x 10 ~7 M of quinine chloride and sulphate respectively. The effect of quinine hydrochloride was also assessed against the positive value of a mixture of 0.1 M sucrose and 0.005 M sinigrin. The response curve shifted to a higher concentration range by the effect of sinigrin (Fig. 36).
F"H 0.1 M sucrose+QS04
^M 0.1 M sucrose+ QH Cl
100 -
80-
60-
40-
20-
I, I f
I 0.1 M sucrose* 0.005M sinigrin + Q.HCI
4-- 6
log molar concentration
FIG. 36. Inhibitory effect of quinine hydrochloride (QHC1) or quinine sulphate (QS04) on the mean Fp value to different feeding substrates (experiment XXXII). The concentrations of quinine are plotted on the abscissa in logio molar concentrations.
50 Meded. Landbouwhogeschool Wageningen 72-11 (1972)

Experiment XXXI I I - Effect of strychnine nitrate The percentage reduction of Fp value produced by strychnine nitrate was
assessed relative to the positive response value of (a) 0.02 M sucrose, (b) 0.1 M sucrose and (c) a combination of 0.1 M sucrose and 0.005 M sinigrin. Another point of investigation in this experiment was the question of whether maxil-lectomy affects the responsiveness of the larvae to this inhibitory compound. With maxillectomized larvae the stimulatory activity of 0.1 M sucrose was applied as a basis for assaying the effect of strychnine nitrate.
The results summarized in Fig. 37 show that a reduction in Fp value of 75 per cent is achieved at approximately 5.10~6 M or 9.10-6 M strychnine when assayed to 0.02 M and 0.1 M sucrose respectively. With a mixture of 0.005 M sinigrin and 0.1 M sucrose as the stimulating basis a concentration of approximately 3.10-5 M strychnine was needed to reach a percentage reduction of Fp value of 75 per cent.
The results with maxillectomized larvae indicated that after extirpation of the maxillary organs the larvae still remain sensitive to strychnine. An interesting point to note is that the reduction in food intake induced by strychnine in maxillectomized larvae approximately coincided with the reduction in food intake of unoperated larvae presented with a mixture of 0.1 M sucrose and 0.005 M sinigrin.
* i o o -
~ 80-
60-
40-
20-
E30.02 h 3 0.005 M sinigrin
| 0.1 M sucrose MAX
i 'e 'T1"—T—r 4 6 10 20 40 molar concentration ( X10"°)
FIG. 37. Inhibitory effect of strychnine nitrate (SNO3) on the Fp response value to 0.02 M sucrose, 0.1 M sucrose, or to a mixture of 0.1 M sucrose and 0.005 M sinigrin. The percentage inhibition is also given for maxillectomized larvae (MAX) relative to the response to 0.1 M sucrose. Mean percentages are calculated from four sets of data.
Meded. Landbouwhogeschool Wageningen 72-11 (1972) 51

Exper iment XXXIV - Effect of ecdysterone. Ecdysterone (ß-ecdysone or 20-hydroxy-a-ecdysone) is one of the many
phytoecdysones (reviewed by STAAL, 1967; SIDDALL, 1970). The effect of ecdysterone was assayed to the positive Fp value of 0.02 M or 0.1 M sucrose. A reduction of these values by 75 per cent was obtained by an estimated concentration of 1.5 x 10⁻⁵ M and 3.7 x 10 - 5 M ecdysterone respectively (Fig. 38). Ecdysterone was the only deterrent which influenced certain physiological processes in the larvae after oral intake. In fact, the determination of a complete stimulus-response relationship with a mixture of sucrose and sinigrin as positive stimuli was not possible since preliminary experiments showed that in cases of sufficient oral intake the transformation of the larvae into prepupae was accelerated. Nevertheless it could be established that a 100 per cent inhibition of the effect of 0.02 M sucrose caused by a concentration of 4.2 x 10 - 5
M ecdysterone was lowered to an inhibition of about 30 per cent by the addition of 0.002 M sinaibin hydrate. A similar effect was obtained by maxil-lectomizing the larvae. These treatments were not sufficient to induce acceleration of pupal transformation.
In view of the above experiments the relative deterrency of the three in-
I 0.02
I 0.1
ip. 10 20 40 60 MOLAR CONCENTRATION ( X 10 "« )
FIG. 38. Inhibitory effect of ecdysterone on the response to 0.02 M or 0.1 M sucrose. The effect is expressed in percentage inhibition relative to the mean Fp values established for the respective feeding substrates. The ecdysterone concentrations applied are plotted on the abscissa. Mean values are calculated form four sets of data.
52 Meded. Landbouwhogeschool Wageningen 72-11 (1972)

hibitors examined can be given in the following order of decreasing effectiveness quinine sulphate, quinine hydrochloride, strychnine nitrate, ecdysterone.
Experiment XXXV - Leaf disc tests. For this experiment a leaf disc test was designed to examine the effect of one
of the inhibitors when presented on the natural food plant. The compound tested was ecdysterone and the food plant used was Brassica oleracea. For each test eight discs were punched out of the same leaf. The experimental animals, consisting of fifth instar larvae reared on Brassica, were given a dual-choice test between four treated and four control discs. The treated and control discs were alternately arranged along the circumference of a glass container (diameter 12 cm). The experimental design was similar to that described for preference tests (Chapter 3). The treated discs were dipped in a methanol solution of ecdysterone of known concentration, shaken to remove excess liquid and subsequently air-dried. The control discs were dipped in pure methanol. The tests were replicated 10 times per concentration tested, using different larvae for each test. The effect of a concentration was evaluated by means of a 'feeding ratio' which was defined as:
surface consumed of treated discs feeding ratio = — ? j—7
surface consumed of control dies For comparative purposes the same experiment was also performed with
last instar larvae of Mamestra brassicae (Noctuidae), which is a well-known polyphagous feeder. The experimental design and conditions were the same as used in tests with P. brassicae larvae, except that the tests with M. brassicae were performed in darkness.
The mean feeding ratios for both species are presented in Fig. 39. It appears that although the larvae of M. brassicae also respond to ecdysterone they are distinctly less sensitive than P. brassicae larvae. With M. brassicae a 100 per cent
FIG. 39. Feeding inhibitory activity of ecdysterone for the larvae of P. brassicae (closed circles) or Mamestra brassicae (open circles) as assessed in leaf disc choice tests. For further explanation, see experiment XXXV.
2.08 4.16 5:20
MOLAR'CONCENTRATION ( X K T 4 )
Meded. Landbouwhogeschool Wageningen 72-11 (1972) 53

inhibition was never achieved even at relatively high concentrations ol ecdy-sterone. With P. brassicae a 50 per cent reduction in feeding ratio is found with a concentration of ecdysterone of approximately 0.5 x 10~4 M. Concentrations between 2-4 x 10~4 M almost completely stopped feeding responses. In experiments with maxillectomized larvae of P. brassicae it was found that the almost complete protection of the leaf discs against larval attack following treatment with 2.1 x 10 -4 M ecdysterone remained unaffected after bilateral extirpation of maxillary organs.
In view of the results of experiment XXXIV it may be concluded that the positive feeding stimulating value of the natural host plant is not much greater than that of a mixture of 0.1 M sucrose and 0.005 M sinigrin. Without sinigrin, however, a concentration of 0.1 M sucrose has a much lower positive effect than that of the host plant.
The leaf disc test was also applied to investigate the effect of some other steroids. A steroid which was found to be ineffective was 3a, 1 Iß, 17a, 20, 21-pentahydroxy-pregnaan. Inokosterone and ponasterone A, however, appeared to be as effective as ecdysterone. Since 2ß, 3ß-14a-trihydroxy-A7-5ß-cholesteen-6-on was inactive even at concentrations as high as 1.0 X 10"3 M it seems that the hydroxyl groups in the side chain of the molecule are essential for its activity.
Experiments X X X V I - X X X V I I I - Interaction between strychnine, sucrose and sinigrin.
In this series of three experiments the effect of strychnine nitrate (SN03) was examined by means of the actograph method (section 4.2.). The variables studied were Ts, Tl and Fi (see section 4.3.2.). In each experiment two feeding substrates were compared viz. 0.02 M sucrose and a mixture of 0.02 M sucrose and 0.005 M sinigrin (experiment XXXVI), 0.02 M sucrose and a mixture of 0.1 M sucrose and 0.005 M sinigrin (experiment XXXVII), whereas in the third experiment (XXXVIII) a sucrose concentration of 0.02 M and one of 0.3 M were employed. The effect of feeding substrate, of SN03-concentration and of the interaction between feeding substrate and SN03-concentration was determined for four SN03-concentrations ranging from 2.10-6 M to 2.10-5 M.
Each experiment was carried out in a randomized complete block design with 3 blocks. Each of the twelve treatments was replicated four times per block. After logarithmical transformation, viz. In (y + 1), the variables were analysed with the analysis of variance. In Tables 11-13 the results of the untransformed observations are given for each experiment and for each variable. The corresponding analyses of variance are presented in Appendix VI1-IX. The results established for the Ts parameter are also graphically presented in Figs. 40-42.
The analyses of variance, which pertain to SN03-concentrations ranging from 2.10~6 M to 2.10"5 M, reveal a highly significant effect of SN03 with all response parameters applied. Comparison of the effect of the two feeding substrates per experiment reveals that an effectiveness of the addition of 0.005 M sinigrin to 0.02 M sucrose is reflected in all response parameters but
54 Meded. Landbouwhogeschool Wageningen 72-11 (1972)

FIG. 40. The inhibitory effect of SNO3 on the response to 0.02 M sucrose (•) and to a mixture of 0.02 M sucrose and 0.005 M sinigrin (A). Mean values for the Ts are shown as established in experiment XXXVI.
sycroseO.02 sinigrin 0.005
10~5
Cone. SN03 (M)
that this is only valid with the Tl when the same amount of 0.005 M sinigrin is mixed with 0.1 M sucrose. Sinigrin is therefore regarded as most effective at low sucrose concentrations. This result is in agreement with that obtained in experiments XIX and XX. Moreover, the results of experiment XXXVIII suggest that the regression lines established with the same SN03-concentration ranges are almost identical with both feeding substrates.
FIG. 41. The inhibitory effect of SN03 on the response to a mixture of 0.1 M sucrose and 0.005 M sinigrin ( A) and to a mixture of 0.02 M sucrose and 0.005 M sinigrin (•). Mean values for the Ts are shown as established in experiment XXXVII.
Meded. Landbouwhogeschool Wageningen 72-11 (1972)
1 1 1 1 111
2.10"6 10"5
Cone. SNO3 (M)
i—1 1 1 1 111
55

uo-
120-
100-
80-
60-
40-
20-
Ts
sucrose 0.3
FIG. 42. The inhibitory effect of SN03 on the response to 0.3 M sucrose ( A) and to 0.02 M sucrose (•). Mean Ts values are given (experiment XXXVIII).
Cone SN03(M)
Within treatments no significant interaction was apparent between the effect of feeding substrate and SN03 in all experiments. This was true for all parameters, except for Fi in experiment XXXVI. An absence of significant interaction between effects of medium and SN03 suggests that the regression lines do not deviate strongly from parallelism. Therefore after logarithmic transformation the effects of feeding substrate and SN03-concentration can be supposed to be additive. In terms of the untransformed variables this signifies
TABLE 11. Treatment means for three response parameters as established in experiment XXXVI.
Response parameter
Ts T l Fi
(1)
61.53 13.39 7.42
(2)
54.30 15.93 5.83
(3)
45.19 7.12 8.33
(4)
43.12 11.12 9.08
(5)
13.89 4.41 4.92
treatments*
(6) (7)
7.86 101.59 4.10 17.05 2.92 8.33
(8)
85.59 12.06 6.33
(9)
71.97 9.86
10.42
(10)
34.97 4.89 8.50
( ID
26.30 6.16 8.25
(12)
8.82 4.83 3.17
*The treatments are represented as follows: (1) 0.02 M sucrose; (2) 0.02 M sucrose and 10-6 M SN03; (3) 0.02 M sucrose and 2.10"6 M SN03; (4) 0.02 M sucrose and 4.10"6
M SN03; (5) 0.02 M sucrose and 8.10"6 M SN03; (6) 0.02 M sucrose and 2.10"5 M SN03; (7) 0.02 M sucrose and 0.005 M sinigrin; (8) 0.02 M sucrose, 0.005 M sinigrin and 2.10'6 M SN03 ; (9) 0.02 M sucrose, 0.005 M sinigrin and 4.10" 6 M SN03; (10) 0.02 M sucrose, 0.005 M sinigrin and 8.10"6 M SN03; (11) 0.02 M sucrose, 0.005 M sinigrin and 2.10"5 M SN03; (12) 0.02 M sucrose, 0.005 M sinigrin and 4.10~5 M SN03. For analyses of variance see Appendix VII.
56 Meded. Landbouwhogeschool Wageningen 72-11 (1972)

TABLE 12. Treatment means for three response parameters as established in experiment XXXVII.
Response parameter / j \
Ts 75.53 T l 7.90 Fi 7.73
(2)
97.82 7.32 8.41
(3)
73.51 5.84 7.74
(4)
35.21 4.10 6.10
(5)
16.82 3.40 5.83
treatments*
(6) (7)
9.14 129.50 2.91 16.00 4.23 9.21
(8)
90.92 5.90 9.81
(9)
60.82 5.73 8.70
(10)
23.71 6.14 5.64
(11)
12.61 3.91 3.90
(12)
6.24 3.70 1.72
* Treatments are represented as follows: (1) 0.02 M sucrose and 0.005 M sinigrin; (2) 0.02 M sucrose, 0.005 M sinigrin and 2.10 " 6 M SN03 ; (3) 0.02 M sucrose, 0.005 M sinigrin and 4.10 - 6
M SN03; (4) 0.02 M sucrose, 0.005 M sinigrin and 8.10"6 M SN03; (5) 0.02 M sucrose, 0.005 M sinigrin and 2.10~5 M SN03; (6) 0.02 M sucrose, 0.005 M sinigrin and 4.10"5 M SN03; (7) 0.1 M sucrose and 0.005 M sinigrin; (8) 0.1 M sucrose, 0.005 M sinigrin and4.10"6
M SN03 ; (9) 0.1 M sucrose, 0.005 M sinigrin and 8.10-6 M SN03; (10) 0.1 M sucrose, 0.005M sinigrin and 2.10"5 M SN03; (11) 0.1 M sucrose, 0.005 M sinigrin and 4.10"5 M SN03; (12) 0.02 M sucrose, 0.005 M sinigrin and 8.10-5 M SN03. For analyses of variance see Appendix VIII.
TABLE 13. Ttreatment means for three response parameters as established in experiment XXXVIII.
Response parameter ( i \
Ts 63.41 T l 11.44 Fi 5.81
(2)
44.23 7.53 7.30
(3)
40.72 5.81 6.61
(4)
23.40 5.72 4.80
(5)
12.11 4.90 3.81
treatments*
(6) (7)
7.22 120.40 2.91 13.93 3.54 12.44
(8)
66.93 9.70 6.33
(9)
46.12 7.54 6.01
(10
17.33 7.00 3.92
(11)
12.83 5.41 3.82
(12)
7.71 2.30 3.64
* Treatments are represented as follows: (1) 0.02 M sucrose; (2) 0.02 M sucrose and 10~6 M SN03 ; (3) 0.02 M sucrose and 2.10"6 M SN03; (4) 0.02 M sucrose and 4.10"6 M SN03; (5) 0.02 M sucrose and 8.10"6 M SN03; (6) 0.02 M sucrose and 2.10-5 M SN03; (7) 0.3 M sucrose; (8) 0.3 M sucrose and 2.10~6 M SN03; (9) 0.3 M sucrose and 4.10"6 M SN03; (10) 0.3 M sucrose and 8.10'6 M SN03; (11) 0.3 M sucrose and 2.10"5 M SN03; (12) 0.3 M sucrose and 4.10~s M SN03. For analyses of variance see Appendix IX.
that with each of the SN03-concentrations the ratio of the geometric means of the two feeding substrates is more or less equal.
Another point of interest was to compare per feeding substrate the lowest concentration of SN03 (of the range tested) which is effective. In order to answer this question the minimal difference between the means of each two treatment combinations per experiment has been calculated which after testing with the t-test leads to the rejection of hypothesis that no difference is present (with a confidence limit of 95 %). Two-tailed tests were applied in view of the theoretical possibility that (especially at low concentrations) SN03 might exert a positive influence. The concentrations of SN03 which produce a significantly different effect from that of concentration zero have been summarized for each
Meded. Landbouwhogeschool Wageningen 72-11 (1972) 57

TABLE 14. Concentrations of SN03 which significantly differ from concentration (0) (Student's t-test at 95% probability level; two-sided). Arrow denotes: and for the following higher concentrations. The complete SN03-concentration range is as follows: (0) 0; (1) 10~6 M; (2) 2.10-6 M; (3) 4.10-6 M; (4) 8.10-6 M; (5) 2.10"5 M; (6) 4.10"5 M. su, sucrose; si, sinigrin.
Experiment
XXXVI
XXXVII
XXXVIII
medium
0.02 M su 0.02 M su \
and S 0.005 M sij
0.02 M su ) and f
0.005 M sij
0.1 M su \ and J
0.005 M sij
0.02 M su 0.3 M su
In (Ts + 1)
3 ^
3->
3 ^
3 ^
2 ^ 2 ^
In (Tl + 1)
2 ,4^
3->
3-*
2 ^
2-> 3->
In (Fi + 1)
5
6
5
5-»-
4-> 2->
experiment in Table 14. In view of the mean values shown in Tables 11-13 it may be concluded that with each of the response parameters applied no positive effects were scored with SN03. Table 14 shows that in general the response thresholds established with the Fi are higher than those established with the Ts or Tl. The two-tailed tests suggest that the larvae are able to to react on SN03 in concentrations as low as 2.10-6 M.
Some of the most important quantitative behavioural information described in the present chapter will be discussed more extensively in Chapter 7. The foregoing presentation will be especially reviewed in relation to the electrophysiological activities generated in single sense cells in response to various stimuli as described in Chapter 6.
58 Meded. Landbouwhogeschool Wageningen 72-11 (1972)

5. M O R P H O L O G I C A L AND A N A T O M I C A L OBSERVATIONS ON SENSORY O R G A N S
5.1. INTRODUCTION
The morphological and structural studies described in the present chapter were carried out from two main considerations : 1. Interpretation of electrophysiological data obtained from a chemosensory
sensillum by extracellular recording can be facilitated by an exact knowledge of the number of primary sensory cells to which the sensillum is corresponding. 2. In order to enable one to gain insight into the chemosensory basis of certain
behavioural elements it will be obligatory to study the innervation, as well as the number, topographical distribution and morphology of the sensilla involved.
The present study will concern: a) the maxillary sensilla styloconia; b) the gustatory sensilla located in the buccal cavity and c) the sensory structures associated with mandibular fine canals. The last two types of sensory organs have not been mentioned before in the literature on lepidopterous larvae as far as we know. All studies pertain to last instar larvae of Pieris brassicae, unless stated otherwise. The morphology of the mouth part region in this species is shown in Fig. 43.
FIG. 43. Semi-schematical representation of the latero-frontal aspect of the mouth part region of P. brassicae. KOH-treated whole mounts. Cb, cibarium; Eph, epipharynx; Ep, papilla-like sensillum; Ga, galea; Hp, hypopharynx; Hpl, hypopharyngeal superlinguae; Lb, labium; Lbr, labrum; Lp, labial palpus; Md, attachment of mandible (removed); Me, mentum; Mp, maxillary palpus; Oes, oesophagus, Sc, campaniform sensillum; Sp, spinneret; Ss I and Ss II, medial and lateral sensillum styloconicum respectively; St, stipes; t, tactile setae.
Meded. Landbouwhogeschool Wageningen 72-11 (1972) 59
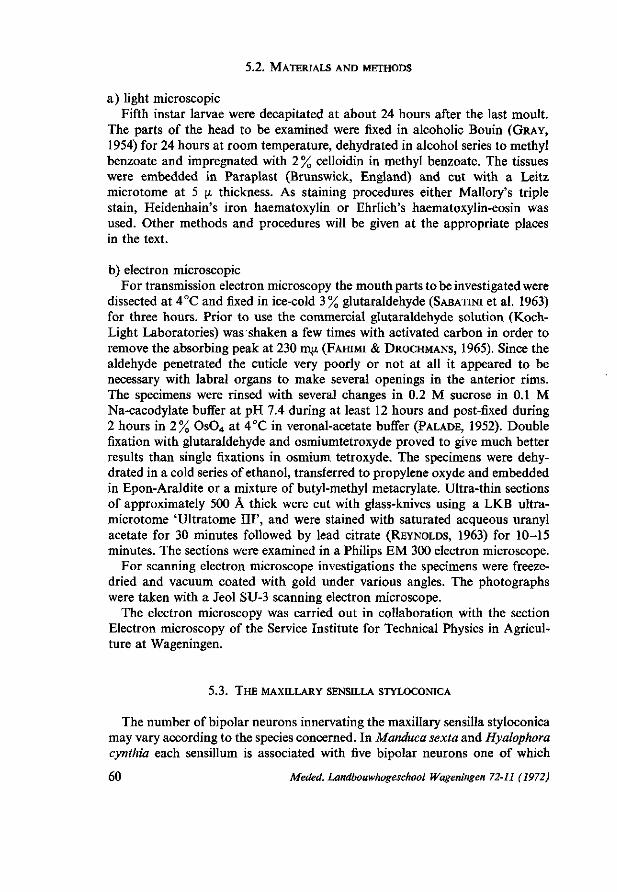
5.2. MATERIALS AND METHODS
a) light microscopic Fifth instar larvae were decapitated at about 24 hours after the last moult.
The parts of the head to be examined were fixed in alcoholic Bouin (GRAY,
1954) for 24 hours at room temperature, dehydrated in alcohol series to methyl benzoate and impregnated with 2% celloidin in methyl benzoate. The tissues were embedded in Paraplast (Brunswick, England) and cut with a Leitz microtome at 5 JJ. thickness. As staining procedures either Mallory's triple stain, Heidenhain's iron haematoxylin or Ehrlich's haematoxylin-eosin was used. Other methods and procedures will be given at the appropriate places in the text.
b) electron microscopic For transmission electron microscopy the mouth parts to be investigated were
dissected at 4°C and fixed in ice-cold 3 % glutaraldehyde (SABATINI et al. 1963) for three hours. Prior to use the commercial glutaraldehyde solution (Koch-Light Laboratories) was shaken a few times with activated carbon in order to remove the absorbing peak at 230 mjx (FAHIMI & DROCHMANS, 1965). Since the aldehyde penetrated the cuticle very poorly or not at all it appeared to be necessary with labral organs to make several openings in the anterior rims. The specimens were rinsed with several changes in 0.2 M sucrose in 0.1 M Na-cacodylate buffer at pH 7.4 during at least 12 hours and post-fixed during 2 hours in 2% Os0 4 at 4°C in veronal-acetate buffer (PALADE, 1952). Double fixation with glutaraldehyde and osmiumtetroxyde proved to give much better results than single fixations in osmium tetroxyde. The specimens were dehydrated in a cold series of ethanol, transferred to propylene oxyde and embedded in Epon-Araldite or a mixture of butyl-methyl metacrylate. Ultra-thin sections of approximately 500 Â thick were cut with glass-knives using a LKB ultra-microtome 'Ultratome III', and were stained with saturated acqueous uranyl acetate for 30 minutes followed by lead citrate (REYNOLDS, 1963) for 10-15 minutes. The sections were examined in a Philips EM 300 electron microscope.
For scanning electron microscope investigations the specimens were freeze-dried and vacuum coated with gold under various angles. The photographs were taken with a Jeol SU-3 scanning electron microscope.
The electron microscopy was carried out in collaboration with the section Electron microscopy of the Service Institute for Technical Physics in Agriculture at Wageningen.
5.3. THE MAXILLARY SENSILLA STYLOCONICA
The number of bipolar neurons innervating the maxillary sensilla styloconica may vary according to the species concerned. In Manduca sexta and Hyalophora cynthia each sensillum is associated with five bipolar neurons one of which
60 Meded. Landbouwhogeschool Wageningen 72-11 (1972)

was suggested to serve as a mechanoreceptor (SCHOONHOVEN and DETHIER, 1966). The silkworm, Bombyx mori, has five receptors in the medial sensillum and four in the lateral sensillum; mechanoreceptors are absent in both ( ISHI-KAWA, 1967).
PLATE 1. Composite photograph of longitudinal sections through a sensillum styloconicum. D distal processes of tormogen cells, JVperikarya, To 1 and To 2 tormogen cells, TR trichogen cell, V vacuole.
Meded. Landbouwhogeschool Wageningen 72-11 (1972) 61

Serial histological sections of the epidermal region of the maxillary sensilla styloconica in P. brassicae showed that each sensillum in this species is innervated by five bipolar neurons. The perikarya are enclosed in a sac-like structure situated at 90 \x from the tip of the peg. (Plate 1). The perikarya each have a diameter of 5|A. Each peg carries on its top a cone-shaped papilla, 7 \L high and 4.5 [i. in diameter at the base (Plate 3). Ultra-thin transverse sections showed that in the papillär region of the medial as well as the lateral sensillum four dendrites are running to the extreme tip. These four dendrites are separated from each other by gaps of 100 Â or less. They are tightly enclosed in a thin-walled cuticular sheath and their lumina are densely packed with evenly dis-
PLATE 2. Stereoscan electron micrograph of the eight sensilla on the tip of the maxillary palpus, x 2450.
62 Meded. Landbouwhogeschool Wageningen 72-11 (1972)
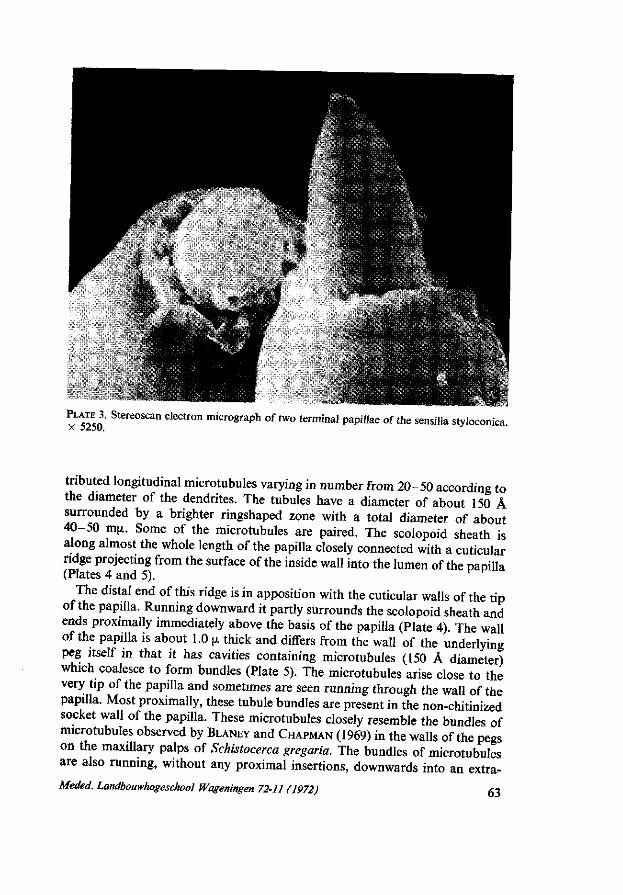
î - ^ ^ i * ^ - ' 3 PLATE 3. Stereoscan electron micrograph of two terminal papillae of the sensilla styl
oconica.
tnbuted longitudinal microtubules varying in number from 20-50 according to the diameter of the dendrites. The tubules have a diameter of about 150 Â surrounded by a brighter ringshaped zone with a total diameter of about 40-50 mji. Some of the microtubules are paired. The scolopoid sheath is along almost the whole length of the papilla closely connected with a cuticular ridge projecting from the surface of the inside wall into the lumen of the papilla (Plates 4 and 5).
The distal end of this ridge is in apposition with the cuticular walls of the tip of the papilla. Running downward it partly surrounds the scolopoid sheath and ends proximally immediately above the basis of the papilla (Plate 4) The wall of the papilla is about 1.0 n thick and differs from the wall of the underlying peg itself in that it has cavities containing microtubules (150 Â diameter) which coalesce to form bundles (Plate 5). The microtubules arise close to the very tip of the papilla and sometimes are seen running through the wall of the papilla. Most proximally, these tubule bundles are present in the non-chitinized socket wall of the papilla. These microtubules closely resemble the bundles of microtubules observed by BLANEY and CHAPMAN (1969) in the walls of the pegs on the maxillary palps of Schistocerca gregaria. The bundles of microtubules are also running, without any proximal insertions, downwards into an extra-Meded. Landbouwhogeschool Wageningen 72-11 (1972) 63

PLATE 4A. Longitudinal section through a papilla of a sensillum styloconicum showing the terminal aperture, the 'fimbriated structures' (F). the receptor-lymph cavity (L), the bundles of microtubules (M), the cuticular ridge (R), the scolopale (S) and the non-sclerotized socket wall (W). x 18.100. PLATE 4B. Transverse section of the scolopale near the base of the papilla showing the distal termination of the dendrite of the mechanosensory neuron (M) within the scolopale (S). x 33.300.
PLATE 6. Transverse section through the sensillum styloconicum just below the base of the terminal papilla. In the receptor-lymph cavity the distal processes of the tormogen cells are seen, x 22.200.
64 Meded. Landbouwhogeschool Wageningen 72-11 (1972)

PLATE 5A. Transverse section through terminal papilla. Four dendrites are seen within the scolopale (S) which is bathing freely in the receptor-lymph cavity (L). The non-laminated cuticle contains bundles of micro-tubules (M), x 33.300. PLATE 5B. Detail showing one of the pore canals (arrow) which originate from the cavities containing bundles of micro-tubules, x 66.420.
"-. < ---*y-~rMv
Meded. Landbouwhogeschool Wageningen 72-11 (1972) 65

cellular space which is called the receptor-lymph cavity by NICKLAUS et al (1967) and BLANEY and CHAPMAN (1969) (Plate 4 and 6).
The pore opening at the extreme tip of the papilla has a diameter of approximately 190 m[i.. The dendrites can distally be followed until a distance of 1.10 (j. under the pore opening of the papilla. The space between this distal end of the dendrites and the pore opening has in its middle region a diameter of about 450 m;/.. Projecting into this space from the outer wall are a multitude of very fine convoluted invaginations. These teeth-like structures may correspond to the 'fimbriated structures', found just below the pore of the tarsal chemoreceptive hairs of Stomoxys calcitrans (Diptera: Muscidae) (ADAMS, HOLBERT and FOR-GASH, 1965) or to the 'Rillen' described in the tarsal taste hairs of the blowfly, Phormia terranovae (HANSEN and HEUMANN, 1971). STÜRCKOW (1971) showed a picture of a section through the tip of a labellar taste hair of Calliphora erythrocephala in which this region is designated as a 'sieve-like structure'. Possibly it may serve as a physical protection of the distal fibre ends. An open-ing-and-closing mechanism as suggested for the pore opening of the pegs in S. gregaria by BLANEY and CHAPMAN (1969) has no t been found in the sensilla styloconica.
The walls of the socket into which the papilla is inserted are not thinner than elsewhere but have a cuticle which is structurally different from the cuticle of the rest of the peg. The socket wall is essentially non-sclerotized and shows a less electron-dense appearance above a level of 3 - 5 jx (Plate 3, 4). This articular region at the base of the coneshaped papilla allows flexibility. At the base of the papilla the distal end of a fifth dendrite appears within the scolopoid sheath (Plate 5). This situation is the same in the medial and lateral sensillum styloconicum. The location of the fifth dendrite suggests association with a mechanosensory neuron. The stimuli for this mechanosensory neuron are clearly not provided by distortions of the articular socket wall itself but by movements of the cuticular ridge with which the scolopoid sheath is associated. Such movements occur whenever the papilla is pressed on or deflected. Electrophysiologi-cally it can easily be shown that if the papilla is flexed at a certain angle with the edge of a glass capillary electrode filled with 0.1 M NaCl bursts of rapidly adapting spikes are elicited by one neuron (see also SCHOONHOVEN, 1967a).
The electron-dense scolopoid sheath, also called cuticular sheath (SLIFER, PRESTAGE and BEAMS, 1957), is a continuation of the epicuticle at the tip opening. After leaving the cuticular ridge of the papilla the scolopoid sheath runs downward freely through the receptor-lymph cavity and then becomes en-sheathed by the distal parts of two tormogen cells, an inner tormogen cell which is in direct contact with the scolopale, and an outer tormogen cell. The cytoplasm of the inner tormogen cell (to 1) differs from that of the outer one (to 2) by being far more densely packed with microtubules (Plates 7, 8). The apical distad invaginations of both cells are observed extending into the receptor-lymph cavity at a distance of 3 - 4 \x from the base of the papilla. The scolopale is funnel-shaped, in proximad direction broadening to about 2 - 3 \L
66 Meded. Landbouwhogeschool Wageningen 72-11 (1972)

PLATE 7. Transverse section through the sensillum styloconicum showing five dendrites within the scolopale (S) of which the largest in diameter belongs to the mechanosensory neuronfMj The scolopale is enveloped by the inner (To 1) and outer (To 2) tormogen cell. The electron micrograph shows the distal network of the large vacuole (V). x 22.140.
Meded. Landbouwhogeschool Wageningen 72-11 (1972) 61

'ivtr.'S
i a f t - •:_ * - • : •» '***ifll*-rf--
J^&FïS&Jkj**: A PLATE 8. Transverse section through the distal parts of the trichogen cell (TR) enveloping the proximal region of the scolopale, which is strongly compartmentalized. To 1 and To 2 inner and outer tormogen cell, V vacuole, x 26.300.
and ending just above the receptacle cavity. The thickness of its wall varies from about 130-150 Â in the papillär region, 1000-1200 Â just below the basis of the papilla and 300-400 À at a more proximal level. In the thick-walled region located directly below the base of the papilla the scolopale wall is packed with many small globular excavations. At more proximally situated parts the scolopale shows a partial compartmentalization of the dendrites of the chemosensory neurons, while the dendrite of the mechanosensory neuron becomes completely isolated from the other dendrites. Over certain proximal regions of the scolopale these infoldings of the scolopale wall are not partially separating the dendrites but are cutting into the dendrites themselves (Plate 8). These kind of infoldings, however, disappear close to the proximal end region of the scolopale. The tapering distal part of the distal segment of the me-
68 Meded. Landbouwhogeschool Wageningen 72-11 (1972)

chanoreceptor ends within the scolopale without any structural or morphological modification. This stands in contrast with what has been described for other mechanoreceptors (THURM, 1965). No indications were found of branching of the distal segments of the peripheral extensions of the cell. The distal or outer segment of the dendrites running through the scolopale do not contain organelles other than neurotubules. Mitochondria are, however, very occasionally observed in the proximal part of the distal segment where it is entering the receptacle cavity (Plate 9). The dendrites here vary in diameter from 0.4-1.2 p.
In the proximal end region of the scolopale and in the region between scolopale and ciliary structure the microtubules in the dendrites progressively become more peripherally distributed when going in a proximal direction. In the literature there are differences in terminology of the enveloping cells. The trichogen cell and proximal tormogen cell of MOULINS (1968) is called a neurilemma cell and trichogen cell respectively by BLANEY and CHAPMAN
(1969). In the present work the terminology of MOULINS (see also ERNST 1969) will be followed; MOULINS recognized two tormogen cells, viz. a distal and a proximal one, in Blabera craniifer (Dictyoptera). The two tormogen cells envelope the distal part of the trichogen cell. The trichogen cell is ensheathing the base of the scolopale, the proximal (inner) segments of the dendrites, the perikarya and the initial segments of the axons of the sensory cells. Its nucleus is situated lateroapically of the group of five perikarya having a volume of
î«ll
PLATE 9. The trichogen cell (TR) sectioned below the base of the scolopale. Condensations of micro-tubules are seen (arrows) at the border with the receptacle cavity, x 22.200.
Meded. Landbouwhogeschool Wageningen 72-11 (1972) 69

2.0-2.5 times that of a perikaryon. In the apical region, proximad to the base of the scolopale, the trichogen cell encloses the receptacle cavity which has a diameter of about 3-5 [i. Laterad to the receptacle cavity the trichogen cell sends many microvilli into the cavity. The microvilli contain small groups of microtubuli which are running parallel to the axis of the dendrites. These groups, which are embedded in an electron-dense material, are predominantly distributed in the peripheral extremities of the microvilli. Single microtubules are scattered through the cytoplasm of the trichogen cell. Groups of microtubuli arise in the most distal part of the trichogen cell where it still forms a ring-shaped zone enwrapping the distal segments of the dendrites and where the receptacle cavity has not yet widened (Plate 9). Also here it is noted that the bundles of microtubules are predominantly distributed in the regions adjacent to the extracellular space surrounding the dendrites. At the proximal part of the receptacle cavity the microvilli of the trichogen cell are very long and thin and form a lamellated complex. As a result an enormous extension of the cell surface is achieved. MOULINS (1971, see also ERNST, 1969) recently suggested that the trichogen cell functions as a glandular cell with the receptacle cavity as a reservoir connected to the external environment by means of the pore opening at the tip of the peg. Its secretion is suggested to correspond to the viscous substance sometimes observed at the tip of chemoreceptive hairs (MORITA and TAKEDA, 1967; STÜRCKOW, 1959; 1967). HODGSON (1967) suggested that the receptive surfaces of the dendritic membrances are bathed in a slowly flowing fluid which may function in the removal of chemicals from the receptor area. A certain time after tritiated water is injected into the proboscis behind the labellum of the blowfly it can be collected from the hair tips. It was suggested that the liquid oozing from the hairs would not only influence access to the sensitive sites of the membrance but also might influence the receptor responsiveness itself.
In the region approximally situated between the proximal end of the scolopale and the distal border of the receptacle cavity a complicated network is situated in the outer tormogen cell adjacent to the border of the inner tormogen cell (Plates 8, 9). This network forms the apical region of a very large extra-cellular space which is called here vacuole. It is present in the outer tormogen cell which is the largest cell of the cellular complex associated with the sensillum and has a nucleus of 4-8 [x. In the peg-region the vacuole is filled with a fine granulum which is relatively much more electron-dense than it is at the ciliary region where the network gradually changes into an open space (Plates 10,11). Thus the cavity is not a true vacuole in the strict sense. At present it could not be ascertained whether the vacuole is in connection with the receptor lymph cavity. The plasma membranes of the trichogen cell and the inner tormogen cell as well as those of the inner and outer tormogen cell are joined by septate des-mosomes, which are known as sites of low electrical resistance (LOEWENSTEIN
et al. 1965). The membranes of the later two cells are separated by an intercellular space of about 220 Â wide with septa of about 110 A over the whole circumference. The intercellular space between the trichogen cell membrane and that
70 Meded. Landbouwhogeschool Wageningen 72-11 (1972)

of the adjacent tormogen cell is, however, half as wide as that between the two tormogen cells and less distinctly septated (Plate 11).
The transition between inner and outer segments of the dendrite is marked by a modified ciliary connecting structure which is bathed freely in the extracellular fluid of the receptor lymph cavity. This is true for the four chemosensory neurons as well as for the mechanosensory neuron. The axonema has a diameter of approximately 0.2 \i and contains peripheral doublets according to the '9 + 0' formula. The electron micrograph shown in Plate 11 is a cross-section through the various phases associated with the ciliary region including the distal and proximal centrioles, each of which is associated with a so-called multivesicular body (MOULINS 1967), and the ciliary rootlets in the inner segments. In the distal centriole nine peripheral sets of triplet tubules are present, whereas in the proximal centriole the rootlets pass around it (Plate 11). At the ciliary phase the inner segments which have a diameter of about 1 [A are mutually joined by close junctions (fasciae occludentes) and contain many translucent vesicular bodies but no mitochondria or other organelles. These vesicles are also present in the receptacle cavity itself. Mitochondria are
PLATE 10. Oblique transverse section through the inner dendritic segments (1-5) at the proximal region of the receptacle cavity. The microvilli of the trichogen cell (TR) form a lamellated complex in the receptacle cavity, x 18.100.
Meded. Landbouwhogeschool Wageningen 72-11 (1972) 71

" S - • •* f ï» .V • * " ' . .
PLATE IIA. Transverse section through three inner dendritic segments (1-3) and two ciliary regions (4,5). The inner segments contain electron-lucent vesicles (arrow), and are sectioned at the level of the basal bodies. MV micro-villi of trichogen cell, RC receptacle cavity, 57 septate junction, To 1 and To 2 inner and outer tormogen cell, V vacuole, x 33.300. PLATE IIB. Distal centriole with nine peripheral sets of triplet tubules, x 81.180. PLATE 11C. Proximal centriole with rootlets passing around it. x 81.180. PLATE 11D. Ciliary region with nine peripheral sets of double tubules, x 66.420.
72 Meded. Landbouwhogeschool Wageningen 72-11 (1972)

numerous, however, in the more proximally situated parts of the inner segment (Plate 10). Special junctions resembling maculae adhérentes are observed between the microvilli of the trichogen cell and the inner segments of the dendrites (Fig. 10). These junctions are not present outside the receptacle cavity.
Ciliary connecting structures have been found in mechanoreceptors (GRAY,
1960; WHITEAR, 1962; THURM, 1964) as well as in olfactory receptors (SLIFER
and SEKHON, 1963, 1964a,b; SCHNEIDER and STEINBRECHT, 1968; ERNST, 1969). Until recently their occurrence in contact chemoreceptors was still questionable (SLIFER, 1970). However, it is becoming increasingly clear that also in this category of receptors ciliary structures form an intrinsic property. Since ciliary structures were described by MOULINS (1967, 1968) in the contact chemoreceptors of the hypopharyngeal organs of the roach Blabera craniifer their presence has been reported in the receptors of the sensilla basiconica of the maxillary palps of the locust Schistocercae gregaria (BLANEY and CHAPMAN,
1969), the interpseudo-tracheal taste papillae of the fleshfly, Boettcherisca peregrina (TOMINAGA, KABUTA and KUWABARA, 1969) and the tarsal sensilla trichodea of the blowfly, Phormia terranovae, (HANSEN and HEUMANN, 1971). Generally it is hypothesized that at each moult the distal centriole is eliminated and replaced by the proximal one. This centriole then will give rise to regeneration of a new distal dendritic process (SLIFER and SEKHON, 1964; MOULINS,
1967). Distal portions of the dendrites still enclosed within the cuticular sheath have been observed to be torn off during moulting (RICHARD, 1952; SLIFER,
PRESTAGE & BEAMS 1959). WENSLER & FILSHIE (1960) observed in ultrathin sections of moulting aphids that the terminal portions of the dendrites are broken off at the region of the cilium and cast, still within the cuticular sheath, with the exuviae. In campaniform sensilla evidence has been obtained that the portion of the dendrite distad to the modified cilium is shed at ecdysis (MORAN,
1971). The cuticular sheath, plasma membrane and the multitude of microtubules appeared intact within the exuvium. Also in this case the physiological significance is well apparent in regard of the fact that the distal dendritic process is considered as the transducer (MORAN and VARELA, 1971).
FIG. 44. Ventral view of the labrum of P. brassicae. Ep, epipharyngeal papillalike sensilla; L and M, lateral and medial field of micro-trichia; S 1, 2, 3, tactile setae; Sc, sensilla campaniformia.
si -S2 •
S I S 2
Meded. Landbouwhogeschool Wageningen 72-11 (1972) 73

5.4 OBSERVATIONS ON EPIPHARYNGEAL SENSILLA
The non-sclerotized exocuticular layers of the epi- and hypopharyngeal walls give a high degree of flexibility to these regions. By means of the flexor and extensor muscles attached to the cuticle several movements take place during ingestion which lead to the entrance of food particles into the cibarial cavity. Extensive histological investigations on the hypopharynx showed that in P. brassicae this region is devoid of any sensory structures, its surface being only lined by numerous minute epi-cuticular microtrichia. These cuticular ornaments occur in relatively high density also in the medial third of the ventral surface of the clypeolabrum. They are about 10 micron in length. Lateral to this central field the spines are smaller, only a few microns in length, and they occur in lower numbers (Fig. 44). The surface structures are clearly revealed by means of the scanning electron-microscope. Besides the non-sensory structures the epipharyngeal region contains altogether three types of sense organs (Plate 12):
1. Tactile setae. On the ventral side of the labrum three pairs of prominent tactile setae are located at the distal end of the lobes. These setae are pointing medio-distally towards the medial indentation of the labrum. By their position they presumably have a tactile function in monitoring the position of the labrum relative to the leaf edge while feeding. They are each typically innervated by one bipolar sense cell. Electrophysiological experiments showed that they responded to deflexion of the seta. 2. Papilla-like organs. These sensilla are located in each lateral field of microtrichia and are situated close to the border between the central and lateral fields of microtrichia. In the larvae of P. brassicae not more than two of these sensilla are present on the epipharynx forming one symmetrical pair with regard to the medial line of the labrum. Each sensillum consists of an oval shaped cuticular dome of which the base measures approximately 8 micron in shortest diameter and 10 micron in longest diameter. The central part of the dome is occupied by a typically teardrop shaped depression in the cuticle which has its long axis coinciding with the long axis of the oval shaped dome. The long and pointed end of the teardrop is oriented in a lateral direction. The width of the teardrop shaped depression is approximately 2 micron, the total length being 5 micron as measured from scanning electron micrographs (Plate 13a, b). Presumably the peculiar shape of the depression will give an increased efficiency in effluence of fluid thus preventing the depression from becoming polluted. The thick-walled parts of the dome surrounding the depression forms an effective protection for the small papillate structure arising in its centre. The diameter of the papilla at about halfway its height is approximately 0.5 micron. It has a blunt-shaped tip in the centre of which a darker point can be observed in some scanning micrographs which might represent a pore opening. The total projecting length of a papilla does not exceed the total depth of the depression and is estimated to range from 0.5 to 0.7 micron. The papilla arises from bottom of the depression without any socket-like structure.
74 Meded. Landbouwhogeschool Wageningen 72-11 (1972)

PLATE 12A. Stereoscan electron micrograph of epipharyngeal region of P. brassicae. Parts of the medial (left) and lateral (right) fields of microtrichia are seen with a sensillum campani-formium (Sc) and a papilla-like organ (EP), x 1050. PLATE 12B, C. Two sensilla campaniformia in a protruded (B, x 4000) and in a recessed state (C, x 7000).
Meded. Landbouwhogeschool Wageningen 72-11 (1972) 75

PLATE 13 A. Stereoscan electron micrograph of a papilla-like organ, x 7.000.
PLATE 13B. Detail showing the bottom of the depression and the small papilla, x 14.000.
76 Meded. Landbouwhogeschool Wageningen 72-11 (1972)

PLATE 14A, B. Consecutive longitudinal light microscopic sections through an epipharyngeal papilla-like organ of Manduca sexta, showing perikarya (arrow) and scolopale.
Light microscopic observations showed that the papilla-like organs are innervated by three bipolar neurons. This was found with similar sensilla occurring on the epipharynx of fifth instar larvae of Manduca sexta (Sphingidae) (Plate 14a, b). Because of their larger size the organs in this species are more suitable for light microscope studies than are the much smaller but otherwise similarly structured ones in P. brassicae. The sensory cells each hâve three ovoid-shaped nuclei which are situated at a partly subepidermal position. The nuclei and the axonal processes are enveloped by numerous,glial cells which possess small oblong nuclei. The axonal processes run in a backward direction to join the labro-frontal nerve.
Some electron micrographs of transverse sections through the distal segments of the dendrites have been made. Three dendrites run to the extreme tip of the papilla and are enveloped by a scolopoid sheath. In the tip region the lumen of the sheath is reduced to about 250 m[x, the smallest diameter of the dendrites being approximately 70 mp (Plate 16a, b). Since the external diameter of the papilla itself is about 0.5 [i and since the thickness of the scolopoid sheath wall is about 100 m\i it may be deduced that the wall of the papilla consists largely of the scolopale enclosing the dendrites. At the epidermal level the scolopale shows compartmentalization of the dendrites at more proximal regions. Here the scolopale is enveloped by two cells of which the distal one contains very large vacuoles (Plates 15, 17). More proximally the scolopale is embedded in a weak electron-dense space of complicated shape. The distal border of this space is formed by many vesicle-like extensions closely surrounding the scolopale (Plate 17), but proximally it concentrically encircles the scolopale. The width of the ring-like zone is about 2 \x with a luminal internal diameter of also about 2 \x. The scolopale is invested by a thin layer of this electron-dense space of about 40 TR\L thickness. This investment of the scolopale is interconnected with the ring-like zone by means of threadlike connections.
Meded. Landbouwhogeschool Wageningen 72-11 (1972) 77

«ÉwA.-m *»» • y O ' .."X- *i<
PLATL 15. Transverse section through a papilla-like organ of P. brassicae showing dendritic processes (1-3) within the scolopale (S). C cuticle, E enveloping cell, V vacuole, x 14.800.
It is most likely that the three dendrites running inside the scolopale to the extreme tip of the papilla-like organ are associated with the three chemosensory units functionally described in our electrophysiological experiments (Chapter 6). With regard to the number of sense cells associated with the chemosensory sensilla there exists a difference in the number of neurons innervating the papilla-like organs and the maxillary sensilla styloconica, being respectively three
PLATE 17. Papilla-like organ sectioned at the epidermal level close to the cuticle (C), showing the three dendrites within the scolopale and the distal region of the vacuole (V). E enveloping cell, x 9.867.
78 Meded. Landbouwhogeschool Wageningen 72-11 (1972)
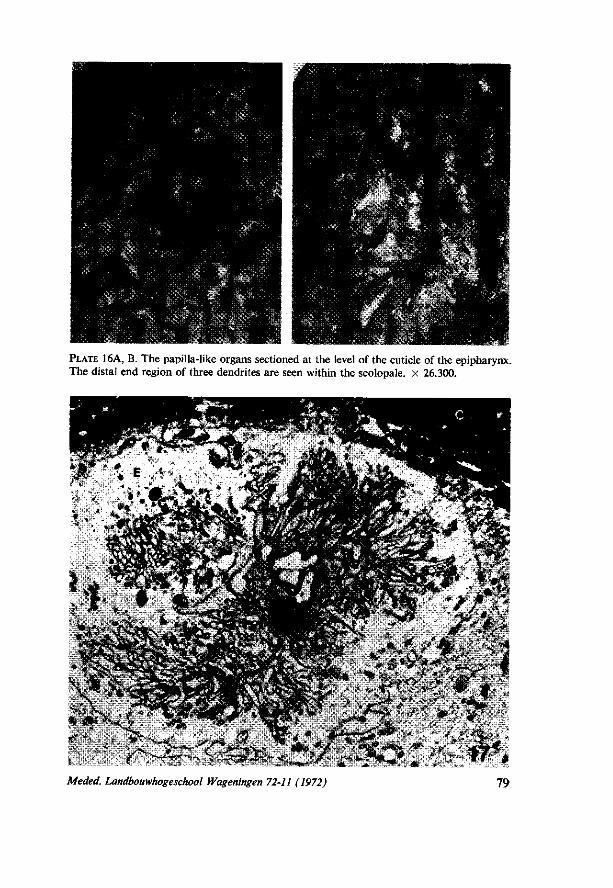
PLATE 16A, B. The papilla-like organs sectioned at the level of the cuticle of the epipharynx. The distal end region of three dendrites are seen within the scolopale. x 26.300.
Meded. Landbouwhogeschool Wageningen 72-11 (1972)

and four. No indications were found which could suggest the presence of a mechano-receptor in the papilla-like organs. To the best of our knowledge papilla-like organs have not been described before in lepidopterous larvae. DETHIER (1937) has stated that on the epipharynx 'plate-like organs' or 'sensilla placodea' are present which are innervated by a single bipolar neuron in some species of lepidopterous larvae. These 'plate-like organs' clearly do not conform to the papilla-like organs described above. 3. Sensilla campaniformia. One campaniform sensillum is located in the epipharynx of P. brassicae laterad to each of the two papilla-like organs at a distance of approximately 20 \L thus forming one symmetrical pair with regard to the labral medial line. The cuticular projection which is less conspicuous than that of the papilla-like organs consists of a ring-shaped zone with a central part formed by a flattened dome-shaped plaque (Plate 12b). Scanning electron micrographs of different preparations showed that the dome-shaped centre might sometimes be deeply sunken into the more rigid surrounding cuticular ring (Plate 12c). It is unknown whether this situation might represent a fixation artifact or shows a natural mechanical deformation of the centre. Campaniform sensilla are known to respond to the component of the shear force developed by such deformations. The decreasing or increasing effect on the convexity of the dome results in corresponding tensions on and subsequent tonic discharges in the nerve filament attached to this plaque (PRINGLE, 1958; THURM 1964, 1965).
The ultrastructure of the campaniform sensilla was not pursued further in the present study. Light microscopically they conform to the classical type of campaniform organs (SNODGRASS 1935).
5.5. THE SENSORY STRUCTURES ASSOCIATED WITH MANDIBULAR FINE CANALS
5.5.1 Introduction The presence of fine canals in the teeth and molar of the mandibles of insects
with a biting-chewing feeding behaviour have been reported in a variety of unrelated species. Just as the shape of the mandible may vary considerably from species to species the number and location of these fine canals may vary greatly among different species. The termite Calotermes flavicollis has numerous canals traversing the mandibular teeth and molar (RICHARD, 1951). Each of the canals receives a nerve fiber at its base whereas the distal end is believed to have an opening with the outside. On the other hand, ZACHARUK (1962) has described the presence of only 6 'pore canals' in each mandible of some elaterid larvae. Each canal is associated with one pair of bipolar sense cells lying in the central area of the mandibular cavity. Before entering the base of the canal the two distal processes were observed to unite into one terminal fiber. Although ZACHARUK (loc. cit.) observed that each canal traverses the endo- and exocu-ticular layers of the mandibular cavity the canals end blindly under the epicuti-cular layer. Nevertheless he assumed that the pore canal organs were contact
80 Meded. Landbouwhogeschool Wageningen 72-11 (1972)

chemoreceptors. A great number of mandibular canals are also present in the incisive and molar regions of the first instar larvae of Locusta migratoria (LEBERRE and LOUVEAUX, 1969). These authors also hold the opinion that the neurons associated with these canals are either contact or olfactory chemoreceptors. They remarked that canals are also present in the mandibles of P. bras-sicae although no description has been made as to their distribution, structure or innervation. CORBIÈRE (1967) described the presence of canals in the teeth, external regions and between the denticles of the molar of the mandibles of the larvae of the coleopteran Speophyes lucidulus. Each canal appears to be innervated by a group of two bipolar neurons.
The general idea that the sense organs associated with mandibular canals represent chemoreceptory organs is mainly inferred from their position on the incisive areas and the molar of the mandible. However, all these observations were made with the light microscope which did not allow resolution of the question whether the distal processes of the neurons actually extend inside the lumina of the canals. Second, one could only hypothesize about a possible open connection of the lumina of the canals with the external environment. These questions can only be elucidated by electron microscopy. Very recently such an ultrastructural study was made by CORBIÈRE (1971) on the mandibular canal organs of Speophyes lucidulus larvae. These observations seem to indicate that the canals are not open at their distal ends which makes a gustatory function less likely. According to CORBIÈRE (loc. cit.) the structure of the sense organs resembles that of the amphinematic type of scolopidia which are known to have a proprioceptive function.
In view of the present study on the rôle of contact chemoreception in larval feeding and food selection behaviour I thought it necessary to investigate whether the fine canals and their connecting structures found in the main incisor cusps of the mandibles in fifth instar larvae of P. brassicae could possibly serve as contact chemosensory organs. The present study deals with the distribution, ultra-structure and innervation of these mandibular canal organs.
5.5.2. Materials and methods Fifth instar larvae were intra-vitally stained with methylene-blue by a tech
nique similar to that of Hsü (1938). Because of the very heavy sclerotization and the dark pigmentation of the mandibles which already takes place at the end of the moulting process before the larvae has cast off the old cuticle, the larvae were injected with a methylene-blue solution at an early stage of the moulting process and allowed to be stained overnight. The mandibles were fixed in a saturated acqueous solution of ammonium molybdate. The specimens were rinsed in distilled water, dehydrated in absolute alcohol, cleared in xylol and mounted in DePex mounting medium (G. T. Gurr).
The techniques used for electron microscopy were the same as described above for other organs.
Meded. Landbouwhogeschool Wageningen 72-11 (1972) 81

5.5.3. Results and discussions The mandibles of fifth instar larvae of P. brassicae are provided with two
types of sensilla, viz. sensilla trichodea and so-called canal organs. The sensilla trichodea project from the dorsal side of the mandible and are located near the base close to each other (Fig. 45). The lateral one is about 500 \L in length and the other one about 150 \L. Both are innervated by one bipolar neuron. From electrophysiological experiments it was concluded that they have a tactile function (Ma, unpubl. res.)
The canal organs are ten in number and are associated with the incisor region of the mandible. Fig. 45 shows their distribution as well as the position and number of associated sensory cells. In this figure the dorsal view of the left mandible is shown ; the teeth are numerated in an order from left to right. The mandible has three main incisor cusps. T6, T7 and T8, of which T6 and T7 are readily recognized by each having one pair of canals which are longer than the others and which distally terminate close to the very apex of the tooth. Apart from this pair of canals, T6 and T7 possess one canal at a more proximal position of the tooth. T8 lacks a pair of canals traversing the cuticle right to the apex of the tooth but is provided with two canals at the proximal position. Eventually one canal is situated in a proximal part of T5 whereas another canal has its position approximately between T2 and T3. Methylene-blue mounts revealed that each canal is associated with one pair of bipolar sense cells lying in the upper third central area of the mandibular cavity. The paired sensory cells are arranged in a fusiform unit in which the dark nuclei are lying one behind the other. Of each pair often one cell has a nucleus which is more deeply stained with methylene blue than the other. The nucleus is surrounded by a small unstained zone. A fusiform arrangement has also been described for the neurones of mandibular pore canal organs of other insects (ZACHARUK, 1962; CORBIÈRE, 1971). The paired distal processes of the neurones are directed to the base of the pore canal (Fig. 46). Before entering the canal the two processes unify to form a terminal fiber.
FIG. 45. Dorsal view of left mandible of P. brassicae showing the distribution of the mandibular canal organs among the different incisor cusps and their innervation by fusiform units of two bipolar neurons. Reconstruction after various methylene blue preparations. Note that only incisor cusp T6 and T7 have a pair of canals running to the extreme tip of the cusp. SI and S2, tactile setae; he, hypocondyle.
82 Meded. Landbouwhogeschool Wageningen 72-11 (1972)

FIG. 46. Structural organization of mandibular incisor cusp T7, dorsal view, right mandible. Camera lucida drawing of methylene blue preparation, end, endo-cuticula; ex, exocuticula; exb, exocuticular bar; cmc, central mandibular cavity; mpc, mandibular pore canal; n, neurones.
The way in which the terminal fiber is associated with the canal was studied by electron microscopy of two main incisor cusps, viz. T6 and T7. Cross-sections through the apical region distad to the mandibular cavity in each incisor cusp revealed one pair of pore canals which are distinguished from the multitude of cuticular pore canals by their large diameter and the fact that they are not empty but occupied by a cell (Plate 18). In distal direction each canal is tapering to a luminal diameter of less than 0.5 \i (Plate 19). In proximal direction the canals of each pair are separated into one canal in the ventral and one into the dorsal wall investing the mandibular cavity in the incisor cusp (Plate 20). At the level where each canal leaves the wall of the incisor cusp and opens into the mandibular cavity the canals have a luminal diameter of approximately 2 (x.
PLATE 18. Transverse section through the cuticle of the tip of an incisor cusp of a mandible. Two canals are seen among the much smaller cuticular pore canals, x 6867.
Meded. Landbouwhogeschool Wageningen 72-11 (1972) 83

PLATE 19. Section close to the distal end of a pore canal. The lumen of the cuticular sheath is completely filled with one dendrite, x 66.420.
Each canal is lined by a cuticular layer of about 50-60 mjx thickness ensheath-ing the apical region of one cell (Plates 20, 21). In the mandibular cavity this cuticular ring around this cell region has a thickness of about 30 m[A. Proximally it ends near the base of an incisor cusp and distally it extends to the tip of the canal; in total it reaches a length of about 130 JJL. The cell which it invests is enveloping an electron dense scolopoid sheath which encloses two dendrites.
PLATE 20. Section near the central cavity (C). The scolopoid sheath (S) contains two dendrites. The canal is filled up by the distal part of a cell (E 2) lying in the central cavity. Note the electron-dense lining of the canal (arrow), x 33.200.
84 Meded. Landbouwhogeschool Wageningen 72-11 (1972)
PLATE 21A. Transverse section through the sheathing cell (E 2) at the apical level of the mandibular cavity (C). The cell is still enveloped by an electron-dense lining (arrow). Note the cuticular bar (B) in the central cavity of the incisor susp. x 33.200. PLATE 21B. Detail of the scolopale with two dendrites. Note the microtubules in the sheathing cell, x 129.150.
Meded. Landbouwhogeschool Wageningen 72-11 (1972) 85

PLATE 22. Transverse section near the proximal end of the scolopale showing two dendrites (D), two enveloping cells (E 1 and E 2), and de electron-dense areas with microtubules (M) 22 A, x 18.000; 22 B x 66.400.
86 Meded. Landbouwhogeschool Wageningen 72-11 (1972)

The cuticular funnel-shaped sheath is not formed by the cell it invests as shown by the interconnection with the endocuticular region of the mandibular walls. The endocuticle is characterized by small groups of microfibrils and is located outside the more electron dense cuticular lining of the sheathing cell. The scolopale enclosing the dendrites is also not in continuity with the cuticular sheath of the enveloping cell. This can be seen in transverse sections through the sheathing cell in the region where the canal opens into the mandibular cavity (Plate 21a). The cuticular envelope will obviously strengthen the rigidity of the sheathing cell. The rigidity and strength of the incisor cusp itself is enhanced by the presence of a cuticular bar formed by epidermis cells which is projecting from and in apposition with the cuticle of the apex of the incisor cusp. This bar forms the centre of the mandibular cavity inside the incisor cusp and is tightly anchored in the enclosing epidermal cells by branchings at its proximal end. This end is located close to the proximal ending of the cuticular sheath of the enveloping cell. In the mandibular cavity the sheath cells of both canal organs run along each side of this axial bar. Plate 22 shows a transverse section through the region proximad to the cuticular sheath of the enveloping cell but which still hits the scolopale. The scolopale here has a widened lumen of 0.6 [i. whereas the contact zone of the two dendrites resembles a zonula occludens type of junction with a peculiar intertwined shape. This type of dendritic junction is present in the proximal part of the outer dendritic segments and is most distally seen at the proximal level of the cuticular sheath of the enveloping cell where the scolopale still has a small lumen of 0.3 (JL. Plate 22 shows that the scolopale is enveloped by two cells. Of the two enveloping cells the inner one contains areas of electron dense material in which longitudinally oriented microtubules are embedded. These areas are juxtaposed to the scolopale near the proximal end region of the later. In regions proximad to the scolopale (Plate 23) these electron dense areas are directly adjacent to the inner or proximal segments of the dendrites. The inner segments contain mitochondria as well as scattered groups of electron dense material and are separated from thé outer segments by modified cilia of the '9 + 0' type. The distal parts of the inner segments are in apposition with a separation of less than 100 Â. Such appositions have functionally as well as morphologically been designated as ephapses (ARVANITAKI, 1942; WHITEAR, 1962). When approaching the perikarya the inner dendritic segments eventually become completely dilatated.
The present observations show that the outer segments of both dendrites of one fusiform unit of two neurons enter and extend well into one canal of the cuticle of the incisor cusp. One of the dendrites ends distally in the canal before this has reached the perifery. Thus the lumen of the scolopale becomes entirely occupied by the other dendrite (Plate 19). This suggests that the dendrites are not participating in some chemosensory process. In Speophyes one of the two dendrites ends before even the cuticular canal has been reached (CORBIÈRE,
1971). The canal organs in the larvae of P. brassicae show a certain resemblance to those in Speophyes. In both structures the following characteristics are observed : 1. a zonula occludens type of junction in the outer dendritic segments.
Meded. Landbouwhogeschool Wageningen 72-11 (1972) 87

^--'-/v?. >. "ÏV ' * ».
•v *Wv2 4
- • V y-" •* ; v y ^ rfr - / *r? * ^.-. • • % -
?• ••:-Na,.V->^Ä^'':-,.:S3-.. PLATE 23. Oblique section through the inner segments of the dendrites of a mandibular canal organ (1, 2). f? 1 and E 2 enveloping cells, M electrondense areas, x 26.300.
2. The presence of a ciliary region in both dendrites; 3. The presence of areas of electron dense material with longitudinal microtubules in the inner zone of the inner enveloping cell ; 4. The presence of electron dense materials in the inner segments of the distal processes of the sensory cells; 5. The presence of
88 Meded. Landbouwhogeschool Wageningen 72-11 (1972)

two bipolar neurons per canal organ; 6. The differential distal endings of the two dendrites both without structural modification. A cuticular sheath around the distal part of the enveloping cell has not been described by CORBIÈRE (1971), and seems to be absent as judged from her electronmicrographs.
In both cases the lumina of the canals do not seem to communicate with the external environment, which would also be in accordance with the observation of ZACHARUK in elaterid larvae. In accordance with CORBIÈRE (1971) we find that the structure of the canal organs have a resemblance with the structure of scolopidial receptors. It is suggested here that the mandibular canal organs in all biting-chewing insects are all analogous receptors with a proprioceptive function and conform to one structural type of sense organ.
Meded. Landbouwhogeschool Wageningen 72-11 (1972) 89

6. E L E C T R O P H Y S I O L O G I C A L STUDIES ON C H E M O R E C E P T O R RESPONSES
6.1. INTRODUCTION
Examination of the two pairs of maxillary sensilla styloconica in different species of lepidopterous larvae by electrophysiological methods has indicated their function as contact chemosensory organs (for references, see ISHIKAWA,
1967; SCHOONHOVEN, 1969C). In the larva of P. brassicae one cell sensitive to various mustard oil glucosides is located in each of the sensilla styloconica, while a sugar sensitive cell, a cell sensitive to many amino-acids and one sensitive to some anthocyanins are situated in the lateral sensilla (SCHOONHOVEN, 1967, 1969a, c). The medial sensilla contain a receptory cell which is specifically sensitive to alkaloidal compounds, while another cell responds to stimulation by sugars (see below). This part of the present work has focused on the electrical responses of some chemoreceptor cells, especially those cells which were considered to be particularly important in relevance to behavioural characteristics of the animal. The electrophysiological analyses have been extended to the epipharyngeal papillalike organs described morphologically in Chapter 5. Unequivocal evidence was obtained as to a contact chemosensory function of these organs.
6.2. MATERIALS AND METHODS
For the electrophysiological investigations I used fifth instar larvae at 24 hours after the last moult. Normally larvae were taken from the laboratory stock culture reared on Brassica oleracea. Neither anaesthesia nor starvation was applied prior to the experiments. Afferent impulses in chemoreceptor neurons were recorded by techniques similar to those of HODGSON and ROEDER
(1956). The severed head was mounted on a glass pipette filled with 0.1 M NaCl solution and connected with the indifferent electrode. A glass capillary with tip diameter of 10-20 \L served as stimulating-recording electrode. It was brought into contact with the tip of the sensillum by means of micro-manipulators. A silver wire inserted into the stimulating pipette was connected with a Tek-tronic type 123 a.c. pre-amplifier or a high-input impedance Bioelectric NF1 pre-amplifier. The potential changes were displayed on a Tektronix 502 A cathode ray oscilloscope and photographed continuously with a Cossor oscillograph camera.
A depolarization of the receptor membrane is recorded as a positive-going displacement on the oscillographs. Unless stated otherwise the number of impulses were counted from 0.05 sec after the beginning of stimulation onwards, because of the electrical artifacts occurring at the moment when contact
90 Meded. Landbouwhogeschool Wageningen 72-11 (1972)
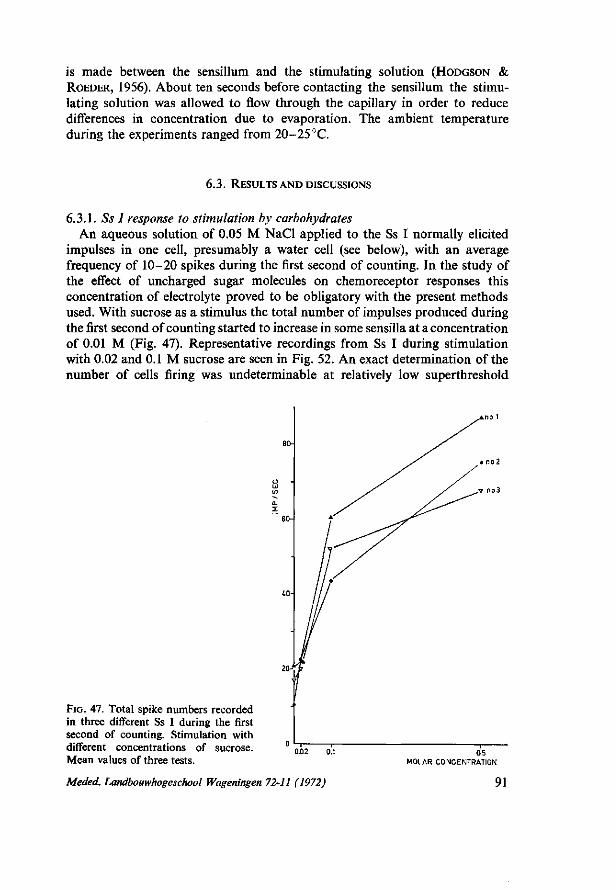
is made between the sensillum and the stimulating solution (HODGSON & ROEDER, 1956). About ten seconds before contacting the sensillum the stimulating solution was allowed to flow through the capillary in order to reduce differences in concentration due to evaporation. The ambient temperature during the experiments ranged from 20-25 °C.
6.3. RESULTS AND DISCUSSIONS
6.3.1. Ss I response to stimulation by carbohydrates An aqueous solution of 0.05 M NaCl applied to the Ss I normally elicited
impulses in one cell, presumably a water cell (see below), with an average frequency of 10-20 spikes during the first second of counting. In the study of the effect of uncharged sugar molecules on chemoreceptor responses this concentration of electrolyte proved to be obligatory with the present methods used. With sucrose as a stimulus the total number of impulses produced during the first second of counting started to increase in some sensilla at a concentration of 0.01 M (Fig. 47). Representative recordings from Ss I during stimulation with 0.02 and 0.1 M sucrose are seen in Fig. 52. An exact determination of the number of cells firing was undeterminable at relatively low superthreshold
FIG. 47. Total spike numbers recorded in three different Ss I during the first second of counting. Stimulation with different concentrations of sucrose. Mean values of three tests. MOLAR CONCENTRATION
Meded. Landbouwhogeschool Wageningen 72-11 (1972) 91

Stimulus concentrations because of the small differences in amplitudes. At high sucrose concentrations, e.g. 0.1 and 0.5 M, one cell fired at increased frequency and with large action potentials. This particular cell can be designated as a 'sugar' cell on the following considerations: 1. its impulse frequency is positively correlated with changes in sucrose concentrations and 2. different impulse frequencies are evoked when different kinds of sugar at equal concentrations serve as stimuli (Fig. 48 and Table 15). The receptor was especially sensitive to L-fucose, sucrose, D-glucose and D-fructose in this order of decreasing responsiveness. The number of cells firing showed a difference with the different sugars applied. At a standard concentration of 0.3 M sucrose and glucose predominantly one cell was firing. The spikes elicited by the conducting solution were clearly suppressed at this high sugar concentration. However, the impulses elicited by stimulation with fructose and fucose could be distinguished into two types, viz. a large type with an amplitude corresponding to that of the sugar spikes evoked with sucrose and a smaller type, designated as Sm-spikes.
0.02 0.1
MOLAR CONCENTRATION MOLAR CONCENTRATION
MOLAR CONCENTRATION
FIG. 48. Total spike numbers recorded in Ss I of three preparations (A, B and Q during the first second of counting as a function of sugar concentration. Mean values of two tests. (A) glucose; (A) fructose; (•) sucrose.
92 Meded. Landbouwhogeschool Wageningen 72-11 (1972)

s. a
?.* i» •» w tu
O ^ Ö 8?
G o» .9 ?ë ta "5 a o S £ « o M C C •—
'C T3
à? £ c ta
•3
12 " 4> ai
•O 35
S I CJ c tu
•s 5 53 c h a o's S o G -^ <~ « g O vo c
•a--s
S S S - 8 2 2 3 o.
£ « £
f ta a tu 'S ö S o u a a c c o o .S u U o g -
tU
J) « es
P ~ >
c s G 3 * S3
Z 0 Ë w tu * "•J ** f • S s < G G r* G w
- ; o O «
3 O
on
o " So w Z
ö o ö •"•
C/3
"n vo « >o V I tri
w-i v-i <o «^
• * M O " t <N C-4
Ö o © CJ 3
C/3
1 O *"* (0
O 1/3
• * «Ti
OS
<N «O
c i
•* •n
«ri
?
t n
O • *
• *
oo • *
«ri
t ^ ¥-> i ^ y2 vo vo
^ O O ^ C l ^ l »o
Meded. Landbouwhogeschool Wageningen 72-11 (1972) 93

During the first second of counting the number of Sm-spikes made up about 40 per cent of the total number of impulses produced, which signifies a frequency of approximately 25 and 40 impulses for fructose and fucose respectively. This means that the frequency of the Sm-spikes would exceed the average frequency of the impulses recorded with 0.05 M NaCl. When assuming cellular specificity for the cells sensitive to stimulation with alkaloids, sugars and mustard oil glucosides and taking into consideration that the Ss I is innervated by a total number of four chemosensitive cells (see Chapter 5) this observation may suggest that a fourth cell is discharged by certain sugars, in this case L-fucose and presumably also fructose. In the chemosensitive hairs of flies, such as Phormia regina, some polyhydric alcohols, especially dulcitol, have been thought to stimulate the salt receptor (HODGSON, 1957). According to DETHIER and HANSON (1965) 1-arabinose stimulated both salt and sugar receptors in the pseudotracheal papillae of this species. In the cabbageworm the Ss I responded to the presentation of NaCl solutions with the discharge of impulses from one or two receptor cells dependent on the stimulus concentration. Impulses from two cells are seen at 0.5 M or higher concentrations. On behavioural grounds
TABLE 16. Total number of impulses during the first second of counting and averaged from the responses of three different sensilla. All compounds were given in 0.3 M concentration and dissolved in 0.05 M NaCl. When possible a differentiation has been made between the large sugar spikes and the Sm-spikes ; the latter are brackets.
Stimulating solution
0.05 M NaCl pentoses
d-arabinose 1-arabinose l-fucose d-ribose d-xylose
hexoses d-fructose d-galactose d-glucose d-mannose 1-sorbose
disaccharides lactose d-maltose sucrose d-trehalose
trisaccharides melezitose raffinose
polyhydric alcohols inositol sorbitol
P. S s l
13
13 14 62 (44) 16 11
30 (19) 7
35(1) 0
20
5 0
55(2) 0
3 2
7 6
brassicae SsII
0
0 0 0 0 0
0 0
61 0 0
0 0
93 0
0 0
0 0
D. Ss l
5
20 15 75 0
94
15 67 84 11 10
0 0
23
-
0 0
70 -
pini SsII
0
0 0
75 16 0
0 0
22 5
10
8 0
95
-
18 8
5 -
94 Meded. Landbouwhogeschool Wageningen 72-11 (1972)

(see Chapter 3) it can be assumed that the cell firing at only higher salt concentrations is a specific 'salt' cell. The cell discharging at low sodium chloride concentrations then presumably is a 'water' cell. According to ISHIKAWA (1967) the medial sensillum in the silkworm has also a specific receptor for water. As can be seen from Table 16 any activity of this 'water' cell is inhibited by various sugars as sucrose, glucose, mannose, maltose and trehalose at high concentrations. It has been demonstrated that the responses of the blowfly labellar sensilla to water tend to be inhibited by sugars (EVANS and MELLON,
1962; REES 1970). It could by hypothesized that certain other sugars would not suppress the activity of the water cell and that the Sm-impulses originate in this cell. To obtain experimental evidence however, requires the use of recording methods such as developed by MORITA and YAMASHITA (1959) rather than those employed in the present study. Also from the labellar sensilla of the Mediterranean fruitfly Ceratitis capitata the spike patterns of response to stimulation by certain sugars contained spikes originating in more than one cell (GOTHILF
et al. 1971). The non-sugar spikes were also thought to originate in a water cell. Instead of assuming the existence of a specific 'water' cell it can alternatively be supposed that some cell (s) might have a high 'spontaneous' activity which can be suppressed by certain chemical compounds.
6.3.2. Ss II responses to stimulation by carbohydrates The sensitivity spectrum of the Ss II sugar receptor differed markedly from
that of the Ss I analogous receptor (Table 16). Of all eighteen kinds of carbohydrates tested specific responses were exclusively obtained with sucrose and glucose. Stimulus-response relationships were recorded in different Ss II during stimulation by sucrose and glucose in a wide range of 0.001-1.0 M concentration. A more detailed example of the rising phase in the relationship is shown in Fig. 49. The adaptation curves of Ss II sugar receptors determined with 0.1 M sucrose and 0.1 M NaCl as conducting solution sometimes showed a small shoulder at about 50-120 seconds of stimulation (Fig. 50), an observation also made with the Ep sugar receptor. The impulse frequency gradually decreases again after about 100 seconds until an average minimum frequency level of approximately 0.5 impulses per second was reached after 200 seconds. The presence of the small shoulder in the curve is not readily explained but might be related to a prolonged action of salt on the cell membrane of the sugar receptor (see also section 6.5.2.). The threshold of response of sucrose and glucose is at approximately 0.001 M and 0.01 M respectively. Thus the Ss II sugar receptor is about ten-fold more sensitive to stimulation by sucrose than the corresponding Ss I receptor. The Ss II receptor begins to saturate at 0.1 M concentration of sucrose and 0.3 M of glucose.
6.3.3. Interspecies specificity towards various sugars The sugar receptory cells in different species of lepidopterous larvae show a
very wide diversity in stimulus spectra. In Table 17 this has been illustrated by the examination of the sugar receptors of the last instar larvae of Dendrolimus
Meded. Landbouwhogeschool Wageningen 72-11 (1972) 95

W w > -
120 •
"- 100 -
S 8 0 -
6 0 -
40-
20-
SUCROSE
GLUCOSE
i i l 1 1 —
0.001 0.005 0.01
1 I ' ' " I ' — ' ' I ' " 0.05 0.1 0.5
MOLAR CONCENTRATION
FIG. 49. Response - concentration relations of the Ss II in stimulations by sucrose and glucose. Vertical bars indicate the ranges of the response values of two tests. The various tests were presented in random order.
<-> 100
OS
500 600 TIME (SEC.)
FIG. 50. Sensory adaptation of sugar receptor in Ss II upon stimulation by 0.1 M sucrose in 0.1 M NaCl. Impulses were counted from 0.2 sec after beginning of stimulation onwards.
96 Meded. Landbouwhogeschool Wageningen 72-11 (1972)

TABLE 17. List of species of lepidopterous larvae showing electrical response during stimulation of the lateral (L) or medial (M) maxillary sensilla styloconica with 0.1 M m-inositol. (+) denotes positive responses, (—) indicates an absence of positive responses.
Species M L Reference
Bombyx mori (Bombycidae) — + Ishikawa, 1963 Manduca sexta (Sphingidae) + + Schoonhoven, 1969 c Philosamia cynthia (Saturniidae) + + „ Operophtera brumata (Hydriomenidae) + + „ Euproctis phaeorrhoea (Lymantriidae) — + „ Adoxophyes reticulana (Tortricidae) — + „ Heliothis zea (Noctuidae) + - Dethier & Kuch, 1971 Estigmene acrea (Arctiidae) + — „ Malacosoma americana (Lasiocampidae) + + „ Calpodes ethilus (Hesperiidae) — + „ Ceratomia catalpae (Sphingidae) + + „ Jsia Isabella (Arctiidae) + + „ Danaus plexippus (Danaidae) — + „ Pieris rapae (Pieridae) — + Porthetria dispar (Liparidae) + + „ Papilio polyxenes (Papilionidae) + + „ Mamestra brassicae (Noctuidae) + + Ma, unpubl. res. 1969 Dendrolimus pini (Lasiocampidae) + — „ Bupalus piniarius (Geometridae) — + „ Pieris brassicae (Pieridae) — — Ma, 1969
pini L. These tests, completed with cross-adaptation tests, showed that the Ss I sugar cell in this species is specially sensitive to m-inositol and various monosaccharides as 1-fucose, d-xylose, d-glucose and d-galactose. By exception the basic chemical structure required for any monosaccharide to form an effective stimuli could tentatively be described as a benzene or pyranosyl ring with three hydroxyl functional groups in a sequence of cis-, cis-, trans-position, with regard to the general plane, as functional groups. The Ss II sugar receptor in this species was predominantly sensitive to sucrose and glucose, but differed from the Ss II sugar cell of P. brassicae in being highly responsive to stimulation with 1-fucose. The receptors of both species did not respond when stimulated with maltose, a compound which next to sucrose provided one of the most effective stimuli for the Ss II sugar receptor in the larva of Bombyx mori (ISHIKAWA, 1963). The relation between the molecular structure and stimulating effectiveness of sugars and related compounds often seems to be entirely fortuitous. As a rule all species of lepidopterous larvae, that of the cabbage-worm being a marked exception, have a receptor which positively responds to stimulation by m-inositol (Table 17). Receptor cells predominantly specific for sucrose as adequate stimulus are as a rule not responsive to stimulation by solutions of m-inositol; the inositol sensitive cell in D. pini forms an exception. Specialized glucose sensitive cells are found in the silkworm (ISHIKAWA, 1963) and in Philosamia cynthia (SCHOONHOVEN, 1969c).
Meded. Landbouwhogeschool Wageningen 72-11 (1972) 97

6.3.4. Ss I chemoreceptor cell sensitive to specific feeding inhibitory compounds Application of weak electrolyte solutions of one of the active feeding in
hibitors to the lateral sensilla styloconica did not evoke any electrical response but impulses were generated when the medial sensilla were stimulated. One chemoreceptor cell appeared to be specifically sensitive to these feeding inhibitors. The molecular structures are given in Fig. 51. Generally these compounds consist of condensed ringsystems of high molecular weight with a alkaloidal or steroidal nature. Mono- or heterocyclic structures of simpler configuration, e.g. salicine, phenoxy acetic acid and purine or pyrimidine derivatives, were all ineffective. The spatial conformation of the molecule seems to be one of the important factors for its physiological activity.
The electrical phenomena recorded from the Ss I when applying the deterrent active substances were not associated with any deleterious effect to the receptor cell membrane. The reproducibility of the impulse patterns evoked have been checked during repetitive adaptive stimulations. It was noted that the impulse frequencies elicited during each subsequent stimulation started to drift to somewhat higher values after about 30 to 60 minutes after the preparation was made. Since the recording pipette was refreshed every time this could not be due to a change in stimulus concentration, but is rather caused by changes in the sensillum itself. A drift in responsiveness, however, is not specific to this particular receptor but has also been noted on other ones as well. Therefore in experiments requiring serial stimulations the preparation was not kept longer than for about two hours and random order of stimulation was normally practised.
6.3.5. Cellular specificity Stimulation of the Ss I with mixtures of strychnine nitrate and sucrose always
elicited impulses from two receptor cells. That stimulating mixtures of both components in different concentration ratios showed the two receptor cells to behave independently of each other implies that the responsivenesses of both receptors were not influenced by the presence of the alternative compound in the stimulting solution and that the activity of each receptor type was not changed by the simultaneous activity of the other (Table 15 and Fig. 52).
A similar experiment was carried out with the mustard oil glucoside sensitive cell. Recordings of responses of Ss I to stimulation by relatively high concentrations of sinalbin hydrate showed impulses from two different receptor cells which were distinguishable by their difference in amplitude and frequency. The smaller impulse type, designated as s-type, made up about 45 % of the total number of impulses recorded during the first second of counting when 5.10"3 M sinalbin was used as stimulating solution (Table 18). In experiments during which one Ss I was first continuously stimulated by one stimulus quality until the activity became adapted to a minimum level and immediately (time lapse less than ten seconds) after this moment stimulated again with an alternative stimulus quality, together with subsequent experiments in which the same procedure was followed, but in reversed order, the following results were
98 Meded, Landbouwhogeschool Wageningen 72-11 (1972)

C Vi o vi
• - — c c s "O '5 ° û c 5 s o 3 •§ ca o f t j c o, S S g
S JJ ^ !3 «J
«t o o Ô c £
.o ö •5 o
ö a .2 8 * 8 a = u o s >5 £ '5 « o u T g S H s > e — (S -^JS o « o te a - s J- "o 5 u w U ~ .2 ^ ??-a -O J3 D.
c '5 J3
T3 C CS
e 3
x:
'I c .o 'S
3 •D
T3
•o
T3 C O
-t->
M
.s ' E +-> 3 >$ •o S s i
O e
3 « C <u c «
*-< 'S«
iS c G'4 a e Z 5
^ c
+ o o
I X X
T H
«o
Ö
•§ 73 d
<—i
>rÏ
+ e S *rt e
u-i c4
o C 'S 45 O
>* l i
<n <N
<L) Ö 'S 43 O
>» fc-Vi Vi Vi Vi
Meded. Landbouwhogeschool Wageningen 72-11 (1972) 99

èmmm
', ! ! t ! ! ! I i ! ! I ! 11 1 I i 1 1 ! I Î ! S Ü
l in j iSHi i i i i i i i l l l l h l , .
H l S i l i l l H l i i i i j h i j H i i ' . i ' . i l l i i U i i i i ' . i i l i S i i i i i . l i i i i i i l ' i i i l i i l ' i M l l l ï ' U 1 1 JS< U ü U i i ' ' « I s 5 - l i l i i i l 1< • l»i'« »J; i l i l j i ; - !' i l l
! ; ! : ; ! i ;
100 Meded. Landbouwhogeschool Wageningen 72-11 (1972)

obtained. Prolonged stimulation of the Ss I with a solution of 10~3 M strychnine or ecdysterone during 8 minutes silenced the deterrent sensitive cell. Actually adaptation was already achieved after a few minutes of stimulation.
In another experiment it was found that the s-type impulses were eliminated when the prolonged application of strychnine was immediately followed by stimulation with the sinalbin solution whereas the large type (L-type) of impulses were not affected. This difference in sensitivity for strychnine of the two cell types firing during sinalbin stimulation may appear also from the frequency distributions made of the spike heights of the L- and s-type of impulses which are presented in Fig. 53. The amplitudes of the impulses were measured in the falling phase because of the obscurity of the start of the rising phase of the action potentials as caused by the noise level. Measurements were based on the impulses during the first second of counting. These results suggested a possible interaction between the deterrent stimulus and the receptor cell responding with the s-type of impulses during stimulation with sinalbin.
This was confirmed by experiments during which the Ss I was stimulated with a mixture of sinalbin and strychnine. During these stimulations two types of spikes were recorded, designated as Ls and L1. The frequency of the Ls impulses was well correlated with the frequency of the L-type impulses recorded during sinalbin stimulations, whereas the frequency of the LMmpulses compared more closely with that of the D-impulses recorded during stimulations with single solutions of strychnine (Table 19). The results indicated that the s-impulses elicited during stimulation with sinalbin were not present in the impulse patterns evoked with mixed solutions of sinalbin and strychnine. Thus, the origin of the s-impulses remains unknown. In view of the chemical non-relationship between mustard oil glucosides and the feeding inhibitory compounds it is not very likely that the s-impulses are originating in the deterrent sensitive receptor cell. This would also be in contradiction to the action of both classes of compounds on the behaviour of the animal. It is more likely that the s-impulses originate in the water cell, in fact the same cell which is also stimulated by fructose and fucose. Alkaloidal and steroidal compounds, then, would have an inhibiting effect on the water cell. It is known that the water cell in the chemoreceptive sensilla of Phormia terranovae is inhibited by calcium chloride (REES, 1970). Although this of course would not give any absolute evidence that a water cell is involved it was nevertheless interesting to investigate whether the frequency of the s-impulses during stimulation of the Ss I with sinalbin would be affected by this inorganic chloride. The frequency distributions of the spike heights made when calcium chloride
•4 FIG. 52. Oscillographs of responses of Ss I to stimulation with (1) 0.1 M NaCI; (2) 0.02 M sucrose; (3) 0.1 M sucrose; (4) 10~5 M SN03; (5) 10"4 M SN03; (6) 0.02 M sucrose and 10"5
M SN03; (7) 0.02 M sucrose and 10"4 M SN03; (8) 0.1 M sucrose and 10"5 M SN03; (9) 0.1 M sucrose and 10~4 M SN03. Sucrose and SN03 are dissolved in 0.1 M NaCI solution. Calibration symbol indicates 0.1 sec.
Meded. Landbouwhogeschool Wageningen 72-11 (1972) 101
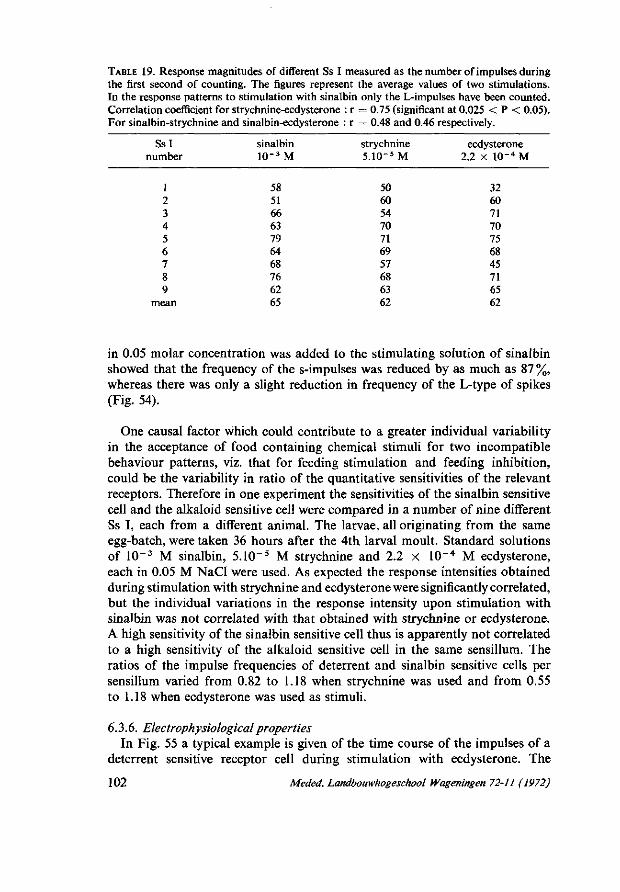
TABLE 19. Response magnitudes of different Ss I measured as the number of impulses during the first second of counting. The figures represent the average values of two stimulations. In the response patterns to stimulation with sinalbin only the L-impulses have been counted. Correlation coefficient for strychnine-ecdysterone : r = 0.75 (significant at 0.025 < P < 0.05). For sinalbin-strychnine and sinalbin-ecdysterone : r = 0.48 and 0.46 respectively.
S s l number
1 2 3 4 5 6 7 8 9
mean
sinalbin 10" 3 M
58 51 66 63 79 64 68 76 62 65
strychnine 5.10"5
50 60 54 70 71 69 57 68 63 62
M ecdysterone
2.2 x 1 0 " 4 M
32 60 71 70 75 68 45 71 65 62
in 0.05 molar concentration was added to the stimulating solution of sinalbin showed that the frequency of the s-impulses was reduced by as much as 87 %, whereas there was only a slight reduction in frequency of the L-type of spikes (Fig. 54).
One causal factor which could contribute to a greater individual variability in the acceptance of food containing chemical stimuli for two incompatible behaviour patterns, viz. that for feeding stimulation and feeding inhibition, could be the variability in ratio of the quantitative sensitivities of the relevant receptors. Therefore in one experiment the sensitivities of the sinalbin sensitive cell and the alkaloid sensitive cell were compared in a number of nine different Ss I, each from a different animal. The larvae, all originating from the same egg-batch, were taken 36 hours after the 4th larval moult. Standard solutions of 10"3 M sinalbin, 5.10"5 M strychnine and 2.2 x 10~4 M ecdysterone, each in 0.05 M NaCl were used. As expected the response intensities obtained during stimulation with strychnine and ecdysterone were significantly correlated, but the individual variations in the response intensity upon stimulation with sinalbin was not correlated with that obtained with strychnine or ecdysterone. A high sensitivity of the sinalbin sensitive cell thus is apparently not correlated to a high sensitivity of the alkaloid sensitive cell in the same sensillum. The ratios of the impulse frequencies of deterrent and sinalbin sensitive cells per sensillum varied from 0.82 to 1.18 when strychnine was used and from 0.55 to 1.18 when ecdysterone was used as stimuli.
6.3.6. Electrophysiological properties In Fig. 55 a typical example is given of the time course of the impulses of a
deterrent sensitive receptor cell during stimulation with ecdysterone. The
102 Meded. Landbouwhogeschool Wageningen 72-11 (1972)

40-
30-
20-
10-
n=29 ! n=61
ƒ1
A
n=91 40-
30-
20-
10-
n=35 j
rir 1 1 ! 1
n=56
1 1 l l
B
n.82
1 1 1 l 10 12 14 16 12 14 16
40-
30-
20-
10-
n=3 j n=64
1 r m i—i i i i i
c n=67
2 4 6 8 10 12 14 15
IMPULSEAMPUTUDE (mm)
FIG. 53. Frequency distributions of spike heights (falling phase) recorded in Ss I during stimulation with 0.005 M sinaibin in 0.1 M NaCl. Measurements were started from 0.5 sec after beginning of stimulation. (A) first test, first second of measurement (B) 2nd second; (C) second test, first second of measurement immediately after adaptive stimulation with strychnine nitrate (0.001 M) for 8 min.
curve represents the cumulative number of action potentials during the first second of stimulation. During the first 700 msec the concave slope of the curve indicated a gradual increment in impulse frequency in this period. The frequency will then become constant or slightly adaptive to somewhat lower values. During the period of stimulation a constant firing of the cell was found with 2.2 x 10 - 6 M and 4.4 x 10~5 M ecdysterone at a frequency of 12 and 62 impulses per second respectively. The slightly sigmoidal curve found with a higher stimulus concentration of 2.2 X ÎO - 4 M demonstrated a slow adaptation to lower frequency after approximately 900 msec of stimulation. Similar time courses are obtained with strychnine nitrate as a stimulus.
During the initial 'building-up' period in impulse frequency during stimulation of the deterrent sensitive receptor the amplitude of the impulses recorded showed a correlated increase. The ultimate value reached is approximately approached at the moment the steady state frequency has been reached. Fig. 56 shows one experiment in which amplitude of the impulses during steady firing of the receptor has been plotted against the stimulus concentration. However, the dependency of the impulse amplitude on the firing rate (or stimulus concentration) as shown in this experiment is not a property specific to the deterrent sensitive cell but is observed in other receptors as well. Spike amplitude is thought not to give any contribution to the coded information reaching the ens. Therefore only the initial 'building-up' phase in the frequency of the im-
Meded. Landbouwhogeschool Wageningen 72-11 (1972) 103

pulses from the deterrent sensitive cells could possibly have a functional meaning with regard to food acceptance behaviour. That it has not been observed in any other receptor type suggests that it is not likely to be an artifact.
Fig. 56 shows the stimulus-response relationship of a deterrent sensitive cell during stimulations with ecdysterone. In this case the Ss I was from a larva of the strain P. brassicae var. cheiranthi. The threshold of response was situated at a concentration of approximately 2.2 x 10"6 M. The receptor activity became saturated at a concentration of about 1.1 x 10 - 4 M. A characteristic tonic response started after about 3-4 seconds of stimulation with a frequency of 60 ± 1 impulses per second and continued during the remaining 6-7 seconds of stimulation. Various experiments have been carried out with a number of receptors from different individuals of P. brassicae. The results indicated that the deterrent sensitive receptor generally possesses a relatively low response threshold of 2.2 X 10 - 6 M for ecdysterone and 10"6 M for strychnine. These values represent the absolute limit of larval perceptive ability for these compounds. Concentration-response relationships are shown in Figs. 57 and 58. Saturation level of response is reached at a concentration of 2 x 10 - 5
M o r i x 10 ~4 M in case of strychnine and ecdysterone respectively, the maximum level of response being at 60-65 impulses per second. Strychnine is a more effective stimulus than ecdysterone which can be judged also from the
40-
30-
20-
10-
n=38 |
i r~i i i i i
n=60
1
A
n=!00
L-, I i 1 i
4 0 -
3 0 -
20-
10-
n*37 j
i l f i r
n: 53
I I !
B
n=8l
~i n 10 12 14 16
4 0 -
3 0 -
20-
10-
n=5 |
11 , i m i
n=46
i-T -T-U
C n=51
~\ 4^ 10 12 14 16
4 0 -
3 0 -
2 0 -
10
D n=41
6 8 10 12 14 16
IMPULSE AMPLITUDE (mm)
FIG. 54. Frequency distributions of spike heights (falling phase) during (A) first or (B) 2nd second of measurement of impulses elicited in Ss I during stimulation with 0.005 M sinaibin on 0.1 M NaCl. (C) and (D) represent the first and 2nd second of measurement during stimulation with 0.005 M sinaibin in an admixture of 0.05 M NaCl and 0.05 M CaCl2. Measurement of impulses started at 0.5 sec after the onset of stimulus application.
104 Meded. Landbouwhogeschool Wageningen 72-11 (1972

FIG. 55. The cumulative spike numbers (L-type) during the first two seconds of response of a Ss I to stimulation with ecdysterone. The concentrations of ecdysterone applied are as follows: (A) 2.1 x 10⁻⁶ M; (B) 1.0 x 10"5 M; (C) 4.2 x 10"5 M; (D) 2.1 x 10"4 M.
I 90
g 80-
3 70-û-2 < SOLU
fc 50-
UJ oc 30
20-
10-
4.0 20.0 40.0 100JD
MOLAR CONCENTRATION ECDYSTERONE (X10"3 )
FIG. 56. Frequency and relative amplitude of impulses during mean adapted responses of the deterrent sensitive cell in Ss I during stimulation with ecdysterone concentrations in 0.05 M NaCl. Counting started at 1.0 sec after beginning of stimulation. Concentrations were applied in random order. Impulse frequencies (open circles) are the mean of two tests. Mean spike amplitudes ( ± 2 . S.E.) (closed circles) were calculated from 22 spikes, and measured relative to the mean impulse amplitude elicited by 0.001 M ecdysterone. Experimental temperature 24 °C.
Meded. Landbouwhogeschool Wageningen 72-11 (1972) 105

MOLAR CONCENTRATION SNOjÛdO"5)
FIG. 57. Impulse frequencies in Ss I during the 2nd second of stimulation by strychnine nitrate at various concentrations. Each concentration was dissolved in 0.1 M NaCl solution. Data from five different larvae.
lower electrophysiological threshold. An average impulse frequency of 32 impulses per second can be elicited by a concentration of 2.2 X 10 ~5 Mecdy-sterone as well as by a concentration of 2.5 X 10~6 M strychnine. This might indicate that the deterrent sensitive cell is almost ten times more responsive to stimulation with strychnine than with ecdysterone.
Some comparative experiments with other species of lepidopterous larvae revealed that these compounds did not stimulate any receptor cell in the maxillary sensilla styloconica of Dendrolimus pini, Hyalophora cecropia, Manduca sexta or Platysamia cynthia. On the other hand a receptor cell type has been described by ISHIKAWA (1966) in Bombyx mori with physiological properties which are partly analogous to those of the deterrent sensitive cell in P. brassicae. The receptor in the silkworm has been reported to be highly sensitive to stimulation with salicine, a compound which is ineffective on the receptor in the cabbageworm. On the other hand the compounds listed in Fig. 51 all proved to be effective stimuli also for the silkworm receptor.
106 Meded. Landbouwhogeschool Wageningen 72-11 (1972)

s„
n 0.42
1.04 4.20 1
10.40 I I
20.80 41.60 1
104.0 molar concentration ecdysteronc (X10~5)
FIG. 58. Impulse frequencies in Ss I during the 2nd second of stimulation with various concentrations of ecdysterone in 0.1 M NaCl. Data from four different larvae.
6.3.7. Discussion Feeding activity in the larva of P. brassicae can be reduced or completely
inhibited by a specific group of chemical compounds acting at relatively low concentrations. These observations raised the question as to whether these compounds were perceived by a specialized chemoreceptor cell type which produces a negative cue with regard to feeding activity or whether the feeding inhibition was caused by an indirect effect, viz. a suppression of the responsiveness of those chemoreceptor cells which trigger feeding activities. A possibility of the existence of both effects could however not be excluded especially since it is known that such compounds as quinine chloride can hyperpolarize chemoreceptor cell membranes, as established in the blowfly (MORITA, 1959, 1963; MORITA & YAMASHITA, 1959).
The present results indicate that next to the mustard oil glucoside sensitive receptor the Ss I contains a receptor sensitive to certain alkaloids and steroids, a receptor sensitive to certain sugars, and a salt sensitive cell. There is one nonspecific cell which can be triggered by compounds of different chemical classes such as sinalbin, fucose or conessine. This cell has also been described as a
Meded. Landbouwhogeschool Wageningen 72-11 (1972) 107

'water' cell although there is only indirect evidence for this. The Ss I contains only four chemosensory bipolar neurons. Therefore it has to be assumed that this non-specific 'water cell' is either identical with the salt sensitive cell or one of the other cells. On the other hand sinalbin, fucose, conessine as well as salt can discharge impulses from two cells. This observation is in contradiction to the previous assumption since this would signify the presence of more than four specific receptor cells. As yet the occurrence of additional impulses in response patterns to stimulation by certain stimuli can not be explained by assuming cellular specificity in an absolute sense.
The present results also indicate that the activity of each specific receptor is not influenced by the simultaneous activity of another cell in the same receptor. Also with the Ss II sugar cell it has been found that the response magnitude during stimulation with a certain stimulus concentration is not changed when a deterrent compound is present in the stimulating solution. Both observations suggest that if there is a causal relation between feeding inhibition and the action of distinct alkaloids and steroids this can not be explained by a suppression of the responsiveness of receptors which normally release a stimulation of feeding when triggered. Feeding inhibition by these compounds must be explained exclusively by a stimulation of specific receptor cells which produce an inhibition of the behaviour patterns normally needed to ingest food. This knowledge together with the response characteristics of the different receptor cells will be important for an analysis of the causation of food acceptance behaviour. This point will be discussed further in Chapter 7.
6.4. ELECTROPHYSIOLOGICAL STUDIES ON THE CONTACT CHEMOSENSORY
FUNCTION OF THE EPIPHARYNGEAL PAPILLA-LIKE ORGANS
Histological studies indicated that the papilla-like organs in the epipharynx are the only organs within the oral cavity which possibly could have a taste function (see Chapter 5). On basis of the food acceptance behaviour of the larvae we had already concluded that the oral cavity should contain chemore-ceptors sensitive to stimulation by sucrose and feeding inhibitory compounds, whereas it was less likely that chemoreceptors were present responding to mustard oil glucosides. These findings induced us to undertake electrophysiological experiments in order to demonstrate the chemosensory function of the epipharyngeal papilla-like structures (Ep).
Preliminary experiments showed that isolated labra generally gave very poor results, but these were greatly improved by first fixing the head on the indifferent capillary electrode and subsequently lifting the labrum with the aid of a large insect pin. The lifted labrum was then fixed into position by means of a sticky material smeared on the dorsal side of the labrum. Before the experiment the exposed ventral surface was carefully cleaned and dried with a small piece of lense paper. The techniques used for recording electrical potentials were essentially similar to those used for recording from the maxillary sensilla. The use of
108 Meded. Landbouwhogeschool Wageningen 72-11 (1972)

liquid electrodes often had the disadvantage of leaking as soon as contact was made with the flexible cuticle. Diluted agar solutions to prevent shunting (HANSON and DETHIER, 1965) gave some improvement but suffered from the serious disadvantage of rendering impossible a rigorous control of the stimulus concentrations applied since flow was not possible. An exact knowledge of the stimulus concentration however is a prerequisite for studying response characteristics more quantitatively. Therefore when necessary the use of agar filled electrodes was omitted. After each stimulation the epipharynx had to be carefully rinsed with water in order to remove all residual fluid before the next stimulation. Preparations were not kept longer than two hours to avoid possible effects due to deterioration. Other experimental conditions were the same as described in section 6.2. Mechanosensory impulses have never been noted during the normal gentle applications of the stimuli.
6.4.1. Ep responses to stimulation by some electrolytes Action potentials were recorded during stimulation of the Ep with aqueous
solutions of sodium chloride. Application of solutions of sodium chloride ranging in concentration from 0.01 to 4.0 M in random order gave the following results : at a concentration of 0.1 M low frequent small spikes were recorded (Fig. 59). At higher concentrations of 0.25 M this neuron discharged at an increased frequency of about 10 impulses during the first second of counting in a rather irregular fashion which might be due to the low frequency (Fig. 59). A second cell discharged at concentrations of 0.5 M sodium chloride with a spike amplitude of approximately 1.5 times that of the other cell. The discharge frequency of this second neuron increased only slightly to about 8 impulses during stimulation with 2.0 M and to about 12 impulses during the first second of counting at a concentration of 4.0 M sodium chloride. On the other hand the smaller type of impulses were no longer apparent at these high concentrations (Fig. 59). It has been observed that during prolonged stimulation with high concentrations the discharge activity of the salt sensitive (second) neuron showed an incomplete adaptation. With 0.5 M NaCl the neuron continued to fire during continuous stimulation without a distinct decrement in frequency during the whole period of each experiment (1 hour). In order to distinguish between the salt receptor and the receptor discharging with smaller impulses the first shall be referred to as the Sa-receptor and the other as the SI-receptor.
Response patterns obtained during stimulation with a monovalent series of equimolar (0.5 M) chloride salts of potassium and lithium did not reveal any substantial difference from those evoked with sodium chloride as stimulus. The Sa-impulses virtually doubled in frequency during stimulation with ammonium chloride. Because of the irregular way of firing and the small differences in spike heights it was not possible to ascertain whether SI-impulses were also involved, although some recordings suggest the presence of electrical summations.
In contrast to the monovalent cations the bivalent cations of chloride salts
Meded. Landbouwhogeschool Wageningen 72-11 (1972) 109

id « M *
FIG. 59. Oscillographs of responses of epipharyngeal papilla-like sensilla (Ep) to stimulation with sodium chloride. Response to (1) 0.1 M; (2) 0.25 M; (3) 0.5 M; (4) 2.0 M; (5) 4.0 M and (6) 4.0 M second test. The calibration mark indicates 0.1 sec. Records start at 0.5 sec after the onset of stimulus application.
viz. CaCl2, MgCl2, and BaCI2, always induced a low firing rate of only Sa-impulses as judged from the uniform large spikes. The receptor only responded to relatively high concentrations of the bivalent cations. Concentrations of 0.5-2.0 M calcium chloride gave impulses independent of stimulus concentration with a frequency of about 5 impulses per second of stimulation. A somewhat higher discharge rate is observed with concentrations higher than 2.0 M calcium chloride. Continuous presentation of a concentration of 0.5 M calcium chloride first resulted in a gradual adaptation of the Sa-receptor activity during
FIG. 60. Oscillographs of responses of Ep during stimulation with some sodium salts in 0.5 gr. equiv. Na+ per litre. The records are made from different sensilla. The response to each salt is compared to that elicited with 0.5 M NaCl (record 1 of each pair). (A2) NaBr; (B2) NaN03; (C2) Na2S04; (D2) Na2C03; (E2) Na3P04. All records start at 1.0 sec after the onset of stimulation.
110 Meded. Landbouwhogeschool Wageningen 72-11 (1972)

*^^^ T -'i^i mi^i^^p^»
i „ 1_ 11^ , *W
iiMiiüi a À murfrfct i ttii tu r i » ^ «MM
4MM#W«^M«|é*i4H^
»^H»W»>^»I^
liiM4M4Mi4itaMÉtaM4^^
'H i 4i
Meded. Landbouwhogeschool Wageningen 72-11 (1972) 111

about five minutes of stimulation. When stimulation was continued typical volleying patterns were observed which consisted of uniform monophasic negative and occasionally positive going potentials. Discharge rates could reach extremely high values with peak frequencies of more than 500 impulses per second. Several rinses of the sensillum after such volleys did not completely restore the normal responses. Apparently an artifact is involved due to a damaging effect of the calcium chloride on the receptor cell membrane. Volleying actions have never been observed during stimulations with monovalent cations. They have also been reported in the interpseudotracheal papillae of the blowfly during stimulation with calcium ions (DETHIER and HANSON, 1965).
The significance of the anionic part of the electrolytes in the response patterns to sodium salts was investigated with series of sodium combined with various kinds of anions. The concentrations were expressed as 0.5 gram-equivalent cation per litre. In each experiment the response of the sensillum under study to stimulation by 0.5 M sodium chloride served as a reference; thus possible individual variabilities in response patterns were eliminated. The most active sodium salts were those of nitrate, carbonate and phosphate, in contrast to salts of sulphate which showed a weaker activity. Practically no activities were found with citrate 3~ions. Presentation of sodium nitrate and sodium carbonate elicited impulses in both Sa and SI receptor, whereas SI spikes were not present in the response patterns obtained with the sodium salt of phosphate. The impulse trains evoked by stimulation with sodium phosphate
FIG. 61. Oscillographs of representative responses of Ep during stimulation with some ammonium salts in 0.5 gr. equiv. cation per litre. (1) NaCl; (2) NH4C1; (3) (NH4)2S04; (4) NH4
N03 . Records start at 1.0 sec after the onset of stimulation.
112 Meded. Landbouwhogeschool Wageningen 72-11 (1972)

suggested that phosphate ions are effective stimuli for this receptor cell. A concentration of 0.01 gram-equivalent sodium phosphate still elicited impulses whereas the same concentration of sodium chloride did not. The anions of a series of sodium salts could be arranged in the following order of decreasing response intensity: phosphate - carbonate - nitrate - chloride - bromide - sulphate - citrate.
Some recordings are shown in Figs. 60-62.
6.4.2. Ep responses to stimulation by carbohydrates Stimulation of the Ep with various concentrations of sucrose initiated trains
of large uniform impulses which were largely monophasic and positive with respect to the indifferent electrode. The high initial discharge rate during stimulation with e.g. 0.1 M sucrose rapidly adapted to a consistent regular frequency which is called here the steady state of response. Typical time courses of an Ep to stimulation with sucrose is shown in Fig. 63.A steady state frequency of 36-37 impulses per second is reached at about 20 seconds after the onset of stimulation with 0.1 M sucrose. This constant level of response was maintained for at least one minute. In fact, the frequency of the impulses, which gradually decreased in amplitude, showed a slightly increased value after about 100 seconds of continuous stimulation (Table 20) but decreases again when stimulation is maintained until after about three minutes a minimum frequency level of approximately 0.5 impulses per second is reached. The adaptation curve of the Ep sugar receptor does not differ essentially from that of the Ss II sugar receptor (section 6.3.2.).
-, 1
m^m*t*^m^^
fr^Wf»^
^m^^^f^i
FIG. 62. Oscillographs of representative responses of Ep during stimulation with some chloride salts in 0.5 M concentration. (1) KCl; (2) LiCl; (3) NH4C1; (4) CaCl2. Records start at 1.0 sec after onset of stimulation.
Meded. Landbouwhogeschool Wageningen 72-11 (1972) 113

FIG. 63. Time courses of receptor activity in Ep during stimulation with sucrose at 0.1 M (upper curve) or 0.01 M concentration (lower curve).
10 12 TIME (SEC)
The response magnitudes of the Ep sugar receptors to a wide concentration range of sucrose has been plotted in Fig. 64 for a number of eight different preparations. A consistent increase in impulse frequency is shown with increasing stimulus concentrations within the range from 0.001-0.1 M sucrose. Compared with the response characteristics of the Ss II sugar receptors the Ep receptors produced larger impulses but at a lower maximal frequency. The maximum impulse amplitudes recorded from the Ep were generally 2-3 times larger than that recorded from the maxillary sensilla of the same preparation. The maximum impulse frequency, however, obtainable with sucrose
TABLE 20. Receptor activity of an Ep sensillum to continuous stimulation with 0.1 M sucrose.
time elapsed after beginning of stimulation (seconds)
mean frequency (impulses per sec)*
relative spike amplitude**
20 60 90
120
37 ± 1 37 ± 0 41 ± 0 47 ± 0
1.00 0.87 0.73 0.40
* mean value with extreme deviations calculated from 3 succesive seconds; ** measured from a number of 20 impulses in the rising phase of the potential.
114 Meded. Landbouwhogeschool Wageningen 72-11 (1972)

r 60-z 2S r
1/ /l
/ I
,1' ** 1
ä 1 "
0.001 0.01
CONC. SUCROSE ( M )
FIG. 64. Concentration-response relation of Ep in stimulations by sucrose. Mean impulse frequencies ( ± 2. S. E.) are shown during first second of counting. Data from 8 different sen-silla with one series of stimulations per sensillum.
and measured in the period of 1.0-2.0 second after the onset of stimulation took a mean (± s.e.) of 56 ± 7 impulses (n = 18), which was about 60 per cent of the value (90 ± 5) recorded from the Ss II sugar receptors in the same preparations. With d-glucose as stimulus the mean maximal impulse frequency reached in the Ep receptors was at 32 ± 6 impulses obtained with a concentration of 0.1 M, which is about 60 per cent of the maximum response magnitude obtained with sucrose. The fact that glucose generally elicited smaller spikes than sucrose in the Ep is possibly related to the lower frequency. Cross-adaptation experiments however proved that only one single receptor cell was involved. Mixtures of sucrose and glucose always elicited one single type of impulses. As with the Ss II sugar receptor cell the impulse frequency during stimulation with a mixture of sucrose and glucose consisted of the mere sum of the effect of each separate component (provided that the theoretically maximum possible response level could not be exceeded). At very low super-threshold concentrations of sucrose or glucose the possible confusion of the small sugar spikes with salt spikes rendered a determination of the exact threshold of response rather difficult. By extrapolation of data from a number of different sensilla it was inferred that the liminal threshold of response of the Ep sugar receptor approximated a concentration of 0.001 M and 0.01 M for sucrose and glucose respectively. The absolute sensitivity of this receptor thus does not differ essentially from that of the Ss II analogous receptor. The relative stimulus-response relationships are also equal. Qualitatively the sensitivity spectra of the sugar receptors in both types of sensilla are similar as well. Neither receptor cells discharge impulses during stimulation with carbohydrates other than sucrose and glucose.
Meded. Landbouwhogeschool Wageningen 72-11 (1972) 115

*+*U*w*m**0mmwï
FIG. 65. Oscillographs of adaptive responses of Ep during stimulation with various concentrations of sucrose in 0.1 M NaCl. (1) 0.1 M NaCl; (2) 0.004 M sucrose; (3) 0.01 M sucrose; (4) 0.1 M sucrose; (5) 0.5 M sucrose. Records starts at 3.0 sec after onset of stimulus application. Calibration 0.1 sec.
6.4.3. The effect of sodium chloride on the response of the Ep sugar receptor The similarity in electrophysiological properties of the Ep and Ss II sugar
receptors can be tested in some other way, viz. by comparing the effect of salts on their respective responsiveness. Next to the purely electrophysiological point of view such experimental manipulation of the input might give very useful information concerning the relation between sensory input and the behavioural output.
A comparison was made of the response magnitude of the Ep receptor during stimulation with a concentration of 0.1 M sucrose dissolved in different molar concentrations of sodium chloride. The results presented graphically in Fig. 66 show that the highest response magnitude to stimulation by sucrose was obtained when sodium chloride was present in a concentration between 0.05 to 0.2 M. With regard to the maximal response magnitude significant inhibitory effects (P < 0.05 ; Mann Whitney U-test) were noticed when either the concentration of sodium chloride was higher than 0.2 M or when it became lower than 0.05 M. Whether the later effect could be ascribed to an impairment of the conductivity of the stimulating solution will be answered in the following section. The amplitude of the sucrose impulses recorded was also affected by the sodium chloride concentration. The average height of the sugar spikes
116 Meded. Landbouwhogeschool Wageningen 72-11 (1972)

6 0 -
>-o 2 LU 13 a LU
£ -LU
3 0 . Z 40-
20-
-
I 1
-*
T > ^
/ • 1
i
\ N .
^# 1\ • i
l
0.2 0.5
MOLAR CONCENTRATION NaCl
FIG. 66. Comparison of the response magnitude of the Ep sugar receptor to stimulation with 0.1 M sucrose in the presence of varying molar concentrations of sodium chloride. Mean values are given with 2. S. D. of 12 different sensilla. Response magnitudes are given as the number of impulses during the 2nd second of stimulation.
elicited by 0.1 M sucrose in the presence of 0.02 M sodium chloride was only 40-50 per cent of the maximum amplitude reached when a concentration of 0.1 or 0.2 M sodium chloride was employed. Although there was no significant difference (see Fig. 66) in the extent by which the impulse frequency was reduced when sodium chloride was employed in a concentration of 0.02 or 0.5 M, the impulse amplitude was only reduced in the first mentioned situation. This shows that spike amplitude is not necessarily related with the frequency of the impulses. A reduction of about 30 per cent from the maximum amplitude was achieved when very high concentrations (2.0 M) of sodium chloride was added.
The typical small spikes which appeared in low frequency when stimulating the Ep with 0.1 M sodium chloride generally remained visible on the recordings when relatively low concentrations of sucrose were presented, e.g. 0.004 or or 0.01 M. At higher sugar concentrations, however, these Sl-impulses were almost completely suppressed. Salt impulses appeared again when high concentrations of sodium chloride, such as 0.5 M, were present in the stimulating solutions. When the concentration of sodium chloride was raised to 2.0 M the sugar impulses generated by stimulation with 0.1 M sucrose were largely replaced by the Sa-impulses (Fig. 67). Summarizing it can be concluded that at a relatively low concentration of sodium chloride and high sucrose concentration the response of the salt sensitive neurons is suppressed whereas the activity of the sugar receptor can be inhibited by the presence of a high salt concentration, even when sucrose is present in a relatively high concentration.
Meded. Landbouwhogeschool Wageningen 72-11 (1972) 117

iMiUi^MiWniM.A^I.MiiN^iiiliii^HMtiliii^l^X^^.i'ii
FIG. 67. Oscillographs of the responses of Ep during stimulation with 0.1 M sucrose in combination with different concentrations of sodium chloride. (1) 0.02 M NaCl; (2) 0.05 M NaCl; (3) 0.5 M NaCl and (4) 2.0 M NaCl. Note the appearance of salt spikes among the sugar spikes and the suppression of the frequency of the latter in record (3) and (4). All records start at 0.5 sec after the beginning of stimulation. Calibration 0.1 sec.
6.4.4. The effect of calcium chloride on the response of the Ep sugar receptor In contrast to the existence of an optimal concentration range of sodium
chloride with respect to the responsiveness of the sugar sensitive neuron the effect of calcium chloride on the later appeared to be exclusively inhibitory. In the following experiments a solution of 0.1 M sucrose was again used as a standard for measuring the responsiveness of the sugar receptor.
The presence of 0.1 M calcium chloride in the stimulating solution caused a decrease of around 50 per cent in the frequency of the sugar impulses during the first second of counting in comparison with the frequency recorded when 0.1 M sodium chloride was employed instead. This suppressing effect of calcium chloride, however, could be partly restored by addition of sodium chloride (Table 21). On the other hand when the concentration of sodium chloride added was higher than 0.2 M the frequency of the sugar impulses was reduced again. This phenomenon which was accompanied by the reappearance of the Sa salt spikes intermingling with the sugar impulses, prevented an exact determination of the frequency of the later. It should be noted that the rate of increase of the response magnitude of the Ep sugar receptor during stimulation with a combination of 0.1 M sucrose and 0.1 M calcium chloride by addition of concentrations of sodium chloride in the range from 0.02 to 0.1 M corresponds almost exactly with the rate of increase of the responsiveness of the same receptor under influence of different concentrations of sodium chloride
118 Meded. Landbouwhogeschool Wageningen 72-11 (1972)

TABLE 21. Antagonistic effect of sodium chloride on the action of calcium chloride on the response magnitude of the Ep sugar receptor cell when stimulated with 0.1 M sucrose. The mean number of impulses is given ( ± s.e.) counted during the 2nd of stimulation.
mean impulse frequency
NaCl 0.1 M 56 ± 2 (n = 17) CaCl2 0.1 M 25 ± 2 (n = 12) CaCl2 0.1 M + NaCl 0.02 M 23 ± 3 (n = 9) CaCl2 0.1 M + NaCl 0.1 M 35 ± 3 (n = 16) CaCl2 0.1 M + NaCl 0.2 M 41 ± 3 (n = 9)
alone. The only difference is that the later relationship occurs at a lower response level. Consequently it might be concluded that the excitatory effect of sodium chloride on the responsiveness of the sugar receptor can not be ascribed to differences in conductivity of the stimulating solution but rather is due to an effect on the receptor cell membrane itself.
Calcium chloride had no particular effect on the responsiveness of the salt receptor. Mixtures of 0.25 M sodium chloride and 0.25 M calcium chloride tended to elicit a greater response in the salt sensitive receptors than when either compound was applied singly. This enhancement in response can be traced also in recordings made during stimulation of the Ep with a mixture of 0.1 M sucrose, 0.1 M sodium chloride and 0.1 TVI calcium chloride. Small salt spikes are being seen among the sugar impulses, but they are absent when calcium chloride is omitted from the mixture presented.
The quantitative effect of calcium chloride in a concentration range varying from 0.01 to 0.4 M on the impulse frequency of the Ep sugar receptor recorded during stimulation with a mixture of 0.1 M sucrose and 0.1 M NaCl has been presented graphically in Fig. 68. A practically linear decrease in response magnitude is shown in relation to the increase in concentration of calcium chloride. The sugar response was inhibited by 50 per cent in the presence of 0.1-0.2 M calcium chloride. This experiment showed that under these conditions calcium chloride is more than ten times as effective in inhibiting the frequency of the sugar impulses than the effect of sodium chloride.
6.4.5. Theoretical considerations on sugar receptor stimulation in Ss II and Ep sugar receptors
The theoretical existence of receptor sites was originally developed by BEIDLER (1954) for vertebrate taste receptors. The response magnitude of these receptors at steady state level was a function of the stimulus concentration applied, and the response remained constant over a long period of stimulation (BEIDLER, 1953). In vertebrate as well as invertebrate receptors enzymes are not involved in the initial reaction of the stimulus with the receptor as is suggested by the absence of effect of enzyme poisons and the temperature independency
Meded. Landbouwhogeschool Wageningen 72-11 (1972) 119
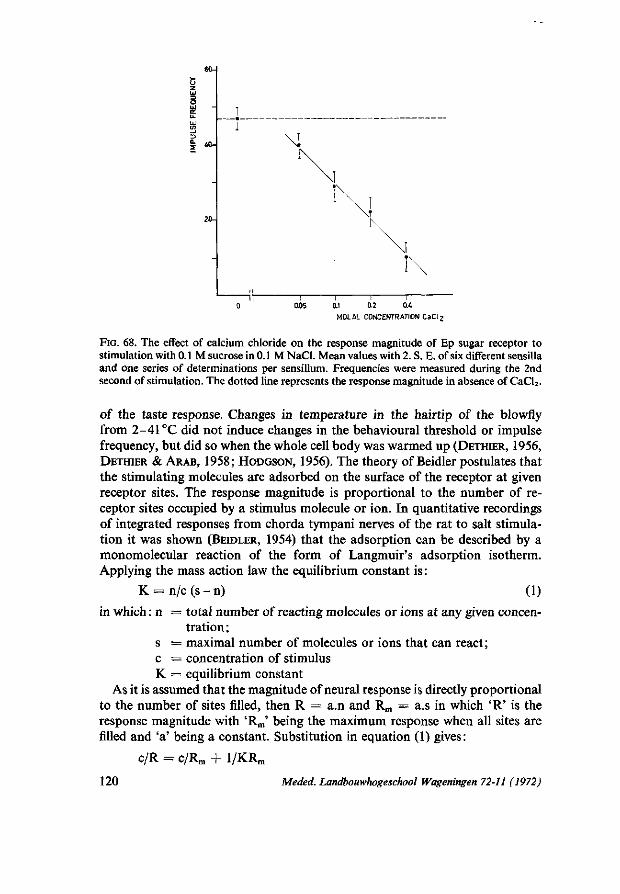
— I 1 1 0.1 0.2 0Â
MOLAL CONCENTRATION C a C l 2
FIG. 68. The effect of calcium chloride on the response magnitude of Ep sugar receptor to stimulation with 0.1 M sucrose in 0.1 M NaCl. Mean values with 2. S. E. of six different sensilla and one series of determinations per sensillum. Frequencies were measured during the 2nd second of stimulation. The dotted line represents the response magnitude in absence of CaCl2.
of the taste response. Changes in temperature in the hairtip of the blowfly from 2-41 °C did not induce changes in the behavioural threshold or impulse frequency, but did so when the whole cell body was warmed up (DETHIER, 1956, DETHIER & ARAB, 1958; HODGSON, 1956). The theory of Beidler postulates that the stimulating molecules are adsorbed on the surface of the receptor at given receptor sites. The response magnitude is proportional to the number of receptor sites occupied by a stimulus molecule or ion. In quantitative recordings of integrated responses from chorda tympani nerves of the rat to salt stimulation it was shown (BEIDLER, 1954) that the adsorption can be described by a monomolecular reaction of the form of Langmuir's adsorption isotherm. Applying the mass action law the equilibrium constant is :
K = n / c ( s - n ) (1)
in which : n = total number of reacting molecules or ions at any given concentration;
s = maximal number of molecules or ions that can react; c = concentration of stimulus K = equilibrium constant
As it is assumed that the magnitude of neural response is directly proportional to the number of sites filled, then R = a.n and Rm = a.s in which 'R' is the response magnitude with 'Rm' being the maximum response when all sites are filled and 'a' being a constant. Substitution in equation (1) gives:
c/R = c/Rm + l/KRm
120 Meded. Landbouwhogeschool Wageningen 72-11 (1972)

This taste equation relates the magnitude of response to the stimulus concentration (thermodynamic activity). K can be calculated by plotting c/R against c. Correct description of quantitative data by this equation results in a straight line relationship. As a matter of fact this relationship is the same as the Lineweaver-Burk plot of the Michaelis-Menten equation which describes kinetics of enzyme reactions. The value of K depends only on the strength of binding of the stimulus substance to the receptor site. Studies on the relation of the integrated response recorded from chorda tympani nerve of the hamster in response to various concentrations of sucrose or salts showed this taste equation equally well applicable to both the responses of the salt receptor as well as the sugar receptor (BEIDLER, FISHMAN and HARDIMAN, 1955). The equation was found also to hold for the responses of the labellar salt receptor of the blowfly (EVANS & MELLON, 1962, but see DEN OTTER, 1971) as well as for the sugar receptor of the fleshfly Boettcherisca peregrina (MORITA, HIDAKA
and SHIRAISHI, 1966).
In our studies on the sugar receptors in the Ss II and Ep of the cabbageworm tip recording was employed rather than side-wall recording. The latter has the advantage of making recording independent of the use of salt as an electrolyte bridge between receptor and electrode. In our case 0.1 M NaCl was usually used as a conducting solution. In the second place the total number of impulses generated in the first second of counting which started at 0.2 second after the beginning of stimulation was taken as the parameter of response. This short period provided a situation which was closest to the stationary phase of the sensory adaptation curve. In the taste equation a steady state is assumed in the adsorbtion. The steady state corresponds to the steady state of the rate of an enzyme reaction in the process of formation of the enzyme-substrate complex. In Fig. 69 and 70 it is shown that only the plot from the response of the Ss II or Ep to sucrose showed the linear relation, but that the response to glucose did not conform to BEIDLER'S taste equation. MORITA and SHIRAISHI (1968) studying the responses of the labellar sugar receptor of the fleshfly recently proposed a 2:1 complex model for monosaccharides. The formation of a 2:1 complex is considered as a two step reaction:
A + S ^ AS A + AS ^ A2S
A, S, AS and A2S representing a molecule of stimulus substance, the receptor site and the 1:1 and 2:1 complexes respectively. The taste equations derived for these complex models are mentioned in Fig. 71 and 72.
The theoretical curves calculated from these models fit the experimental values to a certain extent, and do so for sucrose as well as glucose (Figs. 71,72).
Meded. Landbouwhogeschool Wageningen 72-11 (1972) 121

o | a 20
0.05 0.1 0.15 0.2 MOLAR CONCENTRATION (c)
FIG. 69. Lineweaver-Burk plot of stimulations by sucrose. Open circles represent responses of Ep. Closed circles represent the responses of Ss II. R = impulses / second ; c = concentration in moles / litre. See text.
In investigations on behavioural responses of blowflies Phormia regina to a wide variety of carbohydrates which were presented individually or in combination DETHIER et al. (1956) found that the stimulating effects of the sugars are not strictly additive but both synergism and inhibition occurred. EVANS (1962) then proposed the idea that the membrane of the sugar receptor possesses two different receptor sites, i.e. one glucose-combining site and a fructose-combining one. Sucrose would then predominantly act at the 'fructose-site' (EVANS, 1961). This idea seems to be supported by electrophysiological data as well (OMAND
and DETHIER, 1969). However, it is clear that this idea does not hold for the Ss II or Ep sugar receptor of the cabbageworm. In these receptors there is no differentiation in a glucose and fructose receptor site, but rather there is only one receptor site possibly with two subunits, each main site being occupied by one molecule of sucrose or two molecules of glucose.
It has been observed in sugar receptors of unrelated insect species that salts can have a certain influence on the receptor activities (ISHIKAWA, 1963; HODGSON, 1957; WOLBARSHT, 1958; MORITA and TAKEDA, 1959). MORITA et al. (1966) studying the responses of the sugar receptor in the labellar hairs of the fleshfly, B. peregrina, suggested that these effects are caused by the influence of the cations on the membrane current of the excited receptor membrane. According to MORITA and YAMASHITA (1959), and REES and HORI (1968) cal-
122 Meded. Landbouwhogeschool Wageningen 72-11 (1972)

600-
o o o Ë 500-X
cc CS""
400-
300-
200-
100 -
^s'
• " ' '
//'''
//'
^"
,-' ,-'""'
/'-' „ , ' ' "
''
,,-*'•
0.2 MOLAR CONCENTRATION (c) GLUCOSE
FIG. 70. Lineweaver-Burk plot of responses of Ss II to glucose. Note the deviation of the plots from the relation established for sucrose (dotted line). R, impulses / sec; c, molar concentration. See also Fig. 69.
I £ -K ui
(/> z o Q.
13 ÜC US
> 1-3 g °-5
0
.
•
Lfcr:—
—1 1 1 1—i—i i - n 1 1 1 1—i—i i 1-1 r 1 1 1 — i — i l l "
----' ,*•"" ,•"
•' o ^'O
o ,**
/> o y /
/ ' o y
s'
—1 1 1 1 1 • • • ' 1 1 1 Œ-l ' • I ' 1 1 1 1 1 t—1. I
MOLAR CONC. SUCROSE
FIG. 71. Responses of sugar receptor in Ss II relative to the maximum vs. sucrose concentration. Open circles represent experimental values. Dotted line represents the theoretical curve calculated from the equation r/r„, = 1/(1 + K^C) where rm = maximum response; Ki = equilibrium constant of 1:1 complex between sucrose molecule and receptor site; C = molar concentration of sucrose.
Meded. Landbouwhogeschool Wageningen 72-11 (1972) 123

o . '
001 0.03 0.1 1.0
MOLAR CONCGLUCOSE (e)
FIG. 72. Responses of sugar receptor in Ss II relative to the maximum vs. glucose concentration. Open circles represent the experimental values Dotted line represents the theoretical curve calculated from the equation r/rm = 1/(1 + Ki/C + Ki2 / C2) according to the 2:1 complex model.
cium chloride and quinine hydrochloride hyperpolarize the dendritic membrane of salt as well as sugar cells and thus inhibit the generation of action potentials. In the sugar receptors in Ss I, Ss II and Ep, however, we have found that neither strychnine nitrate nor quinine hydrochloride could inhibit the frequency of the sugar impulses. No hyperpolarizing effect could thus be assumed.
6.4.6. Responses of Ep to stimulation by specific feeding inhibitors It has been pointed out (see section 6.3.5.) that the Ss I contains a receptor
cell specifically sensitive to a variety of feeding inhibitors. The function of this particular receptor is to provide the CNS with 'negative' information with respect to feeding activity. This is concluded from correlations between various electrophysiological and behavioural parameters which will be discussed further in Chapter 7. On the other hand our behaviour studies with maxillectomized larvae indicated that these larvae are still able to detect these feeding inhibitors. This suggested that information from the maxillary sensilla is not the only barrier which might block the larval food intake. Therefore the epipharyngeal papilla-like organs were examined for their sensitivity for these inhibitors by electrophysiological methods. The results suggested that a second sensory barrier is situated in the oral cavity of the larva.
Presentation of various concentrations of strychnine nitrate or ecdysterone dissolved in 0.05 or 0.1 M NaCl to the Ep evoked trains of consistent large action potentials the frequency of which depends on the stimulus concentration used. Records of these responses are shown in Fig. 73. The sensitivity of the Ep deterrent sensitive receptor was compared with the Ss I analogous receptor cell.
124 Meded. Landbouwhogeschool Wageningen 72-11 (1972)

! I ! S ! m*<MMt»ymi+fi
FIG. 73. Oscillographs of the responses of Ep during stimulation with (1) 10"5 M SN03; (2) 0.1 M sucrose; (3) a mixture of 10"5 M SN03 and 0.1 M sucrose. Calibration mark indicates 0.1 sec. Note the small SN03-spikes (arrow) among the sugar spikes in record (3).
It appeared that in qualitative (sensitivity spectra) as well as quantitative (stimulus-response relations) respects the receptors in both types of sensilla were not essentially different. As in the Ss I receptor the Ep receptor activity reached maximum values at a concentration of approximately 10"4 M ecdysterone and had a liminal threshold of response at about 2 x 10"6 M of the same stimulus. As in the Ss I receptor the receptor in the Ep was found to be ten times more sensitive to strychnine as to ecdysterone. In both receptors the responsivenes is suppressed by calcium chloride (Fig. 74). In contrast to the comparison of the Ss II and Ep sugar receptors the maximum impulse frequency possible in the deterrent sensitive receptor in the Ss I did not differ from that reached in the Ep receptor. A maximum value of approximately 65 impulses during the first second of counting was determined from a number of six different Ep. This difference between the sugar receptors and deterrent sensitive receptors is noteworthy since it might be expected that it would be the ratio of the coded information entering the CNS which will ultimately determine the food acceptance behaviour.
6.4.7. Additional remarks on the Ep innervation Presentation of a variety of mustard oil glucosides failed to evoke any
electrical activity in the Ep. Obviously there are no chemoreceptors present sensitive to this class of compounds. In this respect the Ep shows a fundamental difference with the maxillary sensilla styloconica. The anatomical studies had shown that the Ep is innervated by three bipolar neurons (Chapter 3) which in view of the above results can be classified as a salt sensitive receptor, a sugar receptor, and a receptor sensitive to specific feeding inhibitors. This corroborates the conclusion that receptors sensitive to mustard oil glucosides are absent in this sensillum.
Meded. Landbouwhogeschool Wageningen 72-11 (1972) 125

S 16-
-90
-eo
z •a
-60 g
FIG. 74. The effect of calcium chloride on impulse amplitude (continuous line) or impulse frequency (dotted line) of the response during stimulation with strychnine nitrate. Mean values of two tests, each with a different Ss I. The vertical bars denote the ranges of the response values (measured during the 2nd second of stimulation). The concentration of SN03 was 5.10-5Min0.05MNaCl.
In section 6.4.3. we have pointed out that some response patterns obtained during stimulation whith certain stimuli can not be explained when assuming the existence of absolute cellular specificity. In the Ep we have shown that certain salts stimulate activity in two receptor cells. The Sa-impulses presumably originate in a specific salt cell. This means that the SI-impulses may possibly originate in the deterrent-sensitive cell. It can be supposed that these cells have a 'spontaneous' activity. The existence of spontaneous activity in the hairs of the blowfly Phormia regina have been demonstrated by REES (1968) and REES & HORI (1968) in the salt and water cell.
The present results show that the electrophysiological properties of the sugar receptor located in the lateral maxillary sensilla styloconica closely resemble those of the sugar receptor in the epipharyngeal chemosensory organs. Differences were only found in the maximum impulse frequency (higher in the Ss II receptor) and in the maximum impulse amplitude (larger for the Ep impulses than for the Ss II impulse). Both receptors show a high stereochemical specifi-
126 Meded. Landbouwhogeschool Wageningen 72-11 (1972)

city. The Ss I chemoreceptor cell can be considered as a completely different type of sugar receptor.
6.5. SUMMARY OF CHAPTER 6
1. Our electrophysiological investigations have primarily been focused on those primary chemoreceptor cells which were considered to be important in con
nection with the aspects of larval behaviour as described in the foregoing chapters. Response characteristics of these receptors were studied. 2. The epipharyngeal papilla-like organs were identified as contact chemo-
sensitive sensilla. The three bipolar neurons which were found to be present in each sensillum were electrophysiologically characterized as a salt cell, a sugar cell, and a cell sensitive to alkaloids and steroids. The Ep do not contain chemoreceptor cells sensitive to mustard oil glucosides. 3. Analogies in receptor activities during stimulation with different qualities
of stimuli and different strengths of one and the same stimulus quality were found between the salt sensitive cells in Ss I and Ep and also between the cells sensitive to alkaloids and steroids in Ss I and Ep. With the sugar receptors analogies were present to a certain extent between the Ss II and the Ep receptor cells. 4. The sugar receptor cell identified in the Ss I differed completely from the
Ss II or Ep receptors, among others by possessing a much broader sensitivity spectrum which included 1-fucose, sucrose, d-glucose and d-fructose, whereas the Ss II and Ep receptors were found to respond exclusively to stimulation with sucrose and glucose. None of the sensilla studied had a cell responsive to m-inositol. 5. The stereochemical basis of the stimuli determining the specificity of the
sugar receptor cells is not readily identified as is exemplified by the sensitivity spectra of different species of lepidopterous larvae. 6. Feeding inhibitory compounds were found to act on a specialized receptor
cell, present in the Ss I and the Ep. They did not influence the receptor activities of any other chemoreceptor cell. Effective stimuli for this type of receptor cell were provided by alkaloids and steroids which generally had configurations of complicated ringsystems of high molecular weight. 7. The responsiveness of the Ep and Ss II sugar receptors could be changed by
sodium chloride and calcium chloride. The action of calcium chloride, but not that of sodium chloride, was exclusively inhibitory. Over a certain range sodium chloride acted antagonistically on the action of calcium chloride. Calcium chloride also had an inhibitory influence on the receptor cell sensitive to alkaloids and steroidal compounds. 8. In both Ss I and Ep sensilla an absolute cellular specificity could not be
assumed under all conditions of stimulation. 9. The cell membrane of the sugar receptor in Ss II and Ep is likely to have one
type of receptor site with possibly two subunits each site being occupied by one molecule of sucrose or two molecules of glucose.
Meded. Landbouwhogeschool Wageningen 72-11 (1972) 127

THE R E L A T I O N BETWEEN BEHAVIOURAL AND P E R I P H E R A L N E U R A L RESPONSES
7.1. GENERAL CONSIDERATIONS
Arthropod chemoreceptive sensilla present an unique opportunity for the study of causal relations between electrophysiological events in the chemo-receptory cells and objectively measurable components in feeding behaviour. The receptors are associated with specialized forms of the exoskeleton which are relatively easily recognizable though not always as easily accessible. The sensilla are often sufficiently separated to enable individual analysis of the relevant sensory cells. The receptors are bipolar primary neurons from which electrical activities can be monitored directly by techniques developed by HODGSON et al. (1955) and MORITA and YAMASHITA (1959). The peripheral neurons are thought to pass on their axonal processes to the central nervous system without synapsing or axon-fusion (STÜRCKOW et al., 1967; STEINBRECHT,
1969 ; BORG and NORRIS, 1971). Therefore the time patterns of impulses recorded from the contact chemoreceptors most likely represent the actual afferent input into the central nervous system. Whether or how this input will be modified by the CNS has to be established by way of correlation studies between electrophysiological and behavioural responses in terms of concentration-response relationships. The question of which parts of the feeding behaviour are controlled by which afferent input can be solved by additional ablation experiments. These lines of research were largely followed in the present work.
There are several problems germane to a quantification of behaviour. First, the outcome may vary according to the response parameter chosen. By this any lack of correlation between electrophysiological and behavioural data is open to various interpretations. It may mean that the sensory input is altered by the CNS but it might also mean that the behavioural parameter used was inappropriate. This makes it advisable to use more than one response parameter as we have done (section 4.3.2.). Second, behavioural responses to definite stimuli may be modified through experience or learning. In P. brassicae larvae this possibility has been demonstrated in Chapter 3. As a consequence the behavioural methods used to evaluate chemoresponses must be scrutinized carefully. With phytophagous insects in general it may be profitable to use experimental animals which have been reared on an artificial medium, preferably a meridic or holidic diet, and are thus 'detached' from the natural host plants. As will be discussed below for P. brassicae, an interaction between prior experience with stimuli from the food on which the larvae developed and the results of the chemoresponse assays seems to be insignificant when the experimental animals were reared on a meridic diet.
Third, determinants of food intake activity do of course consist of more than input from external chemoreceptors alone. For example the regulation in
128 Meded. Landbouwhogeschool Wageningen 72-11 (1972)

feeding patterns as described in section 4.3 implies the existence of a post-ingestional feed-back in the neural circuitry controlling feeding. In blowflies the negative feed-back has been identified as input from foregut and abdominal proprioceptors which are activated by stretch (Gelperin, 1971). These and other possible mechanisms modulate the effectiveness of the chemosensory input in producing behavioural responses. Changes in behavioural response parameters may equally be caused by food deprivation (section 4.3.4.). Careful control of the pre-experimental treatment of the animals used in behaviour response assays is therefore necessary.
7.2. OBSERVATIONS ON FEEDING BEHAVIOUR
In experiment XIII and XIV a decrease in the positively stimulating effect of sucrose concentrations higher than -0.5 log moles/litre was found. This decrease was established by means of either the Fp, Ts or Tl response parameter (for definitions, see 4.3.2.) and remained unaffected by prolonged starvation of the experimental animals (experiment XVII). In contrast to these parameters the response assessed with the Fi parameter was not suppressed by the same high sucrose concentrations, (experiments XIV and XVII). These findings imply that at these high sucrose concentrations the number of interruptions shows an increase relative to the duration of a feeding period. This relative increase is more pronounced when the animals have been subjected to longer starvation periods. This phenomenon may become comprehensible when it is hypothesized that the motivational state of the larvae and the degree of palatibility of the substrate can influence a transition from feeding to non-feeding (and vice versa) into opposite directions. Starvation facilitates the transition from non-feeding to feeding, but to what extent the feeding act, once started, is maintained depends on the external and internal sensory input received during feeding. This may appear from the observation that the effect of starvation is dependent on the concentration of sucrose presented (experiment XVII). A high number of interruptions per feeding period is thus regarded as the expression of a greater lability, which is promoted by a stronger facilitation into both directions. A low palatibility results in a higher Fi value. The lowest response threshold for sucrose may therefore be found with the Fi response parameter (Table 4). It also becomes understandable that the effect of starvation on the Ts is dependent on the concentration of sucrose presented (experiment XVII).
The experiments on the effect of the deterrent SN03 showed that this compound never causes an increase in Fi value (section 4.3.11). This suggests that the transition from feeding to non-feeding is facilitated by the deterrent, but that the way in which the information is integrated in the central nervous system depends on the nature of stimuli received. In this connection the results of experiments XXXVI-XXXVIII are most interesting. These experiments were carried out in a randomized complete block design and were as such suitable
Meded. Landbouwhogeschool Wageningen 72-11 (1972) 129

to statistical treatment. The effect on feeding behaviour of the addition of different concentrations of SN0 3 to different feeding substrates was determined by the Ts, Tl or Fi response parameters. The various regression lines thus established clearly tended to converge in one point, viz. a concentration of 2 - 4 x l O - 5 M SN03 . This means that on a relatively high stimulating feeding substrate the larvae show a higher taste acuity to change in SN03-concentrations than on a lower stimulating feeding substrate. Other examples of an interacting effect of chemical stimuli are discussed below.
7.3. SENSORY CONTROL MECHANISMS IN FEEDING BEHAVIOUR
Feeding involves various motoric responses which in a concerted action lead to ingestion. They can be conveniently divided into the following sequence of stereotyped behavioural components : directed (or oriented) movements to the food source, undirected movements or cessation of locomotion on arrival at or in the immediate vicinity of the food, biting or its equivalent (probing, sucking, etc.), maintenance of feeding, and its termination (satiation) (BECK,
1965; KENNEDY, 1965; DETHIER, 1966). The present work encompasses the actual food intake behaviour excluding orientation, the first behavioural component. Initiation and maintenance of feeding are distinguished as separate phenomena. For this reason BECK (1965) has introduced the term 'feeding incitant' to describe a stimulus that evokes the biting or piercing reaction, whereas stimuli tending to promote continuous feeding are termed 'feeding stimulants'. Commenting on the work of THORSTEINSON (1953) and NAYAR and THOR-
STEINSON (1963) of the feeding behaviour in the larvae of Plutella maculipennis (Plutellidae), BECK (1965) has expressed the thought that mustard oil glycosides might primarily function as feeding incitants. The following analysis of various aspects of the feeding behaviour of larvae of P. brassicae provide evidence in support of such a view.
The duration of biting sequences measured with larvae presented with 0.005 M sinigrin as a single compound was not significantly longer than the duration measured with larvae on the control medium (experiment XX). However, positive responses were found with sucrose and glucose (experiments XIV-XVI). When applying the Fp parameter (related to measurements of amounts of food ingested) a certain level of food intake with 0.005 M sinigrin is observed. This level is, however, very low when compared to the maximum Fp value achievable with sucrose (experiments XIII and XIX). Since the amount of 0.005 M is at maximally effective concentration for the sinigrin sensitive receptors located in the sensilla styloconica (SCHOONHOVEN, 1967a) it can be concluded that in contrast to sucrose and glucose sinigrin by itself is not able to induce a reasonable amount of food intake.
The results obtained when the behavioural reaction of the larvae was studied in relation to various combinations of sucrose and sinigrin (or sinalbin) suggested the presence of a positive interaction between these two compounds
130 Meded. Landbouwhogeschool Wageningen 72-11 (1972)
(experiments XIX and XX). The maximum Fp value obtained with sucrose, however, could not be significantly increased by addition of sinigrin. Synergistic effects thus only appeared at relatively low concentrations of sucrose. Although similar synergistic effects were also obtained with other compounds such as ascorbic acid, amino acids or electrolytes (experiments XXI-XXIV) it seemed feasible to distinguish between the action of mustard oil glycosides as one group and that of other compounds as another. The following arguments can be put forward: 1. In contrast to mustard oil glucosides the group of chemicals last mentioned
has never been found to induce a positive Fp value at any concentration when presented as single compounds; 2. After reaching maximal effects the responses to mustard oil glycosides re
main about constant at still higher concentrations (experiment XVIII), while for other chemical stimuli always an optimal concentration is found. At strongly supra-optimal concentrations feeding stimulation may even be reversed into an inhibition. This will be discussed further below. 3. At the peripheral level an interaction of sucrose and sinigrin is excluded since the total impulse frequency produced in the sensillum styloconicum during stimulation with a combination of sucrose and sinigrin does not differ from the sum of the impulses elicited by each compound alone (SCHOONHOVEN,
1967a). On the other hand interactions of a chemical compound on the response of the sugar receptor has at least been found with some salts (Chapter 6).
In any case these observations show that a variety of neural events may be underlying the behavioural responses, reason for which each case to be considered separately. In the following I will consider the behavioural responses to sucrose and sinigrin in relation to the chemosensory input in the larvae. In experiment XVIII the threshold value of response to sinalbin was determined at 10 - 5 M when measured in the presence of 0.004 M sucrose. The Fp value reached its maximum as early as 5.10~5 M and remained constant up to the highest concentration tested, viz. 10~2 M. However, the neural activity evoked in the medial sensilla styloconica during stimulation with sinalbin showed a distinct increase with increasing stimulus concentrations in the range from 10~4 to 10" 2 M, while in the lateral sensilla such increment in impulse frequency was reached with concentrations varying from 10 - 5 M to 10 - 2 M (SCHOONHOVEN, 1967a). Thus the behavioural responses to sinalbin is not congruent with electrophysiological data. Theoretically there are several factors to which this disagreement might be ascribed. For instance, there might be no intrinsic causal relation between the time pattern of impulses and the magnitude of feeding responses, but it might also be that the experimental design of including diet-reared larvae as experimental animals was incorrect. Other possibilities have been mentioned above (7.1.). However, in view of the fundamental importance of sucrose or glucose in inducing food intake responses it can be expected that more significant information concerning the relation between behaviour and sensory input will be obtained by studying
Meded. Landbouwhogeschool Wageningen 72-11 (1972) 131

£ 1 0 -
"1 I I 1 1 — 2 4 6 8 10
relative receptor activity (sec~1)
FIG. 75. Mean Ts values relative to the maximum vs. mean relative receptor activity in Ss II in stimulations with sucrose (closed circles) and glucose (open circles). Note the deviation of the plots from the regression y = x.
the effect of these compounds. The failure of the larvae to respond behaviourally to sugars other than sucrose and glucose is not in accordance with the sensitivity spectrum of the Ss I sugar receptors, but corresponds well with that of the Ss II (or Ep) sugar receptors. In Fig. 75 the mean relative Ts values for sucrose and glucose have been plotted against the mean relative response intensity of the Ss II sugar receptors over the traject from -3.0 to -0.5 log mol concentration. The reference response (to which the value 100 was given) was Ts = 162 sec. For the receptor activity the reference was 116 imp. sec-1. Both values were attained with -0.5 log mol sucrose. The figure shows that the points are not well in agreement with the line passing through the origin of the coordinates and making an angle of 45°. This is especially true over the range where receptor activity is less than half of the maximum activity. With regard to the good correlation between the results obtained with the Ts and Fp parameter (e.g. experiments XII-XIV) a similar result is to be expected when the relative receptor activity is plotted against the relative Fp response parameter. However,
i | i ' ' i 0.5 1.0
RELATIVE FEEDING RESPONSE
FIG. 76. Mean Fp values relative to the maximum vs. mean relative receptor activity in Ss II (closed circles) or Ep (open circles) in stimulations with sucrose. Note deviations of the plots from the regression y = x.
132 Meded. Landbouwhogeschool Wageningen 72-11 (1972)

other sugar receptors have to be taken into account also. The third type of sugar receptors was identified in the buccal cavity (Chapters 5 and 6). In Fig. 76 the mean relative Fp values have been plotted against the mean relative activity of the Fp receptors in case sucrose was used as a stimulus. The deviation of the plots from the 45° line is even greater than in Fig. 78. It should, however, be realized that such a comparison is somewhat unrealistic since the maxillary receptors might possibly interfere. When the same electrophysiological data of the Ep receptors were plotted against the behavioural (Fp) responses of maxillectomized larvae a very good agreement was found (Fig. 77). This result will be discussed in the light of some other data.
Applying the Fp response parameter it was established that maxillectomized larvae showed a low level of food intake on the control medium (no chemical added), while unoperated larvae never took any amount of food on the same medium. It may be asked whether this difference between unoperated and maxillectomized larvae is a consequence of a behaviour adaptation of the maxillectomized larvae to a modified input pattern necessitated by the mouth part ablation. An alternative hypothesis is that the feeding activity is due to the removal of some source of spontaneous inhibitory influence upon maxil-lectomy. During exploratory behaviour prior to feeding the ventral side of the head sways closely above the substrate in such a way that the tips of the outstretched palpi are touching the substrate. After maxillectomy or palpectomy this posture remains unaltered for a period during which the ventral side of the head no longer makes contact with the substrate during exploratory behaviour. A similar phenomenon has been observed in palpectomized hoppers of Locusta migratoria (SINOIR, 1968). This characteristic posture changes in order to allow a take-over by the mandibular and peribuccal hairs. Maxillectomized larvae eventually adapt and will perform persistent biting activity upon tactile stimulation only. These bitings are really indiscriminate as may be deduced from the increased incidence of cannibalism in food-deprived maxillectomized larvae at high densities. That the presence of food prevented the incidence of canni-
FIG. 77. Mean Fp values relative to the maximum established for maxillectomized larvae vs. mean relative receptor activity in Ep in stimulations with sucrose.
Meded. Landbouwhogeschool Wageningen 72-11 (1972)
RELATIVE FEEDING RESPONSE
133

balism can be ascribed to the diminished locomotory activity which reduces the chance of causing fatal injuries. Increased biting responses to odorless and tasteless substrates such as glass or filter paper were also observed in larvae of the Colorado beetle after amputation of antennae and maxillary and labial palpi (CHIN, 1950). The concept that this increased biting activity is related to a behavioural adaptation to a modified input pattern is likely to be an oversimplification. In experiments XXIX and XXX it was found that an augmented responsiveness to low levels of sucrose could be induced by maxillectomy and palpectomy but that galeaectomy was ineffective. This result indicated that the palpi exert a spontaneous inhibitory influence on biting activity (and thereby on feeding) whenever the substrate does not provide an optimal stimulating situation. In studies with larvae of Manduca sexta, WALDBAUER and FRAENKEL
(1961) also suggested that the maxillae might be a source of spontaneous inhibitory influence of feeding. In inactivation experiments with the silkworm Bombyx mori an inhibitory effect of the palpi was recently suggested (ISHIKAWA,
HIRAO and ARAI, 1969). In accordance with these authors it is here suggested that in the larvae of P. brassicae a spontaneous inhibitory effect on biting activity is exerted by the maxillary palpi but not by the galeae. The inhibitory activity might possibly be related to the spontaneous electrical activity which can be recorded when inserting metal electrodes in the region of the cell bodies of the small sensilla basiconica on the third segment of the palpi (SCHOONHOVEN
and DETHIER, 1966).
Although maxillectomy induces indiscriminate biting, food intake remains limited and still depends on the amounts of sucrose or glucose (experiments XXVII and XXVIII). Biting and ingestional (swallowing) actions are thus distinguished as two components of feeding. The question now arises to whether this dichotomy in feeding behaviour has a morphological basis. A difference in behaviour patterns on the basis of a difference in sensory innervation of spatially separated mouth parts seems an adequate hypothesis. In this connection it is not difficult to recognize the maxillae and the preoral region of the mouth cavity as the relevant mouth parts. Actual ingestion then can be thought to be exclusively dependent of the stimulation of receptors located in the buccal cavity whereas the biting responses are triggered by sensory stimulation of the maxillae.
The following arguments can be advanced to substantiate this hypothesis : 1. In the electrophysiological analyses of the chemoreceptors identified in the
buccal cavity (Chapter 5) chemoreceptors sensitive to mustard oil glucosides were found to be absent. Sugar receptors, on the contrary, were present (Chapter 6); 2. In histological investigations it was ascertained that no sensilla other than
those studied electrophysiologically were located in the buccal cavity; 3. The axonal processes from the maxillary sensilla are connected with the
sub-oesophageal ganglion, formed by fusion of the mandibular, maxillary and labial ganglia. The suboesophageal ganglion contains the motor centres for these particular mouth parts. It is interesting to note that it also influences the locomotory activity of the insect. The afferent impulses from the epipharyngeal
134 Meded. Landbouwhogeschool Wageningen 72-11 (1972)

sensilla, however, are propagated to the anterior stomatogastric nerve system consisting of the frontal ganglion, hypocerebral ganglion and gastric nerves. In Dytiscus swallowing is abolished by removal of the frontal ganglion but not by destruction of the brain or suboesophageal ganglia (MARCHAL, 1910, quoted by WIGGLESWORTH, 1965). It is generally accepted that the motor and sensory (stretch receptors) neurones of the stomatogastric system control the movements of the gut. The sensory neurones of the pharynx may well be considered as a part of this system.
It can how be attempted to analyse the differences in larval behaviour to sucrose and sinigrin in respect to the above theory. In experiment XXX it was demonstrated that maxillectomized larvae have lost their responsiveness to sinigrin. This is in agreement with the absence of sinigrin sensitive receptors in the buccal cavity. These facts would imply that sinigrin is unable to trigger the swallowing movements. Any positive interaction observed between sucrose and sinigrin thus is exclusively ascribed to the function of sinigrin as 'feeding incitant'. Sucrose, however, is a feeding stimulant for maxillectomized larvae (section 4.3.9.). As has been shown above a striking good correlation is found between the behavioural response curve to sucrose and glucose and the electrophysiological response curves established for the Ep receptors. In view of the dichotomy in behavioural reaction as discussed above the positive interaction between sucrose and sinigrin becomes understandable. The increased biting activity induced by sinigrin will lead to an higher responsiveness of the larvae to low concentrations of sucrose. The spontaneousinhTbitoryihfluence exerted by the palpi on biting activity would thus be neutralized by the effect of sinigrin, eliminating the barrier preventing low sucrose concentrations to come into contact with the Ep receptors. This is illustrated by a good correlation between behavioural responses to sucrose with sinigrin added and the responses of the Ep receptors (Fig. 78). In this respect the addition of sinigrin has the same effect as maxillectomy.
Another fundamental difference in the action of sucrose and sinigrin e-merges from the fact that the maxillary sensilla styloconica contain both
Fig. 78. Mean Fp values relative to the maximum vs. mean relative receptor activity in Ep (open cricles) or Ss II (closed circles) in stimulations with mixtures of 0.005 M sinigrin and varying concentrations of sucrose.
CD 1.0-
p 0 . 5 -
- | 1 r—i 1 1-0.5 1.0
RELATIVE FEEDING RESPONSE
Meded. Landbouwhogeschool Wageningen 72-11 (1972) 135

sugar receptors as well as sinigrin sensitive receptors. In experiment XXX it was made clear that the palpi are not sensitive to stimulation with sinigrin. The existence of the spontaneous inhibitory influence in absence of sinigrin proves that in unoperated larvae only sinigrin but not sucrose acts as feeding incitant. This particular property of sinigrin (and other mustard oil glycosides) also appears from its extra-ordinary low concentration at which it is maximally effective (experiment XVIII; see also DAVID and GARDINER, 1966b). In fact, the results of experiment XVIII suggest that the triggering of biting responses is an all-or-none response type showing no relation with the graded level of activation of the relevant receptor. The swallowing responses clearly have a graded intensity related to the activity level of the Ep receptors.
The relationship between larval behavioural responses and electrophysiological data will now be discussed further in view of the results obtained with some other types of stimuli.
7.4. MECHANISMS IN INHIBITION OF FEEDING RESPONSES
Chemosensory input may lead to inhibition of food intake via different pathways. On basis of behavioural and electrophysiological experiments with P. brassicae larvae two principal mechanisms are recognized. Firstly, inhibition may occur as a consequence of supra-optimal stimulus intensities. Secondly, food intake can be inhibited by activation of a distinct type of receptor mediating rejection. The first type of inhibition is not easy to comprehend in terms of sensory input in view of the several mechanisms possible. Two such mechanisms may be mentioned here: a) some receptors are able to mediate both acceptance and rejection depending
on the level at which they are activated. DETHIER (1968) has demonstrated such a mechanism by simultaneous recording behavioural responses and impulse frequencies from single chemoreceptors in labellar hairs of intact blowflies. Only a very small difference in firing frequency of one and the same salt receptor resulted in either acceptance or rejection of the stimulating salt solution. A neurological mechanism was suggested in which two neurons of different thresholds are connected to the axon of the salt receptor, one mediating acceptance and the other rejection. b) a negative interaction at the peripheral level may result in feeding inhibition.
As has been pointed out above food intake rates are primarily governed by the degree of activation of the epipharyngeal sugar receptors. As a consequence any depression of this activity by some secondary effect will result in a concomitant reduction in feeding response intensity. It may be envisaged that among the many 'secondary' plant substances certain may be supposed to be able to act as specific inhibitors of distinct receptor cells. ISHIKAWA, HIRAO
and ARAI (1969) reported that the activity of the sugar receptor in the lateral taste hair of the maxillae of Bombyx mori was strongly suppressed by an unidentified constituent in the acqueous extract from leaves of Artemisia vulgaris,
136 Meded. Landbouwhogeschool Wageningen 72-11 (1972)

while responses of other receptors in the maxillae were not influenced. A similar phenomenon has been described in vertebrate chemoreception. It has been found in dogs (ANDERSON, LANGREN, OLSON and ZOTTERMAN, 1950), hamsters (HAGSTROM, 1957) and man (WARREN and PFAFFMAN, 1959; DIAMANT,
OAKLEY, STROM, WELLS and ZOTTERMAN, 1965), that extracts of Gymnema sylvestre suppress the chorda tympani responses to sucrose, the active compound being gymnemic acid. In invertebrates, however, this compound does not have a blocking effect on sugar receptors as has been found in the crayfish and the fleshfly (LARIMEIR and OAKLEY, 1968), nor does it have an effect on sugar receptors or 'deterrent sensitive' receptors in the larvae of P. brassicae (Ma, unpubl. res.). In any case, the importance of the principle can be demonstrated by manipulation of the sensitivity of the sugar receptors by means of certain salts and comparing the electrophysiological effect with changes in behavioural responses. In electrophysiological experiments on sugar receptors in maxillae and epipharyngeal organs it was found that sodium and calcium chloride had a characteristic effect on the responsiveness of these receptors (sections 6.4.3., and 6.4.4.). Behaviourally the effect of these salts were examined in experiment XXV. For comparison the mean Ts and Tl response values have been plotted against the mean activity of the Ep sugar receptors (Fig. 79). The relationships are linear, they do not pass through the origin since in the absence of any
FIG. 79. The effect of calcium chloride in the regression of behavioural responses of the larvae on the activity of the Ep sugar receptors. Closed circles represent the values for the Ts parameter. The open circles represent the response values for the Tl parameter. See text.
Meded. Landbouwhogeschool Wageningen 72-11 (1972)
RECEPTOR ACTIVITY ( imp.sec" ' )
137

chemical Stimulation the Ts and Tl parameters still reach a certain value. Before drawing any conclusions the following experimental results have to be considered. First, calcium chloride has the same effect on the responsiveness of the Ep and Ss II sugar receptors (Chapter 6). Second, from the discussion in section 7.2. it can be deduced that the activity of the Ss I sugar receptors is inconsequential in influencing feeding responses. Third, the impulses recorded in Ep and Ss I during stimulation with calcium chloride were elicited only at concentrations outside the range considered here. A low frequency of about 5 impulses per second of stimulation were elicited in Ep and Ss I at concentrations of 0.5 M or more (Chapter 6). In view of these points the relationships suggested in Fig. 72 lead to the conclusion that in the presence of calcium chloride the activity of the animal's sugar receptors is diminished resulting in a consequent suppression of feeding response intensity to sucrose. This conclusion presents corroborating evidence for the hypothesis that larval ingestional responses are directly proportional to the level of activity of the Ep sugar receptors. The effect of sodium chloride on behavioural responses to sucrose is more difficult to analyse in terms of neural activities of sugar cells alone since also salt sensitive receptors are involved. In Fig. 80 this effect of sodium chloride appears from the intercepts of the regression lines with the abscissa. This is explained to be a consequence of the inhibitory effect of the activity of the salt cells evoked by relatively high concentrations of sodium chloride.
i 120-
80
20
FIG. 80. The effect of sodium chloride in the regression of behavioural responses on the activity of the Ep sugar receptors. Closed circles represent the response values for the Ts parameter.
40 The open circles represent the response RECEPTOR ACTIVITY (imp. sec "' ) values for the T l parameter. See text.
138 Meded. Landbouwhogeschool Wageningen 72-11 (1972)

The second type of feeding inhibition by chemosensory input is by activation of specialized receptors which exclusively mediate the presence of unacceptable compounds. The question whether larvae of P. brassicae possess such receptors can be answered by way of correlation studies between electrophysiological and behavioural data. In the behavioural experiments (section 4.3.11) it was found that a distinct group of chemicals, viz. alkaloids and steroids, were able to counteract or completely inhibit positive responses. However, from this observation alone it is not allowed to conclude that the larvae are really able to taste these compounds because of the alternative possibility that these chemicals might suppress the activity of the receptors mediating acceptance. This problem was solved by electrophysiological investigations. In such experiments it was found that the same chemicals which inhibited feeding proved to be effective stimuli for one distinct type of chemoreceptor identified in the Ss I and Ep (Chapter 6). Compounds which could not elicit electrical responses in this receptor type were also unable to inhibit feeding. Moreover, I could not find any indication which could suggest that the inhibitors or deterrents could in some way or other affect the responsiveness of those receptors which mediate the presence of phagostimulants. In short, it may be concluded that the larvae of P. brassicae possess a chemoreceptor of which the sole function is to mediate detect feeding deterrents. With this knowledge it becomes possible to analyse in which way the intensity of neural response of these receptors is related to the degree of inhibition in the larva. The ultimate level of food uptake will of course depend on the stimulating value of the substrate as well. This issue has already been discussed in section 7.2. and need not be pursued here again. It should, however, be noted that at the concentration of SN0 3 which inhibits positive responses on all feeding substrates (2 - 4 x 10 - 5 M) the chemore-ceptors involved begin to become saturated. In this respect the biological significance of the integrating mechanism in the central nervous system discussed in 7.2. may be apparent. It must be pointed out that it is possible to speak of 'the chemoreceptors' since it was found that the Ss I and the Ep receptors sensitive to stimulation by deterrent compounds all possess identical electrophysiological properties. The behavioural experiments further showed that the lowest concentration at which the response to SN0 3 is significant (in two sided tests) was 2.10 - 6 M. Electrophysiologically it was established that the treshold of response of the SN03-sensitive receptor was at approximately 10"6 M. Thus the range of greatest concentration dependence of behavioural response intensity is closely correlated with the range of the greatest concentration dependence of the particular chemoreceptor type. This observation clearly demonstrates the functional significance of the receptor type in larval food acceptance behaviour.
7.5. FINAL REMARKS
A proportionality of impulse frequencies in relevant chemoreceptor cells
Meded. Landbouwhogeschool Wageningen 72-11 (1972) 139

Fp (mg)
-180
FIG. 81. Comparison of the behavioural response to varying concentrations of sucrose (continuous line) or glucose (dotted line) as assessed by the parameters Fp (open circles) or Ts (closed circles).
-2D
-3.0 -2.0 -1.0 0
LOS MOL CONCENTRATION
to larval chemoresponses could be demonstrated for two types of chemical stimuli, viz. sugar (sucrose, glucose) and deterrents (alkaloids, steroids). This result would not have been obtained when larvae reared on the natural food plant had been used as experimental animals because of their strong bias due to conditioning. Since the electrophysiological data give an absolute information on chemosensory input the application of the experimental design and response parameters as described in the present study seems to be profitable and useful. In this connection it might be stated that the Ts and Fp response parameters produce largely identical results. This is illustrated in Fig. 81 where the behavioural response of the larvae to sucrose and glucose has been plotted for both parameters. A very good correspondence between each pair of response curves is shown. Evidence has been collected indicating that the triggering and inhibition of swallowing or ingestional responses are controlled by the chemosensory information received by the epipharyngeal receptor cells. Since the buccal cavity do not contain receptors other than those sensitive to sugar, salts and deterrents the corollary is that very subtle discriminative ability of maxillectomized larvae, as revealed in preference tests between various host plants, is achieved by input from these three receptor cell types only. Arguments
140 Meded. Landbouwhogeschool Wageningen 72-11 (1972)

type of stimulus
sense organs
relay centres
ARREST LOCOMOTION
PERSISTENTBITING
INHIBITION OF
PERSISTENTBITING
INHIBITION OF
INGESTION
FIG. 82. Schematic and simplified diagram of the relation between chemo- and mechanosen-sory input and some main components of feeding behaviour. C, chemical stimuli ; Ep, epipharyngeal sensilla; FG, frontal ganglion; L, learning mechanism; M, tactile stimuli; Md, mandibular sensilla; Mp, maxillary palpi; P, proprioceptive sensilla; SAT, postingestional satiety signals; SOG, suboesophageal ganglion; Ss, maxillary sensilla styloconica; T, me-chanosensory sensilla.
have been advanced that the chemoreceptors in the maxillae only trigger biting responses (persistent biting) but no ingestional responses. Persistent biting brings the larva into a stimulus situation which may trigger ingestional responses. Schematically the various factors involved in food acceptance behaviour have been summarized in Fig. 82 .Mustard oil glycosides are the only effective biting stimuli. The functional significance of the other receptors in the maxillae is rather questionable. The deterrent sensitive receptors in maxillae and epipharynx are redundant, in so far that the maxillary ones can be missed without affecting the larval responsiveness to deterrents. The positive interaction in feeding response to sucrose and some other chemicals (salts, amino acids, etc.) is still difficult to explain. The sugar receptor identified in the medial sensillum styloconicum is completely inconsequential in influencing biting responses. There is no evidence that the maxillary palpi are playing a significant rôle in contact chemoresponses of the larvae.
Meded. Landbouwhogeschool Wageningen 72-11 (1972) 141

8. S U M M A R Y
The present study of contact chemoreception in Pieris brassicae L. is divided into three major parts, viz. 1. behavioural analyses, 2. the identification and description of sense organs and 3. investigations concerning the sensory physiology. In a separate section some of the results were put into a coherent discussion.
In the behavioural studies the food selection behaviour was investigated as well as the behavioural responses to single or combined chemical stimuli (Chapter 3 and 4). It was found that the preference order for certain food plants can be strongly influenced by previous experience. Herein the time of experience, the species of food plant concerned and the choice-situation itself are playing an important rôle. The various experiments indicated that modifications in preferences were related to learning processes rather than to changes in the physiology of the relevant sense organs. In extirpation experiments it was found that the very subtle discriminative capacity and the possibility to induce preference modification remain unaffected by bilateral maxillectomy.
With respect to the above phenomenon the studies of the behaviour to chemical stimuli were performed with larvae reared on a meridic diet. The food intake behaviour of the larvae on this diet was used for deriving several response parameters, among which were frequency and time intervals of mouth part movement and measurement of quantities of food ingested. Only sucrose and D-glucose appeared to be able to induce an actual food ingestion. Fructose and other mono-, di- or trisaccharides were completely ineffective. From the stimulus-response relationships investigated it was deduced that sucrose is a much more effective stimulus than glucose. The relationship between stimulus intensity and behavioural response was also studied in relation to starvation of the experimental animals.
Other types of chemical stimuli, such as mustard oil glucosides, amino acids, salts and ascorbic acid are unable to induce food intake but show a positive interaction when mixed sub-optimally stimulating concentrations of sucrose. It was found that the stimulus-response relationships established for mustard oil glucosides differed in an essential way from those established for the remaining compounds. Several indications were found that the maxillary palpi exert an endogenous inhibiting effect on the onset of food intake.
The larvae demonstrated a high sensitivity to alkaloids and steroids which inhibited food intake. For these inhibitors the relationships between stimulus intensity and behavioural response were quantitatively analysed in relation to different types of feeding substrates. In ablation experiments it was found that bilateral maxillectomy or galeaectomy resulted in a loss of responsiveness to mustard oil glucosides. However, this was not the case after bilateral palpecto-my. The sensitivity to sucrose, glucose, alkaloids or steroids was not affected by bilateral maxillectomy.
142 Meded. Landbouwhogeschool Wageningen 72-11 (1972)
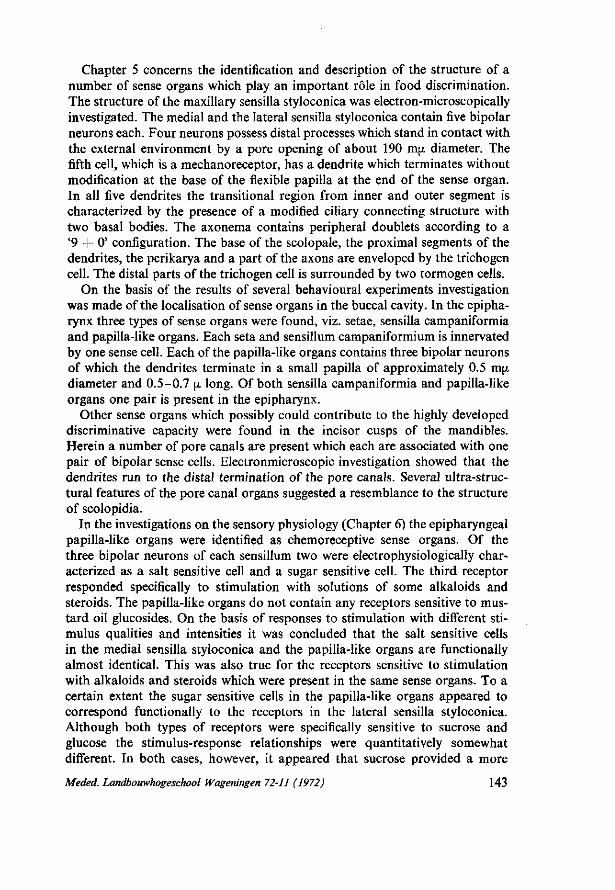
Chapter 5 concerns the identification and description of the structure of a number of sense organs which play an important rôle in food discrimination. The structure of the maxillary sensilla styloconica was electron-microscopically investigated. The medial and the lateral sensilla styloconica contain five bipolar neurons each. Four neurons possess distal processes which stand in contact with the external environment by a pore opening of about 190 m\i diameter. The fifth cell, which is a mechanoreceptor, has a dendrite which terminates without modification at the base of the flexible papilla at the end of the sense organ. In all five dendrites the transitional region from inner and outer segment is characterized by the presence of a modified ciliary connecting structure with two basal bodies. The axonema contains peripheral doublets according to a '9 + 0' configuration. The base of the scolopale, the proximal segments of the dendrites, the perikarya and a part of the axons are enveloped by the trichogen cell. The distal parts of the trichogen cell is surrounded by two tormogen cells.
On the basis of the results of several behavioural experiments investigation was made of the localisation of sense organs in the buccal cavity. In the epipha-rynx three types of sense organs were found, viz. setae, sensilla campaniformia and papilla-like organs. Each seta and sensillum campaniformium is innervated by one sense cell. Each of the papilla-like organs contains three bipolar neurons of which the dendrites terminate in a small papilla of approximately 0.5 rnjj, diameter and 0.5-0.7 \i long. Of both sensilla campaniformia and papilla-like organs one pair is present in the epipharynx.
Other sense organs which possibly could contribute to the highly developed discriminative capacity were found in the incisor cusps of the mandibles. Herein a number of pore canals are present which each are associated with one pair of bipolar sense cells. Electronmicroscopic investigation showed that the dendrites run to the distal termination of the pore canals. Several ultra-structural features of the pore canal organs suggested a resemblance to the structure of scolopidia.
In the investigations on the sensory physiology (Chapter 6) the epipharyngeal papilla-like organs were identified as chemoreceptive sense organs. Of the three bipolar neurons of each sensillum two were electrophysiologically characterized as a salt sensitive cell and a sugar sensitive cell. The third receptor responded specifically to stimulation with solutions of some alkaloids and steroids. The papilla-like organs do not contain any receptors sensitive to mustard oil glucosides. On the basis of responses to stimulation with different stimulus qualities and intensities it was concluded that the salt sensitive cells in the medial sensilla styloconica and the papilla-like organs are functionally almost identical. This was also true for the receptors sensitive to stimulation with alkaloids and steroids which were present in the same sense organs. To a certain extent the sugar sensitive cells in the papilla-like organs appeared to correspond functionally to the receptors in the lateral sensilla styloconica. Although both types of receptors were specifically sensitive to sucrose and glucose the stimulus-response relationships were quantitatively somewhat different. In both cases, however, it appeared that sucrose provided a more
Meded. Landbouwhogeschool Wageningen 72-11 (1972) 143

effective stimulus than glucose. In view of theoretical considerations it was assumed that the cell membrane of the sugar sensitive receptors in the lateral sensilla styloconica and the papilla-like organs possess one type of receptor site with two subunits. Each receptor site would be occupied by one molecule of sucrose or two molecules of glucose. In the medial sensilla styloconica a sugar receptor was identified having a broader sensitivity spectrum, which included sucrose, glucose, fucose and fructose as effective stimuli.
The presence of sodium or calcium chloride in the stimulating solution could strongly influence the responsiveness of the sugar sensitive receptors. In contrast to sodium chloride the effect of calcium chloride was exclusively inhibitory. A corresponding effect of calcium chloride was observed with regard to the responsiveness of the receptors sensitive to alkaloids and steroids.
Concerning some receptor cells in the medial sensilla styloconica and the papilla-like organs it appeared that an absolute receptor specificity could not be assumed under all conditions of stimulation.
In Chapter 7 the possible causal relations between quantitative electrophysiological events in chemoreceptor cells and various measurable behavioural responses to chemical stimuli are dealt with. Several aspects and problems related to such a study were discussed briefly. In situations in which chemical stimuli were presented individually a reasonable qualitative and quantitative correspondance was determined for distinct behavioural responses and the electrical activity of the relevant chemoreceptors. This, however, was valid only for the behavioural response to sucrose and glucose and the response characteristics of the sugar receptors in lateral sensilla styloconica and the papillalike organs. At lower concentrations a deviation from a direct proportionality between both stimulus-response relationships was found, which was ascribed to the endogenous inhibiting influence exerted by the palpi. A good correspondance was apparent when the quantitative stimulus-response relationships of maxil-lectomized larvae were compared with the electrophysiological response characteristics of the sugar receptor in the papilla-like organs. The fundamental significance of the sugar sensitive receptors in inducing food intake was, among others, also deduced from the fact that a suppression of the responsiveness of the sugar receptors by calcium chloride resulted in a proportional reduction in food intake. On the basis of the results of different experiments the hypothesis was advanced that the actual ingestion of food into the foregut is controlled by the sense organs located in the epipharynx, whereas biting responses are under control of the sense organs in the maxillae. Herein the mustard oil glucosides are belonging to stimuli which exclusively elicit biting responses.
The functional significance of the various chemoreceptors located in the maxillae can show large relative differences. Thus the sugar receptor which was electrophysiologically identified in the medial sensilla styloconica was inconsequential in influencing biting responses. Some receptors, such as the salt sensitive receptors, may evoke a stimulation as well as an inhibition of behavioural responses, depending on the stimulus intensity.
In situations in which combinations of different stimulus qualities were
144 Meded. Landbouwhogeschool Wageningen 72-11 (1972)

presented the influence of the integrating mechanisms in the central nervous system on the quantitative behavioural responses was studied. Apart from the existence of positive interactions demonstrated for certain stimulus qualities, it was found that negative interactions were apparent in behavioural responses to specific inhibiting stimuli relative to the stimulating value of the feeding substrate. This means that the larvae reacted more sharply to small differences in stimulus intensities of specific inhibitors in the presence of a highly stimulating substrate than when the substrate possessed a lower stimulating value. An electrical activity in the alkaloid sensitive receptors approaching saturation level was related to the occurrence of an absolute inhibition of food intake.
Meded. Landbouwhogeschool Wageningen 72-11 (1972) 145

9. A C K N O W L E D G E M E N T S
The author wishes to express his sincere gratitude to Prof. Dr. J. de Wilde for his interest in this study and for stimulative discussions during the preparation of this paper. Many thanks are also due to Dr. L. M. Schoonhoven for his introduction into the field of electrophysiology and valuable discussions during the course of the work.
Thanks are further due to Mr. A. Folmer in taking care of the plant material, to Messrs. W. C. Th. Middelplaats and F. J. J. von Planta for drawing the figures, to Drs. R. Allum and D. Denlinger for correcting parts of the English text and to Mrs. Ma-Sun for her help in the preparation of the manuscript.
This investigation was supported by grants from the Netherlands Organization for the Advancement of Pure Rearch (ZWO) and the National Council for Agricultural Research (TNO).
146 Meded. Landbouwhogeschool Wageningen 72-11 (1972)

10. S A M E N V A T T I N G
Het onderzoek over contact-chemoperceptie in Pieris brassicae L. is verdeeld in drie hoofddelen, te weten Ie. gedragsanalyses, 2e. identificatie en beschrijving van zintuigorganen en 3e. zintuigfysiologische onderzoekingen. In een afzonderlijk gedeelte werden enkele van de belangrijkste resultaten in onderlinge samenhang besproken.
In het gedragsonderzoek werd zowel het voedselkeuzegedrag bestudeerd als gedragsresponsies na toediening van afzonderlijk gecombineerde chemische prikkels (Hoofdstukken 3 en 4). Vastgesteld werd dat de volgorde van voorkeur voor bepaalde voedselplanten in sterke mate kan worden beïnvloed door de voorafgaande ervaring. Tijdsduur, plantesoort waarop de ervaring werd opgedaan en de keuzesituatie zelf spelen hierbij een belangrijke rol. Aanwijzingen werden gevonden dat veranderingen in voedselvoorkeur hoogstwaarschijnlijk samenhangen met leerprocessen en niet met fysiologische veranderingen in de relevante zintuigorganen. In extirpatieproeven werd gevonden dat zowel het uiterst subtiele discriminatievermogen als de mogelijkheid om veranderingen in voedselvoorkeur te induceren gehandhaafd blijven na bilaterale maxil-lectomie.
Met inachtneming van bovengenoemd verschijnsel werden de larven voor de bestudering van het gedrag op chemische prikkels op een meridisch dieet opgekweekt. Het voedselopnamegedrag van de dieren op dit dieet werd gebruikt voor het afleiden van verschillende respons-parameters, waaronder frequentie en tijdsintervallen van bepaalde bewegingen van de monddelen en meting van de hoeveelheid opgenomen voedsel. Werkelijke voedselopname bleek slechts te kunnen worden teweeggebracht door sucrose en D-glucose. Fructose en andere mono-, di- of trisacchariden waren volledig ineffectief. Uit de onderzochte prikkel-respons relaties bleek sucrose een effectievere prikkel te zijn dan glucose. De relatie tussen prikkelintensiteit en gedragsrespons werd eveneens bestudeerd met betrekking tot het effect van inanitie van de proefdieren.
Andere typen van chemische prikkels, waaronder mosterdolie glucosiden, aminozuren, zouten en ascorbinezuur, konden op zichzelf geen werkelijke voedselopname induceren, maar vertoonden een positieve interactie, indien gemengd met sub-optimaal stimulerende sucrose concentraties. Hierbij werd vastgesteld dat de prikkel-respons relatie voor mosterdolie glucosiden essentieel verschilde met die voor de overige stoffen. Voorts werden sterke aanwijzingen gevonden dat de maxillaire palpen een endogeen remmende werking uitoefenen op de aanzet tot voedselopname.
De larven vertoonden een zeer sterke gevoeligheid voor een aantal alkaloiden en Steroiden. Voor deze stoffen, die een remming van de voedselopname teweegbrengen, werden de betrekkingen tussen prikkelintensiteit en gedragsrespons kwantitatief geanalyseerd in relatie tot verschillende typen substraten.
In extirpatieproeven werd aangetoond dat er een verlies in responsiviteit voor
Meded. Landbouwhogeschool Wageningen 72-11 (1972) \A1
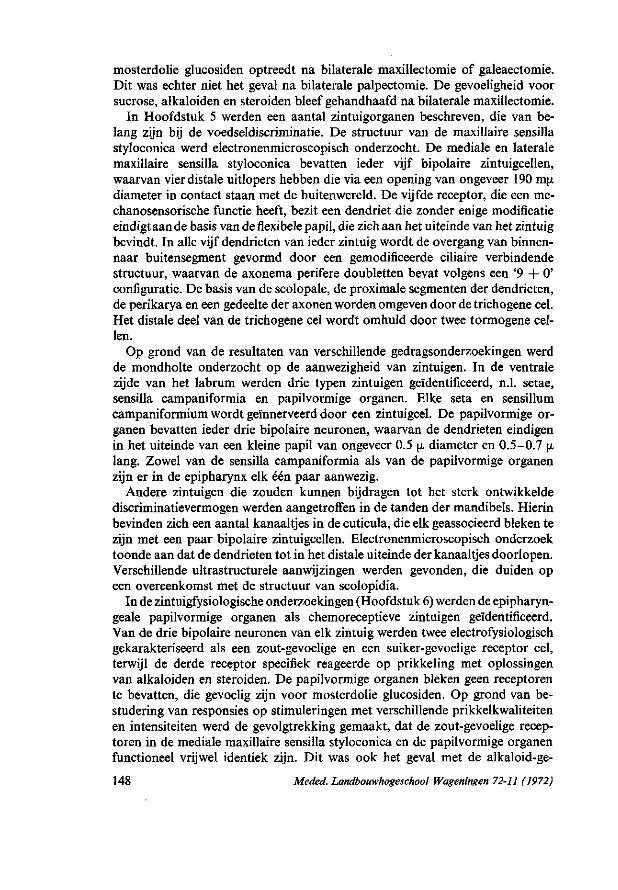
mosterdolie glucosiden optreedt na bilaterale maxillectomie of galeaectomie. Dit was echter niet het geval na bilaterale palpectomie. De gevoeligheid voor sucrose, alkaloiden en Steroiden bleef gehandhaafd na bilaterale maxillectomie.
In Hoofdstuk 5 werden een aantal zintuigorganen beschreven, die van belang zijn bij de voedseldiscriminatie. De structuur van de maxillaire sensilla styloconica werd electronenmicroscopisch onderzocht. De mediale en laterale maxillaire sensilla styloconica bevatten ieder vijf bipolaire zintuigcellen, waarvan vier distale uitlopers hebben die via een opening van ongeveer 190 mjx diameter in contact staan met de buitenwereld. De vijfde receptor, die een me-chanosensorische functie heeft, bezit een dendriet die zonder enige modificatie eindigt aan de basis van de flexibele papil, die zich aan het uiteinde van het zintuig bevindt. In alle vijf dendrieten van ieder zintuig wordt de overgang van binnen-naar buitensegment gevormd door een gemodificeerde ciliaire verbindende structuur, waarvan de axonema perifere doubletten bevat volgens een '9 + 0' configuratie. De basis van de scolopale, de proximale segmenten der dendrieten, de perikarya en een gedeelte der axonen worden omgeven door de trichogene cel. Het distale deel van de trichogene cel wordt omhuld door twee tormogene cellen.
Op grond van de resultaten van verschillende gedragsonderzoekingen werd de mondholte onderzocht op de aanwezigheid van zintuigen. In de ventrale zijde van het labrum werden drie typen zintuigen geïdentificeerd, n.l. setae, sensilla campaniformia en papilvormige organen. Elke seta en sensillum campaniformium wordt geïnnerveerd door een zintuigcel. De papilvormige organen bevatten ieder drie bipolaire neuronen, waarvan de dendrieten eindigen in het uiteinde van een kleine papil van ongeveer 0.5 \L diameter en 0.5-0.7 [i lang. Zowel van de sensilla campaniformia als van de papilvormige organen zijn er in de epipharynx elk één paar aanwezig.
Andere zintuigen die zouden kunnen bijdragen tot het sterk ontwikkelde discriminatievermogen werden aangetroffen in de tanden der mandibels. Hierin bevinden zich een aantal kanaaltjes in de cuticula, die elk geassocieerd bleken te zijn met een paar bipolaire zintuigcellen. Electronenmicroscopisch onderzoek toonde aan dat de dendrieten tot in het distale uiteinde der kanaaltjes doorlopen. Verschillende ultrastructurele aanwijzingen werden gevonden, die duiden op een overeenkomst met de structuur van scolopidia.
In de zintuigfysiologische onderzoekingen (Hoofdstuk 6) werden de epipharyngeale papilvormige organen als chemoreceptieve zintuigen geïdentificeerd. Van de drie bipolaire neuronen van elk zintuig werden twee electrofysiologisch gekarakteriseerd als een zout-gevoelige en een suiker-gevoelige receptor cel, terwijl de derde receptor specifiek reageerde op prikkeling met oplossingen van alkaloiden en Steroiden. De papilvormige organen bleken geen receptoren te bevatten, die gevoelig zijn voor mosterdolie glucosiden. Op grond van bestudering van responsies op stimuleringen met verschillende prikkelkwaliteiten en intensiteiten werd de gevolgtrekking gemaakt, dat de zout-gevoelige receptoren in de mediale maxillaire sensilla styloconica en de papilvormige organen functioneel vrijwel identiek zijn. Dit was ook het geval met de alkaloid-ge-
148 Meded. Landbouwhogeschool Wageningen 72-11 (1972)

voelige receptoren in dezelfde zintuigorganen. De suiker-gevoelige receptoren in de papilvormige organen bleken tot op zekere hoogte functioneel overeen te komen met de in de laterale sensilla styloconica voorkomende receptoren. Hoewel beide typen receptoren specifiek gevoelig waren voor sucrose en glucose bleken de stimulus-respons relaties in kwantitatief opzicht enigszins te verschillen. In beide gevallen echter vormde sucrose een effectievere prikkel dan glucose. Op theoretische gronden werd het waarschijnlijk geacht dat de celmembraan van de suiker-gevoelige receptoren in de laterale sensilla styloconica en de papilvormige organen een type receptor site bezitten met twee subunits. Elke receptor site zou daarbij bezet worden door een molecuul sucrose of twee moleculen glucose. In de mediale sensilla styloconica werd een suiker-gevoelige receptor geïdentificeerd, die een breder gevoeligheidsspectrum bezit, waartoe behalve sucrose en glucose ook fucose en fructose behoren.
De aanwezigheid van natrium- of calciumchloride in de prikkelvloeistof kon de gevoeligheid van de suiker-gevoelige receptoren belangrijk beïnvloeden. In tegenstelling tot natriumchloride had calciumchloride uitsluitend een onderdrukkend effect. Een overeenkomstig effect van calciumchloride werd waargenomen op de gevoeligheid van de alkaloid-gevoelige receptoren.
Wat betreft sommige receptoren in mediale sensilla styloconica en papilvormige organen bleek dat niet altijd van een absolute receptorspecificiteit kan worden gesproken.
In Hoofdstuk 7 tenslotte wordt ingegaan op de mogelijk causale relaties tussen kwantitatieve electrofysiologische gebeurtenissen in chemoreceptor cellen en verschillende meetbare gedragsresponsies op chemische prikkels. Diverse aspecten en problemen die aan een dergelijke studie zijn verbonden werden kort besproken. In situaties waarin responsies op afzonderlijke chemische prikkels werden bestudeerd, konden redelijke kwalitatieve en kwantitatieve overeenkomsten worden vastgesteld tussen bepaalde gedragsresponsies en de electrische activiteit van de relevante chemoreceptoren. Dit gold echter alleen voor de gedragsresponsies op sucrose en glucose en de responsiekarakteristieken van de suiker-gevoelige receptoren in laterale sensilla styloconica en papilvormige organen. Als gevolg van het bovengenoemde endogene remmende effect van de aanwezigheid van de palpen op de aanzet tot voedselopname werd echter bij lagere concentraties een afwijking in een directe relatie tussen beide prikkel-respons betrekkingen vastgesteld. Een goede overeenstemming werd gevonden, indien de kwantitatieve prikkel-respons relatie van gemaxillectomiseerde larven werd vergeleken met de elektrofysiologische responskarakteristieken van de suiker-gevoelige receptor in de papilvormige organen. De fundamentele betekenis van de suiker-gevoelige receptoren voor het plaatsvinden van voedselopname bleek verder onder meer uit het feit dat een onderdrukking van de responsiviteit van de suiker receptoren door calciumchloride resulteerde in een evenredige vermindering van de voedselopname. Aan de hand van de resultaten van verschillende experimenten werd de hypothese aannemelijk gemaakt dat de eigenlijke opname van voedsel in de voordarm onder controle staat van de zintuigen gelegen in de epipharynx, terwijl bijtresponsies worden gecontroleerd door
Meded. Landbouwhogeschool Wageningen 72-11 (1972) 149

adequate prikkeling van zintuigen in de maxillen. Hierbij behoren de mosterdolie glucosiden tot prikkels die uitsluitend bijtresponsies teweeg brengen.
De functionele betekenis tussen de verschillende chemoreceptoren die in de maxillen aanwezig zijn kunnen onderling sterk verschillen. Zo speelt de suikerreceptor die in de mediale sensilla styloconica electrofysiologisch geïdentificeerd werd geen aantoonbare rol bij het beïnvloeden van bijtresponsies. Sommige receptoren, bijvoorbeeld de zout-gevoelige receptoren, kunnen zowel een stimulering als remming van gedragsresponsies veroorzaken, afhankelijk van de prikkelintensiteit.
In situaties waarin combinaties van verschillende prikkelkwaliteiten werden gepresenteerd werd de invloed van integratiemechanismen in het centrale zenuwstelsel op de kwantitatieve gedragsresponsies bestudeerd. Behalve het bestaan van positieve interacties die tussen bepaalde prikkelkwaliteiten werden aangetoond, bleken negatieve interacties een rol te spelen bij gedragsresponsies op specifiek remmende prikkels met betrekking tot de stimulerende waarde van het voedingssubstraat. Dit houdt in dat de larven in aanwezigheid van een sterk stimulerend voedingssubstraat scherper reageerden op geringe verschillen in intensiteit van specifiek remmende prikkels, dan indien het substraat een minder sterk positief stimulerende waarde bezat. En absolute inhibitie van voedsel-opname trad op, indien activiteit der alkaloid-gevoelige receptoren tot het maximale responsieniveau naderde.
150 Meded. Landbouwhogeschool Wageningen 72-11 (1972)

h
e o -o
>
X
a
I
+ CO
H
X Q
z PL,
eu
n +•»
X
X
s 3
i - O
£ S*
c 2
S g-
o C/3
• ^ • r r i O o o o m c n m
ö ö ö ö o' Ö Ö Ö
?
X
M N r^ t*- N o m \o ""* "^ o ^ ^ ^ (si ^H - ^ ON ON t ^ CS m O O <S >-H w-i oo
^ © ö ö ö ö ö ö
r ' i ^ o ^ o o ^ ' O O v ü m a N r * i T i - , o o o m © r ^ - 0 * - i
o o ^ - i O O ^ H O r - i f n ^
ö ö ö ö ó ö ö ö ö
ON
© 0 © 0 ^ O O O N I / - I o © © Q © c « - i r ^ o o o c 5 o o o o o - ^ -ö ö ö ö ö ö ö ö
T f > o O O S ( N r - > r i O N r ^ o o ^ O O ^ c i O N ^o Tt » - ^ ó • * ' o i d
H H V O H
o o o t ^ ' N ^ m O r O ' — I
n od 6 ^o • o M* ^H Ö Ö
—H m
*o r - TJ- — l O M m ^ O M n Q
od ö ON ö vo >n es Tf —H VU + ,—i *-H v j i—i m i—( m
H 8 8 8 8 8 8 £ 3 s ö ö ö ö ö ö ö ö w
O N O O f n O N M T j - ( N
^d ö «^ ON (N* od Ö T-H
( N i n O N O N O O v r ^ ^ J - o o O N r ^ V I O N ^ O ' O ^ O O es ON t - ; o \ «n ^ fS »r» i n r i i n i*-' H w ' a ! Ö d Ö
O N O O * n l / " > O N ^ H © t ^ N 0 O O O S t ^ V O ^ O O ^ X O O N T l o o » n ' ^ f r - O N V - i ^ - r - - ' ! t f ^ OJ ^ j rt !>•" H ^ ^ ' O W >0 —i (N ^O i—i en
Ö ^ û
.2 £ o t« bû ' S
£ P « !P t-< 0) w
a a> Ë "S
• j - — uj- «5 M ft , i h L
> S? 3 g 1 - -- r n çs n S X
•g-S
e o _ „ „ E « S S * É3 Î2
2 3 i " 2 n " ^ O Ç 3 3 i i > „
" ^ O" O (H p o y s x> o
X
s £ S 3 E er
S §
r- ^
e I
3 O
VI
o' ó ö o ö ö o' ö
N Ó Ó O N O Ó Ö
m » n \ 0 ' ï t ' ^ - 0 0 " O < N c n »O <N O Tf —. O f l l~- - f
Ö Ö O O - H ' O Ö Ö Ö
\ O ^ O © v £ ï T j - T t 0 0 > O Q > a N — 1 « » 0 * - < O O O ON N h m q o O O O t ^ M M r t r i d d ' H Ö r t p i r t
ö ö ö ö ö ö ö ö
Ö f i ï i » l Ó Ó Ó Ó Ó
<3\
~ H 0 0 ^ " m ( N ~ H © > O r ~ ~ H l £ i l ^ 1 * , l ! c ' ! > £ l ' r ! t r l . VO M ~* rt (S
»n O ö
§ ö
§ ö
o o o ö
§ ö
oo
8 ö
ON
Ö
•o
Ö
O N O O O O O T f ^ n r - O N N D ^ i n ^ ^ O O O N - H O O N O ^ t * N r n p o o m' ö wï Tf ON r^ Ö Ö
» H M (S rt
^ " O i n H H n H i r i H
fS ^o »o m * — ( i — l O f ^ T f H t d o M m d d d
r j - m o N r ^ t ^ - O r n O N O N f S i—i ON <^ V» i—(i—i fO f ! h- 00 O v> <N <*"» m T—ii—tT-HOor^
C O
£?.2 2 o c a) S
» & ô c 2 c o £ 2 •- g x
• 3 o - B o C 3 3 u o ë S o g u = a ' t J " o 2 « £ S £ I l
Meded. Landbouwhogeschool Wageningen 72-11 (1972) 151

> X
e 9
I 3
>
Ï > X
+ E „g
a 'S •o TS u E f» o
o <
g w CL,
<
s £ S o1
co
S 3
>
c 2 Ë a-^ CO
S 3 3 a"
o 00
m r « - i o o ^ O O O < N r < - t v ~ i
» n o ^ H f f ^ o c N O O
ö ö ö ö ö ö ö ö
N O c n c n o o o \ > - H m © Ó N M Ó ^ H N I N
O O O O - H O O O O
88 o o o o IN O
ö
O
1*1
00 CS vd
o ö
<N
»o
§ o'
It
(N
o o Ö
f»
en
r^
O
ö
en
rn
IN
Ö
"O O <N
m o ö
ON o oo
-<
§<o oo -H i^ <n o\ ts m v^ »o r- os m m
i r i r t H v i r t ö Ö O Ö 8
^ o ö c n i r j i n r - o ó Ó N ^
vi o »o oo oo ^H r- oo O <^ O «/•>
v O N O r - 0 \ M « n T f ^ oo h \o o O n x c4 as' os* r r<S ^H r i ©
O N ^ H f « | f n o o O \ ( S h
Ö m' ^H ö »-H Ö Ö ö Ö
^ « n o o r ^ w - i c s T j - T f r - r j -m r t r t 0 0 i n ^ o \ m o o © a s « n - ^ c N m o o o o r - o o «—i os ^o »-i m i—i tn ^o «o «
a o
"35 (U 2? .2
3 co ö l ) -S co co ju io co
<t> £
«5 P »i cd
<D
vi
^ ^ s 2 3 ü
a> *-lx CÖ v
n JS o 3 x
_ cc) ^ . 2 T3 co
o .S E 3 S o
152 Meded. Landbouwhogeschool Wageningen 72-11 (1972)
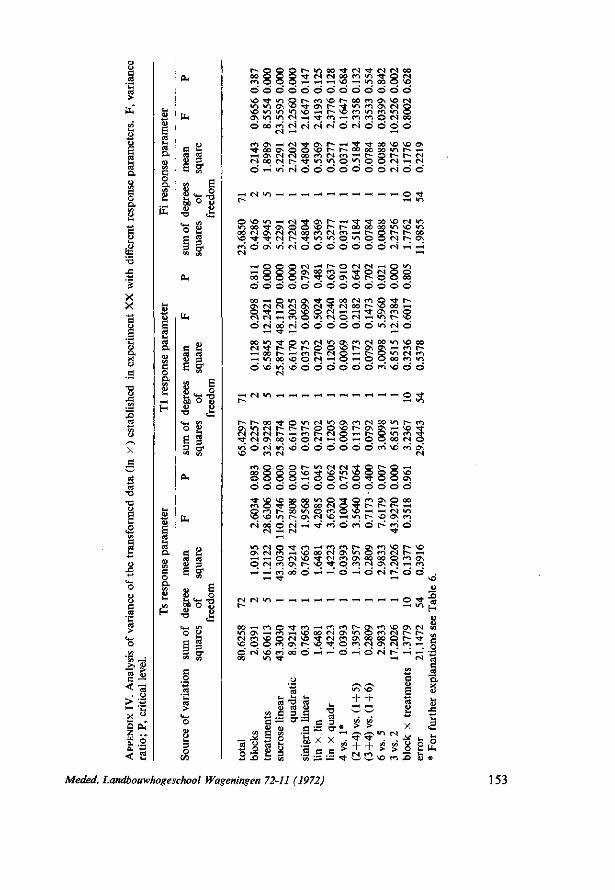
G O a
(g •3 .e ? X X
*tf c j f
^ > tt
ï> > ju C3 O
' 3 *C u
a eu z ai EU û-
'o •*-j
es ta u a
e ? CO E
Cfl
Ë o*
Sb o
G »H es cd
Ë o"
S §
C O
o
»n \r\ o\ * 0 \ o »o «n >o o \ v-t i n (N
Ö Ö Ö Ö Ö Ö Ö Ö Ö
H ^ f n < - i o m © M oo M «s r i o ' rs' ö d ö d
m o H M Tf GO ON O ^H 0 \ M M N O O N h
S o o f i c N c ^ ' — i r - ö r - r - M
o d d d d o* ci r i d o'
< n c o T | - c \ © © ^ r - - r ^ o o o o o o > n * . o v - i c o ( N O N < N < N c o c i c s r « i i — < r — o c ^ r - » c o N O ^ ^ M r ^ T t i n « n © i r j o © M r - - - a N w d o \ ' i o r i d d d d d d d r i r t H
c - j ^ t - - © M M ^ H © u r i 0 \ 0 Û « H t O N O O
o o o o o o o o o oo H o >n ö \ ^ Oi M M M 0 \ N O TT ^ © O O ( S M 1-H o O v>
d H «5 (s d ö œ m T T O > o M M -st r - r - r - o ^H oo r - ^H m r -H i n oo ^û o M
Ö > »rî \ó Ö Ö
S: ( S O M Ö Ö Ö Ö «O M Ö
O ^H O ' O O Ö Ö C S N O O O
C N ) i n » - l T - ( T - i ' ^ ^ ^ » - M ^ H T - I ^ H ^ H .
1 > ( — u g -^- ^ W ) t ^ •* I ^-\ *" 1 ». N wv •* 1 t~~ * ' J o s « o < N r - r - r - o o ^ o r - - O N 2 \ ^ H ^ o ^ -T f M O N O O V O O M ' - H O ^ ^ O O o O M O
T f ^ ^ M M ^ O ^ O n a \ O w < * ï © ^ - © N o o o f s © ^ , r - r - - r - ^ H O m i > - c o u ^ o r r i O v O ' - H ^ H f S « n ^ 0 ' 0 « o r ^ o \ M ' O T - H > n r - ^ o a N m M x o M rH Tf n o f i O r - t n d
• n N O ^" n i - i r t n h o \ f n ^ o h O N ( N C « " > ^ H ^ > G © < N O N U - > © C « - Ï ( N I - -• — H ^ - H O M ^ O ^ M f ^ O N C O G O O r n
H r t n o O d H H O H O M ^ d
GO ^H m
M m » 0 vO O O
O M ^ O ^ M c i O N O O O O O m o» ^ \ o ^ t O M M ON M f*S 0O* Ö ^H ^H Ö ^H Ö (N t*»'
o ^ H
ON 1— 1 ^
• *
(N r^ • *
^ (N
.£>
H
t/1 CO a o
s es
flî »n ^o
"3 o
a
"n
Crt
G u e 'S 2
ca u e u o Ö 3
• o « _ ' '
3 d ^ w w
c ;§ W* > >
w i— ;—i ^ * *—* w ^o c*i
s T, fS
Meded. Landbouwhogeschool Wageningen 72-11 (1972) 153

e o •o
-o
> X
G a es > o CA
*CA
>> CS C < > X
3 z w 0 . a.
• <
> <u
• ^
es o
|o
'£H ü
fc O
"es u 8 e CS
c 2 S "S 2 3 Ë a "
6 a-
o «
i §
o f/1
^ H © © l > © r n © 00 © © ON m © <N M O O H N ^ H
Ö Ö Ö Ö Ö Ö Ó
NO m m Tl- co t ^ ,^-NO r - *d- c i ON © oo n w t H h H r t ^ . ^ ^ " ^ " * . * " " . * " " • * .
Ö 00* ON* »-i —i Ö —H
oo © NO -—i n oo 'O ' t
ö H ON' © ö ö ó ö
0 \ N T t ^ ^ >
O ' O f l ^ O H n M H O O < N t ^ © m < n c o t - - r o ©
(N NO 00 H ON 0O 00 —i NO r^ oo co o ^ Tt - O «^ ( ON OS
ö ö ö o ö ö ö
ON V*Ï m ON ci co m ^ O oo r- (N ri m O *—i Tf O i^ *—» O N
ON o\ N m q q M
Ö Ö <r" Ö Ö Ö Ö <N fS NO H N H H C N N O O ^ J - O O N O T T O O
Ö Ö - ^ Ö Ö Ö Ö Ö
0 \ N ^ " r H - H r t r t » I O
© 0 0 l > W " ) ^ H © © T l - © i r i © ^ ^4 o " © ' © ^H* ^
rt Q O X ! O0 00 N <n © © »O m (N 00 (N O © ON NO oo m © © © Ö © © ©
NO v-i © © m r - r t CS 00 "O MOO M ^ (N © 00 O ON ^ ON •«* 00 ON © ^ H © © *-* 00* T f © © ' © ' ^H*
© ^ H ï ^ - r - ( S o o m ^ H m N O < N © O N ^ ( N 0 0
n - i ^ q o O ( S r ) d es oo" © o " ©" ©" ©
O N t N ^ ' - H ^ - i ^ H T - H o o m
^ H — i > n r ^ r ^ ( S o o © m O O N O T T C S O O N ^ O N O O
r - r - r^ NO © © © ^ ^ H
o i © OO 00* ©" © © r 4 —<" (S ^H
.a X
^ ^ s S § Ü -STÜ a 3 3 3 o — ' S 3 Ö 3 3 3 ' S
• S o S ^ o ' u a ' o O 7? >- ' S
O U-
> X X
+ x
u
3
2 S S X ) CD
e c ta es V 3
g g"
cfl
C 2 es cd a 3 E o1
*" co
S 3 3 o "
u-
t/i
e 2 CS CS
a 3 ^ CA
S &
3 O
~H © © r-- © c*i © ° o © © ON m © (N M O O H M T f -H © © © © © © ©
* o ^ M • * \ û r^ ^ M <N m -^t ^ H ^ H co ^ r -© ' 00 ON ^ H
OO ©
m h - ^ -ON © OO r- ^H -^ ^ - r- r-- * © ^
C I OO NO T f <n r - NO NO >n FH M o ^ f N »n r n
ON O' © © © ©
© N O C l N O ^ r O O O ^ H O O
© ï ^ c N < S < N > r i T - H T - i O N m q «N q fi rs es r^ 00* O* © ON ©" ©* ©" Tf" ci
r- © © © ON r- oo NO O © m r~~ m r-( S O O ^ H m h . © © © © © © ©
NO © fS NO V"> ON r-( m oo —H es r- es v-i NO 1-H m NO m ON m © oo NO ON ON »o H N ' j d H d d
rJ-ONWlNOONr^-'ri^-i < r i < N O O O N C N O N © © N O O N O N C l O N T | - < N ^ -© »O —H' © © © © O*
(M
S © ^ H o o o N < N O N ^ | - r ^
C O C n ' O O N C O O N T j - C O ©
Ö
O
-"
§ Ö
CX>
0 0
§ Ö
8 ö
\o 00 a\ o ö ö
© en
oo
©
ON «O
m 0 0
^
en
©
NO
r-;
ON w ON r*- Ov < - I Ï ^ ^ J -( N f N - s t © V - i N O - ^ - » 0 N O O N ^ - © o o r n « n v i ^ t © » — t © m o o ( ^ ^ -© en © © ^H" ©" © ©
- H i n
O O O N M O N M ^ ^ H M W ^ " ^ ^ ^ • O ^ ^ o o t n C S ( N N 0 T t © 0 0 c < - i r o O N O O ^ M H O « O O O ^
© rt © NO ©
'3 c es .y 2
S3 •§ .a 'H 'S 2 « £ S « 1, 5 §3 g.$ g
154 Meded. Landbouwhogeschool Wageningen 72-11 (1972)

Pu
O
O
-a
> X X X
•H *U
s £ S 5?
« vi
6 cr
Ë o1
o g
o
O
^ O (S ^ ^ Q O
O O O O O O O
oo oo r - oo o oo o ^ T t r ^ r - r ^ r-- ^ O W t ^ M n M
rt M 0O Tf iTj H (S es r t ^J- en rH ir» ^ "
0 0 ^ O \ T f ^ H ( N O \ « r i
S O O O N S O O O O O N O
^ ^ ( N O
r < i f ^ \ o O O Q » n r ^ > n T t m e S O N O N O ^ l - s O ' - i W N m r ^ T t - i - H C - i m s o e S
O O -H Ö (N O 00 O O O O (N O 00
Ö O Ö Ö O Ö Ö
M N -^ <n OO O ^ r- o o m oo TJ- in es © ^ oo oo m m ON N h; ^ n D
^ oó « Ó ^ (S d
^ O N O O > n ^ H r H t ^ O M J O f O I ^ O O M O ^ ^ H T j - t ^ - o o o \ © r - » s o M f v l ^ o o f n r i H N I-H es H" es" O rri Ö Ö
mr*")dr^soo\©'<sT'—< q «) h « so « rj o\
S es ••' F-Ï od i-î fi cW od es ^ es
SO "O OO N ON SO M
S oo *-• r~ -H m ON
CM3\ T|- n so oo t- ON »n ~H es O ro
O 0 0 0 \ M O O \ ^ O ' O O O O ' t O ' O ^ O N o v t ^ i ^ t * > m a \ o o T i -" ° t rt. t ^ ! © r ^ r n © ö a \ * © ©
O O S O O ^ s O O O s t M s O © ( ^ © e S © m O \ o o r s o N s o r - e s o \ o o s o o s O ^ H - ^ j - T j - i n e s ^ s o s o
'S o
CO
o O
3
CO
c
I 'S
E 3 •3
S
f )
O
z 1/3
o z C/5 X
3 •3
e
•s 3
'co
S3
'S
X
CO
o
3
S o T3
> X X X
+
'S
o — Z CS BI O CU ' r3 PU - ' S
es ca a 3 Ë o*
s " Ë o*
co
o g g 3 3 O-CO c«
ca ca
o Ë 3 co
C 0
2 C «s >
u c3 3 CT co
3 O
C/5
O O O O O O O
O i?\ Os - H ^ C \ s o •^- oo i^ o r- - ^ Tj-i n oo I-« i > e s ON S O
o i r ï d ^ d s o d
^ " A o o o o o \ O f n s o o o e s O N S O T j - o o « O T t
^ r i O r i o ^ O O
s o o o r - - ^ O N r - o o o o N N i n s o o o s o o v ^ s u o o c n r ^ r ^ - o \ © ^ t e s i - ^ ©
e s e s ' f ^ Ö r ^ ö ^ ' K o N os es ^ in
r-- © «n ^ >n © ON S D O N H O O M r- o O O ON O en Ö Ö Ö Ö Ö Ö Ö
T t T-i s o oo ^ ON - H iO i—i r - m SO o 00 s o m e s oo c o oo —i ( S m H o o r - i o O r t
rt-Hl^O\MSOWH s o o i » o > ' t r ^ > n f O O r ^ ^ c o o s o r s e s d r t H o d ^ d ö
• - ^ es o
0 0 O \ 0 0 H S O i O T t H C T i
' • r e s e s o o O N e s o o N Ö l O H h r H S O H h S O O o s d o o H f s d ^ v i ' o T|- i -i i - i e s
es
Ö
so r— SO
so "
8 o ö
vs m
•*
ö vs
VO
tN
§ ö 00 so os o\
os
os os
ö VS
o ö
§ ö o vs
tN
tN tN OS
ö
o os VS
ö
^ H ^ H ^ H I T J O O O O O
O ^ ^ H O N r - ^ H - ^ t - O f ^ i n o o o o o « n o o « n — < < n O s O N e s r - O N r - r - O N o o o o > n m s o < n © O N © c o © e s ^ t : ' - - s d © « n © ' r o e s < s T T r ^ H M e s *-*
O
z c/5
f i Ë 'S "" 3 <U -SU ,**, . S
co e 13 w -H _, . . — •* 5 « Z S « ^ S 8 s S S Ë 2 8
Meded. Landbouwhogeschool Wageningen 72-11 (1972) 155

s o •o
X X
+
X X
5 z u û<
> _4> , i
cä o ' 3 '£ O
< cC
C O"
E o1
h
S & S g E 5
o C/5
Tfr - H m r^ Tt o m X r t O M O O O ^ O m i—i i—i r - m «—i (S rt «o « ^ d d ^ '
o \ CN m r - i—ii—i ^o m
O c o T j - ' ^ - o N ' - i r - o
Ö H ö H ö m Ö O
m es "3-
' d t^ d t ' d o i od n ON • ^H crj
O O »O »O i o o o o' o 8 î vi O O O oo O oo
ö ö ö ö ö ö ö o o o o n - H h « o »n oo (N rs ^ - \o m o \ o \ t ^ M n n oo \D v^ 1-H ^ - o i n ^ Ö VO oo" Tl-' Ö (N Ö
0 0 - ^ c * - i r ^ ô r ^ < O Q
o ' H r i « d « o ' o
h - O O ^ H T l - O O ^ m M ^ -
ON O
00
8 ö o ON
M
| ©
00 O
(N f n
88 o o o
s
O
en >o <N O
O
00
ö
O
w-t
i ö 1 ^
• *
•* o'
ON
S
O o oo (S >n ^- ' —<' o\ r-' ö ö * t ö ö
N » O O M » V O > O N
(N«oQa \«" i©«nc \ ^o
O z C/5
s E i « y w e «O U * o ^ w
2 g « EÈ E 2 g ° o 3
156 Meded. Landbouwhogeschool Wageningen 72-11 (1972)

REFERENCES
ADAMS, J. R., HOLBERT, P. E., FORGASH, A. J., 1965. Electron microscopy of the contact chemoreceptors of the stable fly Stomoxys calcitrans. - Ann. entomol. Soc. Amer., 58: 909-917.
ANDERSSON, B., LANGREN, S., OLSSON, L., & ZOTTERMAN, Y., 1950. The sweet taste fibres of
the dog. - Acta Physiol. Scand., 21: 105-119. ARVANITAKI, A., 1942. Effects evoked in an axon by the activity of a contiguous one. - J.
Neurophysiol., 5 : 89-108. BECK, S. D. , 1965. Resistance of plants to insects. - Annu. Rev. Ent., 10: 207-232. BEIDLER, L. M., 1953. Properties of chemoreceptors of tongue of rat. - J. Neurophysiol., 16:
595-607. BEIDLER, L. M., 1954. A theory of taste stimulation. - J. gen. Physiol., 38: 133-139. BEIDLER, L. M., FISHMAN, I. Y. & HARDIMAN, C. W., 1955. Species differences in taste re
sponses. - Amer. J. Physiol., 181: 235-239. BLANEY, W. M., & CHAPMAN, R. F. , 1969. The fine structure of the terminal sensilla on the
maxillary palps of Schistocerca gregaria (Forskâl) (Orthoptera, Acrididae). - Z. Zeilforsch., 99: 74-97.
BONGERS, W., 1970. Aspects of host-plant relationship of the Colorado beetle. - Med. Landbouwhogeschool Wageningen, 70-10.
BORG, T., & NORRIS, D. M., 1971. Ultrastructure of sensory receptors on the antennae of Scolytus multistriatus. (Marsh.). - Z . Zellforsch., 113:13-28.
CHIN, CHUN-TEH, 1950. Studies on the physiological relations between the larvae of Leptino-tarsa decémlineata Say and some solanaceous plants. - Tijdschr. PI. zietkt., 56: 1-88.
CORBIÈRE, G., 1967. Anatomie sensorielle des appendices cèphaliques de la larve du Speophyes lucidulus (Delar.) (Coléoptère cavernicole de la sous-famille des Bathysciinae). - Ann. Speleol., 22: 417-431.
CORBIÈRE-TICHANE, G. 1971. Ultrastructure de l'équipement sensoriel de la mandibule chez la larvae du Speophyes lucidulus Delar. (Coléoptère cavernicole de la sous-famille des Bathysciinae). - Z. Zellforsch., 112: 129-138.
CROZIER, W. J., 1922. 'Reversal of inhibition' by atropine in caterpillars. - Biol. Bull., 43î 239-246.
DAVID, W. A. L., 1957. Breeding Pieris brassicae L. and Apanteles glomerulus L. as experimental insects. - Z. Pflanzenkrankh. Pflanzenschutz., 64: 572-577.
DAVID, W. A. L. & GARDINER, B. O. C , 1952. Laboratory breeding ofPiersis brassicae L. and Apanteles glomeratus L. - Proc. roy. Ent. Soc , London, A, 27: 54-56.
DAVID, W. A. L. & GARDINER, B. O. C , 1960. A Pieris brassicae (Linnaeus) culture resistant to a granulosis. - J. Insect Pathol., 2 : 106-114.
DAVID, W. A. L. & GARDINER, B. O. C , 1965. Rearing Pieris brassicae L. larvae on a semisynthetic diet, - Nature, 207: 882-883.
DAVID, W. A. L. & GARDINER, B. O. C , 1966a. The effect of sinigrin on the feeding of Pieris brassicae L. larvae transferred from various diets. - Ent. exp. appl., 9: 95-98.
DAVID, W. A. L., & GARDINER, B. O. C , 1966b. Mustard oil glucosides as feeding stimulants for Pieris brassicae larvae in a semi-synthetic diet. - Ent. exp. appl., 9: 247-255.
DEN OTTER, C J., 1971. Tarsal and labellar taste hairs of the bluebottle Calliphora vicina Robineau-Desvoidy : location, sensitivity to salts, mechanism of stimulation. - Thesis, Groningen, 108 pp.
DETHIER, V. G., 1937. Gustation and olfaction in lepidopterous larvae. - Biol. Bull., Wood's Hole, 72: 7 -23 .
DETHIER, V. G., 1947. Chemical insect attractans and repellents. - Philadelphia, Pa., 289 pp. DETHIER, V. G., 1953. Host plant perception in phytophagous insects. - Int. Congr. Ent., IX,
Amsterdam, 1951, 2 : 81-88.
Meded. Landbouwhogeschool Wageningen 72-11 (1972) 157

DETHIER, V. G., 1956. Chemoreceptor mechanisms. In 'Molecular Structure and Functional Activity of Nerve Cells' (R. G. Grenell and L. J. Mullins, eds.) pp. 1-33. Amer. Inst. Biol. Sei., Washington, D.C.
DETHIER, V. G., 1966. Feeding behaviour. - In : Insect behaviour (P. T. Haskell, ed.), Symp. Roy. Ent. Soc , London, 3 : 46-58.
DETHIER, V. G., 1968. Chemosensory input and taste discrimination in the blowfly. - Science, 161: 389-391.
DETHIER, V. G., 1969. Feeding behaviour of the blowfly. - Adv. Study Behav., 2: 112-259. DETHIER, V. G., 1970. Chemical interactions between plants and insects. - In: Chemical
ecology, eds. Sondheimer, E. & Simeone, J. B., p. 83-99. DETHIER, V. G., & ARAB, Y. M., 1958. Effect of temperature on the contact chemoreceptors of
the blowfly. - J. Insect Physiol., 2: 153-161. DETHIER, V. G., & CHADWICK, L. E., 1948. Chemoreception in insects. - Physiol. Rev. 28:
220-254. DETHIER, V. G. & GOLDRICH, N., 1971. Blowflies: Alteration of adult taste responses by chemi
cals present during development.-Science, 173: 242-244 DETHIER, V. G. & HANSON, F. E., 1965. Taste papillae of the blowfly. - J. Cell. Comp. Physiol.,
65: 93-100. DETHIER, V. G., & EVANS, D. R., & RHOADES, M. V., 1956. Some factors controlling the in
gestion of carbohydrates by the blowfly. - Biol. Bull. I l l : 204-222. DIAMANT, H., OAKLEY, B., STROM, L., WELLS, C , & ZOTTERMAN, Y., 1965. A comparison
of neural and psychophysical responses to taste stimuli in man. - Acta physiol. scand., 64: 67-74.
EGER, H., 1937. Über den Geschmackssinn von Schmetterlingsraupen. - Biol. Ztbl., 14: 98-127.
ERNST, K. D., 1969. Die Feinstruktur von Riechsensillen auf der Antenne des Aaskäfers Necrophorus (Coleoptera). - Z. Zellforsch., 94: 72-102.
EVANS, D. R., 1961. Depression of taste sensitivity to specific sugars by their presence during development. - Science, 133: 327-328.
EVANS, D. R. & MELLON, D . JR . , 1962. Electrophysiological studies of a water receptor associated with the taste sensilla of the blowfly. - J. gen. Physiol., 45: 487-500.
FAHIMI, N. D. & DROCHMANS, P., 1965. Essais de standardisation de la fixation au glutaralde-hyde. II. Influence des concentrations en aldehyde et de l'osmolalité. - J. Microscopic 4: 737-748.
FRINGS, H., 1945. Gustatory rejection thresholds for the larvae of the cecropia moth, Samia cecropia (Linn.). - Biol. Bull., 88: 37-43.
GELPERIN, A., 1971. Regulation of feeding. Annu. Rev. Ent., 16: 365-378 GOTHILF, S., GALUN, R., & BAR-ZEEV, M., 1971. Taste reception in the Mediterranean
Fruit Fly: electrophysiological and behavioural studies. - J. Insect Physiol., 17: 1371— 1384.
GRAY, P., 1954. The microtomist's formulary and guide: 1-794, figs. 1-86. GRAY, E. G., 1960. The fine structure of the insect ear. - Phil. Trans. Roy. Soc. (B), 243: 7 5 -
94. HAGSTROM, E. G , 1959. Quoted in Pfaffmann, C , The sense of taste. In Field, J., Ed. Hand
book of Physiology. Section 1 : Neurophysiology, vol. I. Amer. Physiol. Soc. HANSEN, K. & HEUMANN, H. G., 1971. Die Feinstruktur der tarsalen Schmeckhaare der
Fliege Phormia terraenovae Rob.-Desv.-Z. Zellforsch., 117: 419-442. HARLEY, K. L. S. & THORSTEINSON, A. J., 1967. The influence of plant chemicals on the feeding
behavior, development, and survival of the two-striped grasshopper, Melanoplus bivit-tatus (Say), Acrididae; Orthoptera. - Can. J. Zool., 45: 305-319.
HODGSON, E. S., 1956. Physiology of the labellar sugar receptors of flies. - Anat. Rec. 125: 555.
HODGSON, E. S., 1957. Electrophysiological studies of arthropod chemoreception. - II. Responses of labellar chemoreceptors of the blowfly to stimulation by carbohydrates. -J. Insect Physiol., 1: 240-247.
158 Meded. Landbouwhogeschool Wageningen 72-11 (1972)

HODGSON, E. S., 1967. The chemical senses in the invertebrates. - In : The chemical senses and nutrition, Kare, M. R. & Maller, O., eds.: 7 - 91 .
HODGSON, E. S., & ROEDER, K. D., 1956. Electrophysiological studies of arthropod chemo-reception. I. General properties of the labellar chemoreceptors of Diptera. - J. Cell. Comp. Physiol. 48: 51-75.
HODGSON, E. S., LETTVIN, J. Y., & ROEDER, K. D., 1955. Physiology of a primary chemo-receptor unit. - Science 122: 417-418.
HOPKINS, A. D., 1917, A discussion of C. H. Hewitt's paper on 'Insect Behaviour'. - J. econ. Ent., 10: 92-93.
Hsü, F. , 1938. Étude cytologique et comparée sur les sensilla des insectes. - Cellule, 47: 7-60.
ISHIKAWA, S., 1963. Responses of maxillary chemoreceptors in the larva of the silkworm, Bombyx mori, to stimulation by carbohydrates. - J. Cell. Comp. Physiol., 61: 99-107.
ISHIKAWA, S., 1966. Electrical response and function of a bitter substance receptor associated with the maxillary sensilla of the larva of the silmworm, Bombyx mori L. - J. Cell Physiol., 67: 1-11.
ISHIKAWA, S., 1967. Maxillary chemoreceptors in the silkworm. - Proc. Int. Symp. Olfaction and Taste, II , Tokyo, 1965, Hayashi, T. ed.: 761-777.
ISHIKAWA, S., HIRAO, T. & ARAI, N., 1969. Chemosensory basis of hostplant selection in the silkworm. - Ent. exp. appl., 12: 544-555.
I T O , T . , HORIE, Y & FRAENKEL, G., 1959. Feeding on cabbage and cherry leaves by maxil-lectomized silkworm larvae. - J. série. Sei., Tokyo. 28: 107-113.
ITO, T., 1961. Nutrition of the silkworm, Bombyx mori. IV. Effects of ascorbic acid. - Bull. Sericult, Exptl. Sta. (Tokyo), 17: 119-136.
JERMY, T., 1961. On the nature of the oligophagy in Leptinotarsa decemlineata Say (Coleoptera: Chrysomelidae). - Acta zool. hung., 7: 119-132.
JERMY, T., HANSON, F. , & DETHIER, V. G., 1968. Induction of specific food preference in lepidopterous larvae. - Ent. exp. appl., 11: 211-230.
JOHANNSON, A. S., 1951. The food plant preference of the larvae of Pieris brassicae L. (Lepid., Pieridae). - Norsk ent. Tidsskr., 8: 187-195.
KENNEDY, J. S., 1965. Mechanisms of host plant selection. - Ann. appl. Biol., 56: 317-322. LARIMEIR, J. L. & OAKLEY, B., 1968. Failure of Gymnema extract to inhibit the sugar receptors
of two invertebrates. - Comp. Biochem. Physiol., 25: 1091-1098. LAVIE, D., JAIN, M. K. & SHPAN-GABRIELITH, S. R., 1967. A locust phagorepellent from two
Melia species. - Chem. Comm. 771: 910-911. LEBERRE,J . R. & LOUVEAUX, A., 1969. Equipement sensoriel des mandibules de la larve du
premier stade de Locusta migratoria L. - C. R. Acad. Se. Paris, 268, D : 2907. LOEWENSTEIN, W. R., SOCOLAR, S. J., HIGASHINO, S., KANNO, Y., & DAVIDSON, N., 1965.
Intercellular communication: renal, urinary bladder, sensory and salivary gland cells. - Science, 149: 295-298.
MA , WEI-CHUN, 1969. Some properties of gustation in the larva of Pieris brassicae. - Ent. exp. app l , 12: 584-590.
MORAN, D. T., 1971. Loss of the sensory process of an insect receptor at ecdysis. - Nature, 234: 476-477.
MORAN, D. T. & VARELA, F. G., 1971. Microtubules and sensory transduction. - Proc. Nat. Acad. Sc. USA, 68: 757-760.
MORITA, H., 1959. Initiation of spike potentials in contact chemosensory hairs of insects. I l l : D. C stimulation and generator potential of labellar chemoreceptor of Calliphora. -J. Cell. Comp. Physiol., 54: 189-204.
MORITA, H., 1963. Generator potential of insect chemoreceptors. - Proc. Int. Congr. Zool., 3 : 105-106.
MORITA, H., HIDAKA, T., & SHIRAISHI, A., 1966. Excitatory and inhibitory effects of salts on the sugar receptor of the fleshfly. - Mem. Fac. Sei. Kyushu Univ., Ser. E. (Biol.), 4:123 -135.
MORITA, H. & SHIRAISHI, A., 1968. Stimulation of the labellar sugar rsceptor of the fleshfly by mono- and disaccharides. - J. gen. Physiol., 52: 599-583.
Meded. Landbouwhogeschool Wageningen 72-11 (1972) 159

MoRiTA, H. & TAKEDA, K., 1959. Initiation of spike potentials in contact chemosensory hairs of insects. II : The effect of electric current on tarsal chemosensory hairs of Vanessa. - J. Cell. Comp. Physiol, 54: 177-187.
MORITA, H. & YAMASHITA, S., 1959. Generator potential of insect chemoreceptor. - Science, 130: 922.
MOULINS, M., 1967. Les cellules sensorielles de l'organe hypopharyngien de Blabera craniifer Burm. (Insecta, Dictyoptera). Etude du segment ciliaire et des structures associées. -C. R. Acad. Se. Paris, 265: 44-47.
MOULINS, M., 1968. Les sensilles de l'organe hypopharyngien de Blabera craniifer Burm. (Insecta, Dictyoptera). - J. Ultrastr. Res., 21: 474-513.
MOULINS, M., 1971. Ultrastructure et physiologie des organs epipharyngiens et hypopharyn-giens. -Z.Vergl. Physiol., 73: 139-166
NAYAR, J. K. & THORSTEINSON, A. J., 1963. Further investigations into the chemical basis of insect-hostplant relationships in an oligophagous insect, Plutella maculipennis (Curtis) (Lepidoptera: Plutellidae). - Canad. J. Zool., 41: 923-929.
NICKLAUS, R., LUNDQUIST, P. G., & WERSÄLL, J., 1967. Elektronenmikroskopie am senso
rischen Apparat der Fadenhaare auf den Cerci der Schabe Periplaneta americana. - Z . vergl. Physiol., 56: 412-415.
OMAND, E. & DETHIER, V. G., 1969. An electrophysiological analysis of the action of carbohydrates on the sugar receptor of the blowfly. - Proc. Nat. Acad. S c , 62: 136-143.
PALADE, G. E., 1952. A study of fixation for electronmicroscopy. - J. exp. Med., 95: 285-298. PRINGLE, J. W. S., 1938. Proprioception in insects. II. The action of the campaniform sensilla
on the legs. - J. exp. Biol., 15: 114-131. REES, C. J. C , 1968. The effect of aqueous solutions of some 1:1 electrolytes on the electrical
response of the type 1 ('salt') chemoreceptor cell in the labella of Phormia. - J. Insect Physiol., 14: 1331-1364.
REES, C. J. C , 1969. Chemoreceptor specificity associated with choice of feeding site by the beetle Chrysolina brunsvicensis on its foodplant, Hypericum hirsutum. - Ent. exp. appl., 12: 565-584.
REES, C. J. C , 1970. The primary process of reception in the type 3 ('water') receptor cell of the fly, Phormia terranovae. - Proc. Roy. Soc. Lond. B, 174: 469-490.
REES, C. J. G , 1970. Age dependency of response in an insect chemoreceptor sensillum. -Nature, 227: 740-742.
REES, C. J. C. & HORI, N., 1968. The effect of electrolytes of the general formula XC12 on the response of the type 1 labellar chemoreceptor of the blowfly, Phormia. - J. Insect Physiol., 14: 1499-1513.
REYNOLDS, E. S., 1963. The use of lead citrate at high pH as an electron-opaque stain in electron microscopy. - J. Cell Biol., 17: 208-212.
RICHARD, G., 1951. L'innervation et les organes sensoriels des pieces buccales du termite à cou jaune {Calotermes flavicollis Fab.). - Ann. Sc. nat., Zoologie, tome XIII: 397-412.
RICHARD, G., 1952. L'innervation sensorielle pendant les mues chez les insectes. - Bull. Soc. Zool. Fr., 77: 99-106.
RIDDIFORD, L., 1968. Artificial diet for Cecropia and other saturniid moths. - Science, 167: 1461-1462.
SCHNEIDER, D. & STEINBRECHT, R. A., 1968. Checklist of insect olfactory sensilla. Symp. Zool. Soc. Lond., 23: 279-297.
SABATINI, D. D., BENSCH, K. &BARNETT, R. J., 1963. Cytochemistry and electron-microscopy.
The preservation of cellular ultrastructure and enzymatic activity by aldehyde fixation. -J. Cell Biol., 17: 19-58.
SCHOONHOVEN, L. M., 1967a. Chemoreception of mustard oil glucosides in larvae of Pieris brassicae. Proc. Kon. Ned. Akad. Wtsch., C, 70: 556-563.
SCHOONHOVEN, L. M., 1967b. Loss of hostplant specificity by Manduca sexta after rearing on an artificial diet. - Ent. exp. appl., 10: 270-272.
SCHOONHOVEN, L. M., 1968. Chemosensory bases of hostplant selection. - Ann. Rev. Ent., 13: 115-136.
160 Meded. Landbouwhogeschool Wageningen 72-11 (1972)

SCHOONHOVEN, L. M., 1969a. Amino-acid receptor in larvae oïPiersis brassicae (Lepidoptera). -Na t u r e , 221: 1268.
SCHOONHOVEN, L.M., 1969b. Sensitivity changes in some insect chemoreceptors and their effect on food selection behaviour. - Proc. Kon. Ned. Akad. Wtsch., C, 72: 491-498.
SCHOONHOVEN, L.M., 1969c. Gustation and foodplant selection in some lepidopterous larvae.- Ent. exp. app l , 12: 555-564.
SCHOONHOVEN, L. M. & DETHIER, V. G., 1966. Sensory aspects of hostplant discrimination by lepidopterous larvae. - Arch. Néerl. Zool., to 16: 497-530.
SIDDALL, J. B., 1970. Chemical aspects of hormonal interactions. - In : Chemical Ecology, Sondheimer, E. & Simeone, J. B., eds. : 281-303.
SIEGEL, S., 1956. Nonparametric statistics. - McGraw-Hill, New York. SINOIR, Y., 1970. Quelques aspects du comportement de prise de nourriture chez la larvae
deLocusta migratoria migratorioides R. & F. - Ann. Soc. ent. Fr. (N.S.), 6 (2),: 391-405. SLIFER, E. H., 1970. The structure of arthropod chemoreceptors. - Ann. Rev. Entomol., 15:
121-142. SLIFER, E. H. & SEKHON, S. S., 1963. Sense organs on the antennal flagellum of the small
milkweed bug. Lygeaus kalmii Stal. (Hemiptera, Lygaeidae). J. Morphol., 112: 165-193. SLIFER, E. H. & SEKHON, S. S., 1964a. The dendrites of the thin-walled olfactory pegs of the
grasshopper (Orthoptera, Acrididae). - J. Morphol., 114: 393-409. SLIFER, E. H. & SEKHON, S. S., 1964b. Fine structure of the sense organs on the antennal
flagellum of a fleshfly, Sarcophaga argyrostoma R.D. (Diptera, Sarcophagidae). - J. Morphol., 114: 185-208.
SLIFER, E. H., PRESTAGE, J., & BEAMS, H. W., 1957. The fine structure of the long basiconic sensory pegs of the grasshopper (Orthoptera, Acrididae) with special reference to those of the antenna. - J. Morphol., 101: 359-397.
SNODGRASS, R. E., 1935. Principles of insect morphology. New York, McGraw-Hill. 667 p. STAAL, G. B., 1967. Plants as a source of insect hormones. - Med. Kon. Ned. Akad. Wtsch.
Amsterdam, C. 70: 409-418. STEINBRECHT, R. A., 1969. On the question of nervous syncytia: lack of axon fusion in two
insect sensory nerves. - J. Cell. Sei., 4 : 39-53. STÜRCKOW, B., 1959. Über den Geschmacksinn und den Tast-sinn von Leptinotarsa decem-
lineata Say. - Z. Vergl. Physiol., 42: 255-302. STÜRCKOW, B., 1967. Occurrence of a viscous substance at the tip of the labellar taste hair
of the blowfly. - Proc. Int. Symp. Olfaction and Taste, II (Hayashi, T., ed.). Oxford: Pergamon Press: 707-720.
STÜRCKOW, B., 1971. Electrical impedance of the labellar taste hair of the blowfly, Calliphora erythrocephala Meig. - Z. Vergl. Physiol., 72: 131-143.
STÜRCKOW, B. & Low, I., 1961. Die Wirkung einiger So/anum-Alkaloidglykoside auf den Kartoffelkäfer Leptinotarsa decemlineata Say. - Ent. exp. et appl., 4 : 133-142.
STÜRCKOW, B. & QUADBECK, G., 1958. Elektrophysiologische Untersuchunger über den Geschmackssinn des Kartoffelkäfers Leptinotarsa decemlineata Say. - Z. Naturforsch., 13B: 93-95.
STÜRCKOW, B., ADAMS, J. R. & WILCOX, T. A., 1967. The neurons in the labellar nerve of the blowfly. - Z. Vergl. Physiol, 54: 286-289.
THORPE, W. H., 1963. Learning and Instinct in Animals. (1st Edn., 1956) Methuen, London. THORPE, W. H. & JONES, F. G. W., 1947. Olfactory conditioning and its relation to the problem
of host selection. - Proc. Roy. Soc. B., 124: 56 -81 . THORSTEINSON, A. J., 1953. The chemotactic responses that determine host specificity in an
oligophagous insect {Plutella macullipennis (Curt.). - Can. J. Zool., 31 : 52-72. THORSTEINSON, A. J., 1958. The chemotactic influence of plant constituents on feeding by
phytophagous insects. - Ent. exp. appl., 1: 23-27. THORSTEINSON, A. J., 1960. Host selection in phytophagous insects. - Ann. Rev. Ent., 5 :
193-218. THURM, U., 1964. Mechanoreceptors in the cuticle of honey bee: fine structure and stimulus
mechanism. - Science, 145: 1063-1065.
Meded. Landbouwhogeschool Wageningen 72-11 (1972) 161

THURM, U., 1965. An insect mechanoreceptor. Part I : Fine structure and adequate stimulus. -Cold Spring Harb. Symp. quant. Biol., 30: 75-82.
TOMINAGA, T., KABUTA, H. & KUWABARA, M., 1969. The fine structure of the interpseudo-tracheal papilla of a fleshfly. - Annot. Zool. Jap., 42: 91-103.
TORII, K. & MORII, K., 1948. Studies on the feeding habit of silkworms. - Bull. Res. Inst, série. Sei., 2 : 3-12.
WADA, K., MATSUI, K., ENOMOTO, Y., OGISO, O. & MUNAKATA, K., 1970. Insect feeding
inhibitors in plants. - Agric. Biol. Chem., 6: 941-945. WALDBAUER, G. P., 1962. The growth and reproduction of maxillectomized tobacco horn-
worms feeding on normally rejected non-solanaceous plants. - Ent. exp. appl., 5: 147-158. WALDBAUER, G. P. & FRAENKEL, G., 1961. Feeding on normally rejected plants by maxil
lectomized larvae of the tobacco homwovm, Protoparce sexta, (Lepidoptera:Sphingidae). - Ann. ent. Soc. Amer., 54: 477-485.
WARREN, R. M. & PFAFFMANN, G , 1959. Suppression of sweet sensitivity by potassium gymnemate. - J. appl. Physiol., 14: 40-42.
WENSLER, R. J. & FILSHIE, B., 1969. Gustatory sense organs in the food canal of aphids. - J. Morphol., 129:473-493.
WHITEAR, M., 1962. The fine structure of crustacean proprioceptors. I. The chordotonal organs in the legs of the shore crab, Carcinus maenus. - Phil. Trans. Roy. Soc. London, B, 245:291-324.
WIGGLESWORTH, V. B., 1965. The principles of Insect Physiology. - Methuen, London: 1-709.
WOLBARSHT, M. L., 1958. Electrical activity in the chemoreceptors of the blowfly. II. Responses to electrical stimulation. J. gen. Physiol., 42: 413-428.
VERSCHAFFELT, E., 1910. The cause determining the selection of food in some herbivorous insects. - Proc. Roy. Acad. Amst., 13: 536-542.
ZACHARUK, R. Y., 1962. Sense organs of the head of larvae of some Elateridae (Coleoptera) : Their distribution, structure and innervation. - J. Morphol., I l l : 1-22.
162 Meded. Landbouwhogeschool Wageningen 72-11 (1972)