dynamics of faecal pollution indicators in surface water...
TRANSCRIPT
Dynamics of faecal pollution indicators in surface water draining an agricultural catchment
STADLER, P.1,7, VOGL, W.2, KOSCHELNIK, J.2, EPP, M.2, LACKNER, M.2, OISMÜLLER, M.1, NEMETH, L. 7, KUMPAN, M.3, STRAUSS, P.3, SOMMER, R.4,5, RYZINSKA-PAIER,
G.6, FARNLEITNER, A.H.4,6, ZESSNER, M.1,7
1 TU Wien, Centre for Water Resource Systems www.waterresources.at2 Vienna Water Monitoring3 Federal Agency for Water Management, Institute for Land & Water Management Research www.baw-ikt.at4 Interuniversity Cooperation Centre for Water and Health www.waterandhealth.at5 Medical University of Vienna, Institute for Hygiene and Applied Immunology, Water Hygiene6 TU Wien, Institute of Chemical Engineering, Research Group Environmental Microbiology and Molecular Ecology7 TU Wien, Institute for Water Quality, Resources and Waste Management
Method and objectives
Test site – HOAL catchment
Monitoring results: consistency/bias diurnal, event and yearly dynamics indicator capability
Conclusion
Structure of presentation
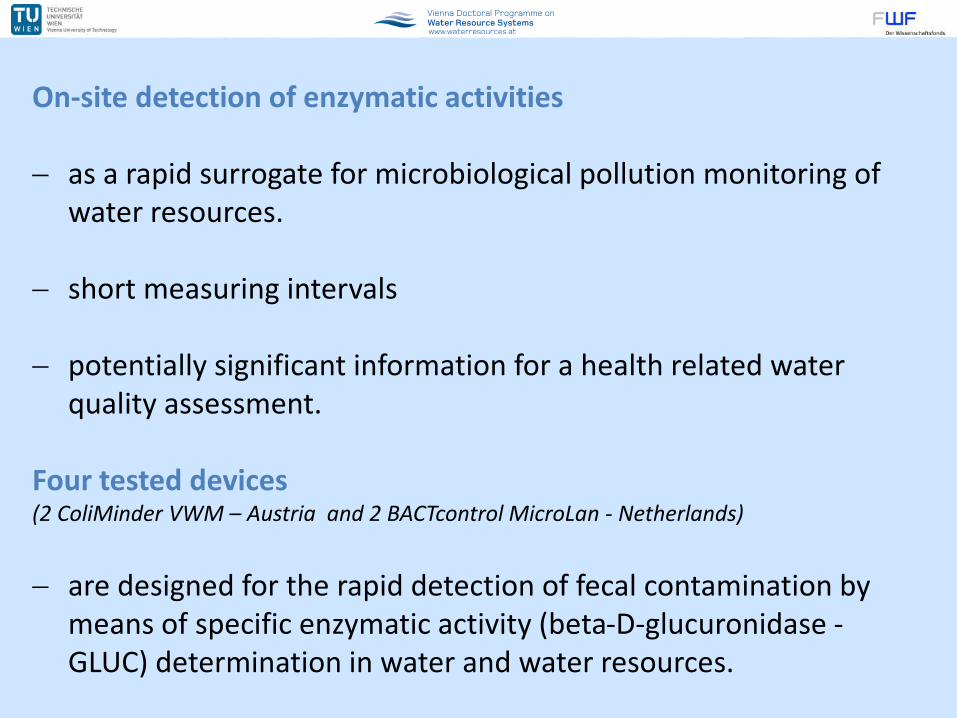
On-site detection of enzymatic activities
as a rapid surrogate for microbiological pollution monitoring of water resources.
short measuring intervals
potentially significant information for a health related water quality assessment.
Four tested devices(2 ColiMinder VWM – Austria and 2 BACTcontrol MicroLan - Netherlands)
are designed for the rapid detection of fecal contamination by means of specific enzymatic activity (beta-D-glucuronidase -GLUC) determination in water and water resources.
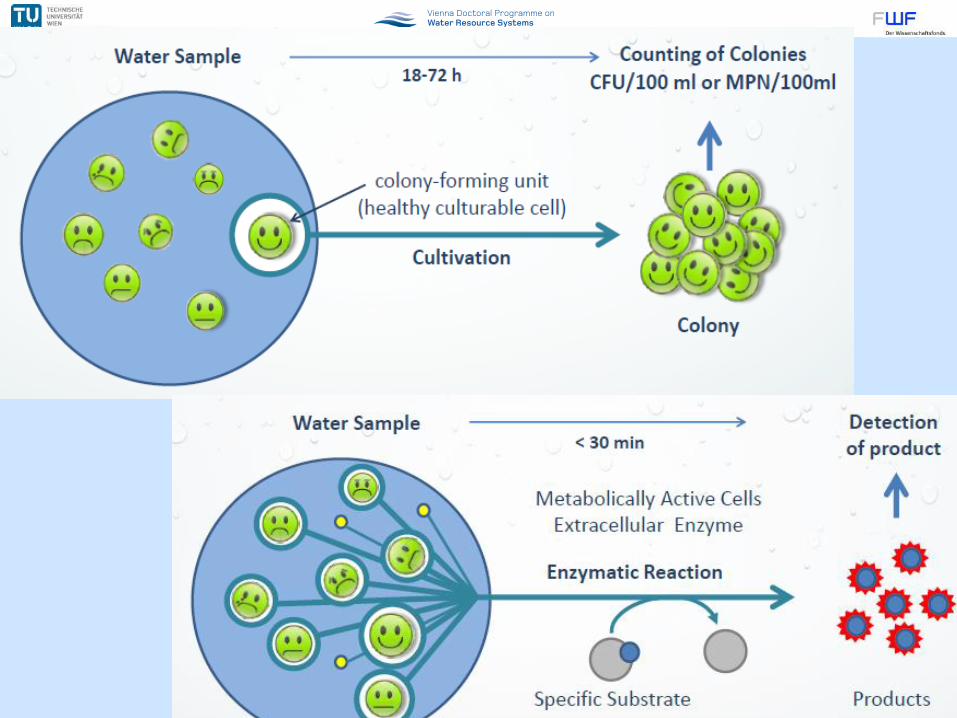
Method
www.ta-verband.dewww.breitenbrunn.atwww.umweltbundesamt.de
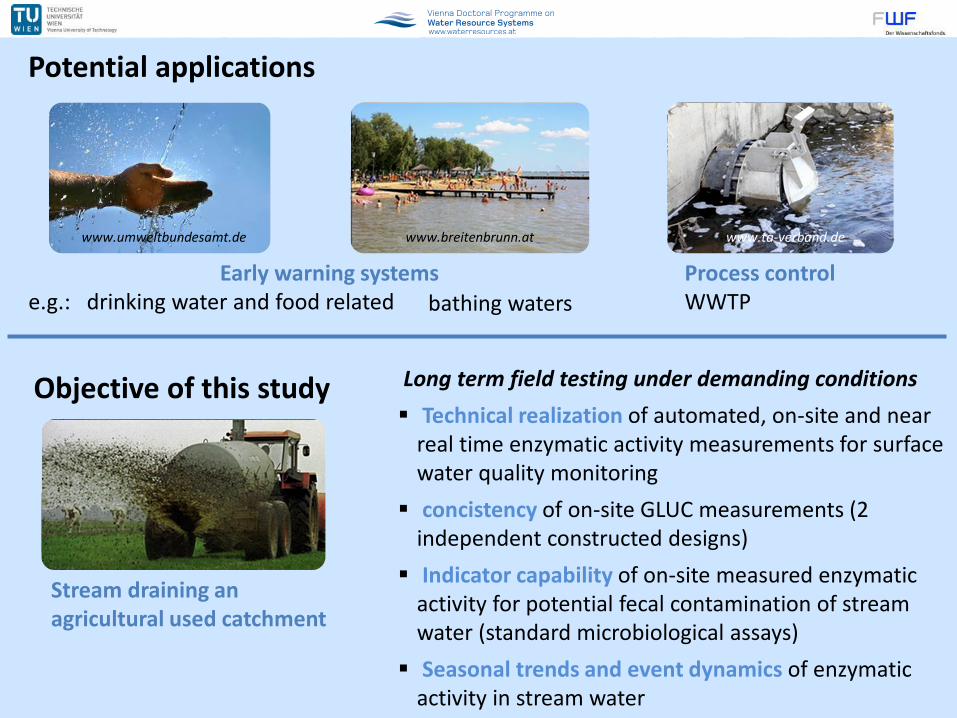
Potential applications
Early warning systemse.g.: drinking water and food related
Process controlWWTPbathing waters
Objective of this study Long term field testing under demanding conditions
Technical realization of automated, on-site and near real time enzymatic activity measurements for surface water quality monitoring
concistency of on-site GLUC measurements (2 independent constructed designs)
Indicator capability of on-site measured enzymatic activity for potential fecal contamination of stream water (standard microbiological assays)
Seasonal trends and event dynamics of enzymatic activity in stream water
Stream draining an agricultural used catchment
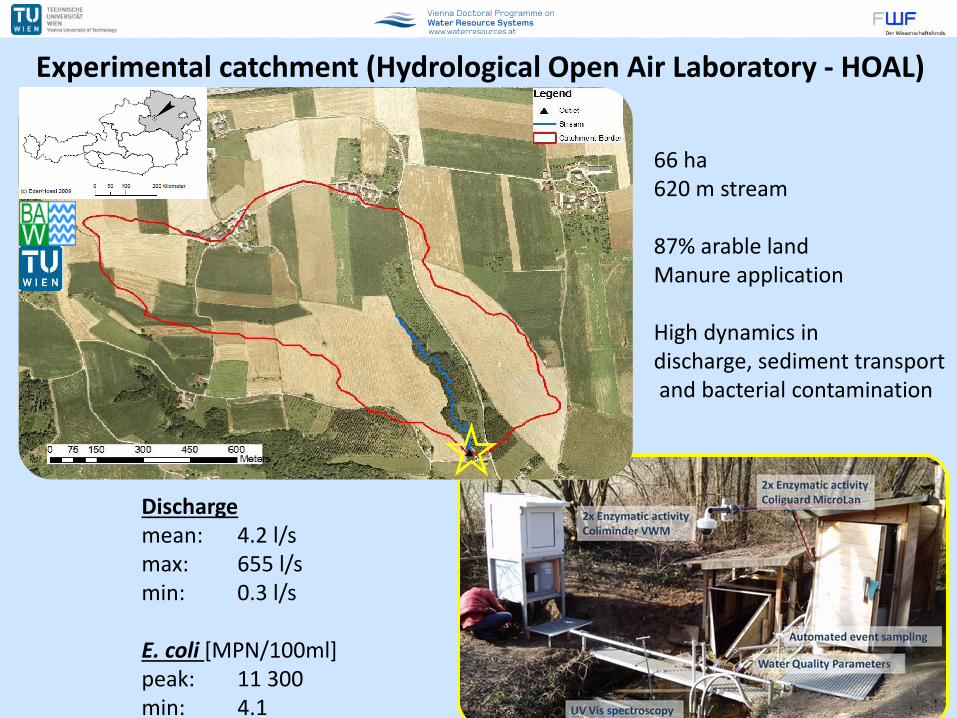
Experimental catchment (Hydrological Open Air Laboratory - HOAL)
66 ha620 m stream
87% arable landManure application
High dynamics indischarge, sediment transportand bacterial contamination
Dischargemean: 4.2 l/smax: 655 l/smin: 0.3 l/s
E. coli [MPN/100ml]peak: 11 300min: 4.1

n
n>2
00
, p
-va
lue<
0.0
01
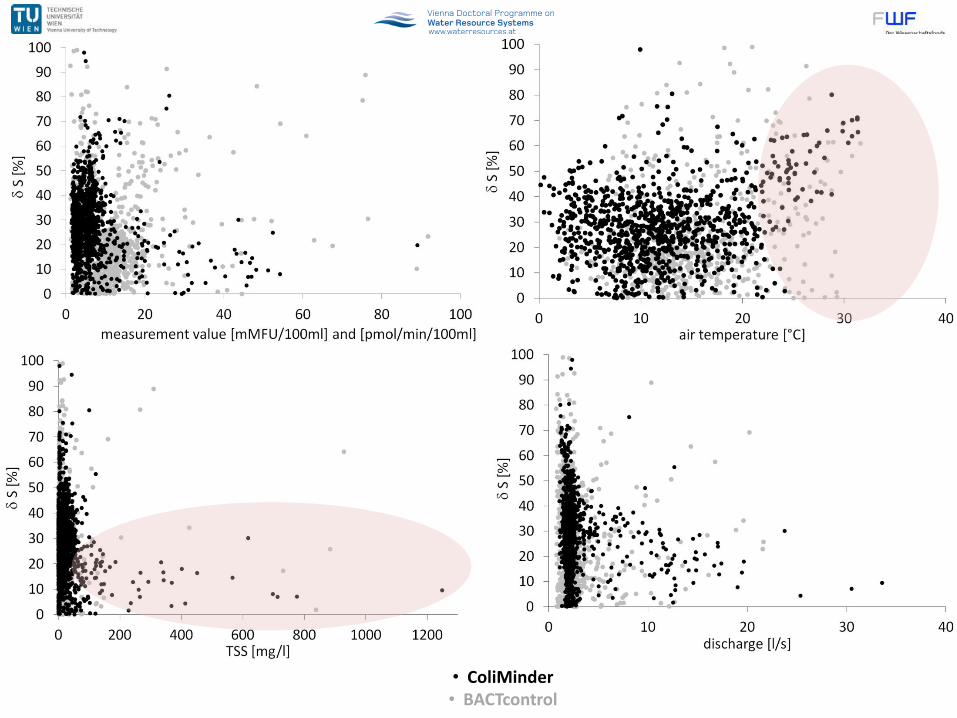
• ColiMinder• BACTcontrol
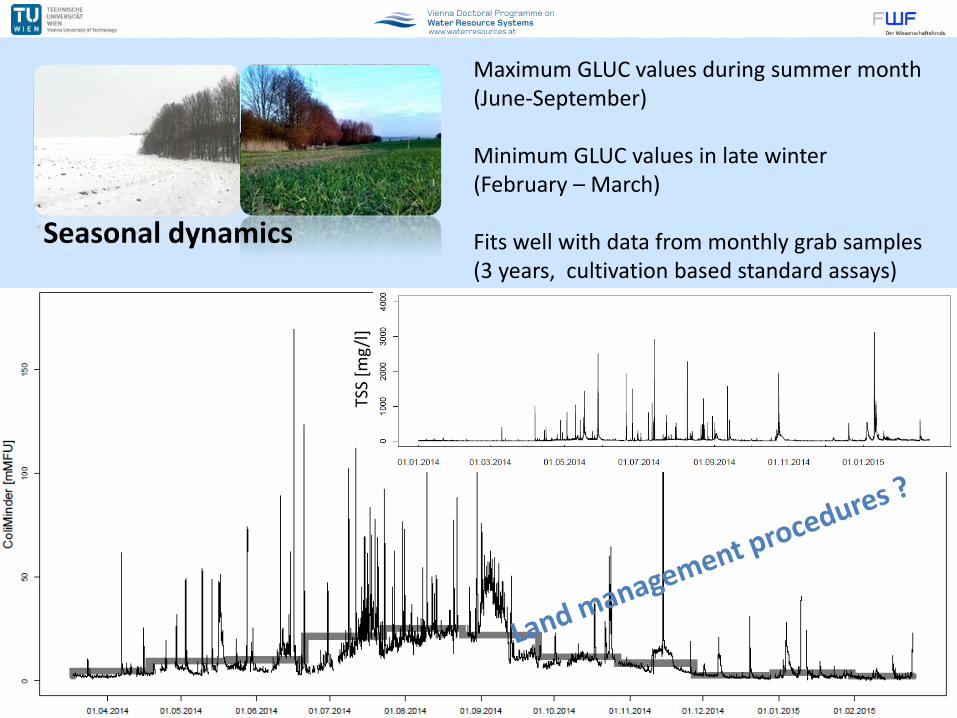
Seasonal dynamics
Maximum GLUC values during summer month(June-September)
Minimum GLUC values in late winter(February – March)
Fits well with data from monthly grab samples (3 years, cultivation based standard assays)
TSS
[mg
/l]
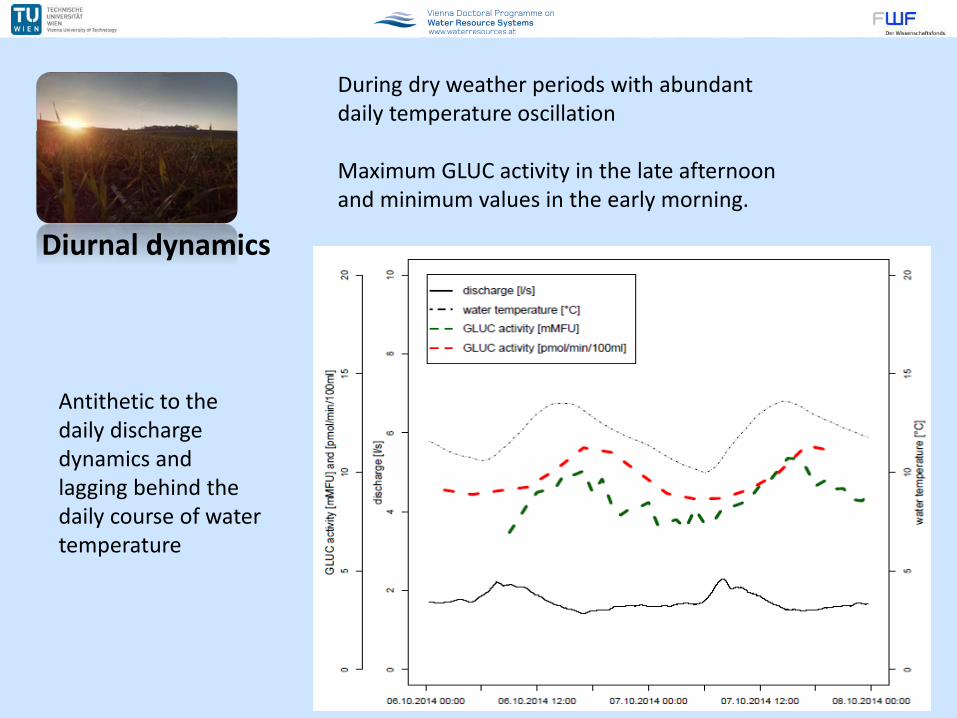
Diurnal dynamics
During dry weather periods with abundant daily temperature oscillation
Maximum GLUC activity in the late afternoon and minimum values in the early morning.
Antithetic to the daily discharge dynamics and lagging behind the daily course of water temperature
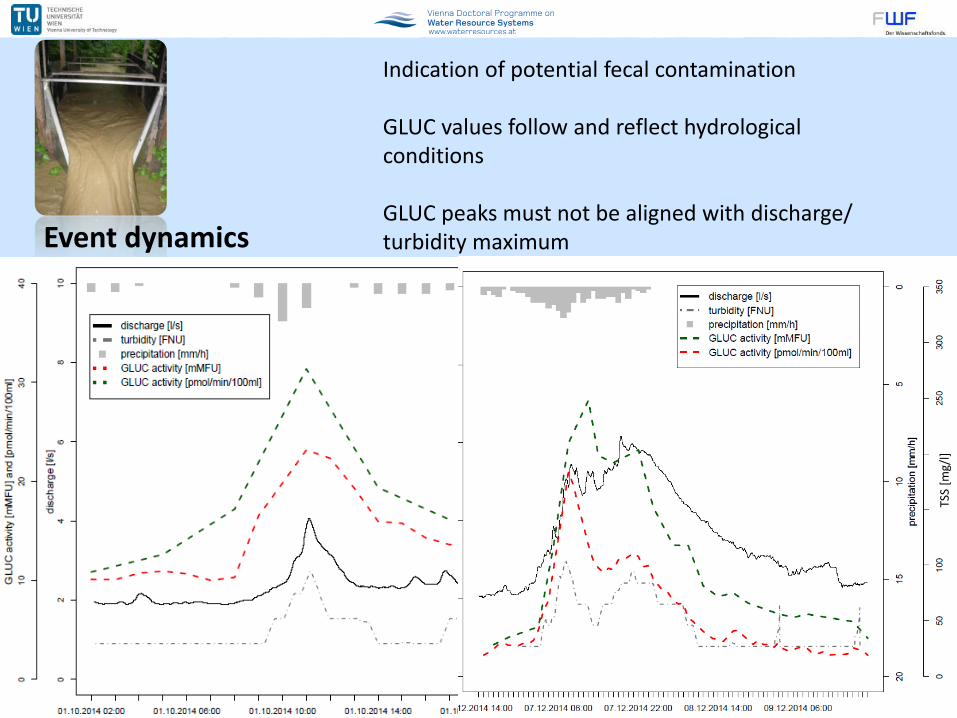
Event dynamics
Indication of potential fecal contamination
GLUC values follow and reflect hydrological conditions
GLUC peaks must not be aligned with discharge/ turbidity maximum
TSS
[mg/
l]

GLUC activity
[mMFU/100ml]
E. coli
[MPN/100ml]
Discharge
[l/s]
EC
[µS/cm]
TSS
[mg/l]
Water
temp.
[°C]
Air
temp.
[°C]
GLUC activity
[mMFU/100ml] n=54 0.52 0.38 0.47 0.39 0.12 0.00
E. coli
[MPN/100ml] 0.52 n=54 0.62 0.68 0.51 0.14 0.18
Discharge
[l/s] 0.38 0.62 n=54 0.57 0.73 0.29 0.29
EC
[µS/cm] 0.47 0.68 0.57 n=54 0.74 0.08 0.19
TSS
[mg/l] 0.39 0.51 0.73 0.74 n=54 0.15 0.06
Water temp.
[°C] 0.12 0.14 0.29 0.08 0.15 n=54 0.71
Air temp.
[°C] 0.00 0.18 0.29 0.19 0.06 0.71 n=30
R²
Indicator capability for microbiological standard assays
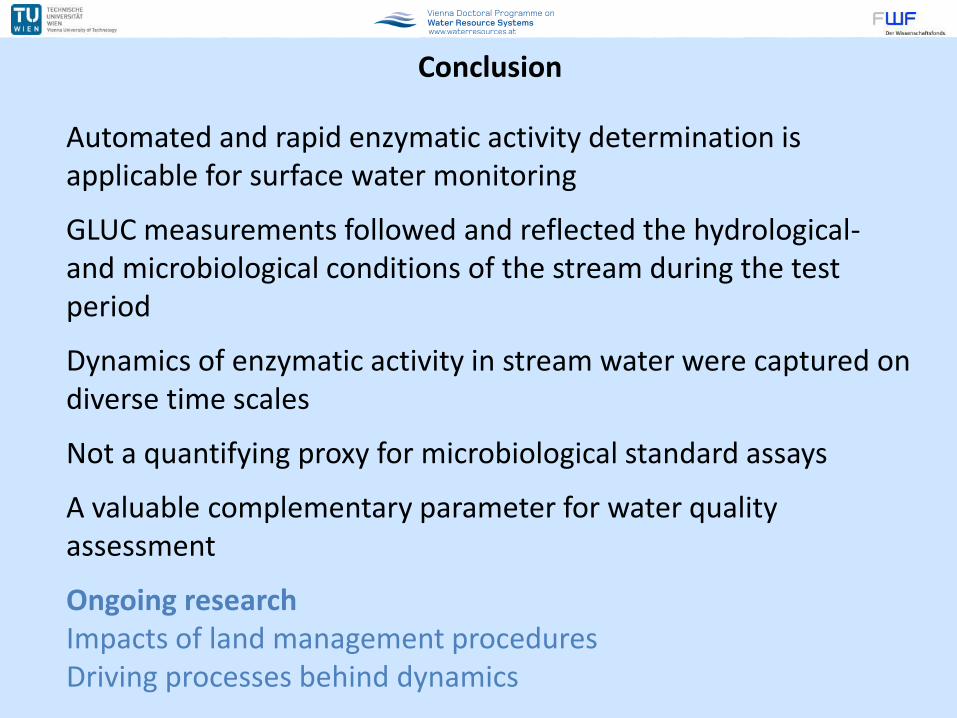
Conclusion
Automated and rapid enzymatic activity determination is applicable for surface water monitoring
GLUC measurements followed and reflected the hydrological-and microbiological conditions of the stream during the test period
Dynamics of enzymatic activity in stream water were captured on diverse time scales
Not a quantifying proxy for microbiological standard assays
A valuable complementary parameter for water quality assessment
Ongoing researchImpacts of land management proceduresDriving processes behind dynamics
Thank you !

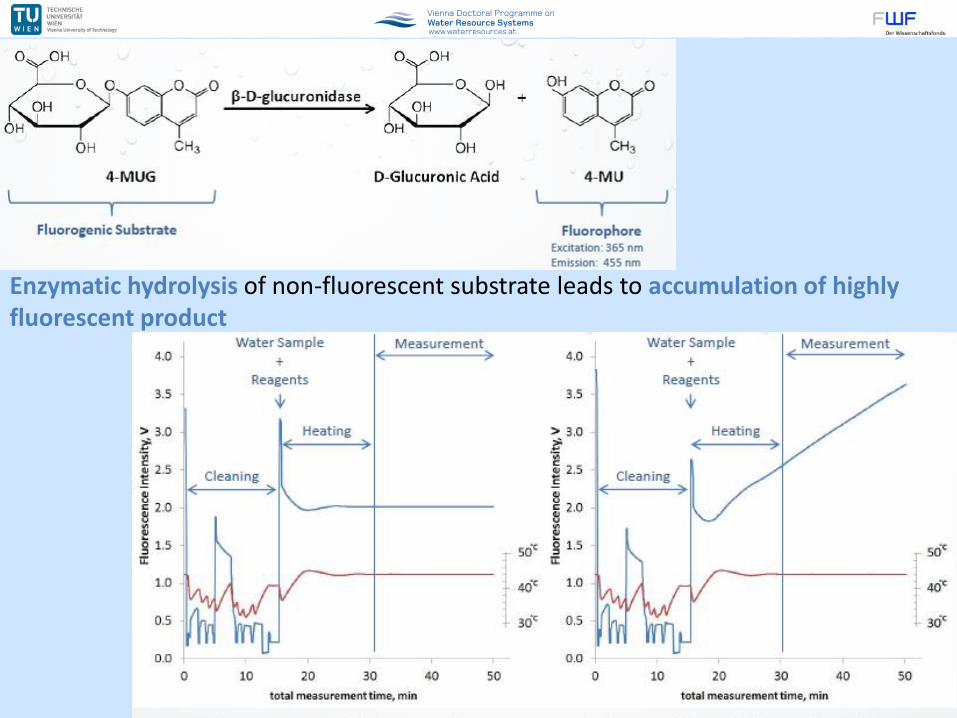
Enzymatic hydrolysis of non-fluorescent substrate leads to accumulation of highly fluorescent product

[FNU]