dynamics of deep soil moisture in response to vegetational restoration on the loess plateau of china
TRANSCRIPT

Journal of Hydrology 519 (2014) 523–531
Contents lists available at ScienceDirect
Journal of Hydrology
journal homepage: www.elsevier .com/ locate / jhydrol
Dynamics of deep soil moisture in response to vegetational restorationon the Loess Plateau of China
http://dx.doi.org/10.1016/j.jhydrol.2014.07.0430022-1694/� 2014 Published by Elsevier B.V.
⇑ Corresponding author. Tel.: +86 10 64889270.E-mail addresses: [email protected] (M.-A. Shao), [email protected]
(Y.-H. Jia) .
Yu-Hua Jia a,b, Ming-An Shao c,⇑a Shenyang Agricultural University, Shenyang 110866, Liaoning, Chinab Key Laboratory of Ecosystem Network Observation and Modeling, Institute of Geographic Sciences and Natural Resources Research, Chinese Academy of Sciences, Beijing100101, Chinac State Key Laboratory of Soil Erosion and Dryland Farming on the Loess Plateau, Northwest A&F University, Yangling 712100, China
a r t i c l e i n f o s u m m a r y
Article history:Received 20 November 2013Received in revised form 8 July 2014Accepted 19 July 2014Available online 28 July 2014This manuscript was handled byKonstantine P. Georgakakos, Editor-in-Chief,with the assistance of Venkat Lakshmi,Associate Editor
Keywords:Runoff plotGrain for GreenSpatial patternVolumetric soil water contentSpatiotemporal variation
The limitation of soil water in semiarid regions restricts the formation of a good cover of vegetation. TheLoess Plateau in China, well known for its severe soil erosion, has a thick loessial soil that holds substan-tial volumes of water and provides the basis of a sustainable restoration of vegetation. Our limited under-standing of the dynamics of deep soil moisture, however, could lead to the mismanagement of soil–waterresources or could even misguide the policies of vegetational reconstruction. To evaluate the temporalresponse of deep soil moisture in different types of revegetation, we observed soil moisture to a depthof 340 cm in four plots, planted with Korshinsk peashrub (KOP), purple alfalfa (ALF), native plants(natural fallow, NAF), and millet (MIL), on 15 measurement events from 2010 to 2012. Our analysis pro-vided four main conclusions. (1) The quantitative difference of potential evapotranspiration and actualprecipitation resulted in natural deficits of soil moisture. The dynamics of deep soil moisture, however,were mainly dominated by the type of vegetation. Deep soils in plots of KOP and ALF became drier thanthe soil in plots of NAF and MIL. (2) Deep soil moisture in KOP and ALF was weakly variable. Correlationsof time series of soil moisture between the upper and lower layers tended not to be significant. Dried soillayer, a special hydrological phenomenon, had formed in the plots. (3) The correlation between variancesof soil moisture and the corresponding mean values were not always significantly positive due to theinfluence of vegetational type, observational depth, and date. (4) Fallow may be the best cover forachieving adequate hydrological sustainability of the soil. These results are expected to help improvethe understanding of the response of deep soil moisture to vegetational restoration and to provide insightinto the dynamics of deep soil moisture influenced by vegetation on loessial slopes.
� 2014 Published by Elsevier B.V.
1. Introduction
Soil water is a significant component of the terrestrial waterresource, particularly in semiarid regions of the world such asthe Loess Plateau of China where groundwater is buried belowthe thick unsaturated loessial soil (Atsushi Tsunekawa et al.,2014; Li, 2001), and concentrated precipitation is excessivelywasted in the form of overland flow (Yang, 2001; Yu, 1992).
The national Grain for Green project was initiated in 1999 tocontrol soil erosion and ecosystemic degradation. The LoessPlateau mainly has a semi-arid climate and a very fragile ecosys-tem due to its infamous erosion. As a prioritized pilot region forthe project (Feng et al., 2013), the Loess Plateau has converted
much agricultural land to other uses during the past few decades.For example, Ansai county has substantially increased its forestedland at the cost of both cropland and shrubland (Fu et al., 2006;Zhou et al., 2012). Various types of vegetational restoration havebeen applied across the different geomorphic units, especially onthe loessial slopes common among the widely distributed deepgullies. The effectiveness of vegetational restoration is generallyrestricted by climatic, pedological, hydrological, and topographicfactors once proper vegetational types have been selected (Caoet al., 2011; Chen et al., 2008). The consequences of large-scaleafforestation have been associated with an increased severity ofwater shortages (Cao et al., 2009). At present, some nonnativeplants such as peashrub and alfalfa have been introduced (Yanget al., 2012b) and cover a large area of the region. Assessments ofthe impacts of vegetational restoration on soil–water resources,which generally require long-term observation however, have

524 Y.-H. Jia, M.-A. Shao / Journal of Hydrology 519 (2014) 523–531
been neglected. Information on the dynamics of soil moistureneeded for vegetational restoration is essential for managing thewater resources and would be helpful for adjusting relevantgovernmental policies.
The quantity of the soil–water resources depends to a largeextent on soil depth, especially the subjectively investigateddepths. Agronomic, hydrological, pedological, and environmentalstudies have tended to focus on soil water in the shallow layers(Famiglietti et al., 1998; Gao and Shao, 2012; Poesen et al., 1990;Tombul, 2007; Wang et al., 2013; Zhu et al., 2014; Zhu et al.,2009). Soil water in deeper layers has largely been ignored dueto the high cost of labor and time required for such investigation.Water resources in deep soil profiles are relatively stable for vege-tational growth due to the insulating effect of the upper soil (Wanget al., 2012b). Perennial plants may extend their root systems intopreviously unexplored depths of the soil where the total availablewater may be greater. When soil moisture is below field capacity,the adaptive strategy of the root systems of perennial plants toacquire deep soil water facilitates the increase of actual evapo-transpiration and the decrease of deep drainage (Eilers et al., 2007).
Water resources can be used differently in the various soil lay-ers. For example, Wang et al. (2012b) found that the levels and pat-terns of distribution of soil moisture in the soil profile differednotably among three types of vegetation (forest, grassland, andfarmland) due to differences in the distribution of root systems,the characteristics of transpiration, and the amounts of watertaken up by roots. Large spatial variation in deep soil moisturemay thus be induced by vegetational consumption (Yang et al.,2012a). On the western Loess Plateau, deficits of deep soil moisturehave appeared in various areas with introduced vegetation (Yanget al., 2012b). When dried soil layers form, deep soil water can onlybe fully replenished on rare occasions (Liu et al., 2010). The func-tions or effects of deep soil water are much more than the state-ment above. For example, the unique water conditions in thedeep soil profile of active sand dunes may be associated withthe protection of soil seed banks (Liu et al., 2007). Additionally,the movement of soil water into the deep unsaturated layers iscoupled with the migration of the soluble portion of decomposedorganic matter from the top 10 cm of soil (Corvasce et al., 2006).Water resources in deep soil profiles thus play an important rolein ensuring a well-established cover of vegetation in semiaridregions, and understanding the response of deep soil moisture tovegetational restoration is essential for estimating the productivityand sustainability of semiarid ecosystems.
To investigate the response of the dynamics of deep soil mois-ture to vegetational restoration, four adjacent experimental plotswith different vegetational types were selected for observation.The experiment was conducted at the Shenmu Erosion andEnvironment Research Station on the Loess Plateau of China. Thisstudy presents the dynamics of soil moisture to a depth of340 cm, correlations among time series, and the relationshipbetween variability and means.
2. Materials and methods
2.1. Site and data description
This study was conducted on a loessial slope in the Liudaogoucatchment of Shenmu County in Shannxi Province, China. The Liu-daogou catchment lies within 38�460–38�510N and 110�210–110�230E in a transitional belt between the Loess Plateau and theMu Us desert. It is dominated by a semiarid and temperate conti-nental climate and has an annual mean temperature of 8.4 �Cand monthly mean temperatures of �9.7 �C in January and23.7 �C in July. The mean annual precipitation is 437 mm, 70% ofwhich occurs from June to September. The soils are Loessial
(10.7%), Castanozems (32.0%), Skeletal (35.9%), and Aeolian(13.5%), which belong to the major soil orders of Regosols, Cambi-sols, Chernozems, and Arenosols, respectively (Wei et al., 2013).
Four adjacent well-established plots on the loessial slope wereselected (Jia et al., 2013). Each plot was 5 � 61 m and containedone of four vegetational types: Korshinsk peashrub (KOP), purplealfalfa (ALF), natural fallow (NAF), and millet (MIL). The uniformconditions of slope gradient (12–14�), aspect (northwest), soil type(Aeolian loess), soil texture (loamy), and layout of neutron accesstubes (11 positions in each plot at 5-m intervals along the midline)ensured that differences in mean soil moisture at the same depthamong these four plots could only be attributed to the effect ofthe vegetation. The layout of the experimental plots and otherbackground information are described elsewhere (Fu et al., 2009;Jia et al., 2013; Jia and Shao, 2013).
We measured soil moisture at various positions and depths ineach plot using neutron probes (CNC503DR, China) from July2010 to July 2012. The designed depth interval was 10 cm in theupper 100 cm of soil and 20 cm in layers deeper than 100 cm. Mea-surement frequency was once a month from July to October 2010,April to October 2011, and in May and July 2012 and twice a monthin June 2012. The soil moisture is relatively stable outside thegrowing season due to limited precipitation and evapotranspira-tion, so data for soil moisture were not collected for these periods.
2.2. Methods of analysis
Volumetric soil-moisture data (cm3 cm�3 or%) for depths of10–340 cm were used in this study. The plot average at time jand depth k, �hj;k, is thus calculated as:
�hj;k ¼1Ni
XNi
i¼1
hi;j;k ð1Þ
where hi,j,k is the soil moisture at position i, depth k, and time j, andNi is the number of measurement positions at each depth (11). Attime j, the depth-averaged soil moisture of a plot is:
�hj ¼1
Nk � Ni
XNk
k¼10
XNi
i¼1
hi;j;k ð2Þ
where Nk is the number of measurement depths at each position(22, k = 10 cm, 20 cm,. . ., 100 cm, 120 cm,. . ., 340 cm). The varianceof soil moisture at time j and depth k is:
s2 ¼ 1Nk � 1
XNk
k¼10
ð�hk;j � �hjÞ2 ð3Þ
The temporal-averaged soil moisture at depth k of a plot iscalculated as:
�hk ¼1
Nj � Ni
XNj
j¼1
XNi
i¼1
hi;j;k ð4Þ
where Nj is the total number of observational times (15). Thecorresponding variance of soil moisture at depth k and time j is:
s2 ¼ 1Nj � 1
XNk
k¼10
ð�hk;j � �hkÞ2 ð5Þ
We calculated the coefficient of variation (CV, the ratio ofthe standard deviation to the mean) for the temporal-averaged soilmoisture at each depth in each plot. Low variability correspondedto values between 0 and 0.1, medium variability corresponded tovalues between 0.1 and 1, and high variability corresponded tovalues larger than 1.
Y.-H. Jia, M.-A. Shao / Journal of Hydrology 519 (2014) 523–531 525
Linear correlations of the variances and mean values at differentdepths and measured events, and the Pearson correlationsbetween time series of soil moisture at each depth, were calculatedusing SPSS statistical software.
Daily meteorological data from January 2010 to September2012 from the Shenmu national weather station were used tocalculate the potential evapotranspiration at a scale larger thanthe plots. Potential evapotranspiration is a compound meteorolog-ical index, which is calculated with Penman–Monteith methods(Allen et al., 1998).
3. Results
3.1. Dynamics of areal potential evapotranspiration
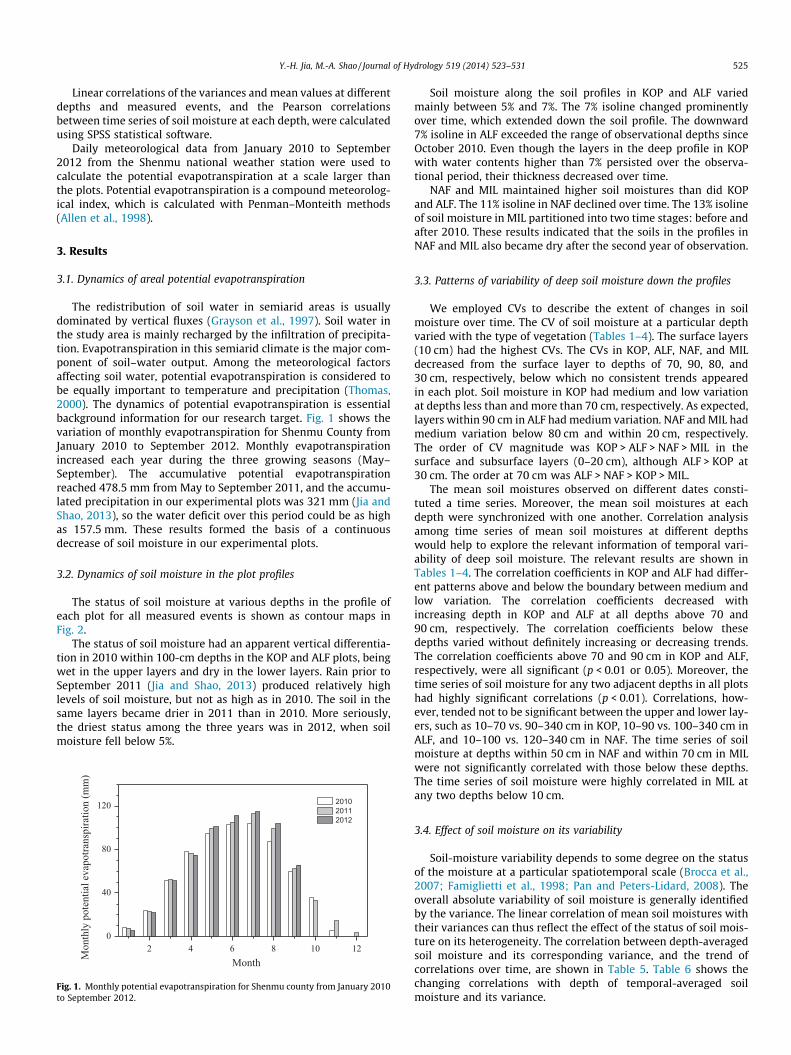
The redistribution of soil water in semiarid areas is usuallydominated by vertical fluxes (Grayson et al., 1997). Soil water inthe study area is mainly recharged by the infiltration of precipita-tion. Evapotranspiration in this semiarid climate is the major com-ponent of soil–water output. Among the meteorological factorsaffecting soil water, potential evapotranspiration is considered tobe equally important to temperature and precipitation (Thomas,2000). The dynamics of potential evapotranspiration is essentialbackground information for our research target. Fig. 1 shows thevariation of monthly evapotranspiration for Shenmu County fromJanuary 2010 to September 2012. Monthly evapotranspirationincreased each year during the three growing seasons (May–September). The accumulative potential evapotranspirationreached 478.5 mm from May to September 2011, and the accumu-lated precipitation in our experimental plots was 321 mm (Jia andShao, 2013), so the water deficit over this period could be as highas 157.5 mm. These results formed the basis of a continuousdecrease of soil moisture in our experimental plots.
3.2. Dynamics of soil moisture in the plot profiles
The status of soil moisture at various depths in the profile ofeach plot for all measured events is shown as contour maps inFig. 2.
The status of soil moisture had an apparent vertical differentia-tion in 2010 within 100-cm depths in the KOP and ALF plots, beingwet in the upper layers and dry in the lower layers. Rain prior toSeptember 2011 (Jia and Shao, 2013) produced relatively highlevels of soil moisture, but not as high as in 2010. The soil in thesame layers became drier in 2011 than in 2010. More seriously,the driest status among the three years was in 2012, when soilmoisture fell below 5%.
2 4 6 8 10 120
40
80
120
Mon
thly
pot
entia
l eva
potra
nspi
ratio
n (m
m)
Month
201020112012
Fig. 1. Monthly potential evapotranspiration for Shenmu county from January 2010to September 2012.
Soil moisture along the soil profiles in KOP and ALF variedmainly between 5% and 7%. The 7% isoline changed prominentlyover time, which extended down the soil profile. The downward7% isoline in ALF exceeded the range of observational depths sinceOctober 2010. Even though the layers in the deep profile in KOPwith water contents higher than 7% persisted over the observa-tional period, their thickness decreased over time.
NAF and MIL maintained higher soil moistures than did KOPand ALF. The 11% isoline in NAF declined over time. The 13% isolineof soil moisture in MIL partitioned into two time stages: before andafter 2010. These results indicated that the soils in the profiles inNAF and MIL also became dry after the second year of observation.
3.3. Patterns of variability of deep soil moisture down the profiles
We employed CVs to describe the extent of changes in soilmoisture over time. The CV of soil moisture at a particular depthvaried with the type of vegetation (Tables 1–4). The surface layers(10 cm) had the highest CVs. The CVs in KOP, ALF, NAF, and MILdecreased from the surface layer to depths of 70, 90, 80, and30 cm, respectively, below which no consistent trends appearedin each plot. Soil moisture in KOP had medium and low variationat depths less than and more than 70 cm, respectively. As expected,layers within 90 cm in ALF had medium variation. NAF and MIL hadmedium variation below 80 cm and within 20 cm, respectively.The order of CV magnitude was KOP > ALF > NAF > MIL in thesurface and subsurface layers (0–20 cm), although ALF > KOP at30 cm. The order at 70 cm was ALF > NAF > KOP > MIL.
The mean soil moistures observed on different dates consti-tuted a time series. Moreover, the mean soil moistures at eachdepth were synchronized with one another. Correlation analysisamong time series of mean soil moistures at different depthswould help to explore the relevant information of temporal vari-ability of deep soil moisture. The relevant results are shown inTables 1–4. The correlation coefficients in KOP and ALF had differ-ent patterns above and below the boundary between medium andlow variation. The correlation coefficients decreased withincreasing depth in KOP and ALF at all depths above 70 and90 cm, respectively. The correlation coefficients below thesedepths varied without definitely increasing or decreasing trends.The correlation coefficients above 70 and 90 cm in KOP and ALF,respectively, were all significant (p < 0.01 or 0.05). Moreover, thetime series of soil moisture for any two adjacent depths in all plotshad highly significant correlations (p < 0.01). Correlations, how-ever, tended not to be significant between the upper and lower lay-ers, such as 10–70 vs. 90–340 cm in KOP, 10–90 vs. 100–340 cm inALF, and 10–100 vs. 120–340 cm in NAF. The time series of soilmoisture at depths within 50 cm in NAF and within 70 cm in MILwere not significantly correlated with those below these depths.The time series of soil moisture were highly correlated in MIL atany two depths below 10 cm.
3.4. Effect of soil moisture on its variability
Soil-moisture variability depends to some degree on the statusof the moisture at a particular spatiotemporal scale (Brocca et al.,2007; Famiglietti et al., 1998; Pan and Peters-Lidard, 2008). Theoverall absolute variability of soil moisture is generally identifiedby the variance. The linear correlation of mean soil moistures withtheir variances can thus reflect the effect of the status of soil mois-ture on its heterogeneity. The correlation between depth-averagedsoil moisture and its corresponding variance, and the trend ofcorrelations over time, are shown in Table 5. Table 6 shows thechanging correlations with depth of temporal-averaged soilmoisture and its variance.

11%
9%
9%11%11%
13%
7%13%
13%
9%
320
280
240
200
160
120
80
40
5%13%
7%11%9%
7%
7%
5%
320
280
240
200
160
120
80
409%
7%
7%
11%5%
5% 7% 9% 11% 13% 15% 17% 19% 21%(b)
13%
13%
11%
13%
13%
13%
11%
11%
11% 11%
13%
11%11% 11%
Soi
l dep
th (
cm)
(a)
(c) (d)
Volumetric soil moisture (%)
07/1
3/12
06/0
4/12
10/1
4/11
08/1
0/11
06/1
2/11
04/1
0/11
09/2
2/10
07/2
2/10
06/1
9/12
05/1
4/12
09/1
7/11
07/1
8/11
05/1
2/11
10/1
6/10
08/3
1/10
07/1
3/12
06/0
4/12
10/1
4/11
08/1
0/11
06/1
2/11
04/1
0/11
09/2
2/10
07/2
2/10
06/1
9/12
05/1
4/12
09/1
7/11
07/1
8/11
05/1
2/11
10/1
6/10
08/3
1/10
Fig. 2. The vertical distribution and temporal dynamics of soil moisture for plots under (a) KOP (Korshinsk peashrub), (b) ALF (purple alfalfa), (c) NAF (natural fallow), and (d)MIL (millet).
Table 1Variation coefficients (CV) and Pearson correlation of time series for soil moisture (%, V/V) in KOP (Korshinsk peashrub) plot.
Depth(cm)
10 20 30 40 50 60 70 80 90 100 120 140 160 180 200 220 240 260 280 300 320 340
Mean(%)
9.25 7.44 7.37 7.14 6.69 6.35 5.96 5.79 5.70 5.85 5.93 6.12 6.12 6.45 6.64 6.85 6.91 7.18 7.37 7.45 7.60 8.00
CV 0.67 0.54 0.44 0.35 0.29 0.21 0.14 0.08 0.07 0.07 0.06 0.07 0.07 0.06 0.06 0.07 0.06 0.07 0.07 0.07 0.07 0.09
10 0.98⁄⁄ 0.93⁄⁄ 0.85⁄⁄ 0.72⁄⁄ 0.65⁄⁄ 0.60⁄ 0.48 0.19 0.19 0.18 �0.01 �0.03 �0.05 0.17 0.11 0.15 0.21 0.33 0.25 0.39 0.4720 0.98⁄⁄ 0.91⁄⁄ 0.80⁄⁄ 0.73⁄⁄ 0.69⁄⁄ 0.56⁄ 0.24 0.25 0.24 0.08 �0.01 0.02 0.23 0.17 0.19 0.28 0.39 0.29 0.43 0.52⁄
30 0.97⁄⁄ 0.89⁄⁄ 0.84⁄⁄ 0.78⁄⁄ 0.62⁄ 0.26 0.25 0.23 0.09 �0.01 0.03 0.24 0.16 0.19 0.28 0.40 0.30 0.42 0.52⁄
40 0.96⁄⁄ 0.92⁄⁄ 0.83⁄⁄ 0.62⁄ 0.23 0.16 0.16 0.00 �0.07 �0.01 0.16 0.09 0.13 0.21 0.32 0.24 0.33 0.4350 0.98⁄⁄ 0.86⁄⁄ 0.68⁄⁄ 0.27 0.15 0.13 �0.02 �0.06 �0.01 0.13 0.04 0.12 0.19 0.29 0.25 0.28 0.3860 0.90⁄⁄ 0.72⁄⁄ 0.31 0.18 0.18 0.01 �0.03 0.02 0.13 0.03 0.13 0.19 0.31 0.29 0.30 0.3870 0.89⁄⁄ 0.57⁄ 0.41 0.39 0.19 0.13 0.23 0.28 0.28 0.31 0.37 0.47 0.47 0.47 0.52⁄
80 0.76⁄⁄ 0.69⁄⁄ 0.64⁄ 0.49 0.43 0.45 0.54⁄ 0.47 0.50 0.59⁄ 0.65⁄⁄ 0.68⁄⁄ 0.63⁄ 0.67⁄⁄
90 0.88⁄⁄ 0.87⁄⁄ 0.73⁄⁄ 0.80⁄⁄ 0.81⁄⁄ 0.79⁄⁄ 0.81⁄⁄ 0.82⁄⁄ 0.82⁄⁄ 0.84⁄⁄ 0.91⁄⁄ 0.85⁄⁄ 0.81⁄⁄
100 0.93⁄⁄ 0.93⁄⁄ 0.88⁄⁄ 0.89⁄⁄ 0.92⁄⁄ 0.89⁄⁄ 0.89⁄⁄ 0.91⁄⁄ 0.86⁄⁄ 0.88⁄⁄ 0.88⁄⁄ 0.84⁄⁄
120 0.86⁄⁄ 0.82⁄⁄ 0.90⁄⁄ 0.87⁄⁄ 0.88⁄⁄ 0.87⁄⁄ 0.94⁄⁄ 0.87⁄⁄ 0.92⁄⁄ 0.90⁄⁄ 0.86⁄⁄
140 0.85⁄⁄ 0.86⁄⁄ 0.91⁄⁄ 0.84⁄⁄ 0.81⁄⁄ 0.86⁄⁄ 0.83⁄⁄ 0.79⁄⁄ 0.79⁄⁄ 0.76⁄⁄
160 0.84⁄⁄ 0.94⁄⁄ 0.83⁄⁄ 0.89⁄⁄ 0.81⁄⁄ 0.78⁄⁄ 0.84⁄⁄ 0.81⁄⁄ 0.74⁄⁄
180 0.83⁄⁄ 0.95⁄⁄ 0.89⁄⁄ 0.89⁄⁄ 0.77⁄⁄ 0.81⁄⁄ 0.81⁄⁄ 0.74⁄⁄
200 0.88⁄⁄ 0.90⁄⁄ 0.89⁄⁄ 0.86⁄⁄ 0.86⁄⁄ 0.88⁄⁄ 0.85⁄⁄
220 0.94⁄⁄ 0.92⁄⁄ 0.82⁄⁄ 0.85⁄⁄ 0.88⁄⁄ 0.82⁄⁄
240 0.93⁄⁄ 0.87⁄⁄ 0.93⁄⁄ 0.94⁄⁄ 0.87⁄⁄
260 0.91⁄⁄ 0.94⁄⁄ 0.93⁄⁄ 0.93⁄⁄
280 0.94⁄⁄ 0.94⁄⁄ 0.93⁄⁄
300 0.96⁄⁄ 0.94⁄⁄
320 0.97⁄⁄
⁄ and ⁄⁄ Stand for significance level less than 0.05 and 0.01, respectively.
526 Y.-H. Jia, M.-A. Shao / Journal of Hydrology 519 (2014) 523–531
The correlation between depth-averaged soil moisture and itscorresponding variance depended on the date of observation andtype of revegetation. For example, the correlations in KOP deter-mined on six dates (22 September and 16 October 2010; 10 April,12 May, and 18 July 2011; and 14 May 2012) were significantlypositive (p < 0.01). The significant correlations were positive on
most occasions in all plots. This result indicated that the varianceof soil moisture tended to increase with increasing soil moisture.Significantly positive correlations observed between temporal-averaged soil moistures and the corresponding variances weremainly at depths within 100 cm (Table 2). Such positive correla-tions appeared at ten depths in NAF but at only two depths in MIL.

Table 2Variation coefficient (CV) and Pearson correlation of time series for soil moisture (%, V/V) in ALF (purple alfalfa) plot.
Depth(cm)
10 20 30 40 50 60 70 80 90 100 120 140 160 180 200 220 240 260 280 300 320 340
Mean (%) 10.11 8.32 8.83 8.71 8.43 8.01 7.43 6.79 6.63 6.45 6.58 6.49 6.45 6.54 6.51 6.57 6.59 6.64 6.59 6.69 6.91 6.90CV 0.59 0.50 0.44 0.39 0.34 0.29 0.23 0.18 0.13 0.10 0.08 0.06 0.07 0.06 0.04 0.06 0.07 0.05 0.07 0.06 0.07 0.06
10 0.98⁄⁄ 0.95⁄⁄ 0.92⁄⁄ 0.87⁄⁄ 0.80⁄⁄ 0.81⁄⁄ 0.73⁄⁄ 0.62⁄ 0.47 0.19 0.06 0.04 �0.11 �0.21 �0.07 �0.03 0.27 �0.06 0.06 0.23 0.1320 0.98⁄⁄ 0.96⁄⁄ 0.92⁄⁄ 0.86⁄⁄ 0.87⁄⁄ 0.76⁄⁄ 0.64⁄ 0.47 0.21 0.12 0.08 �0.06 �0.16 0.00 0.05 0.32 0.00 0.13 0.29 0.1630 0.99⁄⁄ 0.97⁄⁄ 0.91⁄⁄ 0.91⁄⁄ 0.78⁄⁄ 0.65⁄⁄ 0.46 0.25 0.18 0.15 �0.01 �0.11 0.07 0.11 0.36 0.09 0.20 0.35 0.2240 0.99⁄⁄ 0.95⁄⁄ 0.95⁄⁄ 0.82⁄⁄ 0.69⁄⁄ 0.48 0.26 0.19 0.14 �0.02 �0.11 0.05 0.10 0.31 0.08 0.19 0.33 0.2050 0.99⁄⁄ 0.98⁄⁄ 0.86⁄⁄ 0.72⁄⁄ 0.51 0.31 0.22 0.16 0.02 �0.09 0.05 0.12 0.30 0.11 0.23 0.35 0.2360 0.99⁄⁄ 0.91⁄⁄ 0.78⁄⁄ 0.57⁄ 0.37 0.25 0.17 0.03 �0.08 0.02 0.11 0.24 0.10 0.21 0.31 0.2170 0.94⁄⁄ 0.82⁄⁄ 0.63⁄ 0.39 0.25 0.17 0.03 �0.07 0.01 0.11 0.23 0.08 0.19 0.29 0.1880 0.96⁄⁄ 0.83⁄⁄ 0.56⁄ 0.34 0.24 0.12 0.02 0.00 0.17 0.18 0.10 0.22 0.29 0.2190 0.93⁄⁄ 0.71⁄⁄ 0.48 0.36 0.29 0.19 0.11 0.30 0.23 0.17 0.30 0.35 0.29100 0.81⁄⁄ 0.58⁄ 0.47 0.44 0.37 0.23 0.39 0.29 0.25 0.35 0.38 0.35120 0.90⁄⁄ 0.84⁄⁄ 0.81⁄⁄ 0.73⁄⁄ 0.65⁄⁄ 0.73⁄⁄ 0.65⁄⁄ 0.66⁄⁄ 0.69⁄⁄ 0.69⁄⁄ 0.72⁄⁄
140 0.93⁄⁄ 0.94⁄⁄ 0.89⁄⁄ 0.88⁄⁄ 0.90⁄⁄ 0.82⁄⁄ 0.79⁄⁄ 0.831⁄⁄ 0.83⁄⁄ 0.832⁄⁄
160 0.93⁄⁄ 0.88⁄⁄ 0.90⁄⁄ 0.913⁄⁄ 0.80⁄⁄ 0.89⁄⁄ 0.86⁄⁄ 0.90⁄⁄ 0.92⁄⁄
180 0.93⁄⁄ 0.90⁄⁄ 0.93⁄⁄ 0.74⁄⁄ 0.85⁄⁄ 0.90⁄⁄ 0.84⁄⁄ 0.85⁄⁄
200 0.92⁄⁄ 0.91⁄⁄ 0.73⁄⁄ 0.83⁄⁄ 0.79⁄⁄ 0.79⁄⁄ 0.82⁄⁄
220 0.92⁄⁄ 0.87⁄⁄ 0.85⁄⁄ 0.82⁄⁄ 0.86⁄⁄ 0.84⁄⁄
240 0.76⁄⁄ 0.88⁄⁄ 0.92⁄⁄ 0.91⁄⁄ 0.88⁄⁄
260 0.75⁄⁄ 0.74⁄⁄ 0.84⁄⁄ 0.83⁄⁄
280 0.91⁄⁄ 0.92⁄⁄ 0.92⁄⁄
300 0.94⁄⁄ 0.91⁄⁄
320 0.97⁄⁄
⁄ and ⁄⁄ Stand for significance level less than 0.05 and 0.01, respectively.
Table 3Variation coefficient (CV) and Pearson correlation of time series for soil moisture (%, V/V) in NAF (natural fallow) plot.
Depth(cm)
10 20 30 40 50 60 70 80 90 100 120 140 160 180 200 220 240 260 280 300 320 340
Mean (%) 10.43 9.43 9.91 10.05 9.93 9.99 10.14 10.11 10.13 10.22 10.21 10.32 10.62 11.13 11.00 10.96 11.17 11.37 11.31 11.19 11.82 12.45CV 0.46 0.33 0.26 0.23 0.20 0.19 0.18 0.15 0.14 0.13 0.12 0.12 0.12 0.10 0.12 0.10 0.11 0.10 0.10 0.09 0.08 0.11
10 0.91⁄⁄ 0.74⁄⁄ 0.67⁄⁄ 0.56⁄ 0.50 0.31 0.26 0.14 0.02 �0.13 �0.14 �0.17 0.08 �0.14 �0.12 �0.11 �0.08 �0.03 �0.08 0.04 �0.1420 0.94⁄⁄ 0.90⁄⁄ 0.83⁄⁄ 0.78⁄⁄ 0.64⁄ 0.56⁄ 0.41 0.31 0.11 0.07 0.04 0.17 0.12 0.07 0.08 0.13 0.18 0.11 0.18 0.0430 0.98⁄⁄ 0.94⁄⁄ 0.91⁄⁄ 0.83⁄⁄ 0.74⁄⁄ 0.60⁄ 0.53⁄ 0.31 0.25 0.21 0.24 0.33 0.22 0.24 0.30 0.35 0.27 0.27 0.1940 0.98⁄⁄ 0.95⁄⁄ 0.89⁄⁄ 0.80⁄⁄ 0.65⁄⁄ 0.58⁄ 0.32 0.24 0.21 0.18 0.32 0.20 0.23 0.27 0.32 0.24 0.24 0.1650 0.99⁄⁄ 0.94⁄⁄ 0.89⁄⁄ 0.75⁄⁄ 0.67⁄⁄ 0.42 0.33 0.30 0.21 0.37 0.28 0.31 0.32 0.35 0.29 0.29 0.2260 0.96⁄⁄ 0.93⁄⁄ 0.81⁄⁄ 0.73⁄⁄ 0.51 0.42 0.40 0.27 0.43 0.36 0.40 0.38 0.40 0.35 0.35 0.2870 0.93⁄⁄ 0.83⁄⁄ 0.79⁄⁄ .575⁄ 0.48 0.45 0.22 0.50 0.37 0.42 0.41 0.43 0.38 0.33 0.3380 0.95⁄⁄ 0.88⁄⁄ .691⁄⁄ 0.56⁄ 0.52⁄ 0.29 0.51 0.42 0.49 0.44 0.40 0.35 0.34 0.3290 .96⁄⁄ 0.814⁄⁄ 0.69⁄⁄ 0.61⁄ 0.40 0.61⁄ 0.49 0.56⁄ 0.52⁄ 0.47 0.41 0.35 0.38100 0.838⁄⁄ 0.73⁄⁄ 0.65⁄⁄ 0.44 0.68⁄⁄ 0.51 0.57⁄ 0.55⁄ 0.53⁄ 0.46 0.32 0.42120 0.95⁄⁄ 0.91⁄⁄ 0.754⁄⁄ 0.88⁄⁄ 0.82⁄⁄ 0.85⁄⁄ 0.85⁄⁄ 0.78⁄⁄ 0.74⁄⁄ 0.68⁄⁄ 0.78⁄⁄
140 0.97⁄⁄ 0.87⁄⁄ 0.94⁄⁄ 0.93⁄⁄ 0.95⁄⁄ 0.93⁄⁄ 0.89⁄⁄ 0.89⁄⁄ 0.81⁄⁄ 0.87⁄⁄
160 0.85⁄⁄ 0.92⁄⁄ 0.94⁄⁄ 0.95⁄⁄ 0.93⁄⁄ 0.87⁄⁄ 0.89⁄⁄ 0.85⁄⁄ 0.89⁄⁄
180 0.83⁄⁄ 0.92⁄⁄ 0.88⁄⁄ 0.91⁄⁄ 0.90⁄⁄ 0.89⁄⁄ 0.88⁄⁄ 0.89⁄⁄
200 0.91⁄⁄ 0.90⁄⁄ 0.97⁄⁄ 0.95⁄⁄ 0.92⁄⁄ 0.80⁄⁄ 0.88⁄⁄
220 0.97⁄⁄ 0.97⁄⁄ 0.94⁄⁄ 0.96⁄⁄ 0.95⁄⁄ 0.95⁄⁄
240 0.93⁄⁄ 0.90⁄⁄ 0.94⁄⁄ 0.91⁄⁄ 0.89⁄⁄
260 0.97⁄⁄ 0.96⁄⁄ 0.91⁄⁄ 0.95⁄⁄
280 0.97⁄⁄ 0.89⁄⁄ 0.94⁄⁄
300 0.93⁄⁄ 0.94⁄⁄
320 0.92⁄⁄
⁄ and ⁄⁄ Stand for significance level less than 0.05 and 0.01, respectively.
Y.-H. Jia, M.-A. Shao / Journal of Hydrology 519 (2014) 523–531 527
4. Discussion
4.1. Dialectical analysis of the effects of vegetational restoration
Vegetational restoration can substantially promote the preven-tion of soil erosion (Deng et al., 2012). It is considered that thesevere erosion status of Loess Plateau has changed into slight ero-sion since vegetational restoration associated with Grain for Greenproject is implemented (Sun et al., 2014). Four runoff plots in ourstudy had adopted revegetation measures for seven years priorto 2010. During the experimental period, erosion from runoff inresponse to rainstorms occurred only in MIL. The control of soil
erosion on the loessial slope benefited from revegetation. Thehydrological conditions in the profile, however, may be negativelyaffected in semiarid regions (Cao et al., 2009; Yang et al., 2012b).Neal et al. (2012) reported that some perennial and annual foragecreated soil-moisture deficits when insufficiently irrigated. Culti-vated vegetation on the Loess Plateau has overexploited the soilwater stored in the deep profile (Wang et al., 2008; Wang et al.,2009) and has caused a potential threat to the survival of the veg-etation and the sustainable use of the land (Chen et al., 2008; Junet al., 2008).
Such phenomena attracted the attention of local researchers.Soil water storage within 0–100 cm decreased 49.4, 32.4, and

Table 4Variation coefficient (CV) and Pearson correlation of time series for soil moisture (%, V/V) in MIL (millet) plot.
Depth(cm)
10 20 30 40 50 60 70 80 90 100 120 140 160 180 200 220 240 260 280 300 320 340
Mean (%) 10.27 10.32 11.60 12.00 12.25 12.39 12.61 12.89 12.91 12.73 12.43 12.49 12.67 12.56 12.31 12.29 12.40 12.40 12.28 12.42 12.65 13.01CV 0.39 0.22 0.09 0.09 0.09 0.08 0.09 0.08 0.08 0.08 0.09 0.09 0.09 0.09 0.07 0.09 0.08 0.09 0.10 0.09 0.09 0.07
10 0.95⁄⁄ 0.74⁄⁄ 0.60⁄ 0.56⁄ 0.52⁄ 0.53⁄ 0.51 0.48 0.45 0.45 0.44 0.42 0.41 0.47 0.46 0.44 0.42 0.44 0.43 0.47 0.4720 0.91⁄⁄ 0.81⁄⁄ 0.78⁄⁄ 0.75⁄⁄ 0.76⁄⁄ 0.75⁄⁄ 0.73⁄⁄ 0.70⁄⁄ 0.70⁄⁄ 0.70⁄⁄ 0.67⁄⁄ 0.67⁄⁄ 0.71⁄⁄ 0.71⁄⁄ 0.69⁄⁄ 0.67⁄⁄ 0.69⁄⁄ 0.69⁄⁄ 0.71⁄⁄ 0.71⁄⁄
30 0.97⁄⁄ 0.95⁄⁄ 0.94⁄⁄ 0.93⁄⁄ 0.94⁄⁄ 0.93⁄⁄ 0.91⁄⁄ 0.91⁄⁄ 0.90⁄⁄ 0.89⁄⁄ 0.89⁄⁄ 0.91⁄⁄ 0.91⁄⁄ 0.909⁄⁄ 0.89⁄⁄ 0.90⁄⁄ 0.90⁄⁄ 0.92⁄⁄ 0.92⁄⁄
40 0.99⁄⁄ 0.99⁄⁄ 0.97⁄⁄ 0.98⁄⁄ 0.97⁄⁄ 0.96⁄⁄ 0.96⁄⁄ 0.95⁄⁄ 0.94⁄⁄ 0.94⁄⁄ 0.95⁄⁄ 0.94⁄⁄ 0.953⁄⁄ 0.94⁄⁄ 0.93⁄⁄ 0.94⁄⁄ 0.95⁄⁄ 0.96⁄⁄
50 0.98⁄⁄ 0.98⁄⁄ 0.99⁄⁄ 0.98⁄⁄ 0.97⁄⁄ 0.96⁄⁄ 0.95⁄⁄ 0.94⁄⁄ 0.94⁄⁄ 0.95⁄⁄ 0.94⁄⁄ 0.95⁄⁄ 0.94⁄⁄ 0.92⁄⁄ 0.94⁄⁄ 0.94⁄⁄ 0.96⁄⁄
60 0.99⁄⁄ 0.99⁄⁄ 0.99⁄⁄ 0.98⁄⁄ 0.97⁄⁄ 0.97⁄⁄ 0.97⁄⁄ 0.97⁄⁄ 0.97⁄⁄ 0.96⁄⁄ 0.98⁄⁄ 0.97⁄⁄ 0.96⁄⁄ 0.97⁄⁄ 0.97⁄⁄ 0.98⁄⁄
70 0.99⁄⁄ 0.99⁄⁄ 0.99⁄⁄ 0.98⁄⁄ 0.98⁄⁄ 0.97⁄⁄ 0.97⁄⁄ 0.97⁄⁄ 0.97⁄⁄ 0.97⁄⁄ 0.96⁄⁄ 0.95⁄⁄ 0.97⁄⁄ 0.95⁄⁄ 0.97⁄⁄
80 0.99⁄⁄ 0.99⁄⁄ 0.97⁄⁄ 0.97⁄⁄ 0.96⁄⁄ 0.96⁄⁄ 0.97⁄⁄ 0.97⁄⁄ 0.97⁄⁄ 0.96⁄⁄ 0.95⁄⁄ 0.96⁄⁄ 0.96⁄⁄ 0.98⁄⁄
90 0.99⁄⁄ 0.99⁄⁄ 0.99⁄⁄ 0.98⁄⁄ 0.98⁄⁄ 0.98⁄⁄ 0.984⁄⁄ 0.99⁄⁄ 0.98⁄⁄ 0.97⁄⁄ 0.98⁄⁄ 0.97⁄⁄ 0.98⁄⁄
100 0.99⁄⁄ 0.99⁄⁄ 0.99⁄⁄ 0.98⁄⁄ 0.98⁄⁄ 0.983⁄⁄ 0.98⁄⁄ 0.99⁄⁄ 0.97⁄⁄ 0.98⁄⁄ 0.97⁄⁄ 0.99⁄⁄
120 0.99⁄⁄ 0.99⁄⁄ 0.99⁄⁄ 0.99⁄⁄ 0.992⁄⁄ 0.99⁄⁄ 0.994⁄⁄ 0.99⁄⁄ 0.99⁄⁄ 0.98⁄⁄ 0.99⁄⁄
140 0.99⁄⁄ 0.99⁄⁄ 0.99⁄⁄ 0.99⁄⁄ 0.99⁄⁄ 0.99⁄⁄ 0.99⁄⁄ 0.99⁄⁄ 0.97⁄⁄ 0.99⁄⁄
160 0.995⁄⁄ 0.99⁄⁄ 0.99⁄⁄ 0.99⁄⁄ 0.99⁄⁄ 0.99⁄⁄ 0.99⁄⁄ 0.96⁄⁄ 0.99⁄⁄
180 0.99⁄⁄ 0.99⁄⁄ 0.99⁄⁄ 0.99⁄⁄ 0.99⁄⁄ 0.99⁄⁄ 0.98⁄⁄ 0.99⁄⁄
200 0.99⁄⁄ 0.99⁄⁄ 0.99⁄⁄ 0.99⁄⁄ 0.99⁄⁄ 0.98⁄⁄ 0.99⁄⁄
220 0.99⁄⁄ 0.99⁄⁄ 0.99⁄⁄ 0.99⁄⁄ 0.98⁄⁄ 0.99⁄⁄
240 0.99⁄⁄ 0.99⁄⁄ 0.99⁄⁄ 0.99⁄⁄ 0.99⁄⁄
260 0.99⁄⁄ 0.99⁄⁄ 0.98⁄⁄ 0.99⁄⁄
280 0.99⁄⁄ 0.99⁄⁄ 0.99⁄⁄
300 0.983⁄⁄ 0.99⁄⁄
320 0.99⁄⁄
⁄ and ⁄⁄ Stand for significance level less than 0.05 and 0.01, respectively.
Table 5The linear correlation of depth-averaged soil moisture (x) with its corresponding variance (y) over time.
Date KOP ALF NAF MIL
Linear equation R2 P-value Linear equation R2 P-value Linear equation R2 P-value Linear equation R2 P-value
2010/7/22 y = 0.279 + 0.094x 0.13 0.06 y = 3.096 � 0.324x 0.03 0.569 y = 2.476 + 0.075x 0.04 0.72 y = 23.379 � 1.56x 0.55 <0.0012010/8/31 y = 0.288 + 0.137x 0.02 0.42 y = �3.514 + 0.589x 0.42 0.001 y = �0.709 + 0.316x 0.03 0.56 y = 5.892 � 0.221x 0.03 0.222010/9/22 y = �1.065 + 0.28x 0.79 <0.001 y = �3.736 + 0.677x 0.73 <0.001 y = �1.907 + 0.47x 0.2 0.02 y = �22.766 + 1.963x 0.55 <0.0012010/10/16 y = �3.778 + 0.65x 0.62 <0.001 y = �4.254 + 0.779x 0.31 0.004 y = �56.732 + 5.549x 0.04 0.19 y = 13.108 � 0.798x 0.20 0.022011/4/10 y = �3.529 + 0.711x 0.59 <0.001 y = �3.485 + 0.582x 0.72 <0.001 y = �4.093 + 0.674x 0.01 0.37 y = �7.85 + 0.934x 0.05 0.172011/5/12 y = �10.148 + 1.572x 0.53 <0.001 y = �3.079 + 0.53x 0.74 <0.001 y = �15.276 + 1.603x 0.27 0.01 y = �21.079 + 1.908x 0.48 <0.0012011/6/12 y = 1.387 � 0.071x 0.02 0.43 y = 3.023 + �0.337x 0.11 0.073 y = 0.752 + 0.092x 0.02 0.422011/7/18 y = �0.578 + 0.219x 0.33 <0.001 y = 0.16 + 0.074x 0.04 0.736 y = �11.665 + 1.443x 0.39 <0.001 y = 38.439 � 3.257x 0.32 <0.0012011/8/10 y = 2.31 � 0.249x 0.12 0.06 y = �0.264 + 0.138x 0.02 0.444 y = 1.121 + 0.164x 0.04 0.73 y = 4.451 � 0.199x 0.14 0.052011/9/17 y = 0.05 + 0.159x 0.05 0.16 y = �2.554 + 0.449x 0.73 <0.001 y = 2.407 � 0.005x 0.05 0.97 y = 3.471 � 0.103x 0.05 0.772011/10/14 y = 1.154 � 0.053x 0.04 0.61 y = �1.845 + 0.406x 0.08 0.113 y = �2.806 + 0.519x 0.09 0.09 y = 9.088 � 0.536x 0.10 0.082012/5/14 y = �4.113 + 0.801x 0.55 <0.001 y = �7.843 + 1.35x 0.91 <0.001 y = �8.933 + 1.101x 0.47 <0.001 y = �33.623 + 3.103x 0.24 0.012012/6/4 y = 0.438 + 0.022x 0.04 0.7 y = �0.178 + 0.101x 0.03 0.222 y = 2.479 � 0.058x 0.05 0.81 y = 0.568 + 0.131x 0.04 0.672012/6/19 y = 0.757 � 0.017x 0.04 0.69 y = 0.613 + �0.039x 0.03 0.53 y = 1.201 + 0.148x 0.11 0.07 y = 4.002 � 0.177x 0.00 0.352012/7/13 y = 5.561 � 0.703x 0.2 0.02 y = �5.143 + 1.02x 0.41 0.001 y = 4.797 � 0.274x 0.01 0.38 y = 10.699 � 0.613x 0.01 0.28
KOP, ALF, NAF and MIL stand for the revegetation types of Korshinsk peashrub, purple alfalfa, natural fallow and millet, respectively. R2 stands for the determinationcoefficient of the corresponding linear equation. The bold P-values are significant at levels of 0.01 or 0.05.
528 Y.-H. Jia, M.-A. Shao / Journal of Hydrology 519 (2014) 523–531
14.9 mm in KOP, ALF, and NAF, respectively, relative to MIL in theexperimental period 2010–2011 (Jia and Shao, 2013). Evaporationwas mainly responsible for the loss of water in MIL. The consump-tion of water by the vegetation in KOP, ALF, and NAF was thus thedominant factor in the decrease of soil water storage. The con-sumption of water by vegetation, along with the water deficitinduced by increasing potential evapotranspiration, affected theentire profiles in KOP and ALF (Fig. 2). Moreover, such an influencelikely extended below the depths we investigated. For example, thedepletion of water by Korshinsk peashrubs and purple alfalfa,cultivated for 31 and 7 years, respectively, may reach 22.4 and15.5 m, respectively, in Suide, a county approximately 214 kmfrom Shenmu (Wang et al., 2009). Jun et al. (2014) reported themaximum depth of water absorption by alfalfa in four plots inthe watershed was 330 cm in the second year and 420 cm in thethird year. Moisture generally decreased along the soil profile inNAF. Yang et al. (2012b) reported a decreasing trend of soil mois-ture along the profile of fallow farmland, where soil moisturewas similar to that in the corresponding layer of native grassland.
In our study, the decrease in soil moisture in NAF should not be con-sidered as degradation, especially in contrast to the moisture statusin KOP and ALF. The native vegetation in NAF appeared able to suc-cessfully control erosion from runoff. We thus deduced that naturalfallow may be the best form of revegetation for the semiarid regionsof the Loess Plateau from the point of view of the productivity andsustainability of the ecosystem. Other aspects also support this con-clusion (Jin et al., 2014; Wang et al., 2012a), although recom-mended measures to reduce soil-moisture deficit were notconfined to natural fallow (Jun et al., 2014; Yang et al., 2012b).
4.2. Patterns of variability induced by dried soil layers
Spatiotemporal variation is a common feature of soil moisture.The mechanisms influencing such variation should be less compli-cated at the plot scale than at a larger scale (Zhu and Lin, 2011).This study has highlighted the temporal variability of soil moisturein deep profiles on the basis of small experimental plots with verysimilar conditions other than type of vegetation. As expected and

Table 6The linear correlations of temporal-averaged soil moisture (x) with its variance (y) over different depths.
Depth KOP ALF NAF MIL
Linear equation R2 P-value Linear equation R2 P-value Linear equation R2 P-value Linear equation R2 P-value
10 y = �3.134 + 0.953x 0.34 0.01 y = �3.134 + 0.953x 0.34 0.013 y = �0.224 + 0.481x 0.64 <0.001 y = 5.668 + 0.129x 0.07 0.7320 y = 0.592 + 0.136x 0.09 0.15 y = 0.592 + 0.136x 0.09 0.149 y = �2.129 + 0.619x 0.34 0.01 y = 1.644 + 0.009x 0.08 0.930 y = �0.457 + 0.233x 0.25 0.03 y = �0.457 + 0.233x 0.25 0.034 y = �3.307 + 0.667x 0.81 <0.001 y = �1.094 + 0.337x 0.10 0.1340 y = 0.612 + 0.106x 0.04 0.51 y = 0.612 + 0.106x 0.04 0.508 y = �2.077 + 0.422x 0.3 0.02 y = �1.795 + 0.388x 0.12 0.1150 y = �0.69 + 0.277x 0.32 0.02 y = �0.69 + 0.277x 0.32 0.016 y = �1.279 + 0.295x 0.43 <0.001 y = �0.77 + 0.265x 0.11 0.1260 y = �2.853 + 0.691x 0.6 <0.001 y = �2.853 + 0.691x 0.6 <0.001 y = �1.111 + 0.277x 0.29 0.02 y = �1.168 + 0.327x 0.12 0.1170 y = �7.086 + 1.457x 0.66 <0.001 y = �7.086 + 1.457x 0.66 <0.001 y = �1.34 + 0.294x 0.41 0.01 y = �94.96 + 10.383x 0.32 0.0280 y = �4.984 + 1.046x 0.44 <0.001 y = �4.984 + 1.046x 0.44 0.004 y = �1.987 + 0.416x 0.44 <0.001 y = �1.598 + 0.347x 0.25 0.0390 y = �1.999 + 0.485x 0.28 0.03 y = �1.999 + 0.485x 0.28 0.025 y = �3.835 + 0.716x 0.62 <0.001 y = �1.923 + 0.416x 0.15 0.08100 y = �0.644 + 0.235x 0.14 0.09 y = �0.644 + 0.235x 0.14 0.093 y = �1.911 + 0.385x 0.59 <0.001 y = �0.742 + 0.363x 0.07 0.18120 y = �0.902 + 0.258x 0.35 0.01 y = �0.902 + 0.258x 0.35 0.012 y = �3.208 + 0.596x 0.09 0.14 y = �1.02 + 0.418x 0.06 0.2140 y = 0.974 � 0.056x 0.06 0.66 y = 0.974 + �0.056x 0.06 0.658 y = 0.503 � 0.021x 0.07 0.86 y = 1.797 + 0.011x 0.08 0.93160 y = 0.351 + 0.042x 0.07 0.76 y = 0.351 + 0.042x 0.07 0.763 y = �4.559 + 0.794x 0.05 0.21 y = �2.168 + 0.396x 0.23 0.04180 y = �0.595 + 0.214x 0.01 0.32 y = �0.595 + 0.214x 0.01 0.318 y = 0.735 � 0.05x 0.06 0.69 y = �5.656 + 0.972x 0.03 0.25200 y = 0.063 + 0.095x 0.05 0.57 y = 0.063 + 0.095x 0.05 0.574 y = 1.429 � 0.124x 0.05 0.6 y = �10.634 + 1.243x 0.35 0.01220 y = �0.055 + 0.123x 0.01 0.38 y = �0.055 + 0.123x 0.01 0.384 y = �0.698 + 0.164x 0.12 0.12 y = 0.681 + 0.155x 0.02 0.42240 y = �0.673 + 0.195x 0.03 0.24 y = �0.673 + 0.195x 0.03 0.244 y = �1.697 + 0.359x 0.25 0.03 y = 2.006 + 0.033x 0.07 0.78260 y = �0.926 + 0.263x 0.01 0.31 y = �0.926 + 0.263x 0.01 0.312 y = �0.068 + 0.102x 0.04 0.5 y = �7.643 + 0.965x 0.22 0.05280 y = �3.489 + 0.635x 0.34 0.01 y = �3.489 + 0.635x 0.34 0.014 y = �0.139 + 0.154x 0.07 0.74 y = 2.093 � 0.005x 0.08 0.97300 y = �1.953 + 0.37x 0.35 0.01 y = �1.953 + 0.37x 0.35 0.012 y = �3.492 + 0.617x 0.03 0.25 y = 4.44 � 0.188x 0.04 0.22320 y = �0.204 + 0.124x 0.05 0.6 y = �0.204 + 0.124x 0.05 0.6 y = �1.513 + 0.33x 0.03 0.44 y = 10.991 � 0.603x 0.03 0.43340 y = �0.386 + 0.148x 0.09 0.14 y = �0.386 + 0.148x 0.09 0.145 y = �0.709 + 0.186x 0.06 0.64 y = �16.604 + 1.651x 0.14 0.1
KOP, ALF, NAF and MIL stand for the revegetation types of Korshinsk peashrub, purple alfalfa, natural fallow and millet, respectively. R2 stands for the determinationcoefficient of the corresponding linear equation. The bold P-values are significant at levels of 0.01 or 0.05.
Y.-H. Jia, M.-A. Shao / Journal of Hydrology 519 (2014) 523–531 529
previously studied, vertical variation of soil moisture tended to behigher near the soil surface as a result of the frequent exchange ofwater and energy (Jia and Shao, 2013). The order of CV magnitudefor the four plots changed with depth in the shallow layers, mostlikely due to the dominant contribution of the vegetation in thedeeper profiles. The four types of vegetation differed greatly intheir ability to consume soil water, especially in the deep layers.The deep layers, however, had a low variability of soil moisture.The deep layers in MIL were considered to be undisturbed byplants and climatic factors. The development of roots by thevarious plants in NAF (Jia and Shao, 2013), combined with chang-ing soil porosity, prevented a stable CV. Allowing for these, wededuced that in KOP and ALF, a hydrological phenomenon – driedsoil layers – may have formed below the depths of 70 and 90 cm,respectively. The continuously increasing dry state of the deep soilin both plots supported such a deduction.
The upper and lower soil layers in KOP and ALF had differentpatterns of variation in the correlation coefficients for the time ser-ies of soil moisture. The correlation in the upper layers was loweras the distance between two observational depths increased. Thesignificant correlations in the lower layers seemed to not degradewith vertical distance. Such a result is reasonable under theassumption that dried soil layers had formed. Dried soil layers usu-ally form below the depth of soil affected by the infiltration of rain-water (Jun et al., 2008; Wang et al., 2008, 2010). The hydrologicalconnection in the soil profile is prevented once dried soil layersappear (Chen et al., 2008). A stable dry state thus continues inthe deep soil and seems to be unalterable. Accordingly, the corre-lation of time series of soil moisture between upper and lower lay-ers was not significant.
Dried soil layers can be directly identified by their low levels ofsoil moisture. Wang et al. (2000) suggested the stable field capacityto be the upper limit of soil–water content for the dried soil layers.Specifically, the upper limit has been set at 60% of field capacity,determined by a laboratory centrifugal test (Wang et al., 2010,2012b), and is mainly controlled by soil texture. In our experi-ments, the stable field capacities approximated a constant valueof 12% (volumetric), which was converted from its gravimetricvalue (Jia et al., 2013) combined with the average bulk density.Fig. 2 indicated that the lower layers in KOP and ALF had soil
moistures less than 12%. Dried soil layers thus clearly appearedin the KOP and ALF plots. With data from 2009 for the same plots,Fu et al. (2013) reported that dried soil layers appeared at depths of100–260 cm in KOP and 100–360 cm in ALF. The different depthsof formation of dried soil layers were based on approximate valuesof the depth of rain infiltration. Interestingly, the informationdeduced from the CVs and correlation coefficients of the soil pro-files provided new evidence for the dried soil layers in the plots.
The time series of soil moisture in the surface soil layers hadsignificant correlations with those at different depths in the fourplots: within 70 cm in KOP, within 90 cm in ALF, within 50 cm inNAF, and within 70 cm in MIL. The maximum depths of correlationwere inconsistent, suggesting that the feasibility and accuracy ofpredicting soil moisture using time series (Zou et al., 2010) wouldbe affected if the vegetational type was overlooked. The estimationof soil moisture at particular depths based on the significance ofcorrelation coefficients of time series, however, is beyond thescope of this study.
4.3. Influence of soil moisture on its variability
The correlation of soil-moisture variability with the mean val-ues depended to a large extent on the rainfalls of the investigatedarea. Famiglietti et al. (1998) reported that the variability of thesurface-moisture content decreased along a hillslope transect withdecreasing mean soil moisture as the hillslope dried followingrains. The variability of the soil-moisture content might be maxi-mal following a storm due to high heterogeneity; soil heterogene-ity decreased after a long drought when the soil-moisturevariability might be minimal (Reynolds, 1970). These findings indi-cated that high variability was related to high soil moisture, anddecreasing variability was often followed by reductions in soilmoisture. In our study, the positive correlations between the vari-ances of soil moisture and the corresponding mean values were notalways significant, which could be ascribed to the influence of veg-etational type and observational depth and date. For example,depth-averaged soil moistures in KOP and ALF correlated signifi-cantly to their variances in September and October 2010 and Apriland May 2011. The soils in KOP and ALF on the correspondingdates were relatively wet, thus the correlations were significant.

530 Y.-H. Jia, M.-A. Shao / Journal of Hydrology 519 (2014) 523–531
The soils in NAF and MIL in October 2010 and April 2011 were rel-atively dry due to the low cover of vegetation, and the correlationswere not significant. Other dates when soils were under similarmoisture conditions did not produce consistent results; the soilswere most likely affected by the changing moisture status underthe influence of the vegetation. Also, the combined effects ofvegetation and soil depth complicated the correlation betweenmean soil moisture and its variance.
4.4. Controlling factors of deep soil moisture for loessial soil
The loessial soil layers on the Loess Plateau differ greatly indepth, ranging from 15 to 50 m in regions west of the LiupanMountain (Zhu, 1985) and varying from 50 to 100 m in most partsof the Loess Plateau (Mu et al., 2003). Additionally, the maximaldepth of loessial soil can reach 505 m in Jingbian County of GansuProvince (Lei, 2006). Water is stored down soil profiles in the poresbetween soil particles. The calculated amounts of soil–water stor-age would be influenced by the investigated depths (Arya et al.,1983; Jun et al., 2014; Warren et al., 2005). Moreover, the hetero-geneity of soil texture and structure within the subjectively inves-tigated soil layers also influence the distribution of soil water(Saxton and Rawls, 2006; Wang et al., 2009). Soil water is mainlyrecharged by precipitation. The deep soil moisture is determinedto a great extent by the infiltration depth. The differences in annualrainfall and various infiltration depths are thus also controlling fac-tors of deep soil moisture. Coal and oil have been discovered in thisregion since the 1990s. After large-scale exploration, mined-outregions appeared on the Loess Plateau that may have influenceddeep soil moisture. In conclusion, anthropogenic causes andnatural factors such as climate, topography and soil propertiesare considered to be associated with the deep soil moisture ofloessial soil, which changed with space and time and were notconfined to the vegetational types we tested in this study.
5. Conclusions
Vegetational type had a profound effect on the dynamics ofdeep soil moisture. In addition to the ever-increasing potentialevapotranspiration, the consumption of water by plants contrib-uted greatly to the degradation of the status of soil moisture inour experimental plots and complicated the temporal variabilityof deep soil moisture. Korshinsk peashrub and purple alfalfa eveninduced the formation of dried soil layers. As a type of revegetativemeasure, fallow may be the best choice for maintaining goodhydrological states of the soil.
Acknowledgements
This research was supported by the National Natural ScienceFoundation of China (41390463) and the China PostdoctoralScience Foundation (2014M550825). The authors wish to acknowl-edge Xiao-Xu Jia, Bing-Xia Liu, Xue-Zhang Li and Hong-Bei Gao fortheir assistance in data preparation, Xu-dong Zhang for his help inprocessing the meteorological data, Ming-bin Huang for hissuggestions for revising the manuscript, and Dr. William Blackhallfor his improvement of the language. We also thank the twoanonymous reviewers and the editor Konstantine P. Georgakakosfor their constructive comments.
References
Allen, R.G., Pereira, L.S., Raes, D., Smith, M., 1998. Crop evapotranspiration-guidelines for computing crop water requirements-FAO irrigation anddrainage paper 56. FAO, Rome, 300: p. 6541.
Arya, L.M., Richter, J.C., Paris, J.F., 1983. Estimating profile water storage fromsurface zone soil moisture measurements under bare field conditions. WaterResour. Res. 19 (2), 403–412.
Atsushi Tsunekawa, G.L., Norikazu Yamanaka, Sheng Du, 2014. Restoration anddevelopment of the Degraded Loess Plateau, China.
Brocca, L., Morbidelli, R., Melone, F., Moramarco, T., 2007. Soil moisture spatialvariability in experimental areas of central Italy. J. Hydrol. 333 (2–4), 356–373.
Cao, S., Chen, L., Yu, X., 2009. Impact of China’s grain for green project on thelandscape of vulnerable arid and semi-arid agricultural regions: a case study innorthern Shaanxi Province. J. Appl. Ecol. 46 (3), 536–543.
Cao, S., Chen, L., Shankman, D., Wang, C., Wang, X., Zhang, H., 2011. Excessivereliance on afforestation in China’s arid and semi-arid regions: lessons inecological restoration. Earth Sci. Rev. 104 (4), 240–245.
Chen, H., Shao, M., Li, Y., 2008. Soil desiccation in the Loess Plateau of China.Geoderma 143 (1), 91–100.
Corvasce, M., Zsolnay, A., D’Orazio, V., Lopez, R., Miano, T.M., 2006. Characterizationof water extractable organic matter in a deep soil profile. Chemosphere 62 (10),1583–1590.
Deng, L., Shangguan, Z.-P., Li, R., 2012. Effects of the grain-for-green program on soilerosion in China. Int. J. Sedim. Res. 27 (1), 120–127.
Eilers, V., Carter, R.C., Rushton, K., 2007. A single layer soil water balance model forestimating deep drainage (potential recharge): an application to cropped landin semi-arid North-east Nigeria. Geoderma 140 (1), 119–131.
Famiglietti, J., Rudnicki, J., Rodell, M., 1998. Variability in surface moisture contentalong a hillslope transect: Rattlesnake Hill, Texas. J. Hydrol. 210 (1), 259–281.
Feng, X., Fu, B., Lu, N., Zeng, Y., Wu, B., 2013. How ecological restoration altersecosystem services: an analysis of carbon sequestration in China’s LoessPlateau. Scientific Reports 3, 2846. http://dx.doi.org/10.1038/srep02846.
Fu, B.J., Hu, C.X., Chen, L.D., Honnay, O., Gulinck, H., 2006. Evaluating change inagricultural landscape pattern between 1980 and 2000 in the Loess hilly regionof Ansai County, China. Agr. Ecosyst. Environ. 114 (2–4), 387–396.
Fu, X., Shao, M., Wei, X., Horton, R., 2009. Effects of two perennials, fallow and milleton distribution of phosphorous in soil and biomass on sloping loess land, China.Catena 77 (3), 200–206.
Fu, X., Shao, M., Wei, X., Wang, H., Zeng, C., 2013. Effects of monovegetationrestoration types on soil water distribution and balance on a Hillslope inNorthern Loess Plateau of China. J. Hydrol. Eng. 18 (4), 413–421.
Gao, L., Shao, M., 2012. Temporal stability of shallow soil water content for threeadjacent transects on a hillslope. Agr. Water Manag. 110, 41–54.
Grayson, R.B., Western, A.W., Chiew, F.H.S., Blöschl, G., 1997. Preferred states inspatial soil moisture patterns: local and nonlocal controls. Water Resour. Res.33 (12), 2897–2908.
Jia, Y.H., Shao, M.A., 2013. Temporal stability of soil water storage under four typesof revegetation on the northern Loess Plateau of China. Agric. Water Manag.117, 33–42.
Jia, Y.-H., Shao, M.-A., Jia, X.-X., 2013. Spatial pattern of soil moisture and itstemporal stability within profiles on a loessial slope in northwestern China. J.Hydrol. 495, 150–161.
Jin, Z., Dong, Y., Wang, Y., Wei, X., Wang, Y., Cui, B., Zhou, W., 2014. Naturalvegetation restoration is more beneficial to soil surface organic and inorganiccarbon sequestration than tree plantation on the Loess Plateau of China. Sci.Total Environ. 485–486, 615–623.
Jun, L., Chen, B., Li, X., Zhao, Y., Jiang, B., Hu, W., Cheng, J., Shao, M., 2008. Effects ofdeep soil desiccation on artificial forestlands in different vegetation zones onthe Loess Plateau of China. Acta Ecol. Sinica 28 (4), 1429–1445.
Jun, F., Yu, G., Quanjiu, W., Malhi, S.S., Yangyang, L., 2014. Mulching effects on waterstorage in soil and its depletion by alfalfa in the Loess Plateau of northwesternChina. Agric. Water Manag. 138, 10–16.
Lei, X.Y., 2006. Models of loess stratigraphical structure on the terraces in the LoessPlateau of China. Mar. Geol. Quaternary Geol. 26 (2), 113–122 (in Chinese).
Li, Y.-S., 2001. Effects of forest on water circle on the Loess Plateau. J. Nat. Resour. 16(5), 427–432 (in Chinese).
Liu, Z., Yan, Q., Liu, B., Ma, J., Luo, Y., 2007. Persistent soil seed bank in Agriophyllumsquarrosum (Chenopodiaceae) in a deep sand profile: variation along a transectof an active sand dune. J. Arid Environ. 71 (2), 236–242.
Liu, W. et al., 2010. Soil water dynamics and deep soil recharge in a record wetyear in the southern Loess Plateau of China. Agric. Water Manag. 97 (8),1133–1138.
Mu, X.-M., Xu, X.-X., Wang, W.-L., Wen, Z.-M., Du, F., 2003. Impact of artificial foreston soil moisture of the deep soil layer on loess plateau. Acta Pedol. Sin. 40 (2),210–217 (in Chinese).
Neal, J., Murphy, S., Harden, S., Fulkerson, W., 2012. Differences in soil water contentbetween perennial and annual forages and crops grown under deficit irrigationand used by the dairy industry. Field Crops Res. 137, 148–162.
Pan, F., Peters-Lidard, C.D., 2008. On the relationship between mean and variance ofsoil moisture fields. J. Am. Water Resour. Assoc. 44 (1), 235–242.
Poesen, J., Ingelmo-Sanchez, F., Mucher, H., 1990. The hydrological response of soilsurfaces to rainfall as affected by cover and position of rock fragments in the toplayer. Earth Surf. Proc. Land. 15 (7), 653–671.
Reynolds, S., 1970. The gravimetric method of soil moisture determination Part IIIAn examination of factors influencing soil moisture variability. J. Hydrol. 11 (3),288–300.
Saxton, K., Rawls, W., 2006. Soil water characteristic estimates by texture andorganic matter for hydrologic solutions. Soil Sci. Soc. Am. J. 70 (5), 1569–1578.
Sun, W., Shao, Q., Liu, J., Zhai, J., 2014. Assessing the effects of land use andtopography on soil erosion on the Loess Plateau in China. Catena 121, 151–163.

Y.-H. Jia, M.-A. Shao / Journal of Hydrology 519 (2014) 523–531 531
Thomas, A., 2000. Spatial and temporal characteristics of potentialevapotranspiration trends over China. Int. J. Climatol. 20 (4), 381–396.
Tombul, M., 2007. Mapping field surface soil moisture for hydrological modeling.Water Resour. Manage 21 (11), 1865–1880.
Wang, L., Shao, M., Hou, Q., 2000. Preliminary research on measured indexes ofdried soil layer. J. Soil Water Conserv. 14 (4), 87–90 (in Chinese).
Wang, L., Wang, Q., Wei, S., Shao, M.a., Li, Y., 2008. Soil desiccation for Loess soils onnatural and regrown areas. For. Ecol. Manag. 255 (7), 2467–2477.
Wang, Z., Liu, B., Liu, G., Zhang, Y., 2009. Soil water depletion depth by plantedvegetation on the Loess Plateau. Sci. China, Ser. D Earth Sci. 52 (6), 835–842.
Wang, Y., Shao, M.a., Shao, H., 2010. A preliminary investigation of the dynamiccharacteristics of dried soil layers on the Loess Plateau of China. J. Hydrol. 381(1), 9–17.
Wang, L., Mu, Y., Zhang, Q., Jia, Z., 2012. Effects of vegetation restoration on soilphysical properties in the wind-water erosion region of the Northern LoessPlateau of China. Clean Soil Air Water 40 (1), 7–15.
Wang, Y., Shao, M.a., Liu, Z., Warrington, D.N., 2012. Regional spatial pattern of deepsoil water content and its influencing factors. Hydrol. Sci. J. 57 (2), 265–281.
Wang, Y., Shao, M.a., Liu, Z., Horton, R., 2013. Regional-scale variation anddistribution patterns of soil saturated hydraulic conductivities in surface andsubsurface layers in the loessial soils of China. J. Hydrol. 487, 13–23.
Warren, J., Meinzer, F., Brooks, J., Domec, J., 2005. Vertical stratification of soil waterstorage and release dynamics in Pacific Northwest coniferous forests. Agric. For.Meteorol. 130 (1), 39–58.
Wei, X. et al., 2013. Shrubs increase soil resources heterogeneity along semiaridgrass slopes in the Loess Plateau. J. Arid Environ. 88, 175–183.
Yang, W., 2001. Soil water resources and afforestation in Loess Plateau. J. Nat.Resour. 16 (5), 433–438 (in Chinese).
Yang, L., Wei, W., Chen, L., Jia, F., Mo, B., 2012a. Spatial variations of shallow anddeep soil moisture in the semi-arid Loess Plateau, China. Hydrol. Earth Syst. Sci.16 (9), 3199–3217.
Yang, L., Wei, W., Chen, L., Mo, B., 2012b. Response of deep soil moisture to land useand afforestation in the semi-arid Loess Plateau, China. J. Hydrol. 475, 111–122.
Yu, H., 1992. Characteristics of water resource in the loess plateau and theircountermeasures for utilization. Arid Land Geogr. 15 (3), 59–64 (in Chinese).
Zhou, D., Zhao, S., Zhu, C., 2012. The grain for green project induced land coverchange in the Loess Plateau: a case study with Ansai County, Shanxi Province,China. Ecol. Ind. 23, 88–94.
Zhu, X., 1985. Regionalization of comprehensive control in Loess Plateau, Memoir ofNISWC. Acad. Sinica 1, 2–66 (in Chinese).
Zhu, Q., Lin, H., 2011. Influences of soil, terrain, and crop growth on soil moisturevariation from transect to farm scales. Geoderma 163 (1), 45–54.
Zhu, Y., Shao, M.a., Shao, H., 2009. Evaporation Process in soil surface containingcalcic nodules on the Northern Loess Plateau of China by simulatedexperiments. Clean Soil Air Water 37 (11), 866–871.
Zhu, H.D. et al., 2014. Soil moisture response to environmental factors followingprecipitation events in a small catchment. Catena 120, 73–80.
Zou, P., Yang, J., Fu, J., Liu, G., Li, D., 2010. Artificial neural network and time seriesmodels for predicting soil salt and water content. Agric. Water Manag. 97 (12),2009–2019.