dynamic water vapour sorption in gluten and starch films
TRANSCRIPT

at SciVerse ScienceDirect
Journal of Cereal Science 54 (2011) 409e416
Contents lists available
Journal of Cereal Science
journal homepage: www.elsevier .com/locate/ jcs
Dynamic water vapour sorption in gluten and starch films
Laura Olivera,b, Marcel B.J. Meindersa,c,*a TI Food and Nutrition, Wageningen, The Netherlandsb Instituto Universitario de Ingeniería de Alimentos para el Desarrollo, Universidad Politécnica de Valencia, Valencia, SpaincWageningen University and Research Centre, Wageningen, The Netherlands
a r t i c l e i n f o
Article history:Received 16 March 2011Received in revised form25 July 2011Accepted 8 August 2011
Keywords:Gluten filmStarch filmWater sorptionFickianNon-FickianRelaxation
Abbrevations: CK, CouchmaneKarasz; DSC, differFH, FloryeHuggins; FV, free volume; FHFV, FloryeHutive humidity.* Corresponding author. Bornse Weilanden
The Netherlands. Tel.: þ31 317 480 165.E-mail address: [email protected] (M.B.J. M
0733-5210/$ e see front matter � 2011 Elsevier Ltd.doi:10.1016/j.jcs.2011.08.005
a b s t r a c t
Water sorption of gluten and wheat starch films as a function of water activity was studied usinggravimetric step-change sorption experiments. Films of different thicknesses were used with the aim tovary the characteristic diffusion time and to get insights in the contribution of the polymer-chainrearrangement in the sorption behaviour. It is shown that both starch and gluten are in the glassystate for a water activity aw below 0.9. From comparison of the dynamical sorption curves with a Fickiandiffusion model, it is shown that water diffusion in gluten films seems Fickian for aw < 0.7, and non-Fickian for aw > 0.7, while for starch films, non-Fickian sorption behaviour is observed for aw > 0.1.The results show that polymer-chain rearrangement and the stress built up in the matrix play animportant role in the sorption dynamics of these films. Even when the material is in the glassy statematrix relaxation phenomena play a role in the sorption behaviour of starch and gluten.
� 2011 Elsevier Ltd. All rights reserved.
1. Introduction
Many important quality features of dry cellular solid foods, likee.g. crispness of cereals, snacks and bread crust, as well as sticki-ness, caking, and collapse of powders, are strongly affected by thewater content and water transport during processing and storage.A good understanding of water uptake and migration is thereforeof prime importance to control the quality of dry cellular solidfoods. These foods are systems with a high level of complexity. Thecomplexity involves their chemical composition (multicompo-nent), their morphology (different compartmented phases), theirphysical features (different aggregation states), and also theirdynamical complexity (non-equilibrium systems). As a result,water sorption in cellular solid foods is not well understood yet.Knowledge about fundamental issues is needed in order to enablethe increase in shelf life and to control the functional properties ofthese composite food products.
Water transport phenomena in complex food systems may beinterpreted by understanding related phenomena in amorphous
ential scanning calorimetry;ggins-free-volume; RH, rela-
9, 6708WG, Wageningen,
einders).
All rights reserved.
bio-polymers (Peppas and Brannon-Peppas, 1994). Cellular solidfoods are composed of bio-polymers (carbohydrates and proteins)that are in an amorphous or partial amorphous state. Conse-quently, amorphous bio-polymers are relevant model systems tostudy water sorption and transport phenomena. Levine and Slade(1990) considered bio-polymers to behave similarly to syntheticpolymers. Since a large amount of knowledge about diffusionprocesses in synthetic polymeresolvent systems has beenacquired, this can be used as a starting point to increase ourunderstanding of the diffusional behaviour in bio-polymers andhence in food systems.
Diffusion processes in polymeresolvent systems often deviatefromthe lawsof the classical theoryofmolecular diffusiondescribedby Fick’s law (Vrentas et al., 1986). Solvent diffusion behaviour inpolymers may be classified as Fickian, non-Fickian (anomalous,visco-elastic), Case II or super Case II (Peppas and Brannon-Peppas,1994; Vrentas et al., 1986). Fickian diffusion (Case I) can beobserved for polymeresolvent systems when the transport of thesolvent is controlled by its concentration gradient. In this situationthe dynamics can be described by a single diffusion coefficient.Another (extreme) situation is Case II, where the water transport iscontrolled by the relaxation of the polymer and described bya characteristic relaxation constant. Anomalous transport is theprocess with intermediate characteristics with polymeric chainrearrangements occurring on a time scale comparable to that of thediffusion process. This requires two or more parameters to describe

L. Oliver, M.B.J. Meinders / Journal of Cereal Science 54 (2011) 409e416410
the coupling of the diffusion and relaxation phenomena. Severaltheoretical models have succeeded in describing the diffusionprocess considering the physical properties of the polymer networkand the interactions between the polymer and the solvent itself (fora review see e.g. Masaro and Zhu, 1999).
The physical mechanism of water transport in polymer systemscan be determined by a variety of experimental techniques such asgravimetric sorption analysis, membrane permeation, fluorescencespectroscopy and dynamic light scattering (Masaro and Zhu, 1999).The simplest andmost commonmethod is the gravimetric sorptionanalysis. Differences in diffusional behaviour can be observed byperforming gravimetric sorption experiments that traverse largeranges of temperature, water concentration, and polymer molec-ular weight or by varying the characteristic time of an experiment(Vrentas et al., 1986). The latter can be realized for step-changesorption experiments by varying the thickness of the sample andfor oscillatory sorption experiments by varying the oscillationfrequency (Vrentas et al., 1986).
Several gravimetric studies on sorption behaviour ofbiopolymer systems have been published. Step-change sorptionexperiments were carried out in dry biscuit (Guillard et al., 2004),wheat gluten based films (Guillard et al., 2003), and potato starchbased films (Masclaux et al., 2010). In all cases, water sorptionkinetics was described by Fickian diffusion including a waterconcentration dependent diffusion coefficient. Del Nobile and co-workers developed a model where Fickian diffusion, includinga concentration dependent diffusivity, and polymer relaxationwere combined to describe the sorption relaxation kinetics inchitosan films (Del Nobile et al., 2004). Meinders and co-workerspublished oscillatory and step-change sorption experiments inbread crusts. The sorption dynamics at low aw during step-changeexperiments were described by the Fickian diffusion model.Nevertheless, it was shown that relaxation phenomena play a roleinwater sorption dynamics for large aw (van Nieuwenhuijzen et al.,2008, Meinders and van Vliet, in press). Furthermore it was shownthat the water sorption behaviour of small bread particles could bereasonably well described by the free-volume theory (Meindersand van Vliet, 2009). The water sorption behaviour in thesesmall bread crust particles is dominated by the sorption behaviourof the components, while on a larger scale, when the water activityof the solid material is can be considered in equilibrium with thatof the air phase and the water migration distance is largecompared to the cell wall thickness of the solid matrix, the overallwater flux through the system is dominated by the flux throughthe air phase and thus by the morphology of the porous cellularmaterial (Esveld et al., in press-a, b, Voogt et al., 2011). For theouter crust of bread, which is important for the crispness sensa-tion, the water migration distance is small compared to the cellwall thickness so that the water transport in the solid materialbecomes important.
The objective of the current work is to get a better under-standing of the water vapour sorption of the main componentsof wheat flour. Therefore films of gluten and starch were made inorder to reduce the complexity of the systems and study theirwater sorption behaviour without the interference of anothercomponent. Gravimetrical step-change sorption experimentswere performed and compared with a Fickian diffusion model inorder to locate water activity regions that show different diffu-sional behaviour. Films of different thicknesses were used withthe aim of varying the characteristic diffusion time and gettinginsights into the contribution of polymer matrix relaxation inthe sorption behaviour. The glasserubber transition of thestudied systems was taken into account as a first approach todiscriminate possible physical mechanisms involved in watertransport.
2. Materials and methods
2.1. Preparation of films
2.1.1. Gluten filmsGluten (Protimax 137) was purchased from Avebe Latenstein
(Nijmegen, the Netherlands). Gluten films were prepared, adaptingthemethod presented by Gontard et al. (1992). Wheat gluten (7.5 g)was dispersed in 100 ml of 70% w/w solution of water/ethanolthrough a sieve at 313 K. The pH of the solution was adjusted topH ¼ 4 with acetic acid. The film-forming solution was thenimmediately poured on a levelled polypropylene dish (97 mm indiameter). Different quantities of solution were poured onto thedishes in order to obtain different film thicknesses. The film-forming solution was dried in a climate chamber at 303 K and80% RH for 48 h to evaporate volatile solvents (ethanol, acetic acid,and water). These conditions were chosen in order to obtain a non-brittle film, and therefore the film could be handled. The result wasa yellowish translucent self-supporting film. This filmwas cut in thedesired shape for further use.
2.1.2. Starch filmsNative wheat starch (Excelsior) was purchased from Avebe
(Veendam, the Netherlands). Starch films were prepared froma starch/water solution by casting. Starch (5% w/w) was dispersedin distilled water and heated up until 368 K for 10 min to allowcomplete gelatinization. The solution was instantaneously pouredonto the levelled polypropylene dish (97 mm diameter). Differentquantities of solution were poured onto the dishes in order toobtain different film thicknesses. The film-forming solution wasdried in a climate chamber at 296 K and 80% RH for 48 h to evap-orate the volatile solvent (water). The result was a translucent self-supporting film which could be easily removed from the dish inwhich it was formed. This film was cut in the desired shape forfurther use. In order to melt the crystals that might have beenformed during film formation, the films were heated in a stove at348 K for 1 h. Thermo modulated differential scanning calorimetry(DSC Q200, TA Instruments, New Castle, USA) was used to inves-tigate the recrystallization of the starch. The starch films wereweighed and distilled water was added at a 3:1 (v/w) water tosample ratio in stainless steel pans (TA Instruments Inc., NewCastle, USA). The samples were heated from 283 K to 403 K at a rateof 10 K/min. The DSC thermograms did not exhibit an endothermfor melting of the recrystallized starch.
2.2. Film thickness
The thickness of the films used in the step-change sorptionexperiments was measured before this experiment with a handmicrometre (accuracy 1 mm) at five random positions on the filmand an average value was calculated. The thickness standarddeviation for both films is around 5%.
2.3. Moisture content
The moisture content of the samples was determined gravi-metrically by drying the samples in an oven at 378 K for at least48 h in order to obtain constant weight.
2.4. Dynamic water vapour sorption experiments
Dynamic water vapour sorption experiments were performedusing an automatic multi-sample moisture sorption analyzer SPSx-11m (Projekt Messtechnik, Ulm, Germany).

L. Oliver, M.B.J. Meinders / Journal of Cereal Science 54 (2011) 409e416 411
This instrument allows analyzing up to 23 samples simulta-neously that are located in a climatic chamber. In this equipment,the RH inside the climatic chamber is conditioned by mixing a drynitrogen gas flow with a gas flow saturated with water. Theinstrument is equipped with a dew point analyzer and a microbal-ance (WXS206SDU MettlereToledo, Greifensee, Switzerland) forthe accurate measurement of RH and weight, respectively. Watersorption is measured by measuring the variation in weight ofa sample that is caused by the change in environmental RH. Theweight change was measured at time intervals of at least 10 min.
Samples were dried above P2O5 for at least three days before thestart of the dynamic water vapour sorption experiment. The sorp-tion measurement procedure involved an initial drying at 323 Kduring 500 min followed by an increase of 10% steps from 0% up to90% RH, then by 5e95% RH at 298 K. Equilibriumwas assumed to beestablished when there was no weight change more than 0.001%over a period of 60 min or a maximum step time of 50 h.
The mass at equilibrium condition (or maximum residencetime) was assumed to correspond to that of the moisture sorptionisotherm. The mass at the end of the initial drying step wasassumed to correspond to the mass of the dried polymer.
2.5. Differential scanning calorimetry (DSC)
DSCwas used tomeasure the glass transition temperature (Tg) ofthe biopolymer films. The films were ground to a particle sizesmaller than 0.25 mm employing an ultra-centrifugal mill (UltraCentrifugal Mill ZM 200, Retsch Gmbh, Haan, Germany). Theground films were stored into hermetically sealed containers oversaturated salt solutions: KNO3 (aw ¼ 0.936), KCl (aw ¼ 0.843), NaCl(aw ¼ 0.753), Ca(NO3)2 (aw ¼ 0.51), K2CO3 (aw ¼ 0.432), MgCl2(aw ¼ 0.328), CH3CO2K (aw ¼ 0.22) and LiCl (aw ¼ 0.113) at 298 K.Around 20 mg of the ground films was placed in open aluminiumpans (Tzero pan, TA Instruments Inc., New Castle, USA) and equil-ibrated at the desired equilibrium relative humidity (RH) or wateractivity aw for at least 7 days. It is noted that in this paper weconsider that the terms water activity and equilibrium relativehumidity are interchangeable (RH ¼ aw$100%). After equilibration,the pans were immediately sealed hermetically.
DSC experiments were performed using a thermo modulatedDSC (DSC Q200, TA Instruments, New Castle, USA). Starch filmswere scanned from 233 K to 443 K at a rate of 2 K/min to providea good resolution of the transition. The period and the amplitude ofmodulation were 100 s and 0.5 K.
The glass transition temperature (Tg) was determined from theinflection point in the heat capacity (Cp) which was determined bythe intersection of the extrapolated straight line of the glass Cpcurve before the transition zone and the tangent at the inflectionpoint of the sharp rise curve of Cp in the transition zone. The Tg wascalculated as the midpoint between onset and end temperatures. Tgvalues were measured in triplicate for each condition. The watercontent was determined in parallel samples.
2.6. Diffusion model
The basic equation to describe the transport of small solventmolecules in a polymer is Fick’s second law of diffusion:
vc1vt
¼ VD Vc1 (1)
where c1 is the water concentration in units of mass per volume,t is time, D is the mutual diffusion coefficient and V is the gradientoperator. It describes the inter-diffusion of 2 components. In thispaper we will refer to component 1 as the small molecular solventwater and to component 2 as the solid polymeric matrix.
Furthermore we assume one-dimensional diffusion in the x direc-tion into a thin slab of polymer of thickness l. In that case, thediffusion equation can be written as:
vc1vt
¼ Dv2c1vx2
(2)
where c1 ¼ c1xt depends on the spatial coordinate x and time t.Eq. (2) can be solved analytically for certain boundary conditions
and assumptions (i.e. constant diffusivity within the range ofchanges in moisture contents for each relative humidity level andnegligible swelling or shrinkage). For a thin slab with thicknessl having initially homogeneous water concentration c1x0 forall �l/2 < x < l/2, a constant surface concentrationcs¼ c1l/2t¼ c�1l/2t, for all t> 0, and assumingD to be independent ofthe concentration, the relative mass change as a function of time isgiven by Crank (1975):
M �M0
MN �M0¼ 1�
XNn¼0
8
ð2nþ 1Þ2p2exp
"�Dð2nþ 1Þ2p2
l2t
#(3)
withM¼m1 þm2 the total mass of the slab at time t,m1 ¼ m1xt ¼R l=2�l=2 Ac1xtvx the mass of solvent water at time t, A the area of thefilm, m2 the mass of the polymer solute that corresponds to themass of the dry slab, M0 ¼ m2 þ m1x0 the total mass of the slab at
time t ¼ 0, andMN ¼ M0 þR l=2�l=2 Acsdx the total mass of the slab at
t ¼ N.This equationwas used to fit experimental sorption curves, with
D/l2 and MN as fit parameters. It is then assumed that diffusionthrough the vapour phase is not limiting. This assumption seemsvalid because a rough estimation of the diffusive boundary layeryields that it is at most in the same order of magnitude than thesample thickness and the water diffusion coefficient in air is morethan five orders of magnitude larger than that of the solid matrix.The thickness of the diffusive boundary layer d may be estimatedfrom the Sherwood number Sh for forced convection arounda sphere, which is given by Bird et al. (2002):
Sh ¼ Ld¼ 2þ 0:6Re1=2Sc1=3 (4)
where Re ¼ ra va L/ma is the Reynolds number, Sc ¼ ma/(ra Da) isthe Schmidt number, L is the diameter of the sphere, whichcorresponds roughly to the thickness of the film (w10�4 m),ra ¼ 1.3 kg/m3 is the air density, ma ¼ 2 � 10�5 kg/m/s is thedynamic viscosity of air and va is the air velocity which is esti-mated to be at least 2 m/s, and Da ¼ 2.5 � 10�5 m2/s is thediffusion coefficient in air.
Discrimination between Fickian and non-Fickian sorptionbehaviour is based on the degree of difference between measuredand modelled dynamical sorption curves, which is shown to bea good method (Meinders and van Vliet, 2009). Moreover, theFickian sorption behaviour can be tested comparing the D fordifferent thickness. If the sorption behaviour is Fickian, the D isindependent of the thickness (Vrentas et al., 1986).
2.7. Isotherm and glass transition
The isotherm of the polymer matrix was modelled using theFloryeHuggins-free-volume (FHFV) theory, complementedwith theCouchmaneKarasz theory that described the glass transition (vander Sman and Meinders, 2011). According to the FloryeHuggins(FH) theory for polymeresolvent solutions combined with the freevolume (FV) theory that added the glassy state (Vrentas andVrentas,1994), the water activity can be written as:

0 100 200 300 400 5000
0.1
0.2
0.3
0.4
0.5
0
20
40
60
80
100
t [h]
RH
[%]
Fig. 1. Measured relative change in weight Dm ¼ m1/m2 (thick line, left axes) ofa starch film (37 � 2 mm thickness) and the adjusted external relative humidity RH(thin line, right axes) as a function of time t during a step-change isotherm sorptionexperiment.
L. Oliver, M.B.J. Meinders / Journal of Cereal Science 54 (2011) 409e416412
lnawRT
¼ mwRT
¼ lnð1� f2Þ þ�1� 1
N
�f2 þ cf2
2 þ FðfÞ (5)
where the first terms correspond to the FloryeHuggins equationand the last term FðfÞ is called the free volume term and addressesthe glassy region. Here aw is the water activity, mw is the chemicalpotential of the water, f2 is the volume fraction of the polymer, R isthe universal gas constant, T is the absolute temperature, N is thenumber of segments of the polymer, and c is the FloryeHugginsmolecular interaction parameter. N can be approximated by theratio of the molar volume of the polymer V̂2 and water V̂1:
N ¼ V̂2
V̂1(6)
For large polymers (like starch and gluten), N / N.The free volume term is equal to:
Fðf2Þ ¼ 0 if T � Tg (7)
0 0.2 0.4 0.6 0.8 10
0.03
0.06
0.09
0.12
0.15
0.18
aw
y w (H
2O g
/g w
.b.)
A
Gt 93 ± 5 μm, n=2 (RME=0.013)Gt 128 ± 7 μm, n=3 (RME=0.010)Gt 198 ± 7 μm, n=2 (RME=0.008)
Fig. 2. Water vapour adsorption isotherms at 298 K of gluten (A) and starch films (B). The varesult of FHFV theory (Eq. (5)). The goodness-of-fits (RME, residual mean error) are indicat
Fðf2Þ ¼ Mwy21DCp;1RT
dTgdy2
T � TgTg
if T < Tg (8)
where Tg is the glass temperature of the system, Mw is the molarweight of water, y1 and y2 are the water and polymer mass fraction,respectively, and DCp,1 is the change in water specific heat at theglass transition of pure water, which is a quantity well-known inthe literature, and is also used in the CouchmaneKarasz theorypresented below. Tg is the moisture content dependent glasstemperature of the system, which can be obtained via the theory ofCouchman and Karasz (Couchman and Karasz, 1978):
Tg ¼ y1DCp;1Tg;1 þ y2DCp;2Tg;2y1DCp;1 þ y2DCp;2
(9)
with Tg,1 and Tg,2 the glass temperatures of pure water and drypolymer, and DCp,2 is the difference in specific heat of water orpolymer across the glass transition.
From the CouchmaneKarasz equation, the derivative in the freevolume term of the FHFV theory can be calculated:
dTgdy2
¼ �DCp;2DCp;1�Tg;1 � Tg;2
��y2DCp;1 þ y1DCp;2
�2 (10)
The relation between the mass fraction y1 (on w.b.) and thewater content m1 (on d.b.) is:
y1 ¼ m1
m1 þ 1(11)
Calculations are performed using Matlab (Mathworks). Fittingwas performed by minimizing the squared error between theexperimental and simulated values using an unconstrained non-linear optimization.
3. Results and discussion
Fig. 1 presents a typical example of the relative mass variation ofa starch film caused by the change in environmental RH as a func-tion of time. Similar curves are found for gluten. For the RH stepsabove 80%, the sorption curves show large variation in the relativemass in the quasi steady state regime. This is due to the sensitivity
0 0.2 0.4 0.6 0.8 10
0.03
0.06
0.09
0.12
0.15
0.18
aw
y w (H
2O g
/g w
.b.)
B
St 36 ± 2 μm, n=3 (RME=0.008)St 71 ± 5 μm, n=3 (RME=0.011)St 104 ± 5 μm, n=3 (RME=0.006)
lues are averaged values of different repetitions. The lines correspond to the best fitteded in the legend, the R2 was >0.99 in all cases.
0 0.05 0.1 0.15 0.2280
320
360
400
yw (H2O g/g w.b.)
yw (H2O g/g w.b.)0.05 0.1 0.15 0.2 0.25
250
300
350
400
450
T g (o K
)T g
(o K)
R2=0.97
R2=0.99
RME=0.87
RME=1.17
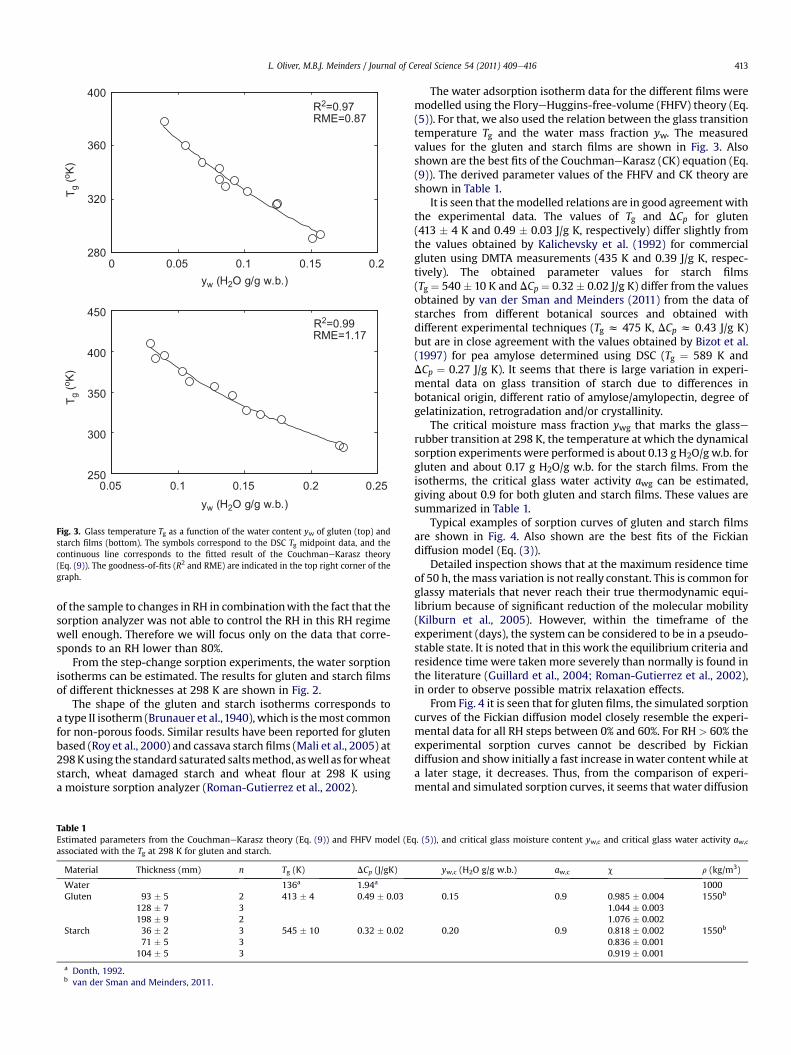
Fig. 3. Glass temperature Tg as a function of the water content yw of gluten (top) andstarch films (bottom). The symbols correspond to the DSC Tg midpoint data, and thecontinuous line corresponds to the fitted result of the CouchmaneKarasz theory(Eq. (9)). The goodness-of-fits (R2 and RME) are indicated in the top right corner of thegraph.
L. Oliver, M.B.J. Meinders / Journal of Cereal Science 54 (2011) 409e416 413
of the sample to changes in RH in combinationwith the fact that thesorption analyzer was not able to control the RH in this RH regimewell enough. Therefore we will focus only on the data that corre-sponds to an RH lower than 80%.
From the step-change sorption experiments, the water sorptionisotherms can be estimated. The results for gluten and starch filmsof different thicknesses at 298 K are shown in Fig. 2.
The shape of the gluten and starch isotherms corresponds toa type II isotherm (Brunauer et al.,1940), which is themost commonfor non-porous foods. Similar results have been reported for glutenbased (Roy et al., 2000) and cassava starch films (Mali et al., 2005) at298Kusing the standard saturated saltsmethod, aswell as forwheatstarch, wheat damaged starch and wheat flour at 298 K usinga moisture sorption analyzer (Roman-Gutierrez et al., 2002).
Table 1Estimated parameters from the CouchmaneKarasz theory (Eq. (9)) and FHFV model (Eassociated with the Tg at 298 K for gluten and starch.
Material Thickness (mm) n Tg (K) DCp (J/gK)
Water 136a 1.94a
Gluten 93 � 5 2 413 � 4 0.49 � 0.03128 � 7 3198 � 9 2
Starch 36 � 2 3 545 � 10 0.32 � 0.0271 � 5 3
104 � 5 3
a Donth, 1992.b van der Sman and Meinders, 2011.
The water adsorption isotherm data for the different films weremodelled using the FloryeHuggins-free-volume (FHFV) theory (Eq.(5)). For that, we also used the relation between the glass transitiontemperature Tg and the water mass fraction yw. The measuredvalues for the gluten and starch films are shown in Fig. 3. Alsoshown are the best fits of the CouchmaneKarasz (CK) equation (Eq.(9)). The derived parameter values of the FHFV and CK theory areshown in Table 1.
It is seen that themodelled relations are in good agreementwiththe experimental data. The values of Tg and DCp for gluten(413 � 4 K and 0.49 � 0.03 J/g K, respectively) differ slightly fromthe values obtained by Kalichevsky et al. (1992) for commercialgluten using DMTA measurements (435 K and 0.39 J/g K, respec-tively). The obtained parameter values for starch films(Tg ¼ 540 � 10 K and DCp ¼ 0.32 � 0.02 J/g K) differ from the valuesobtained by van der Sman and Meinders (2011) from the data ofstarches from different botanical sources and obtained withdifferent experimental techniques (Tg z 475 K, DCp z 0.43 J/g K)but are in close agreement with the values obtained by Bizot et al.(1997) for pea amylose determined using DSC (Tg ¼ 589 K andDCp ¼ 0.27 J/g K). It seems that there is large variation in experi-mental data on glass transition of starch due to differences inbotanical origin, different ratio of amylose/amylopectin, degree ofgelatinization, retrogradation and/or crystallinity.
The critical moisture mass fraction ywg that marks the glasserubber transition at 298 K, the temperature at which the dynamicalsorption experiments were performed is about 0.13 g H2O/g w.b. forgluten and about 0.17 g H2O/g w.b. for the starch films. From theisotherms, the critical glass water activity awg can be estimated,giving about 0.9 for both gluten and starch films. These values aresummarized in Table 1.
Typical examples of sorption curves of gluten and starch filmsare shown in Fig. 4. Also shown are the best fits of the Fickiandiffusion model (Eq. (3)).
Detailed inspection shows that at the maximum residence timeof 50 h, themass variation is not really constant. This is common forglassy materials that never reach their true thermodynamic equi-librium because of significant reduction of the molecular mobility(Kilburn et al., 2005). However, within the timeframe of theexperiment (days), the system can be considered to be in a pseudo-stable state. It is noted that in this work the equilibrium criteria andresidence time were taken more severely than normally is found inthe literature (Guillard et al., 2004; Roman-Gutierrez et al., 2002),in order to observe possible matrix relaxation effects.
From Fig. 4 it is seen that for gluten films, the simulated sorptioncurves of the Fickian diffusion model closely resemble the experi-mental data for all RH steps between 0% and 60%. For RH > 60% theexperimental sorption curves cannot be described by Fickiandiffusion and show initially a fast increase inwater content while ata later stage, it decreases. Thus, from the comparison of experi-mental and simulated sorption curves, it seems that water diffusion
q. (5)), and critical glass moisture content yw,c and critical glass water activity aw,c
yw,c (H2O g/g w.b.) aw,c c r (kg/m3)
10000.15 0.9 0.985 � 0.004 1550b
1.044 � 0.0031.076 � 0.002
0.20 0.9 0.818 � 0.002 1550b
0.836 � 0.0010.919 � 0.001

0 10 20 30 40 500
0.01
0.02
t [h]
Δm
0 10 20 30 40 500
0.01
0.02
t [h]
Δm
0 10 20 30 40 500
0.01
0.02
0.03
0.04
t [h]
Δm
0 10 20 30 40 500
0.01
0.02
0.03
0.04
0.05
t [h]
Δm
0 10 20 30 40 500
0.01
0.02
t [h]
Δm
0 10 20 30 40 500
0.01
0.02
0.03
0.04
t [h]
Δm
RH: 50 to 60% RH
198 μm (R2=0.99)
93 μm (R2=0.93)
93 μm (R2=0.94)
198 μm (R2=0.97)
RH: 60 to 70% RH
93 μm (R2=0.77)
198 μm (R2=0.74)
RH: 70 to 80% RH
36 μm (R2=0.98)
104 μm (R2=0.99)
RH: 0 to 10% RH
36 μm (R2=0.84)
104 μm (R2=0.94)
HR %08 ot 07 :HRHR %04 ot 03 :HR
36 μm (R2=0.90)
104 μm (R2=0.94)
Fig. 4. Examples of the relative mass variation Dm ¼m1/m2 and the best fits of the Fickian model (dotted lines) as a function of time t of gluten films (top panels) of 93 mm thicknessand 198 mm thickness due to a step-change in external RH from 40% to 50% RH (top left), 60% to 70% RH (top middle), 70% to 80% RH (top right); and starch films (bottom panels) of36 mm thickness and 104 mm thickness due to a step-change in external RH from 0% to 10% RH (bottom left), 30% to 40% RH (bottom middle), 70% to 80% RH (bottom left). Thegoodness-of-fits (R2) are indicated between brackets.
L. Oliver, M.B.J. Meinders / Journal of Cereal Science 54 (2011) 409e416414
in gluten films is Fickian for RH < 70%, and non-Fickian forRH > 70%. Similarly, for starch films (some typical examples areshown in Fig. 4), water sorption seems Fickian for RH ¼ 10% andRH ¼ 80% and non-Fickian for 20% < RH < 70%.
Fig. 5 shows the fitted diffusion coefficients D obtained from thebest fits of the Fickian diffusionmodel (Eq. (3)) for gluten and starchfilms for different thickness and as a function of aw. In the non-Fickian regions, the fitted diffusion coefficients only give a roughestimation of the sorption rate. It is seen that D depends on aw (ormoisture content) as well as on film thickness. In the case of glutenfilms for all the studied thicknesses, the D increases with increasingaw. This is most probably due to the increase in water content thatmay induce film plasticization, increasing polymer-chain mobility,and the free volume. This facilitates water vapour diffusion. D variesfrom 0.06� 10�12 m2/s to 0.7� 10�12 m2/s. These values differ fromthose reported by Roy et al. (2000), who found for gluten basedfilms plasticized with glycerol at 298 K in the aw range of 0.11e0.84and film thickness between 79 mm and 85 mm that D varies from1 �10�12 m2/s to 0.001 �10�12 m2/s. The fact that our results showsignificantly lower D values can be attributed to the absence of theplasticiser glycerol in our films.
For starch films, amore or less constantDwith aw is found for thethin film of 36 mm while for thicker films, D increases with aw.D varies, depending on the aw and film thickness from about0.05 � 10�13 m2/s to 4 � 10�13 m2/s. This is in close agreement withthose reported by Masclaux et al. (2010) who found D varying from0.02� 10�13 m2/s to 0.5�10�13 m2/s for potato starch films at 298 Kin theawrangeof0.1e0.9andfilmthicknessof50mm.However, theseauthors reported that the water diffusion increased with increasingaw up to aw ¼ 0.5, and decreasedwith aw for aw > 0.5. The latter wasattributed to anti-plastization. However, towhat extent this is true isfar from clear and is still often a subject of debate in the literature.
When the sorption is controlled by the concentration gradient(Fickian behaviour), the water sorption dynamics can be described
by a diffusion coefficient that is a function of the solvent concen-tration and independent of the thickness. Therefore, it is possible tolocate the aw regimes where the diffusion is Fickian by comparingthe measured diffusion coefficients for different film thicknesses.From Fig. 5, it is also seen that D of the gluten films is more or lessindependent of the film thickness for about aw < 0.6, while forstarch films, D depends on the film thickness for all studied aw.These results are consistent with the observation made above thatwater diffusion in gluten films seems Fickian for aw < 0.7 and non-Fickian for aw > 0.7, while for starch, water diffusion seems non-Fickian for almost the whole studied aw range.
Here we performed water sorption experiments where westarted with a dried sample. Upon water sorption the water willplasticise the polymer so that it gets more mobile and may rear-range to a more energetically favourable conformation (Lin andChen, 2005). The polymer mobility is a time dependent phenom-enon that may be considered as a relaxation process. When theserelaxation times occur in the time frame of the diffusion processand experiment, it may lead to non-Fickian sorption behaviour, asobserved here for starch and gluten. It may also lead to the rejectionof water as is observed for the gluten films during the RH step from70% to 80% RH (see Fig. 4). Similar overshoots were also observedfor ethanolewater binary sorption in maize grits (Crawshaw andHills, 1992). The increase in polymer mobility may also lead tocrystallization and is observed in e.g. sugars (Miao and Roos, 2005).
So, we have shown that matrix relaxation and solid mobilityplay an important role in the water sorption behaviour of starchand gluten, even if they are in the glassy state.
Although generally the solid mobility and matrix relaxationrates differ significantly below and above the glass transition(Levine and Slade, 1990), it cannot be considered as an absolutethreshold for molecular mobility (Le Meste et al., 2002). Above theglass transition, starch and gluten are super cooled liquids (rubberystate), with the polymer molecules having long-range translational

0 0.2 0.4 0.6 0.8 10
0.5
1
1.5
D (m
2 /s)
D (m
2 /s)
0 0.2 0.4 0.6 0.8 10
1
2
3
4x 10-13
x 10-12
93 ± 5 μm, n=2 128 ± 7 μm, n=3 198 ± 7 μm, n=2
36 ± 2 μm, n=3
71 ± 5 μm, n= 3 104 ± 5 μm, n=3
Fig. 5. Average effective diffusion coefficient as a function of the aw calculated fromthe best fits of the relative change in weight of gluten film (top), and starch film(bottom). The dotted line represents the critical glass water activity. Errors bars indi-cate standard deviations. The thickness of the film and the number of replicates n areindicated in the legend.
L. Oliver, M.B.J. Meinders / Journal of Cereal Science 54 (2011) 409e416 415
and rotational mobility (Seyler, 1994). Upon cooling an amorphouspolymer below Tg, or drying it below aw,c, the molecular configu-ration of the polymers will be frozen and a glass is formed (glassystate). This also means that stress will be built up in the glassysystem upon further cooling and/or drying. Below the glass tran-sition short-range molecular motions are still occurring. Thesemotions are known as secondary relaxation processes or sub-Tg andmay involve motions of water, side chains, and even main chains(see e.g. Le Meste et al., 2002). The precise process of immobiliza-tion of the polymer matrix occurs over a broad temperature and/orwater content range and depends on the rate of cooling and/ordrying. This ensures that a number of properties of the glass like Tg,awg, isotherm, and relaxation phenomena depend on the history ofthe sample. The fact that e.g. the measured isotherms betweendifferent samples of the same material differ (see Fig. 2) may beexplained by this.
In this work it is shown that both starch and gluten are in theglassy state for a water activity, aw below 0.9. Furthermore it isshown that water diffusion in gluten films seems Fickian foraw < 0.7, and non-Fickian for aw > 0.7, while for starch films, non-Fickian sorption behaviour is observed for aw > 0.1. Our resultssuggest that in the glassy state, the solid matrix shows relaxationsin the time frame of the experiments (days) and cannot beneglected in the sorption behaviour.
In order to predict the associated quality changes in food, theactual physical mechanism involved in water sorption in bio-polymers systems needs to be considered. As a result, the effectof polymer relaxation should be incorporated in the mathematicalmodelling for improving the accuracy of its predictions.
Acknowledgements
The author L. Oliver acknowledges Conselleria d’Educació(Generalitat Valenciana) for her FPI grant (BFPI06/504) and thefinancial support for the stage in the Netherlands (BEFPI/2008/005,BEFPI/2009/014, and BEFPI/2010/013).
References
Bird, R.B., Stewart, W.E., Lightfoot, E.N., 2002. Transport Phenomena, second ed.John Wiley & Sons. Inc., USA.
Bizot, H., Le Bail, P., Leroux, B., Davy, J., Roger, P., Buleon, A., 1997. Calorimetricevaluation of the glass transition in hydrated, linear and branched poly-anhydroglucose compounds. Carbohydrate Polymers 32, 33e50.
Brunauer, S.,Deming, L.S.,Deming,W.E., Teller, E.,1940.Ona theoryof thevanderWaalsadsorption of gases. Journal of the American Chemical Society 62, 1723e1732.
Couchman, P.R., Karasz, F.E., 1978. A classical thermodynamic discussion of the effectof composition on glass-transition temperatures. Macromolecules 11, 117e119.
Crank, J., 1975. The Mathematics of Diffusion, second ed. Calderon Press, Oxford.Crawshaw, J.P., Hills, J.H., 1992. Experimental determination of binary sorption and
desorption kinetics for the system ethanol, water, and maize at 90 �C. Industrial& Engineering Chemistry Research 31, 887e892.
Del Nobile, M.A., Buonocore, G.G., Conte, A., 2004. Oscillatory sorption test fordetermining the water-transport properties of chitosan-based edible films.Journal of Food Science 69, 44e49.
Donth, E.J., 1992. Relaxation and Thermodynamics in Polymers: Glass Transition,first ed. Akademie Verlag, Berlin.
Esveld, D.C., Sman, R.G.M.v.d., Dalen, G.v., Duynhoven, J.P.M.v., Meinders, M.B.J.,Effect of morphology on water sorption in cellular solid foods. Part I: Pore scalenetwork model. Journal of Food Engineering, in press-a.
Esveld, D.C., Sman, R.G.M.v.d., Witek, M.M., Windt, C.W., As, H.v., Duynhoven,J.P.M.v., Meinders, M.B.J. Effect of morphology onwater sorption in cellular solidfoods. Part II: Sorption in cereal crackers. Journal of Food Engineering, in press-b.
Gontard, N., Guilbert, S., Cuq, J.L., 1992. Edible wheat gluten films: influence of themain process variables on film properties using response surface methodology.Journal of Food Science 57, 190e195.
Guillard, V., Broyart, B., Bonazzi, C., Guilbert, S., Gontard, N., 2003. Preventingmoisture transfer in a composite food using edible films: experimental andmathematical study. Journal of Food Science 68, 2267e2277.
Guillard, V., Broyart, B., Guilbert, S., Bonazzi, C., Gontard,N., 2004.Moisture diffusivityand transfer modelling in dry biscuit. Journal of Food Engineering 64, 81e87.
Kalichevsky, M.T., Jaroszkiewicz, E.M., Blanshard, J.M.V., 1992. Glass transition ofgluten. 1: gluten and glutenesugar mixtures. International Journal of BiologicalMacromolecules 14, 257e266.
Kilburn, D., Claude, J., Schweizer, T., Ashraf Alam, A., Ubbink, J., 2005. Carbohydratepolymers in amorphous states: an integrated thermodynamic and nano-structural investigation. Biomacromolecules 6, 864e879.
Le Meste, M., Champion, D., Roudaut, G., Blond, G., Simatos, D., 2002. Glass tran-sition and food technology: a critical appraisal. Journal of Food Science 67,2444e2458.
Levine, H., Slade, L., 1990. Influence of glassy and rubbery states on the thermal,mechanical and structural properties of doughs and baked products. In:Faridi, H., Faubian, J.M. (Eds.), Dough Rheology and Baked Product Texture:Theory and Practice. Van Nostrand Reinhold, New York, USA, pp. 157e330.
Lin, Y.C., Chen, X., 2005. Moisture sorptionedesorptioneresorption characteristicsand its effect on the mechanical behavior of the epoxy system. Polymer 46,11994e12003.
Mali, S., Sakanaka, L.S., Yamashita, F., Grossmann, M.V.E., 2005. Water sorption andmechanical properties of cassava starch films and their relation to plasticizingeffect. Carbohydrates Polymers 60, 283e289.
Masaro, L., Zhu, X.X., 1999. Physical models of diffusion for polymer solutions, gelsand solids. Progress in Polymer Science 24, 731e775.
Masclaux, C., Gouanvé, F., Espuche, E., 2010. Experimental and modelling studies oftransport in starch nanocomposite films as affected by relative humidity.Journal of Membrane Science 363, 221e231.
Meinders, M.B.J., van Vliet, T., 2009. Modeling water sorption dynamics of cellularsolid food systems using free volume theory. FoodHydrocolloids 23, 2234e2242.
Meinders, M.B.J., Vliet, T.v. Oscillatory water sorption dynamics of bread crust. FoodResearch International, in press.
Miao, S., Roos, Y.H., 2005. Nonenzymatic browning kinetics in low-moisture foodsystems as affected by matrix composition and crystallization. Journal of FoodScience 70, E69eE77.
Peppas, N.A., Brannon-Peppas, L., 1994. Water diffusion and sorption in amorphousmacromolecular systems and foods. Journal Food Engineering 22, 189e210.

L. Oliver, M.B.J. Meinders / Journal of Cereal Science 54 (2011) 409e416416
Roman-Gutierrez, A.D., Guilbert, S., Cuq, B., 2002. Distribution of water betweenwheat flour components: a dynamic water vapour adsorption study. Journal ofCereal Science 36, 347e355.
Roy, S., Gennadios, A., Weller, C.L., Testin, R.F., 2000. Water vapor transportparameters of a cast wheat gluten film. Industrial Crops and Products 11, 43e50.
Seyler, R.J., 1994. Closing discussion: highlights and the challenges that remain. In:Seyler, R.J. (Ed.), Assignment of the Glass Transition. American Society forTesting and Materials, Philadelphia, PA, pp. 302e304.
van der Sman, R.G.M., Meinders, M.B.J., 2011. Prediction of the state diagram of starchwatermixturesusingtheFloryeHugginsfreevolumetheory.SoftMatter7,429e442.
van Nieuwenhuijzen, N.H., Meinders, M.B.J., Tromp, R.H., Hamer, R.J., van Vliet, T.,2008. Water uptake mechanism in crispy bread crust. Journal of Agriculturaland Food Chemistry 56, 6439e6446.
Voogt, J.A., Hirte, A., Meinders, M.B.J., 2011. Predictive model to describe watermigration in cellular solid foods during storage. Journal of the Science of Foodand Agriculture. doi:10.1002/jsfa.4386.
Vrentas, J.S.,Duda, J.L.,Huang,W.J.,1986.RegionsofFickiandiffusion inpolymeresolventsystems. Macromolecules 19, 1718e1724.
Vrentas, J.S., Vrentas,C.M.,1994.Evaluationof a sorptionequation forpolymeresolventsystems. Journal of Applied Polymer Science 51, 1791e1795.