dynamic tensile test and specimen design of auto … tensile test and specimen design of auto-body...
TRANSCRIPT
Dynamic tensile test and specimen design of auto-body steel sheet at the intermediate strain rate
S. B. Kim1, J. H. Song1, H. Huh1 & J. H. Lim2 1School of Mechanical, Aerospace and System Engineering, Korea Advanced Institute of Science and Technology, Daejeon, Korea 2POSCO Technical Research Laboratories 699, Gumho-dong, Gwangyang-si, Jeollanam-do, Korea
Abstract
In this paper, the tensile testing method at the intermediate strain rate is established and tensile tests of steel sheets for an auto-body have been performed to evaluate dynamic material properties. A high speed tensile testing machine has been developed for tensile tests at the intermediate strain rate. A simple jig fixture for gripping a specimen has been designed to diminish the load ringing phenomenon induced by unstable stress propagation at the high strain rate. Design of the specimen has to be performed for the dynamic tensile test considering the inertia and wave propagation effect. Finite element simulations are carried out to investigate the geometric effect of a specimen such as the parallel region, the width and the fillet radius. Optimum dimensions of a specimen are determined from the analysis and experiment. The optimum specimen together with the dynamic tensile test machine with the special jig fixture provides an accurate stress−strain curve with negligible load ringing phenomenon. Keywords: intermediate strain rate, dynamic material properties, dynamic tensile test, load ringing phenomenon, tensile specimen.
1 Introduction
The dynamic tensile properties of auto-body steel sheets in an auto-body are important since the range of the strain rate is several tens to hundreds per second under 500/s in a real auto-body crash and at which the dynamic response of steel
© 2007 WIT PressWIT Transactions on Engineering Sciences, Vol 57, www.witpress.com, ISSN 1743-3533 (on-line) doi:10.2495/MC070321
Computational Methods and Experiments in Materials Characterisation III 319
sheets is different from static the one [1, 2]. The flow stress, the tensile strength, the work hardening rate and the elongation of steel sheets highly depend on the strain rate in most cases. Therefore, the dynamic behavior of steel sheets must be examined accurately in order to ensure the crash characteristics of an auto-body member with the numerical analysis [3]. In spite of the importance of the dynamic behavior of steel sheets, an appropriate experimental method has not been standardized yet at the intermediate strain rate due to experimental difficulties. At the range of intermediate strain rates from 1/s to 500/s, there has been relatively little study on the dynamic tensile characteristics for steels sheets.
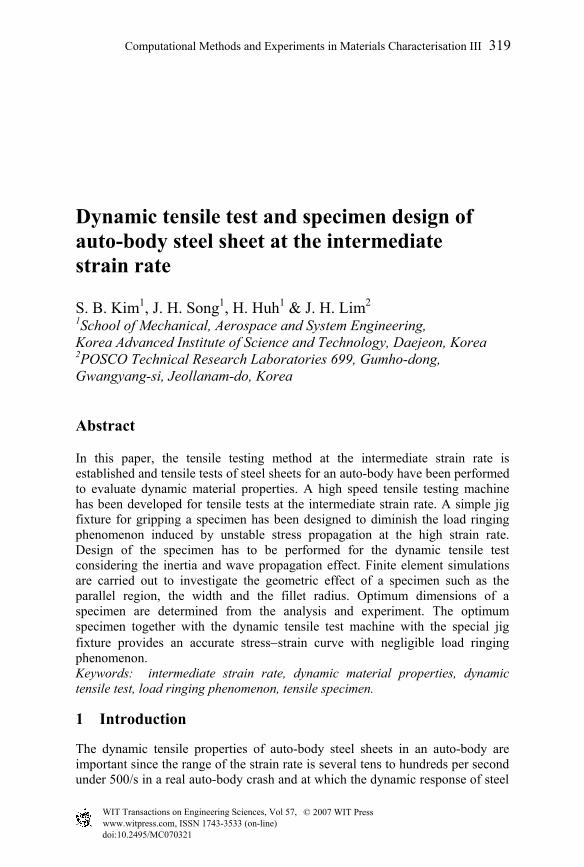
Figure 1: High speed material testing machine developed in KAIST.
In this paper, a high speed tensile testing machine was developed to investigate the dynamic tensile behavior of steel sheets at the intermediate strain rate. A jig fixture for gripping a specimen has been designed to diminish the load ringing phenomenon induced at the high strain rate. Moreover, the appropriate dimensions of a specimen were selected from the results of both finite element analyses and experiments in order to induce uniform elongation in the gauge section at intermediate strain rates. Using the dynamic tensile testing machine together with the selected specimen, dynamic tensile tests were performed for steel sheets at various strain rates ranged from 0.003 to 200/s.
2 Dynamic tensile test at the intermediate strain rate
2.1 High speed material testing machine
The dynamic response at the corresponding level of the strain rate should be obtained with adequate experimental techniques and apparatus due to the inertia effect and the stress wave propagation. Several loading methods such as mechanical, pneumatic and servo-hydraulic types have been utilized to measure the mechanical properties at intermediate strain rates [4]. Dudder [5] studied to obtain the material properties using a drop weight method and other researchers used a camplastometer and a rotary wheel machine. Servo-hydraulic testing machines are employed in most recent research work [6].
© 2007 WIT PressWIT Transactions on Engineering Sciences, Vol 57, www.witpress.com, ISSN 1743-3533 (on-line)
320 Computational Methods and Experiments in Materials Characterisation III
In the present experiment, a high speed material testing machine of the servo-hydraulic type as shown in fig. 1 was utilized in order to obtain the dynamic material properties at the intermediate strain rate. The machine has the maximum stroke velocity of 7800 mm/s, the maximum load of 30 kN and the maximum displacement of 300 mm. Two electric motors are used to compress the operating hydraulic oil up to the pressure of 300 bars and two accumulators with the capacity of 5 liters are used to make the response time faster. The maximum flow rate of the servo-hydraulic unit is 4 liter/sec. For the high speed tensile test, the instrument for measuring the load and the displacement must have good response in the dynamic motion since material testing at the intermediate strain rate lasts only for several milli-seconds. The machine equipment is set up with the Kistler 9051A piezo-electric type load cell in a specially designed loading fixture to reduce the noise level and to increase the noise frequency from the load-ringing phenomenon. The displacement is acquired by a LDT (linear displacement transducer) from Sentech company. While the moving gripper needs to maintain the constant velocity during tensile tests, the moving gripper cannot operate at the desired velocity in an instant even if a servo valve with the fastest response time is used. In order to achieve the constant velocity during tests, a special jig is used to move to some distance under no loading and then seize a specimen instantly. Several tests were conducted at the same condition to verify repeatability and the results were very satisfactory for repeatability with robust calibration and indicate that the machine response, testing procedure and material response were consistent.
2.2 Load ringing phenomenon
As the strain rate increases, the transmitted load does not become uniformly distributed at a specimen, a jig and a load cell with oscillation since the inertia and stress wave affect parts of the equipment. This phenomenon is called the load ringing. The load ringing distorts experimental results and brings about the inaccurate or false conclusion. The load ringing can be reduced by increasing the natural frequency of an upper jig or by acquiring the load from a specimen directly. In the latter case, however, testing procedure is complicate because strain gauges must be attached to specimens for every test. The natural frequency, f increases as the stiffness, k increases and as the mass, m decreases as shown in eqn (1).
mkf
π21
= (1)
Assuming that the cross section area of the jig, A is constant, the force applied to the jig, F and stiffness, k can be obtained by eqn (2) and eqn (3), respectively.
)/( llAEF ∆= (2)
lAEk /= , Alm ρ= (3)
© 2007 WIT PressWIT Transactions on Engineering Sciences, Vol 57, www.witpress.com, ISSN 1743-3533 (on-line)
Computational Methods and Experiments in Materials Characterisation III 321
SpecimenSpecimen
Upper JigUpper Jig1 m/s
Load cellLoad cell
Upper plateUpper plate
SpecimenSpecimen
Upper JigUpper Jig1 m/s
Load cellLoad cell
Upper plateUpper plate
0.0 0.5 1.0 1.5 2.0 2.5 3.0
0
2
4
6
8
10
12
14
16
Rea
ctio
n Fo
rce
(kN
)
Time (ms)
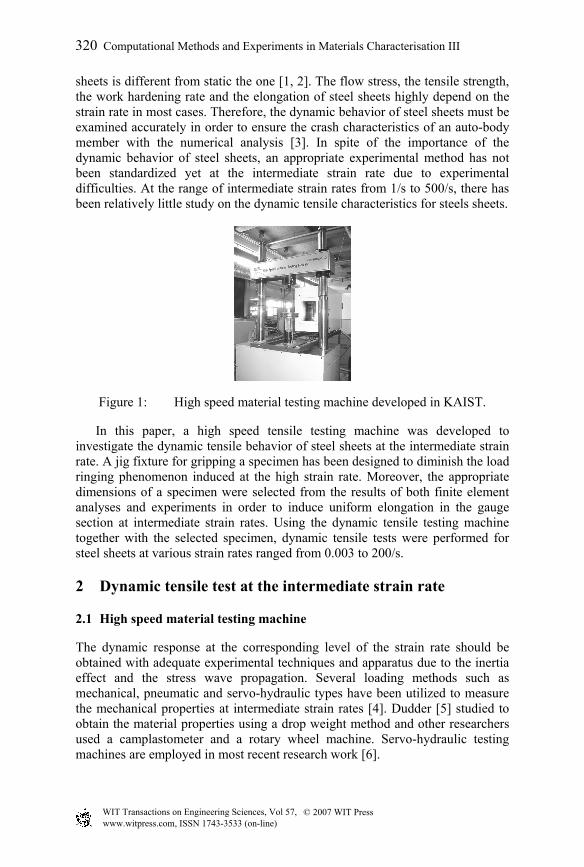
Figure 2: Finite element model of a jig.
Figure 3: Load curves from the tensile analysis of a jig.
Finally, eqn (1) can be converted to the eqn (4) with respect to the Young’s modulus, E, the density, ρ and the length of the jig, l.
ρπE
lf 1
21
= (4)
Eqn (4) shows that the natural frequency increases as the length of the jig decreases and is related to the material properties. The steel, Aluminum, Mg-alloy (8.5% Al) and Ti-alloy (6% Al, 4% V) show high E/ρ of 25.4, 25.8, 25.0 and 25.6 MPa⋅m3/kg, respectively. In this paper, the jig is made with the steel because the steel is most effective material for the jig considering the machining process, cost and durability. The jig is designed with ‘L’ shape considering the gripping of the specimen with bolts and the length of the jig is shortened to increase the natural frequency as shown in fig. 2. The tensile analysis is carried out to evaluate the structural safety and natural frequency which is directly effects on the load ringing phenomenon. Fig. 2 shows the finite element model of the jig. The load cell is attached to the jig and the constant velocity of 1.0 m/s is imposed at the end of a specimen. The analysis result indicates that the jig is safe without plastic deformation because the maximum stress is under 200 MPa in the edge of the ‘L’ shape. The result also indicates that the natural frequency of the jig is 15,000 Hz from the load−time curve as shown in fig. 3. The acceptable experimental result can be expected when the ‘L’ shaped upper jig is utilized on the dynamic tensile test.
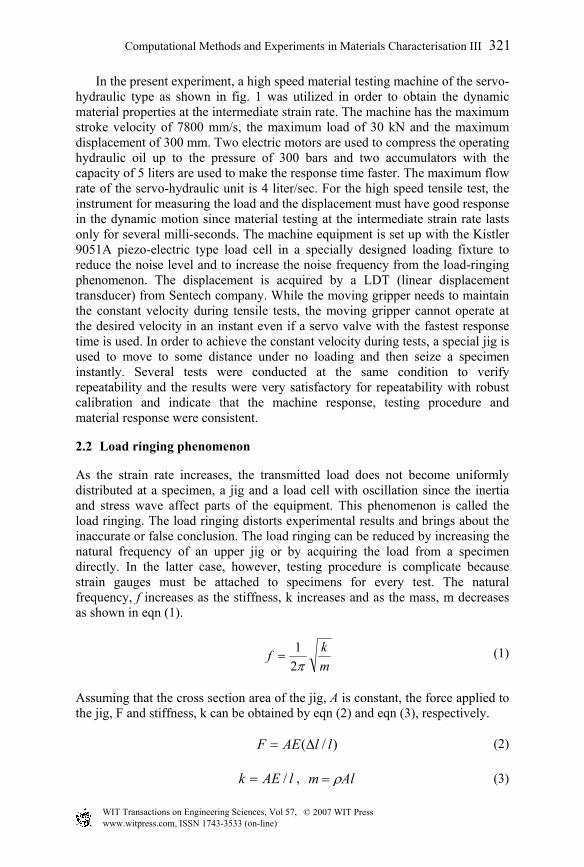
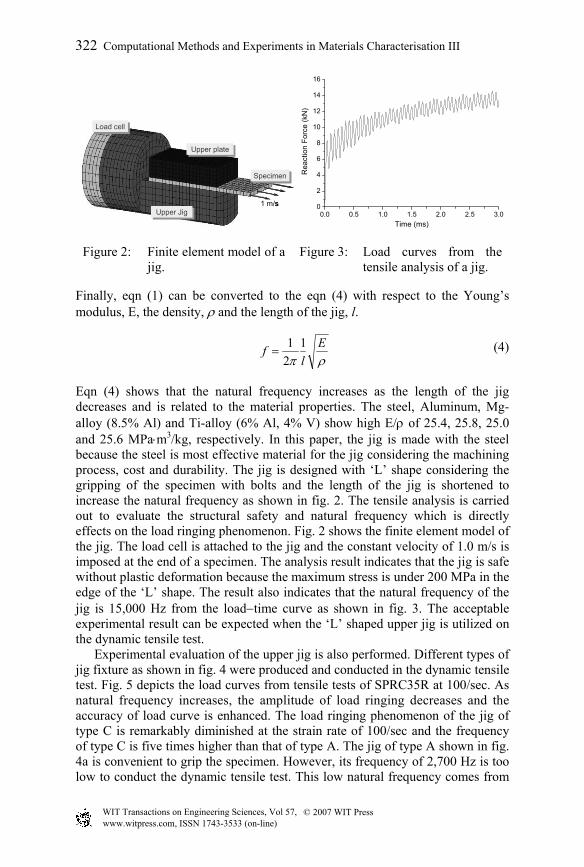
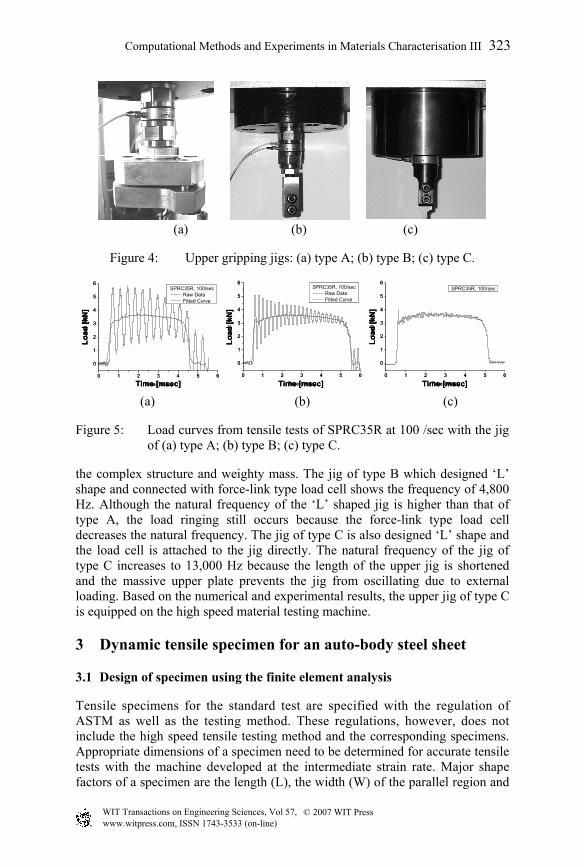
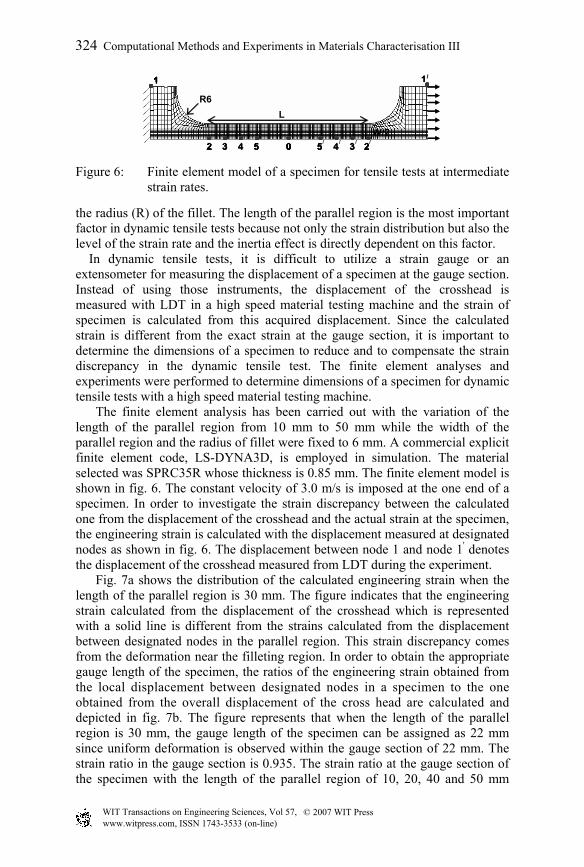
Experimental evaluation of the upper jig is also performed. Different types of jig fixture as shown in fig. 4 were produced and conducted in the dynamic tensile test. Fig. 5 depicts the load curves from tensile tests of SPRC35R at 100/sec. As natural frequency increases, the amplitude of load ringing decreases and the accuracy of load curve is enhanced. The load ringing phenomenon of the jig of type C is remarkably diminished at the strain rate of 100/sec and the frequency of type C is five times higher than that of type A. The jig of type A shown in fig. 4a is convenient to grip the specimen. However, its frequency of 2,700 Hz is too low to conduct the dynamic tensile test. This low natural frequency comes from
© 2007 WIT PressWIT Transactions on Engineering Sciences, Vol 57, www.witpress.com, ISSN 1743-3533 (on-line)
322 Computational Methods and Experiments in Materials Characterisation III
(a) (b) (c)
Figure 4: Upper gripping jigs: (a) type A; (b) type B; (c) type C.
0 1 2 3 4 5 6
0
1
2
3
4
5
6
Load
(kN
)
Time (msec)
SPRC35R, 100/sec Raw Data Fitted Curve
0 1 2 3 4 5 6
0
1
2
3
4
5
6
Load
(kN
)
Time (msec)
SPRC35R, 100/sec
0 1 2 3 4 5 6
0
1
2
3
4
5
6
Load
(kN
)
Time (msec)
SPRC35R, 100/sec Raw Data Fitted Curve
Time [msec] Time [msec] Time [msec]
Load
[kN
]
Load
[kN
]
Load
[kN
]
0 1 2 3 4 5 6
0
1
2
3
4
5
6
Load
(kN
)
Time (msec)
SPRC35R, 100/sec Raw Data Fitted Curve
0 1 2 3 4 5 6
0
1
2
3
4
5
6
Load
(kN
)
Time (msec)
SPRC35R, 100/sec
0 1 2 3 4 5 6
0
1
2
3
4
5
6
Load
(kN
)
Time (msec)
SPRC35R, 100/sec Raw Data Fitted Curve
Time [msec] Time [msec] Time [msec]
Load
[kN
]
Load
[kN
]
Load
[kN
]
(a) (b) (c)
Figure 5: Load curves from tensile tests of SPRC35R at 100 /sec with the jig of (a) type A; (b) type B; (c) type C.
the complex structure and weighty mass. The jig of type B which designed ‘L’ shape and connected with force-link type load cell shows the frequency of 4,800 Hz. Although the natural frequency of the ‘L’ shaped jig is higher than that of type A, the load ringing still occurs because the force-link type load cell decreases the natural frequency. The jig of type C is also designed ‘L’ shape and the load cell is attached to the jig directly. The natural frequency of the jig of type C increases to 13,000 Hz because the length of the upper jig is shortened and the massive upper plate prevents the jig from oscillating due to external loading. Based on the numerical and experimental results, the upper jig of type C is equipped on the high speed material testing machine.
3 Dynamic tensile specimen for an auto-body steel sheet
3.1 Design of specimen using the finite element analysis
Tensile specimens for the standard test are specified with the regulation of ASTM as well as the testing method. These regulations, however, does not include the high speed tensile testing method and the corresponding specimens. Appropriate dimensions of a specimen need to be determined for accurate tensile tests with the machine developed at the intermediate strain rate. Major shape factors of a specimen are the length (L), the width (W) of the parallel region and
© 2007 WIT PressWIT Transactions on Engineering Sciences, Vol 57, www.witpress.com, ISSN 1743-3533 (on-line)
Computational Methods and Experiments in Materials Characterisation III 323
1 1/
2 3 4 3 24 0CBA
55
1
2 3 4 3 24 0 55
R6L
W/2/// /
1 1/
2 3 4 3 24 0CBA
55
1
2 3 4 3 24 0 55
R6L
W/2/// /
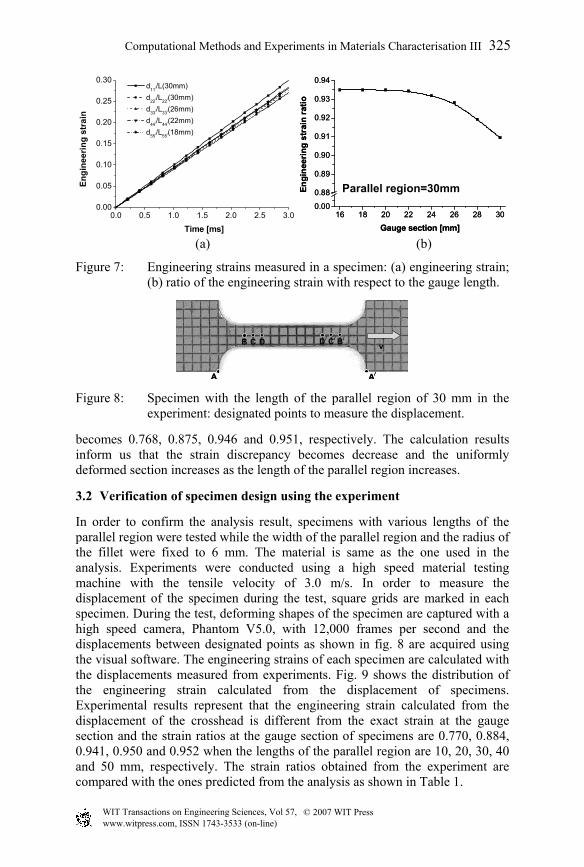
Figure 6: Finite element model of a specimen for tensile tests at intermediate strain rates.
the radius (R) of the fillet. The length of the parallel region is the most important factor in dynamic tensile tests because not only the strain distribution but also the level of the strain rate and the inertia effect is directly dependent on this factor.
In dynamic tensile tests, it is difficult to utilize a strain gauge or an extensometer for measuring the displacement of a specimen at the gauge section. Instead of using those instruments, the displacement of the crosshead is measured with LDT in a high speed material testing machine and the strain of specimen is calculated from this acquired displacement. Since the calculated strain is different from the exact strain at the gauge section, it is important to determine the dimensions of a specimen to reduce and to compensate the strain discrepancy in the dynamic tensile test. The finite element analyses and experiments were performed to determine dimensions of a specimen for dynamic tensile tests with a high speed material testing machine.
The finite element analysis has been carried out with the variation of the length of the parallel region from 10 mm to 50 mm while the width of the parallel region and the radius of fillet were fixed to 6 mm. A commercial explicit finite element code, LS-DYNA3D, is employed in simulation. The material selected was SPRC35R whose thickness is 0.85 mm. The finite element model is shown in fig. 6. The constant velocity of 3.0 m/s is imposed at the one end of a specimen. In order to investigate the strain discrepancy between the calculated one from the displacement of the crosshead and the actual strain at the specimen, the engineering strain is calculated with the displacement measured at designated nodes as shown in fig. 6. The displacement between node 1 and node 1' denotes the displacement of the crosshead measured from LDT during the experiment.
Fig. 7a shows the distribution of the calculated engineering strain when the length of the parallel region is 30 mm. The figure indicates that the engineering strain calculated from the displacement of the crosshead which is represented with a solid line is different from the strains calculated from the displacement between designated nodes in the parallel region. This strain discrepancy comes from the deformation near the filleting region. In order to obtain the appropriate gauge length of the specimen, the ratios of the engineering strain obtained from the local displacement between designated nodes in a specimen to the one obtained from the overall displacement of the cross head are calculated and depicted in fig. 7b. The figure represents that when the length of the parallel region is 30 mm, the gauge length of the specimen can be assigned as 22 mm since uniform deformation is observed within the gauge section of 22 mm. The strain ratio in the gauge section is 0.935. The strain ratio at the gauge section of the specimen with the length of the parallel region of 10, 20, 40 and 50 mm
© 2007 WIT PressWIT Transactions on Engineering Sciences, Vol 57, www.witpress.com, ISSN 1743-3533 (on-line)
324 Computational Methods and Experiments in Materials Characterisation III
0.0 0.5 1.0 1.5 2.0 2.5 3.00.00
0.05
0.10
0.15
0.20
0.25
0.30 d11//L(30mm) d22//L22/(30mm) d33//L33/(26mm) d44//L44/(22mm) d55//L55/(18mm)
Engi
neer
ing
stra
in
Time [ms]16 18 20 22 24 26 28 30
0.00
0.88
0.89
0.90
0.91
0.92
0.93
0.94
Engi
neer
ing
stra
in ra
tio
Gauge section [mm]
Parallel region=30mm
16 18 20 22 24 26 28 300.00
0.88
0.89
0.90
0.91
0.92
0.93
0.94
Engi
neer
ing
stra
in ra
tio
Gauge section [mm]
Parallel region=30mm
(a) (b)
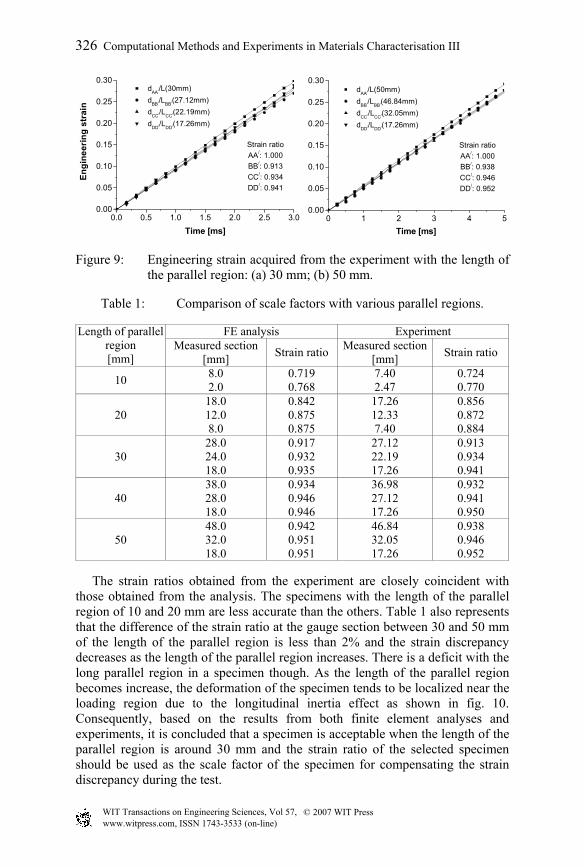
Figure 7: Engineering strains measured in a specimen: (a) engineering strain; (b) ratio of the engineering strain with respect to the gauge length.
A A/
B C D D/ C/ B/v
A A/
B C D D/ C/ B/v
Figure 8: Specimen with the length of the parallel region of 30 mm in the experiment: designated points to measure the displacement.
becomes 0.768, 0.875, 0.946 and 0.951, respectively. The calculation results inform us that the strain discrepancy becomes decrease and the uniformly deformed section increases as the length of the parallel region increases.
3.2 Verification of specimen design using the experiment
In order to confirm the analysis result, specimens with various lengths of the parallel region were tested while the width of the parallel region and the radius of the fillet were fixed to 6 mm. The material is same as the one used in the analysis. Experiments were conducted using a high speed material testing machine with the tensile velocity of 3.0 m/s. In order to measure the displacement of the specimen during the test, square grids are marked in each specimen. During the test, deforming shapes of the specimen are captured with a high speed camera, Phantom V5.0, with 12,000 frames per second and the displacements between designated points as shown in fig. 8 are acquired using the visual software. The engineering strains of each specimen are calculated with the displacements measured from experiments. Fig. 9 shows the distribution of the engineering strain calculated from the displacement of specimens. Experimental results represent that the engineering strain calculated from the displacement of the crosshead is different from the exact strain at the gauge section and the strain ratios at the gauge section of specimens are 0.770, 0.884, 0.941, 0.950 and 0.952 when the lengths of the parallel region are 10, 20, 30, 40 and 50 mm, respectively. The strain ratios obtained from the experiment are compared with the ones predicted from the analysis as shown in Table 1.
© 2007 WIT PressWIT Transactions on Engineering Sciences, Vol 57, www.witpress.com, ISSN 1743-3533 (on-line)
Computational Methods and Experiments in Materials Characterisation III 325
0.0 0.5 1.0 1.5 2.0 2.5 3.00.00
0.05
0.10
0.15
0.20
0.25
0.30
Strain ratioAA/: 1.000BB/: 0.913CC/: 0.934DD/: 0.941
dAA//L(30mm) dBB//LBB/(27.12mm) dCC//LCC/(22.19mm) dDD//LDD/(17.26mm)
Engi
neer
ing
stra
in
Time [ms]0 1 2 3 4 5
0.00
0.05
0.10
0.15
0.20
0.25
0.30
Strain ratioAA/: 1.000BB/: 0.938CC/: 0.946DD/: 0.952
dAA//L(50mm) dBB//LBB/(46.84mm) dCC//LCC/(32.05mm) dDD//LDD/(17.26mm)
Time [ms]
Figure 9: Engineering strain acquired from the experiment with the length of the parallel region: (a) 30 mm; (b) 50 mm.
Table 1: Comparison of scale factors with various parallel regions.
FE analysis Experiment Length of parallel region [mm]
Measured section [mm] Strain ratio Measured section
[mm] Strain ratio
10 8.0 2.0
0.719 0.768
7.40 2.47
0.724 0.770
20 18.0 12.0 8.0
0.842 0.875 0.875
17.26 12.33 7.40
0.856 0.872 0.884
30 28.0 24.0 18.0
0.917 0.932 0.935
27.12 22.19 17.26
0.913 0.934 0.941
40 38.0 28.0 18.0
0.934 0.946 0.946
36.98 27.12 17.26
0.932 0.941 0.950
50 48.0 32.0 18.0
0.942 0.951 0.951
46.84 32.05 17.26
0.938 0.946 0.952
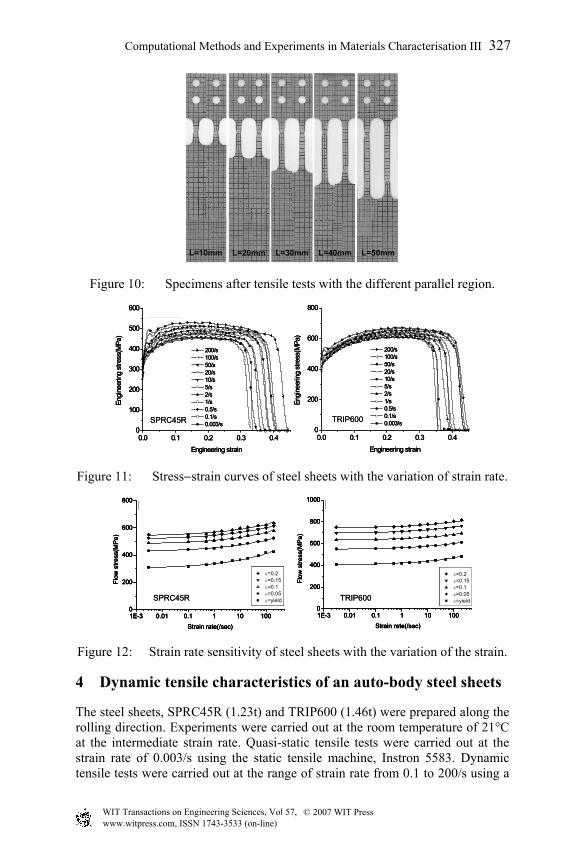
The strain ratios obtained from the experiment are closely coincident with those obtained from the analysis. The specimens with the length of the parallel region of 10 and 20 mm are less accurate than the others. Table 1 also represents that the difference of the strain ratio at the gauge section between 30 and 50 mm of the length of the parallel region is less than 2% and the strain discrepancy decreases as the length of the parallel region increases. There is a deficit with the long parallel region in a specimen though. As the length of the parallel region becomes increase, the deformation of the specimen tends to be localized near the loading region due to the longitudinal inertia effect as shown in fig. 10. Consequently, based on the results from both finite element analyses and experiments, it is concluded that a specimen is acceptable when the length of the parallel region is around 30 mm and the strain ratio of the selected specimen should be used as the scale factor of the specimen for compensating the strain discrepancy during the test.
© 2007 WIT PressWIT Transactions on Engineering Sciences, Vol 57, www.witpress.com, ISSN 1743-3533 (on-line)
326 Computational Methods and Experiments in Materials Characterisation III
L=10mm L=20mm L=30mm L=40mm L=50mmL=10mm L=20mm L=30mm L=40mm L=50mm
Figure 10: Specimens after tensile tests with the different parallel region.
0.0 0.1 0.2 0.3 0.40
100
200
300
400
500
600
200/s 100/s 50/s 20/s 10/s 5/s 2/s 1/s 0.5/s 0.1/s 0.003/s
HS45R-RD
Engi
neer
ing
stre
ss(M
Pa)
Engineering strain
0.0 0.1 0.2 0.3 0.40
200
400
600
800
200/s 100/s 50/s 20/s 10/s 5/s 2/s 1/s 0.5/s 0.1/s 0.003/s
TRIP60-RD
Engi
neer
ing
stre
ss(M
Pa)
Engineering strain
SPRC45R TRIP600
0.0 0.1 0.2 0.3 0.40
100
200
300
400
500
600
200/s 100/s 50/s 20/s 10/s 5/s 2/s 1/s 0.5/s 0.1/s 0.003/s
HS45R-RD
Engi
neer
ing
stre
ss(M
Pa)
Engineering strain0.0 0.1 0.2 0.3 0.4
0
100
200
300
400
500
600
200/s 100/s 50/s 20/s 10/s 5/s 2/s 1/s 0.5/s 0.1/s 0.003/s
HS45R-RD
Engi
neer
ing
stre
ss(M
Pa)
Engineering strain
0.0 0.1 0.2 0.3 0.40
200
400
600
800
200/s 100/s 50/s 20/s 10/s 5/s 2/s 1/s 0.5/s 0.1/s 0.003/s
TRIP60-RD
Engi
neer
ing
stre
ss(M
Pa)
Engineering strain
0.0 0.1 0.2 0.3 0.40
200
400
600
800
200/s 100/s 50/s 20/s 10/s 5/s 2/s 1/s 0.5/s 0.1/s 0.003/s
TRIP60-RD
Engi
neer
ing
stre
ss(M
Pa)
Engineering strain
SPRC45R TRIP600
Figure 11: Stress−strain curves of steel sheets with the variation of strain rate.
1E-3 0.01 0.1 1 10 1000
200
400
600
800HS45R-RD
ε=0.2 ε=0.15 ε=0.1 ε=0.05 ε=yield
Flow
stre
ss(M
Pa)
Strain rate(/sec)
1E-3 0.01 0.1 1 10 1000
200
400
600
800
1000TRIP60-RD
ε=0.2 ε=0.15 ε=0.1 ε=0.05 ε=yield
Flow
stre
ss(M
Pa)
Strain rate(/sec)
SPRC45R TRIP600
1E-3 0.01 0.1 1 10 1000
200
400
600
800HS45R-RD
ε=0.2 ε=0.15 ε=0.1 ε=0.05 ε=yield
Flow
stre
ss(M
Pa)
Strain rate(/sec)
1E-3 0.01 0.1 1 10 1000
200
400
600
800
1000TRIP60-RD
ε=0.2 ε=0.15 ε=0.1 ε=0.05 ε=yield
Flow
stre
ss(M
Pa)
Strain rate(/sec)1E-3 0.01 0.1 1 10 1000
200
400
600
800HS45R-RD
ε=0.2 ε=0.15 ε=0.1 ε=0.05 ε=yield
Flow
stre
ss(M
Pa)
Strain rate(/sec)
1E-3 0.01 0.1 1 10 1000
200
400
600
800HS45R-RD
ε=0.2 ε=0.15 ε=0.1 ε=0.05 ε=yield
Flow
stre
ss(M
Pa)
Strain rate(/sec)
1E-3 0.01 0.1 1 10 1000
200
400
600
800
1000TRIP60-RD
ε=0.2 ε=0.15 ε=0.1 ε=0.05 ε=yield
Flow
stre
ss(M
Pa)
Strain rate(/sec)
1E-3 0.01 0.1 1 10 1000
200
400
600
800
1000TRIP60-RD
ε=0.2 ε=0.15 ε=0.1 ε=0.05 ε=yield
Flow
stre
ss(M
Pa)
Strain rate(/sec)
SPRC45R TRIP600
Figure 12: Strain rate sensitivity of steel sheets with the variation of the strain.
4 Dynamic tensile characteristics of an auto-body steel sheets
The steel sheets, SPRC45R (1.23t) and TRIP600 (1.46t) were prepared along the rolling direction. Experiments were carried out at the room temperature of 21°C at the intermediate strain rate. Quasi-static tensile tests were carried out at the strain rate of 0.003/s using the static tensile machine, Instron 5583. Dynamic tensile tests were carried out at the range of strain rate from 0.1 to 200/s using a
© 2007 WIT PressWIT Transactions on Engineering Sciences, Vol 57, www.witpress.com, ISSN 1743-3533 (on-line)
Computational Methods and Experiments in Materials Characterisation III 327
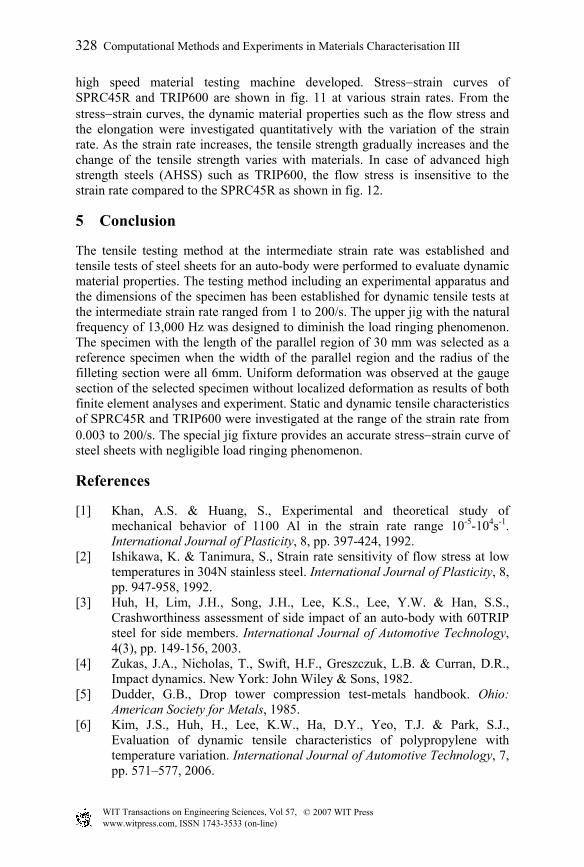
high speed material testing machine developed. Stress−strain curves of SPRC45R and TRIP600 are shown in fig. 11 at various strain rates. From the stress−strain curves, the dynamic material properties such as the flow stress and the elongation were investigated quantitatively with the variation of the strain rate. As the strain rate increases, the tensile strength gradually increases and the change of the tensile strength varies with materials. In case of advanced high strength steels (AHSS) such as TRIP600, the flow stress is insensitive to the strain rate compared to the SPRC45R as shown in fig. 12.
5 Conclusion
The tensile testing method at the intermediate strain rate was established and tensile tests of steel sheets for an auto-body were performed to evaluate dynamic material properties. The testing method including an experimental apparatus and the dimensions of the specimen has been established for dynamic tensile tests at the intermediate strain rate ranged from 1 to 200/s. The upper jig with the natural frequency of 13,000 Hz was designed to diminish the load ringing phenomenon. The specimen with the length of the parallel region of 30 mm was selected as a reference specimen when the width of the parallel region and the radius of the filleting section were all 6mm. Uniform deformation was observed at the gauge section of the selected specimen without localized deformation as results of both finite element analyses and experiment. Static and dynamic tensile characteristics of SPRC45R and TRIP600 were investigated at the range of the strain rate from 0.003 to 200/s. The special jig fixture provides an accurate stress−strain curve of steel sheets with negligible load ringing phenomenon.
References
[1] Khan, A.S. & Huang, S., Experimental and theoretical study of mechanical behavior of 1100 Al in the strain rate range 10-5-104s-1. International Journal of Plasticity, 8, pp. 397-424, 1992.
[2] Ishikawa, K. & Tanimura, S., Strain rate sensitivity of flow stress at low temperatures in 304N stainless steel. International Journal of Plasticity, 8, pp. 947-958, 1992.
[3] Huh, H, Lim, J.H., Song, J.H., Lee, K.S., Lee, Y.W. & Han, S.S., Crashworthiness assessment of side impact of an auto-body with 60TRIP steel for side members. International Journal of Automotive Technology, 4(3), pp. 149-156, 2003.
[4] Zukas, J.A., Nicholas, T., Swift, H.F., Greszczuk, L.B. & Curran, D.R., Impact dynamics. New York: John Wiley & Sons, 1982.
[5] Dudder, G.B., Drop tower compression test-metals handbook. Ohio: American Society for Metals, 1985.
[6] Kim, J.S., Huh, H., Lee, K.W., Ha, D.Y., Yeo, T.J. & Park, S.J., Evaluation of dynamic tensile characteristics of polypropylene with temperature variation. International Journal of Automotive Technology, 7, pp. 571–577, 2006.
© 2007 WIT PressWIT Transactions on Engineering Sciences, Vol 57, www.witpress.com, ISSN 1743-3533 (on-line)
328 Computational Methods and Experiments in Materials Characterisation III