dynamic revenue management in airline...
TRANSCRIPT

Vol. 44, No. 1, February 2010, pp. 15–37issn 0041-1655 �eissn 1526-5447 �10 �4401 �0015
informs ®
doi 10.1287/trsc.1090.0300©2010 INFORMS
Dynamic Revenue Managementin Airline Alliances
Christopher P. WrightCollege of Business Administration, Niagara University, Niagara, New York 14109,
Harry GroeneveltSimon Graduate School of Business, University of Rochester, Rochester, New York 14627,
Robert A. ShumskyTuck School of Business, Dartmouth College, Hanover, New Hampshire 03755,
Major airlines are selling increasing numbers of interline itineraries in which flights operated by two ormore airlines are combined and sold together. One reason for this increase is the rapid growth of airline
alliances, which promote the purchase of interline itineraries and, therefore, virtually extend the reach of eachalliance member’s network. This practice, however, creates a difficult coordination problem: Each member ofthe alliance makes revenue management decisions to maximize its own revenue and the resulting behaviormay produce suboptimal revenue for the alliance as a whole. Airline industry researchers and consultants haveproposed a variety of static and dynamic mechanisms to control revenue management decisions across alliances(a dynamic mechanism adjusts its parameters as the number of available seats in the network changes andtime passes). In this paper, we formulate a Markov game model of a two-partner alliance that can be used toanalyze the effects of these mechanisms on each partner’s behavior. We begin by showing that no Markoviantransfer pricing mechanism can coordinate an arbitrary alliance. Next, we examine three dynamic schemes aswell as three forms of the static scheme widely used in practice. We derive the equilibrium acceptance policiesunder each scheme and use analytical techniques as well as numerical analyses of sample alliances to generatefundamental insights about partner behavior under each scheme. The analysis and numerical examples alsoillustrate how certain transfer price schemes are likely to perform in networks with particular characteristics.
Key words : revenue management; yield management; airlines; alliances; Markov gameHistory : Received: February 2008; revision received: June 2009; accepted: July 2009.
1. IntroductionWhen one of the authors recently planned a trip fromBoston to Barcelona, British Airways offered a con-venient itinerary for $823. The itinerary began witha leg on British Airways from Boston to London fol-lowed by a second leg on another airline, Iberia, toBarcelona. We will call such an itinerary an inter-line itinerary because it includes service on multi-ple airlines. The availability of this two-leg interlineitinerary for this fare is contingent on two decisions:(1) the airline that sells the ticket (the marketing air-line, in this example, British Airways) must make aseat available on one leg, and (2) the operator of theother leg (the operating airline, in this example, Iberia)must agree to accept the connecting passenger fromthe marketing airline. Because both airlines practicerevenue management, these decisions depend on theprice paid by the consumer to the marketing airlinefor the ticket and the price paid by the marketing air-
line to the operating airline for the use of a seat. Thisarticle examines agreements among airlines that gov-ern the latter price, sometimes called revenue shar-ing, transfer price, or proration agreements. We showhow these agreements have subtle and potentially sig-nificant effects on individual airline behavior as wellas on the total revenue collected by multiple airlinesacross their combined networks.It is becoming increasingly important to under-
stand the impact of proration agreements on air-line revenue management because sales of interlineitineraries have been growing. This increase is duein part to a type of marketing arrangement called acode share agreement. Under this arrangement, theoperating airline’s flight is also listed as a flight withthe marketing airline’s name. In the example above,the second leg had an Iberia flight number but wasalso labeled British Airways Flight 7073 from Londonto Barcelona. Analysis of data from the U.S. Depart-ment of Transportation (2006) reveals that the fraction
15
INFORMS
holds
copyrightto
this
article
and
distrib
uted
this
copy
asa
courtesy
tothe
author(s).
Add
ition
alinform
ation,
includ
ingrig
htsan
dpe
rmission
policies,
isav
ailableat
http://journa
ls.in
form
s.org/.

Wright, Groenevelt, and Shumsky: Dynamic Revenue Management in Airline Alliances16 Transportation Science 44(1), pp. 15–37, © 2010 INFORMS
of interline itineraries within the United States rosefrom 10% in 1998 to 20% in 2004, and most of thoseinterline itineraries were marketed under code shareagreements. Overall, 46% of revenues collected fromU.S. domestic flights in 2004 came from interlineitineraries.A second factor driving up interline traffic is the
growth of airline alliances. These alliances usuallycombine code share agreements with other arrange-ments such as schedule coordination and the mergerof frequent flier programs. In March 2006, 59% of allworldwide ASMs (available seat miles, a measure oftotal capacity equal to the number of seats multipliedby the number of miles flown and summed over allflights) were flown by airlines belonging to one of thethree largest international alliances—Star, SkyTeam,or oneworld (Lott 2006). Both international and U.S.alliance activity is expected to continue growing (Lott2006, Belden 2007, Shumsky 2006).These international alliances facilitate formal mar-
keting and operational arrangements among airlines,but this paper uses the term alliance in a muchweaker sense: an alliance is formed by any two air-lines that exchange interline passengers and that havea proration agreement for the revenue collected fromthe sale of interline itineraries.In practice, the rules for revenue sharing are usu-
ally laid out in special prorate agreements (SPAs) thatare negotiated by alliance partners. In the absence ofan SPA, airlines follow the rules set out by the Inter-national Air Transport Association (IATA) (see IATA2007 for details of the rules to be implemented overthe next few years). Whether they are encoded in anSPA or by the IATA, most rules include fixed transferprices for particular flight and fare-class combinationsor other simple allocation procedures such as a splitin revenue (a proration rate) based on relative mileage.For example, under such a mileage proration scheme,British Airways would receive the lion’s share of the$823 in the earlier example for its Boston-to-Londonflight. Throughout this paper, we call such rules staticschemes because for they do not adjust proration ratesas time passes, demand is realized, and seats are sold.Although static schemes are easy to manage, they
can lead to suboptimal decision making by memberairlines and lost revenue for the alliance as a whole.For our example, under mileage proration, Iberiawould receive a relatively small share of the ticketrevenue when flying interline passengers. Therefore,Iberia may choose to focus on its own intraline (thosetaking itineraries contained entirely on Iberia’s ownnetwork) customers and not hold seats for British Air-ways customers who may be more lucrative for thealliance. The underlying flaw in any static prorationscheme is that the revenue-sharing proportions are
not adjusted to reflect the actual value of seat inven-tory. Because the revenue management system of eachairline in the alliance maximizes the revenue of thatairline, an airline may reject an itinerary if the trans-fer price undervalues the real-time value of its seats,even if the total revenue from the itinerary is large.Given the deficiencies of static schemes, major air-
lines are considering dynamic schemes such as theuse of the real-time opportunity costs of seats (or “bidprices”) as transfer prices. In this paper, we exam-ine dynamic schemes that have been described inthe published literature (see Vinod 2005) and havebeen suggested to the authors by industry execu-tives and revenue managers. In the industry, thereis interest in dynamic schemes but also much uncer-tainty. There are certainly technical and legal bar-riers to implementation—for example, antitrust leg-islation in the United States prohibits the exchangeof certain types of information among airlines—but another significant barrier is uncertainty overhow revenue-maximizing airlines would respond todynamic schemes and whether such schemes wouldproduce real benefits to the alliance. In fact, there is nopublished literature on this topic and, to our knowl-edge there has been no rigorous analysis of theseeffects by researchers within the industry. This paperis a first attempt to fill that gap.Now, we summarize the organization of the paper
and its results. After reviewing the relevant litera-ture in §2, in §3 we describe our general model fora two-airline alliance. In §4, we describe a central-ized network and determine the first-best policiesfor a centralized yield management system. In §5,we describe a two-airline alliance model and ana-lyze static and dynamic transfer price schemes. Inthis section, we first use a counterexample to showthat no dynamic scheme is guaranteed to maximizealliancewide revenue, unless the dynamic schemeincludes revenue-sharing rules that depend on thesample path of inventory sales (note that a schemebased on sample paths would be orders of mag-nitude more complex than the static and dynamicschemes being considered by the airlines). We thenderive equilibrium policies for the alliance partnersunder certain dynamic schemes and we use the anal-ysis to highlight the strengths and weaknesses of theschemes in terms of total alliance revenue. In §6,we describe numerical experiments that support theinsights from §5. The experiments also compare theperformance of static and dynamic schemes given cer-tain network parameters. We find that static schemescan perform as well as dynamic schemes for certainnetworks but that the performance of a static schemethat is optimal for one network can degrade quicklyas the network parameters change. Dynamic schemesoften perform better and are more robust. We find,
INFORMS
holds
copyrightto
this
article
and
distrib
uted
this
copy
asa
courtesy
tothe
author(s).
Add
ition
alinform
ation,
includ
ingrig
htsan
dpe
rmission
policies,
isav
ailableat
http://journa
ls.in
form
s.org/.
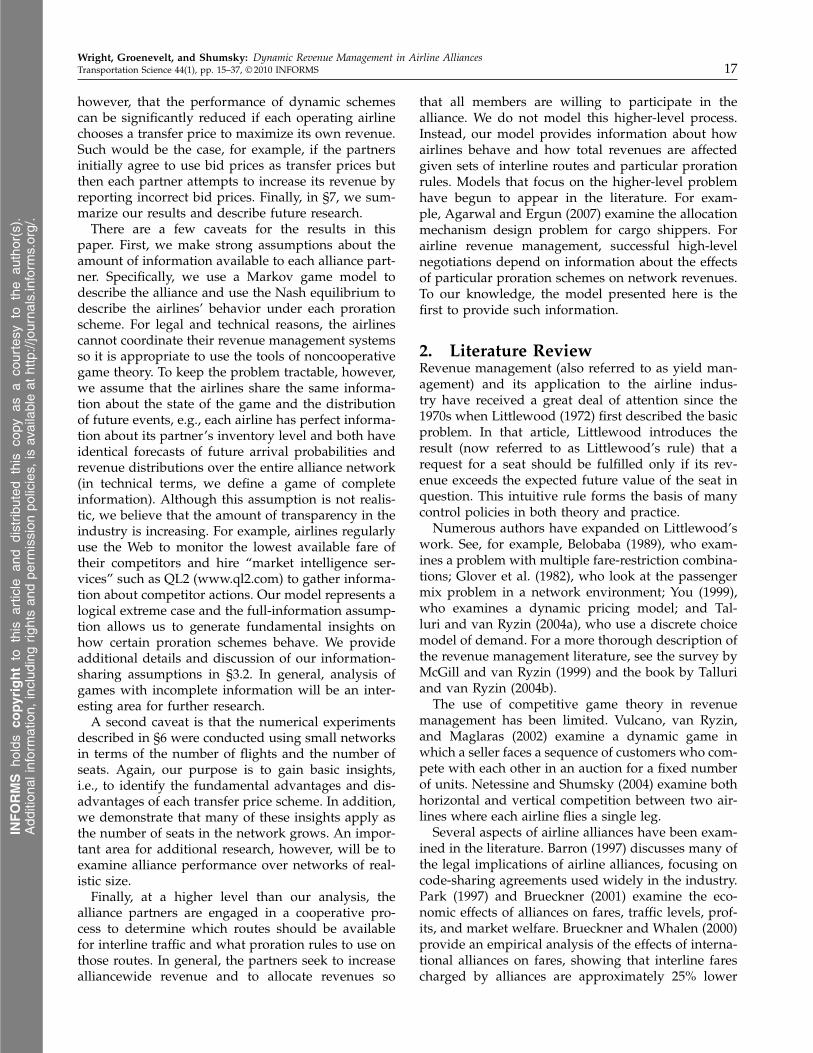
Wright, Groenevelt, and Shumsky: Dynamic Revenue Management in Airline AlliancesTransportation Science 44(1), pp. 15–37, © 2010 INFORMS 17
however, that the performance of dynamic schemescan be significantly reduced if each operating airlinechooses a transfer price to maximize its own revenue.Such would be the case, for example, if the partnersinitially agree to use bid prices as transfer prices butthen each partner attempts to increase its revenue byreporting incorrect bid prices. Finally, in §7, we sum-marize our results and describe future research.There are a few caveats for the results in this
paper. First, we make strong assumptions about theamount of information available to each alliance part-ner. Specifically, we use a Markov game model todescribe the alliance and use the Nash equilibrium todescribe the airlines’ behavior under each prorationscheme. For legal and technical reasons, the airlinescannot coordinate their revenue management systemsso it is appropriate to use the tools of noncooperativegame theory. To keep the problem tractable, however,we assume that the airlines share the same informa-tion about the state of the game and the distributionof future events, e.g., each airline has perfect informa-tion about its partner’s inventory level and both haveidentical forecasts of future arrival probabilities andrevenue distributions over the entire alliance network(in technical terms, we define a game of completeinformation). Although this assumption is not realis-tic, we believe that the amount of transparency in theindustry is increasing. For example, airlines regularlyuse the Web to monitor the lowest available fare oftheir competitors and hire “market intelligence ser-vices” such as QL2 (www.ql2.com) to gather informa-tion about competitor actions. Our model represents alogical extreme case and the full-information assump-tion allows us to generate fundamental insights onhow certain proration schemes behave. We provideadditional details and discussion of our information-sharing assumptions in §3.2. In general, analysis ofgames with incomplete information will be an inter-esting area for further research.A second caveat is that the numerical experiments
described in §6 were conducted using small networksin terms of the number of flights and the number ofseats. Again, our purpose is to gain basic insights,i.e., to identify the fundamental advantages and dis-advantages of each transfer price scheme. In addition,we demonstrate that many of these insights apply asthe number of seats in the network grows. An impor-tant area for additional research, however, will be toexamine alliance performance over networks of real-istic size.Finally, at a higher level than our analysis, the
alliance partners are engaged in a cooperative pro-cess to determine which routes should be availablefor interline traffic and what proration rules to use onthose routes. In general, the partners seek to increasealliancewide revenue and to allocate revenues so
that all members are willing to participate in thealliance. We do not model this higher-level process.Instead, our model provides information about howairlines behave and how total revenues are affectedgiven sets of interline routes and particular prorationrules. Models that focus on the higher-level problemhave begun to appear in the literature. For exam-ple, Agarwal and Ergun (2007) examine the allocationmechanism design problem for cargo shippers. Forairline revenue management, successful high-levelnegotiations depend on information about the effectsof particular proration schemes on network revenues.To our knowledge, the model presented here is thefirst to provide such information.
2. Literature ReviewRevenue management (also referred to as yield man-agement) and its application to the airline indus-try have received a great deal of attention since the1970s when Littlewood (1972) first described the basicproblem. In that article, Littlewood introduces theresult (now referred to as Littlewood’s rule) that arequest for a seat should be fulfilled only if its rev-enue exceeds the expected future value of the seat inquestion. This intuitive rule forms the basis of manycontrol policies in both theory and practice.Numerous authors have expanded on Littlewood’s
work. See, for example, Belobaba (1989), who exam-ines a problem with multiple fare-restriction combina-tions; Glover et al. (1982), who look at the passengermix problem in a network environment; You (1999),who examines a dynamic pricing model; and Tal-luri and van Ryzin (2004a), who use a discrete choicemodel of demand. For a more thorough description ofthe revenue management literature, see the survey byMcGill and van Ryzin (1999) and the book by Talluriand van Ryzin (2004b).The use of competitive game theory in revenue
management has been limited. Vulcano, van Ryzin,and Maglaras (2002) examine a dynamic game inwhich a seller faces a sequence of customers who com-pete with each other in an auction for a fixed numberof units. Netessine and Shumsky (2004) examine bothhorizontal and vertical competition between two air-lines where each airline flies a single leg.Several aspects of airline alliances have been exam-
ined in the literature. Barron (1997) discusses many ofthe legal implications of airline alliances, focusing oncode-sharing agreements used widely in the industry.Park (1997) and Brueckner (2001) examine the eco-nomic effects of alliances on fares, traffic levels, prof-its, and market welfare. Brueckner and Whalen (2000)provide an empirical analysis of the effects of interna-tional alliances on fares, showing that interline farescharged by alliances are approximately 25% lower
INFORMS
holds
copyrightto
this
article
and
distrib
uted
this
copy
asa
courtesy
tothe
author(s).
Add
ition
alinform
ation,
includ
ingrig
htsan
dpe
rmission
policies,
isav
ailableat
http://journa
ls.in
form
s.org/.

Wright, Groenevelt, and Shumsky: Dynamic Revenue Management in Airline Alliances18 Transportation Science 44(1), pp. 15–37, © 2010 INFORMS
than those charged by nonallied carriers. Ito and Lee(2007) examine the impact of domestic alliances onairfares.Little attention, however, has been given to how
revenue management should be implemented by anairline alliance. Wynne (1995) describes simple trans-fer price schemes based on the value of local fares.Boyd (1998a) discusses the methodological and tech-nical challenges of the alliance revenue managementproblem. He also refers to a more formal analysis inan unpublished working paper (Boyd 1998b) in whichhe formulates a static linear program to describe thealliance revenue management problem. Boyd (1998b)then derives conditions under which the seat alloca-tion between the two airlines maximizes alliancewiderevenue under this model. Vinod (2005) describesmany of the alliance coordination mechanisms nowbeing considered by the airlines but provides no for-mal analysis of their advantages and disadvantages.Some of the schemes analyzed in our paper cor-respond to mechanisms described by Vinod (2005).Shumsky (2006) argues that low-cost competitors aredriving the network airlines to rely on alliances for anincreasing proportion of their traffic. Both Shumsky(2006) and Fernandez de la Torre (1999) discuss theneed for more research on the effectiveness of allianceagreements, a need we attempt to fill here. In theirpaper on revenue management games, Netessine andShumsky (2004) describe and analyze a static alliancerevenue-sharing mechanism for a two-leg networkbased on the expected flow of passengers. In ourpaper, we analyze the performance of dynamic coor-dination mechanisms that are designed for arbitraryalliance networks and are similar to schemes that areproposed by, or actually used by, the airlines.Ongoing research by Houghtalen, Ergun, and Sokol
(2007) and Agarwal and Ergun (2007) looks at variousaspects of alliances, focusing specifically on cargo car-riers. In addition to the inherent difference betweenthe cargo and passenger revenue management prob-lems (see Kasilingam 1996), their analysis differs fromours in two fundamental ways: (1) they focus on thehigh-level alliance formation problem with coopera-tive game theory as the appropriate method, while weformulate a noncooperative game given an existingalliance and particular revenue-sharing rules; and (2)they focus on a deterministic optimization problem inwhich all demand for cargo service has been realizedbefore routing decisions are made, while our passen-ger yield management problem is most appropriatelydescribed by a model in which demand is uncertainand arrives over time.Finally, our paper is related to the extensive liter-
ature on supply chain coordination (see Nagarajanand Sošic (2008) and Cachon and Netessine (2004) for
overviews of the related literature that use, respec-tively, cooperative and competitive game theory).There are several attributes of our problem, however,that distinguish it from this research stream. First,the flow of products in the traditional supply chainliterature moves in one direction—from raw materi-als to the consumer. Therefore, the unused productdoes not move “sideways” within a level. Second, inthe supply chain literature, production of a productbegins at one level with one set of firms (suppliers)and demand is fulfilled at another level by anotherset of firms (retailers). Neither attribute holds for ourproblem. For a specific contrast, consider the litera-ture on assembly systems—we can think of a multilegitinerary as a final product assembled from multiplecomponents. In the traditional supply chain literature,an assembler receives components from several sup-pliers and combines them to create a new product tosell (e.g., Nagarajan and Bassok 2008 and Granot andYin 2008.) In our model, either airline may serve as themarketing airline (the de facto assembler) and eitherairline may serve as the operating airline (the de factosupplier).In addition, the traditional research on supply chain
coordination focuses on either single-period newsven-dor problems (e.g., Lariviere and Porteus 2001) orrepeated games in which inventory is replenishedbetween each repetition of the game (e.g., Cachon andZipkin 1999). The characteristics of such problems arequite different from ours because we study a finite,multiperiod problem with fixed capacity allocated toa stochastic arrival stream. Certain results from ourpaper may be similar in interpretation to results fromthe research on the economics of supply chains. Forexample, the effect of the partner price scheme in§5.4.3 can be seen as a form of double marginaliza-tion (Spengler 1950). In general, however, our prob-lem context, model, and key results are quite differentfrom those in the supply chain literature.
3. General Alliance Network ModelWe consider a dynamic model of an alliance consist-ing of two partner airlines (carriers) indexed by c ∈�1�2� (in a slight abuse of notation, we will denotethe “other” airline by −c instead of by 3 − c). Ourmodel can be seen as an extension of the networkmodel described by Talluri and van Ryzin (1998) intoa two-player game framework.Each flight leg in the network is characterized by
an origin, a destination, and a departure time (for theremainder of this paper, the terms “flight” and “flightleg” are used interchangeably). The number of flightsoperated by airline c is denoted mc, and m ≡ m1+m2 isthe total number of flights offered by the alliance. Thealliance offers n itineraries and each itinerary is either
INFORMS
holds
copyrightto
this
article
and
distrib
uted
this
copy
asa
courtesy
tothe
author(s).
Add
ition
alinform
ation,
includ
ingrig
htsan
dpe
rmission
policies,
isav
ailableat
http://journa
ls.in
form
s.org/.

Wright, Groenevelt, and Shumsky: Dynamic Revenue Management in Airline AlliancesTransportation Science 44(1), pp. 15–37, © 2010 INFORMS 19
a single flight or a series of connecting flights withinone or both networks. The set of all itineraries isdenoted N and has cardinality n. Within the alliance,these itineraries are divided into three subsets: thosethat involve only airline 1’s flights (N1), those thatinvolve only airline 2’s flights (N2), and those that useflights from both airlines (NS). Let n1, n2, and nS bethe cardinality of each subset so that n = n1 + n2 + nS .We will refer to the sets N1 and N2 as intralineitineraries because all legs within each set are oper-ated by the same airline, and will refer to the set NS
as interline itineraries because at least one leg on anyitinerary in NS will not be operated by the airline thatsold the ticket.We use the matrix A to specify the inventory
requirements of the itineraries offered by the alliance.The matrix element �A�ij is the number of seats onflight i required for itinerary j and, therefore, the col-umn vector Aj specifies the total inventory requiredfrom the alliance network to satisfy itinerary j . Indiscussions below, we will assume that each requestis for an individual passenger (i.e., �A�ij ∈ �0�1��;however, group (multiseat) requests could be han-dled by creating additional columns with each posi-tive element equaling the number of passengers in thegroup. For example, an itinerary from Rochester, NYto Denver, CO that passes through Chicago, IL wouldhave ones in the rows for Rochester–Chicago and forChicago–Denver. To handle a family of four lookingto make the same trip, A would need another columnwith fours in those same rows.For clarity, A can be partitioned as follows:
A1
0
0
,
AS1
AS2
A =
N1 N2 NS
1 … n1 n1+1 … n1+ n2 n1+ n2+1 … n 1
M
m1m1+1
M
mA2
such that the first n1 columns have only positive ele-ments in the first m1 rows (airline 1’s network), thenext n2 columns have only positive elements in thelast m2 rows (airline 2’s network) and the final nS
columns have positive elements in both sets of rows.Although interline itineraries may be sold by either
alliance partner (requests for itineraries in NS maybe received by either airline 1 or 2), we assume thatintraline itineraries are only sold by the airline thatoperates the flights (requests for itineraries in Nc areonly received by airline c�. In practice, airlines do selltickets for itineraries that are exclusively on anotherairline’s network. With some additional notation, thispossibility can be incorporated into the model and all
of the following results will continue to hold. To keepthe exposition and notation simple, we will assumethat each airline handles its own intraline requests.The number of remaining (unsold) seats for flight i
is denoted xi. The m-dimensional vector ⇀x is the jointvector of remaining inventory for the alliance: ⇀x ≡�x1� � � � � xm1�xm1+1 � � � xm��
3.1. The Demand ProcessWe consider a K-period booking horizon with thecurrent period, denoted k, decreasing from K to 0.The probability that airline c receives a request foritinerary j in period k is q
cj
k ≥ 0. We assume that eachperiod is short enough such that the probability thatthe alliance receives more than one itinerary requestin a given period is negligible. The probability that norequest arrives is then
q0k = 1− ∑
c∈�1�2�
∑j∈N
qcj
k ≥ 0� (1)
The revenue Rcj
k associated with a request to air-line c for itinerary j in a given period k, conditionalon a request being made, is a nonnegative randomvariable with known cumulative distribution function(CDF) F
cj
k �r�. We assume that Rcj
k has a finite expec-tation. The complementary CDF is �F cj
k �r� = 1− Fcj
k �r�.Note that “c” in R
cj
k is the carrier that receives the con-sumer’s request (the marketing airline). We assumethat F
cj
k �r� is differentiable with known density func-tion f
cj
k �r�. However, wherever we express our resultsin terms of f
cj
k �r�, similar results can be found for non-continuous distributions.
3.2. Assumptions About the Arrival Process andInformation Sharing
We assume that the distribution of each Rcj
k is inde-pendent of the realized revenue in preceding periods.Even simple (first-order) dependency, while theoreti-cally easy to handle with our model, would be nota-tionally and computationally cumbersome.In addition, assume that each player formulates
an open-loop dynamic program that does not usethe realized arrival revenue stream as feedback forits optimization problem. One could imagine severalclosed-loop variations of our model. For example,demand intensity for a given itinerary could be char-acterized by an unknown parameter, which would beupdated as demand is realized. Such models wouldbe quite complex and, in practice, would likely behandled by updating the inputs to the model over thehorizon without explicitly accounting for the futureeffects of this updating process when calculating thecurrent value functions.We also assume that there is independence
between acceptance decisions in one period and the
INFORMS
holds
copyrightto
this
article
and
distrib
uted
this
copy
asa
courtesy
tothe
author(s).
Add
ition
alinform
ation,
includ
ingrig
htsan
dpe
rmission
policies,
isav
ailableat
http://journa
ls.in
form
s.org/.

Wright, Groenevelt, and Shumsky: Dynamic Revenue Management in Airline Alliances20 Transportation Science 44(1), pp. 15–37, © 2010 INFORMS
arrival process in subsequent periods. Specifically, weassume that a customer, when denied a ticket, willnot submit a new request to the alliance for thesame or a similar itinerary. This assumption is consis-tent with the assumptions that underlie many of themodels in the revenue management literature. Incor-porating multiple customer preferences into the opti-mization problem is an area of ongoing research (e.g.,see Talluri and van Ryzin 2004a). Within alliances,this behavior would add an interesting wrinkle to ourproblem because the revenue management decisionsof each airline could affect the arrival process of itspartners.As noted in §1, in our model, the airlines share
full information about their partners’ inventory lev-els, forecasts of arrival processes, and revenue distri-butions. This allows the airlines to calculate, in eachtime period, a common expected value for a seat onany flight in the network. Using the terminology ofgame theory, we assume that each airline knows thestrategies and payoffs of its partner and thereforeplays a game of complete information. Although thismodel is stylized, it allows us to generate fundamen-tal insights into the advantages and disadvantages ofstatic and dynamic transfer price schemes.Although we assume that each airline knows the
potential payoffs of its partners, we do not assume thateach airline immediately observes realized payoffs.Specifically, under the partner price scheme of §5.4.3,the operating airline must post its transfer pricesfor interline inventory without knowing the realizedrevenue associated with an interline request in thatperiod (of course, the marketing airline sees any real-ized revenue). Therefore, the partners are playinga game of imperfect information. This assumptionreflects an important source of information asymme-try found in the real world. For a given itinerary,there exists numerous classes and distribution chan-nels through which the ticket can be sold; the rangeof prices across these classes and channels createsthe distribution F
cj
k �r� of revenue for each itinerary.Although the operating airline may know the distri-bution of revenue because prices are publicly posted,it cannot know the specific class being sold or chan-nel being used at the moment the marketing airlinereceives a specific purchase request.
3.3. Assumptions About Revenue SharingIn general, the proration scheme used by the alliancewill influence both the total revenue received by thealliance and the allocation of revenues to each ofthe partners. We assume that the ultimate goal ofeach partner is to maximize its own wealth (revenue).It is reasonable to assume, however, that by form-ing an alliance, the partners are seeking a schemethat increases their joint profits, using some form of
ex ante revenue distribution (e.g., a participation fee)to ensure that all members of the alliance will con-tinue to participate. In practice, this problem is oftensolved by finding a set of interline routes on eachairline that leads to a rough balance in the revenueexchanged between the airlines (Ito and Lee 2007).The choice of mechanism for the distribution of totalrevenues is a bargaining problem that we do notexamine here. We assume that some mechanism hasalready been chosen and that both airlines are willingto participate in the alliance. Therefore, our primaryfocus will be on examining how the various tradingschemes affect total alliance revenue.
4. Centralized ControlHere, we describe the optimal policy for a single,centralized controller making all decisions to maxi-mize total alliance revenue. In general, members ofan airline alliance cannot adopt centralized revenuemanagement controls (see the end of this section forfurther discussion), but these results are useful as theylead to an upper bound on the total revenue for thealliance. We will call this upper bound the first-bestrevenue.
4.1. Decision ProcessThe fundamental decision made by the centralizedcontroller is whether to accept or reject a requestfor an itinerary j given the revenue offer R
cj
k andthe current state of the system characterized by theremaining periods k and the remaining inventory ofthe alliance ⇀x. Let Jk�
⇀x� denote the total (current andfuture) expected value for the alliance given inven-tory ⇀x with k remaining periods, and let Jk�
⇀x�Aj� bethe opportunity cost to the alliance of the inventoryrequired for itinerary j :
Jk�⇀x�Aj� ≡ Jk�
⇀x� − Jk�⇀x − Aj�� (2)
For convenience, let Jk�⇀x� = − whenever one of the
components of ⇀x is negative. �⇀x�⇀0� ⇀p� ⇀u�
A policy for centralized control consists of a set ofacceptance rules u
j
k� ⇀x� such that
uj
k�r ⇀x�
=
⎧⎪⎪⎪⎨⎪⎪⎪⎩1 if, at time k with remaining inventory
⇀x, the alliance is willing to sell aticket for itinerary j with revenue r�
0 otherwise.
We now define the joint arrival probability qj
k andthe corresponding conditional CDF F
j
k of the condi-tional revenue R
j
k�r� for a request made to the alliance
INFORMS
holds
copyrightto
this
article
and
distrib
uted
this
copy
asa
courtesy
tothe
author(s).
Add
ition
alinform
ation,
includ
ingrig
htsan
dpe
rmission
policies,
isav
ailableat
http://journa
ls.in
form
s.org/.

Wright, Groenevelt, and Shumsky: Dynamic Revenue Management in Airline AlliancesTransportation Science 44(1), pp. 15–37, © 2010 INFORMS 21
(rather than to a particular partner c) for itinerary jin period k:
qj
k = q1j
k + q2j
k
Fj
k �r� =(
q1j
k
qj
k
)F1j
k �r� +(
q2j
k
qj
k
)F2j
k �r��
The Bellman (1957) equations for optimal central-ized control can then be written as
Jk�⇀x� = q0
k Jk−1�⇀x� + ∑
j∈N
qj
k E�Rj
kuj
k�Rj
k�⇀x�
+ Jk−1�⇀x − Aju
j
k�Rj
k�⇀x����
J0�⇀x� = 0 ∀ ⇀x ≥ ⇀
0�
where
uj
k�r� ⇀x� = argmaxu∈�0�1�
�ru + Jk−1�⇀x − Aju���
Given a request, the centralized controller eitheraccepts the request (receives the associated rev-enue and reduces the inventory level) or denies therequest and moves to the next period with the sameinventory.
4.2. Optimal PoliciesThe decision faced by the centralized controller isidentical to the decision faced by a single airline thatmaximizes the revenue generated by the combinednetwork of the alliance. We can, therefore, applyresults derived for a single airline network.
Proposition 1. The optimal acceptance policy for cen-tralized control is of the form
uj
k�r ⇀x� ={1 if r ≥ Jk−1�
⇀xAj��
0 otherwise.
Proof. See Talluri and van Ryzin (1998), Proposi-tion 1.Under the optimal policy, the alliance accepts any
request with associated revenue greater than or equalto the alliance’s opportunity cost of the inventoryused on that itinerary. Simply put, it accepts a requestif it is beneficial (in expectation) to do so.Practical limitations, however, prevent most
alliances between large partners from ceding controlof their revenue management systems to a centralcontroller and using an optimal policy such as theone described in Proposition 1. Barriers to coor-dination include technical incompatibilities amongrevenue management systems within an alliance,competitive considerations (alliance partners areoften competitors on many routes and therefore donot want to merge revenue management systems),
and antitrust laws. There are examples, however, ofcentralized control in the airline industry. Regionalairlines sometimes allow their national partners tocollect all revenues and make all booking decisions,and revenue-sharing is accomplished with a fixedpayment per flight to the regional partner (forexample, similar arrangements are used in the Con-tinental/ExpressJet and United/Skywest alliances;see Shumsky 2006). For the remainder of this paper,we compare this centralized policy with the policiesfollowed by airlines when revenue managementdecisions are distributed among the partners in thealliance. That is, the following decentralized controlschemes have been used, or are intended for use,among major airlines such as the primary membersof the SkyTeam, Star, and Oneworld alliances.
5. Decentralized ControlIn this section, we examine airline behavior when rev-enue management decisions are decentralized amongalliance partners. We assume that each alliance part-ner is free to accept or reject a request for an interlineseat, as is true under the free sale system that is com-monly used by major airline alliances (Boyd 1998a).In our model, interline sales require the followingsteps. First, an airline (hereafter the marketing airline)receives a request for an interline itinerary. Next, atransfer price is set for the seats on flights operatedby its partner (the operating airline) that are needed tocomplete the itinerary (there are a variety of methodsfor setting transfer prices and we will describe spe-cific schemes in §§5.3 and 5.4). Next, the operatingairline decides whether to make its seat available andthen the marketing airline decides whether to sell thecomplete itinerary. Finally, if the itinerary is sold, thetransfer price is paid to the operating airline.In §5.1, we will describe our model for the alliance
under decentralized control. In §5.2, we will show bycounterexample that no transfer pricing scheme canguarantee optimality under such a system, and wegain insights into the pitfalls inherent in transfer pric-ing schemes by examining the equilibrium behaviorof the alliance partners under a generic decentralizedscheme. In §§5.3 and 5.4, we will describe the equilib-rium behavior of the partners under specific transferprice schemes. In §5.3, we examine static proration inwhich revenue from all interline tickets is split accord-ing to a fixed proportion. This scheme is currentlyused within many alliances. In §5.4, we analyze threedynamic schemes, which are based on systems pro-posed by Vinod (2005) and on systems that are beingconsidered in the industry. In §5.5, we discuss thebenefits of allowing the operating airline to set thetransfer price and therefore share any surplus revenuereceived by the alliance for an interline request. In
INFORMS
holds
copyrightto
this
article
and
distrib
uted
this
copy
asa
courtesy
tothe
author(s).
Add
ition
alinform
ation,
includ
ingrig
htsan
dpe
rmission
policies,
isav
ailableat
http://journa
ls.in
form
s.org/.

Wright, Groenevelt, and Shumsky: Dynamic Revenue Management in Airline Alliances22 Transportation Science 44(1), pp. 15–37, © 2010 INFORMS
§5.6, we consider how revenue is allocated betweenpartners under each scheme and, in §5.7, we discussthe computational challenges one faces when attempt-ing to calculate the equilibrium behavior of partnersin an alliance.
5.1. Decision ProcessWe model the set of dynamic decisions for both air-lines as a finite-horizon Markov game (Heyman andSobel 2004). Although at the highest level the forma-tion of the alliance can be viewed as a cooperativegame, the contractual revenue-sharing mechanismmust be implemented within each airline’s revenuemanagement system. These revenue managementsystems are inherently noncooperative, optimizingeach airline’s revenue without taking into accounteach decision’s impact on the partner. Therefore, weassume that, given the transfer-pricing rules of thealliance, the revenue management systems of the air-lines are locked in a noncooperative game. The twoalliance airlines are the players in the game and, in§3.2, we described the information available to eachplayer. The players’ possible actions are quite sim-ple: whether to accept or reject an itinerary request.In addition, under the partner price scheme describedin §5.4.3, the operating airline has one more action—setting the transfer price. Because we use a Markovgame, immediate payments and transition probabili-ties in each state depend only on the action in thatstate.Let J c
k �⇀x� denote the total (current and future)expected value for airline c given inventory ⇀x with kremaining periods and with Jk�
⇀x� denoting, as before,the total value for the alliance so that Jk�
⇀x� = J 1k �⇀x� +J 2k �⇀x�. As in Equation (2), the opportunity cost of theinventory used by an itinerary is denoted with a Jterm, although here we are concerned with each air-line’s individual opportunity cost:
J ck �⇀x�Aj� ≡ J c
k �⇀x� − J ck �⇀x − Aj�
in addition to the opportunity cost of the alliance asa whole Jk�
⇀x�Aj�. As with centralized control, wedefine J c
k �⇀x� = − whenever a component of ⇀x is neg-ative.A policy for airline c consists of a set of acceptance
rules uck� ⇀x� such that
ucj
k �r ⇀x�
=
⎧⎪⎪⎪⎨⎪⎪⎪⎩1 if, at time k with remaining inventory
⇀x, airline c is willing to sell a ticketfor itinerary j with net revenue r�
0 otherwise.
Under the partner price scheme, the policy alsoincludes setting the internal transfer price p
cj
k for eachsubitinerary.
The transfer price pcj
k �⇀x� is a real number associatedwith each airline c, itinerary j , inventory level ⇀x, andperiod k. For certain schemes, p
cj
k �⇀x� is also a functionof the revenue associated with the request. To simplifythe notation, however, we will not include R
cj
k as anargument of p
cj
k . Airline c’s partner must pay pcj
k �⇀x� toairline c to sell the interline itinerary j . Let ⇀pc
k�⇀x� be
the n-vector of all transfer prices in period k.Note that we allow transfer prices to vary across
each and every itinerary even if the subitinerary usedon the operating airline is the same across multipleitineraries. A specific alliance arrangement may notallow for this level of detail. In particular, the market-ing airline may request a subitinerary from the oper-ating airline without revealing the entire itinerary.Therefore, within each period, the alliance will usea single transfer price for each subitinerary on theoperating airline regardless of the itinerary being soldby the marketing airline. Although we do not exam-ine the precise effects of this assumption, one wouldexpect that a reduction in the amount of shared infor-mation would reduce the overall value of the allianceunder decentralized control.Although the specific form of the Bellman (1959)
equations in the decentralized alliance will depend onthe transfer price scheme used, the general form canbe written as
J ck �⇀x �u−c
k �p−ck �⇀x��
= ∑j∈Nc
qcj
k E[R
cj
k ucj
k �Rcj
k �⇀x�+J ck−1�
⇀x−Ajucj
k �Rcj
k �⇀x��]
+ ∑j∈NS
qcj
k E
[R
cj
k �⇀x�ucj
k �Rcj
k �⇀x��⇀x�
+J ck−1�
⇀x−Ajucj
k �Rcj
k �⇀x��⇀x��
]
+ ∑j∈NS
q−cj
k E
[p
cj
k �⇀x�u−cj
k �R−cj
k �⇀x��⇀x�
+J ck−1�
⇀x−Aju−cj
k �R−cj
k �⇀x��⇀x��
]
+ ∑j∈N−c
q−cj
k E�J ck−1�
⇀x−Aju−cj
k �R−cj
k �⇀x���
+q0k J c
k−1�⇀x��
(3)
J c0 �⇀x�=0 ∀⇀x≥⇀
0�
The first summation corresponds to airline c’s intra-line itinerary requests. As with the centralized model,airline c must then decide whether to accept a request.The second summation corresponds to airline c’sinterline itinerary requests. Again, it must choose toaccept or deny the request; however, the revenue onwhich this decision will be made is the revenue asso-ciated with the request less the transfer price paid tothe alliance partner. The remaining two summationscorrespond to interline and intraline requests to air-line c’s partner and the final term corresponds to the
INFORMS
holds
copyrightto
this
article
and
distrib
uted
this
copy
asa
courtesy
tothe
author(s).
Add
ition
alinform
ation,
includ
ingrig
htsan
dpe
rmission
policies,
isav
ailableat
http://journa
ls.in
form
s.org/.

Wright, Groenevelt, and Shumsky: Dynamic Revenue Management in Airline AlliancesTransportation Science 44(1), pp. 15–37, © 2010 INFORMS 23
“no arrival” case. Though airline c receives no rev-enue in the cases corresponding to the final summa-tion, the change in its partner’s inventory does affectits future expected value.Note that in (5.1), the accept/reject control variables
u represent actions taken by the marketing airline andthe formulation does not explicitly allow the operat-ing airline to reject a request even though, under freesale, this action is available to the operating airline.We will see that it will not be necessary to explicitlymodel the operating airline’s acceptance policy underany of the dynamic schemes described in §5.4 becauseunder all three schemes, the transfer price is alwayssufficiently large such that the operating airline willchoose to accept the sale. Under the static schemes of§5.3, the operating airline may choose to reject a sale.In §5.3, we will discuss a modification to (5.1).
5.2. Nonoptimality of Markovian Transfer PriceSchemes
Before examining specific transfer price schemesin detail, we describe a simple counterexample todemonstrate that no Markovian transfer scheme canguarantee network optimality as long as the transferscheme is based solely on sales of interline itineraries.By “Markovian,” we refer to schemes that are com-pletely defined by the current state of the networkand do not depend on past states. Non-Markovianschemes that depend on the particular sample path(the history of which airline sold each seat, for howmuch, and when) could achieve optimality in thefollowing counterexample. The complexity of suchschemes, however, would make them impossible toimplement.Consider two airlines, 1 and 2, each operating one
flight. Each flight has one remaining seat. Table 1shows the expected demand over a two-period hori-zon. In the second column, an itinerary (x�y) requires“x” seats on airline 1 and “y” seats on airline 2. In thesecond to last period (period 2), each airline is equallylikely to receive a request for its intraline itinerarywith associated revenue of $250. In the final period,airline 1 receives a request for an interline itineraryfor $400 with probability one. Clearly, it would be bestfor the alliance if the airline receiving the intralinerequest were to turn it down, leaving its inventory forthe interline itinerary.Let p be the transfer price in the final period paid
to airline 2 if there is sufficient inventory remaining.
Table 1 Data for Counterexample to Transfer Pricing Optimality
Period k Itinerary Aj Marketing airline Revenue ($) Probability
2 (1, 0) Airline 1 250 0.5(0, 1) Airline 2 250 0.5
1 (1, 1) Airline 1 400 1
Therefore, at the beginning of period 2, the opportu-nity costs of the intraline inventory for airline 1 andairline 2 are ($400 − p) and p, respectively. Becauseeach intraline request can be fulfilled without anyof its partner’s inventory, each airline would maxi-mize its own value by accepting an intraline requestif its revenue exceeds its opportunity cost of its inven-tory (see Theorem 1 below for a formal proof of thisbehavior). Thus, to prevent either airline from fill-ing an intraline request, p must satisfy both p > $250and $400 − p > $250, or $250 < p < $150, which is acontradiction.Note that network optimality could be guaranteed
if payments are made for intraline itineraries as wellas interline itineraries. For example, assume that theairlines set p = $100. Then, in period 2, let airline 1offer $151 to airline 2 if airline 2 agrees not to sellthe intraline ticket if a request for that ticket arrives.Given such a subsidy scheme, neither airline willaccept an intraline request and the network is opti-mized. Such transfer payments for intraline tickets,however, are impossible to implement for a variety oftechnological, competitive, and legal reasons.Although no realistic Markovian transfer price
scheme is universally optimal, certain schemes haveintuitive appeal. For example, some practitioners havesuggested that a seat’s opportunity cost (sometimescalled its bid price) would be a logical transfer price(Vinod 2005). Although we will analyze each trans-fer price scheme separately, there are some com-mon results worth noting. These results hold for allthe schemes (static and dynamic) analyzed here. Theresults will also provide us with more general insightsinto why any transfer price scheme can fail to achievefirst-best.
Theorem 1. For the Markov game described in §5.1,there exists a unique, pure strategy Markov perfect equi-librium in which the marketing airline adopts the policy
ucj
k �r ⇀x� ={1 if r ≥ J c
k−1�⇀x�Aj� + p
−cj
k �⇀x��
0 otherwise.
Proof. See Appendix A.Theorem 1 shows that the marketing airline will
accept any request that provides it with net revenuethat exceeds its opportunity cost of the inventoryused in the itinerary. The net revenue is the revenuereceived from the external customer for the itineraryminus any transfer price paid to the operating airline.The counterexample illustrates an adverse conse-
quence of the result in Theorem 1. Because thereis no transfer price paid for the sale of an intra-line itinerary, each airline makes intraline decisionswithout considering the effects of those decisions onits partner’s revenue. Therefore, even if a centralized
INFORMS
holds
copyrightto
this
article
and
distrib
uted
this
copy
asa
courtesy
tothe
author(s).
Add
ition
alinform
ation,
includ
ingrig
htsan
dpe
rmission
policies,
isav
ailableat
http://journa
ls.in
form
s.org/.
Wright, Groenevelt, and Shumsky: Dynamic Revenue Management in Airline Alliances24 Transportation Science 44(1), pp. 15–37, © 2010 INFORMS
controller were to make all interline acceptance deci-sions (removing decision rights on interline itinerariesfrom the marketing and operating carriers), the choiceof the revenue-sharing method for interline itinerarieswould still affect the purely intraline decisions of thepartners. This point is emphasized in Corollary 1 andthe subsequent discussion.
Corollary 1. The equilibrium control for intralinerequests is of the form
ucj
k �r ⇀x� ={1 r ≥ J c
k−1�⇀x�Aj��
0 otherwise.
Proof. This is immediate from Theorem 1 andp
−cj
k �⇀x� = 0 for j ∈ Nc. �
The critical revenue level for airline c’s intralinedecision is its own opportunity cost of the inventoryused for the itinerary, much like the optimal decisionfor a single airline. In this case, however, the opti-mal (centralized) decision for the alliance—shown inProposition 1—is determined by the total opportunitycost of the itinerary of both partners. That is, the crit-ical value should be
Jk−1�⇀x�Aj� = J c
k−1�⇀x�Aj� + J −c
k−1�⇀x�Aj�
We refer to J −ck−1�
⇀x�Aj�, the effect of the changein one airline’s (here, the marketing airline’s) inven-tory on its partner’s value, as the second-order effect.We refer to J c
k−1�⇀x�Aj�, the effect on the airline’s
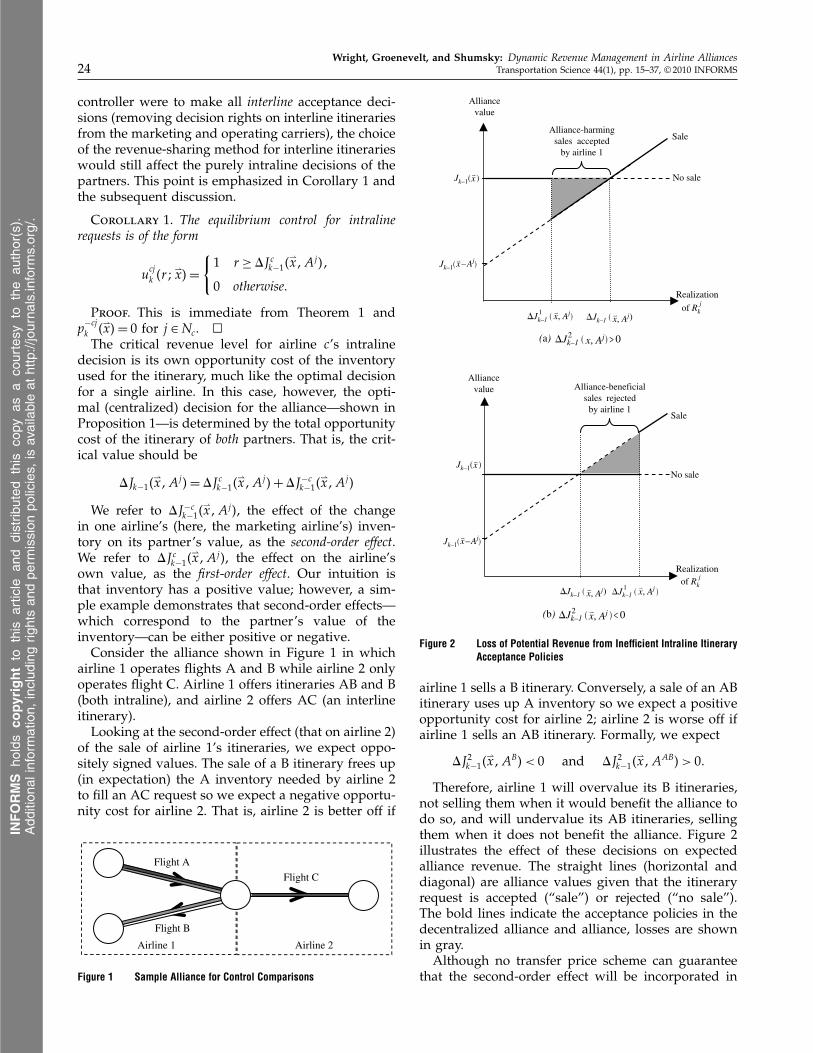
own value, as the first-order effect. Our intuition isthat inventory has a positive value; however, a sim-ple example demonstrates that second-order effects—which correspond to the partner’s value of theinventory—can be either positive or negative.Consider the alliance shown in Figure 1 in which
airline 1 operates flights A and B while airline 2 onlyoperates flight C. Airline 1 offers itineraries AB and B(both intraline), and airline 2 offers AC (an interlineitinerary).Looking at the second-order effect (that on airline 2)
of the sale of airline 1’s itineraries, we expect oppo-sitely signed values. The sale of a B itinerary frees up(in expectation) the A inventory needed by airline 2to fill an AC request so we expect a negative opportu-nity cost for airline 2. That is, airline 2 is better off if
Airline 1
Flight A
Flight B
Flight C
Airline 2
Figure 1 Sample Alliance for Control Comparisons
xJk–1( )�
x–AjJk–1( )�
Realizationj
of Rk
Alliancevalue
No sale
SaleAlliance-harming
sales acceptedby airline 1
x, Aj1 ��Jk–1 ( )
x, Aj2�Jk–1 ( ) > 0(a)
x, Aj2 ��Jk–1 ( ) < 0(b)
jof Rk
Alliance-beneficialsales rejected
by airline 1
Realization
No sale
Sale
Alliancevalue
xJk–1( )�
x–AjJk–1( )�
x, Aj1 ��Jk–1 ( )x, Aj��Jk–1 ( )
x, Aj��Jk–1 ( )
Figure 2 Loss of Potential Revenue from Inefficient Intraline ItineraryAcceptance Policies
airline 1 sells a B itinerary. Conversely, a sale of an ABitinerary uses up A inventory so we expect a positiveopportunity cost for airline 2; airline 2 is worse off ifairline 1 sells an AB itinerary. Formally, we expect
J 2k−1�⇀x�AB� < 0 and J 2k−1�
⇀x�AAB� > 0�
Therefore, airline 1 will overvalue its B itineraries,not selling them when it would benefit the alliance todo so, and will undervalue its AB itineraries, sellingthem when it does not benefit the alliance. Figure 2illustrates the effect of these decisions on expectedalliance revenue. The straight lines (horizontal anddiagonal) are alliance values given that the itineraryrequest is accepted (“sale”) or rejected (“no sale”).The bold lines indicate the acceptance policies in thedecentralized alliance and alliance, losses are shownin gray.Although no transfer price scheme can guarantee
that the second-order effect will be incorporated in
INFORMS
holds
copyrightto
this
article
and
distrib
uted
this
copy
asa
courtesy
tothe
author(s).
Add
ition
alinform
ation,
includ
ingrig
htsan
dpe
rmission
policies,
isav
ailableat
http://journa
ls.in
form
s.org/.

Wright, Groenevelt, and Shumsky: Dynamic Revenue Management in Airline AlliancesTransportation Science 44(1), pp. 15–37, © 2010 INFORMS 25
each airline’s intraline decision making, we will showin §5.5 that certain transfer price schemes can indi-rectly reduce the impact of ignoring second-ordereffects, leading to more efficient intraline decisions.
5.3. Static ProrationIn practice, revenue sharing for interline sales is oftengoverned by static proration (SP) contracts that pro-rate the revenue received from an accepted requestaccording to fixed proportions. (Such contracts areoften enforced via relatively infrequent, ex-post shar-ing of revenue information so that the model formu-lated here is consistent with the information-sharingassumption described at the end of §3.2). One formof static proration specifies how revenue should besplit for each and every itinerary. If airline c is theoperating airline and carries a customer who paid themarketing airline r for itinerary j , airline c receives cjr as a transfer payment while the marketing airlineretains (1− cj�r in revenue. To simplify the notation,we will assume that −cj = �1 − cj� so, in this case,the marketing airline − c’s share of the revenue is −cj r for itinerary j . We will refer to this form of staticproration as itinerary-specific SP.In practice, airlines sometimes use a common pro-
ration rate for multiple itineraries. The most extremeversion uses a common (or universal) proration rate for all itineraries. We examine two types of univer-sal schemes, one based on the identity of the mar-keting airline and another that fixes the proportionfor each airline and ignores whether an airline is themarketing or operating carrier. First, under “universalSP (marketing),” the marketing airline receives �1− �rwhile the operating airline receives r . In the follow-ing analysis, it will be useful to associate a prorationrate with a particular airline c. Thus, under univer-sal SP (marketing), c = if c is the operating airlineand c = �1 − � if c is the marketing airline. Sec-ond, under “universal SP (airline specific),” we assumethat airline 1 receives r and that airline 2 receives�1 − �r . Therefore, c = if c = 1 and c = �1 − �if c = 2. Table 2 summarizes the transfer prices paidto the operating airline under the static prorationschemes. Table 2 also summarizes the dynamic trans-fer price schemes that will be described in detailin §5.4Note that distinctions among the three static prora-
tion schemes will be relevant in the numerical exam-ples described in §6. The results here, however, applyto all three static schemes. For convenience, we usethe proration term cj throughout the following anal-ysis, although the “j” can be eliminated for the uni-versal schemes.
Table 2 Summary of Transfer Prices Paid to Operating Airline c
Static proration (SP) Dynamic transfer prices
Itinerary-specific �cjR−cjk Bid price �Jc
k−1�⇀x�Aj �
SP (full value)Universal SP �R−cj
k Bid price �Jk−1�⇀x�Acj �
(marketing) (partial value)
Universal SP �R−cjk to airline 1 Bid price
(airline specific) and �1− ��R−cjk proration
to airline 2
�Jck−1�
⇀x�Aj �
�Jk−1�⇀x�Aj �
R−cjk
Partner price Chosen by theoperating airline(see Theorem 4)
Theorem 2. For the marketing airline, the equilib-rium interline acceptance policy under a static prorationscheme is
ucj
k �r ⇀x� ={1 if r ≥ J c
k−1�⇀x�Aj�/ cj�
0 otherwise.
Proof. See Appendix A.The interline acceptance policy in Theorem 2
ensures that the marketing carrier earns at least itsopportunity cost of the inventory used. Given staticproration and the model formulation in (5.1), how-ever, an interline itinerary may be accepted when itstotal revenue is less than the full alliance’s opportu-nity cost such that the operating airline earns less thanthe opportunity cost of its seats.An obvious modification would be to give the oper-
ating airline as well as the marketing airline a vetoover the sale of interline itineraries.
Theorem 3. Under a static proration scheme, if boththe marketing and operating airline may veto a sale, thenin equilibrium an interline itinerary is sold only if
Rcj
k ≥max�J ck−1�
⇀x�Aj�/ cj� J −ck−1�
⇀x�Aj�/�1− cj���
Proof. See Appendix A.The acceptance criteria in Theorem 3 guaran-
tees that no request is accepted that would hurteither partner, but increases the likelihood that somerequests that are profitable for the alliance as a wholewill be rejected. Under the widely used free sale sys-tem, both partners have the power to accept or rejecta sale. Therefore, we focus on this modified model forthe remainder of this section and for the numericalexperiments in §6.Now, define a centrally optimal decision as a decision
in period k given inventory ⇀x that would be optimalfor the centralized system in that state. Note that cen-trally optimal interline decisions may not necessarilybe optimal for the decentralized network because inthe decentralized network, the intraline decisions maynot be centrally optimal.
INFORMS
holds
copyrightto
this
article
and
distrib
uted
this
copy
asa
courtesy
tothe
author(s).
Add
ition
alinform
ation,
includ
ingrig
htsan
dpe
rmission
policies,
isav
ailableat
http://journa
ls.in
form
s.org/.
Wright, Groenevelt, and Shumsky: Dynamic Revenue Management in Airline Alliances26 Transportation Science 44(1), pp. 15–37, © 2010 INFORMS
Corollary 2. Under a static proration scheme, thealliance will, in equilibrium, make the centrally optimalinterline acceptance decisions if
cj = J ck−1�
⇀x�Aj�
Jk−1�⇀x�Aj�
�
Proof. After substituting this cj into the accep-tance rule in Theorem 2 both terms in the max-imization become Jk−1�
⇀x�Aj�, the critical value incentralized control. �
We term the ratio on the right-hand side of Corol-lary 2 as airline c‘s value ratio for itinerary j in periodk. Corollary 2 suggests that a static proration schemewill perform well if the proration rates are chosensuch that
cj ≈ J cK�⇀x�Aj�/JK�⇀x�Aj�� (4)
which is the value ratio at the start of the horizon, andif the ratio of opportunity costs is relatively stable formost demand realizations. Note that this ratio is actu-ally a function of the proration rates cj , so a solutionto (2) is a fixed point of the value functions J c
K .Static schemes are simple to implement, requiring
relatively little information to be exchanged amongpartners after the initial proration-rate negotiation. Inaddition, by splitting the itinerary’s revenue betweenthe partners, such schemes do account for the chang-ing values generated by entire itineraries. Theorem 3,however, identifies the flaw in any static scheme:The relative value of seats between the two partnersmay change over time and the static policy does notaccount for these changes. There are additional bar-riers to truly effective implementation of static poli-cies. Finding the appropriate proration ratios for allindividual itineraries can be a daunting task: Becausethe value functions J c
K depend on the entire set of nS
proration rates, the system must be optimized overa continuous space with dimension �0�1�nS , where nS
may be in the 1,000s. In addition, even if a small set ofproration rates seems to work well across a particularnetwork, static schemes have no internal mechanismto adjust for changing network parameters. For exam-ple, arrival rates and revenue distributions can changedramatically over time. After a significant change, theproration rates must be reoptimized and the alliancecontract renegotiated. We will observe the impact ofsuch changes in §6.We now make one final point about the perfor-
mance of static proration under a special case
Corollary 3. When the alliance is composed entirelyof interline itineraries, it can achieve first-best revenue byusing static proration.
Proof. See Appendix A.
Note that Corollary 3 holds for all three forms ofstatic proration if the proration rates are chosen cor-rectly. For universal SP (airline specific), any pro-portion will work; for universal SP (marketing), theproportion must be 0.5; and for itinerary-specific SP,all itineraries must share the same proportion.
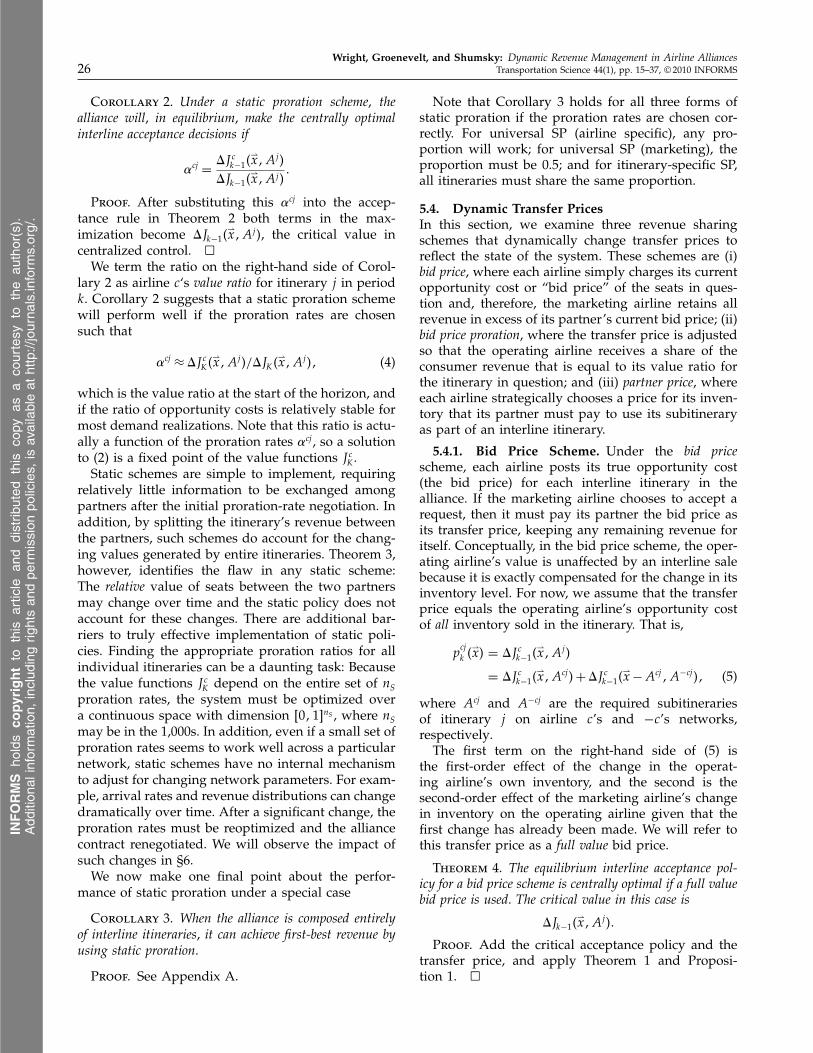
5.4. Dynamic Transfer PricesIn this section, we examine three revenue sharingschemes that dynamically change transfer prices toreflect the state of the system. These schemes are (i)bid price, where each airline simply charges its currentopportunity cost or “bid price” of the seats in ques-tion and, therefore, the marketing airline retains allrevenue in excess of its partner’s current bid price; (ii)bid price proration, where the transfer price is adjustedso that the operating airline receives a share of theconsumer revenue that is equal to its value ratio forthe itinerary in question; and (iii) partner price, whereeach airline strategically chooses a price for its inven-tory that its partner must pay to use its subitineraryas part of an interline itinerary.
5.4.1. Bid Price Scheme. Under the bid pricescheme, each airline posts its true opportunity cost(the bid price) for each interline itinerary in thealliance. If the marketing airline chooses to accept arequest, then it must pay its partner the bid price asits transfer price, keeping any remaining revenue foritself. Conceptually, in the bid price scheme, the oper-ating airline’s value is unaffected by an interline salebecause it is exactly compensated for the change in itsinventory level. For now, we assume that the transferprice equals the operating airline’s opportunity costof all inventory sold in the itinerary. That is,
pcj
k �⇀x� = J ck−1�
⇀x�Aj�
= J ck−1�
⇀x�Acj� + J ck−1�
⇀x − Acj�A−cj �� (5)
where Acj and A−cj are the required subitinerariesof itinerary j on airline c’s and −c’s networks,respectively.The first term on the right-hand side of (5) is
the first-order effect of the change in the operat-ing airline’s own inventory, and the second is thesecond-order effect of the marketing airline’s changein inventory on the operating airline given that thefirst change has already been made. We will refer tothis transfer price as a full value bid price.
Theorem 4. The equilibrium interline acceptance pol-icy for a bid price scheme is centrally optimal if a full valuebid price is used. The critical value in this case is
Jk−1�⇀x�Aj��
Proof. Add the critical acceptance policy and thetransfer price, and apply Theorem 1 and Proposi-tion 1. �
INFORMS
holds
copyrightto
this
article
and
distrib
uted
this
copy
asa
courtesy
tothe
author(s).
Add
ition
alinform
ation,
includ
ingrig
htsan
dpe
rmission
policies,
isav
ailableat
http://journa
ls.in
form
s.org/.

Wright, Groenevelt, and Shumsky: Dynamic Revenue Management in Airline AlliancesTransportation Science 44(1), pp. 15–37, © 2010 INFORMS 27
Theorem 4 shows that the bid price scheme placesno premium on the alliance’s opportunity cost, so itsinterline acceptance decisions are efficient (i.e., cen-trally optimal). However, we will show in §5.5 thatuse of a bid price scheme can lead to inefficient intra-line acceptance decisions, and these inefficient deci-sions may reduce total alliance revenue across thehorizon.There are a few implementation issues associated
with the bid price scheme. The most important maybe the problem of monitoring to ensure honest post-ing of bid prices. We will discuss this issue in §5.4.3.Another implementation issue is the choice of bidprices to use. In our analysis, we assumed that air-lines agree to post their full opportunity costs for eachitinerary. An alternative choice, previously suggestedin Vinod (2005), would be to use only the operat-ing airline’s opportunity cost of its own inventory inthe itinerary i.e., neglecting the second term in (5.1).That is,
pcj
k �⇀x� = J ck−1�
⇀x�Acj�
= J ck−1�
⇀x�Aj� − J ck−1�
⇀x − Acj�A−cj ��
This choice leads to inefficient acceptance decisionsfor interline itineraries because it ignores the second-order effects of the marketing airline’s change ininventory.Another issue is how to handle the case when the
operating airline’s opportunity cost is negative. Strictadherence to the policy would require the operat-ing airline to post its true opportunity cost and thussubsidize the marketing airline’s sales. The operat-ing airline would, therefore, pay the marketing airlineto take its own inventory. It is unlikely that airlineswould be willing to agree to this method; a logi-cal alternative would be to simply post a zero pricein place of any negative value. Doing so will pro-duce inefficient interline acceptance decisions. In thenumerical experiments of §6, we will use exact, full-value transfer prices for the bid price scheme and willallow negative transfer prices.
5.4.2. Bid Price Proration Scheme. In the bid priceproration scheme, as in the bid price scheme, each air-line posts its current opportunity cost for each inter-line itinerary that its partner sells. However, unlikethe bid price scheme, if the marketing airline choosesto accept a request, then the revenue received is pro-rated by the value ratios of each airline. Specifically,the operating airline (airline c here) receives
J ck−1�
⇀x�Aj�
J ck−1�
⇀x�Aj� + J −ck−1�
⇀x�Aj�r = J c
k−1�⇀x�Aj�
Jk−1�⇀x�Aj�
r� (6)
and the marketing airline retains
1− J ck−1�
⇀x�Aj�
Jk−1�⇀x�Aj�
r = J −ck−1�
⇀x�Aj�
Jk−1�⇀x�Aj�
r� (7)
The marketing airline is free to fill the itinerary aslong as the operating airline’s share of the revenueexceeds its posted opportunity cost.
Theorem 5. The equilibrium interline acceptance pol-icy for the bid price proration scheme is centrally optimalwith critical acceptance values Jk−1�
⇀x�Aj��
Proof. See Appendix A.Theorem 5 shows that under the bid price proration
scheme, the airlines respond to interline requests ina manner identical to their response under the bidprice scheme—the interline requests are accepted ifand only if it benefits the alliance to do so.When the revenue associated with the request
exactly equals the total opportunity cost of thepartners—i.e., when there is no surplus revenue—then the bid price proration scheme gives each part-ner the same revenues as the bid price scheme.However, unlike the bid price scheme, each partnerreceives a share of the revenue proportional to its rel-ative opportunity cost when the surplus revenue isgreater than zero. The operating airline’s share canbeneficially affect its decisions for intraline itineraries,resulting in higher revenues over the horizon thanwith the bid price scheme (see §5.5).The bid price proration scheme also has imple-
mentation issues similar to those described for thebid price scheme. However, because proration ratesare used to calculate transfer prices, the impact ofzero and negative opportunity costs requires evenmore attention. A typical revenue-sharing arrange-ment would require these proportions to be betweenzero and one. Because opportunity costs can be neg-ative, however, it is possible for the proportions tobe negative, greater than one, or even infinite ifthe two opportunity costs add to zero. Therefore, itis impractical to implement the scheme exactly asdescribed in Equations (6) and (7), and the part-ners must agree on methods to handle extremecases. We propose two methods. The first method,like the bid price scheme, would replace negativeopportunity costs with zero and “round” the pro-ration rates to zero or one, ensuring that pay-ments fall between zero and r . The second methodwould require an airline with a negative opportu-nity cost to subsidize its partner by exactly thatamount instead of by an amount proportional to r ,leading to payments in excess of r or payments in the“wrong direction” (i.e., the operating airline pays themarketing airline to use its seats). We use this secondmethod in the numerical experiments of §6.
5.4.3. Partner Price Scheme. In the partner pricescheme, each airline posts a dynamically updated listof transfer prices for each interline itinerary that itspartner offers for sale. The partner price scheme canbe used as a model of an actual contract that gives
INFORMS
holds
copyrightto
this
article
and
distrib
uted
this
copy
asa
courtesy
tothe
author(s).
Add
ition
alinform
ation,
includ
ingrig
htsan
dpe
rmission
policies,
isav
ailableat
http://journa
ls.in
form
s.org/.

Wright, Groenevelt, and Shumsky: Dynamic Revenue Management in Airline Alliances28 Transportation Science 44(1), pp. 15–37, © 2010 INFORMS
the operating airline the power to set transfer prices.It is also important to see the partner price scheme asa model for a bid price scheme in which the partners“game” the system and are untruthful about theirbid prices. We will see here that if bid prices cannotbe monitored, each partner has an incentive to posthigher prices than its actual bid prices. In our numer-ical experiments, we will see that such “gaming” of abid price scheme can reduce alliance revenue. We willalso see that for certain networks, the inflation of bidprices can actually increase alliance revenue.Now, we discuss implementation details of our
partner price scheme. Our model is consistent withthe timing of two scenarios: Either all transfer pricesare set at the beginning of each period, or the operat-ing airline generates a transfer price on demand whenthe marketing airline makes a particular request.These transfer prices are based on the distribution ofthe revenues offered to the marketing airline becausethe operating airline does not know the actual real-ization of the revenue associated with a request whensetting the prices (see the discussion at the end of§3.2). The marketing airline, on receiving a request,bases its acceptance decision on the realized valueof the revenue and the posted transfer price. Notethat the operating airline’s problem is to find the besttransfer price for a “take it or leave it” offer, one of the“greed and regret” problems described by Sheopuriand Zemel (2007).For Theorem 6, define h
cj
k �r� = fcj
k �r�/Fcj
k �r� andg
cj
k �r� = rhcj
k �r�. Function gcj
k is often called the gener-alized hazard rate function of F
cj
k .
Theorem 6. The equilibrium transfer price policy foreach itinerary satisfies
pcj
k = J ck−1�
⇀x�Aj� + 1/h−cj
k �J −ck−1�
⇀x�Aj� + pcj
k ��
If the distribution of R−cj
k has increasing generalizedfailure rate (IGFR), i.e., g
−cj
k �r� is nondecreasing, thenthe transfer price is guaranteed to be unique.Proof. See Appendix A.Theorem 6 shows that the transfer price set by the
operating airline (here, airline c) equals its opportu-nity cost for the itinerary plus a premium equal to thereciprocal of the hazard rate of the itinerary’s revenueevaluated at the threshold value of the marketing air-line’s acceptance decision—the sum of the market-ing airline’s opportunity cost and the transfer price.Uniqueness of the transfer price is then guaranteed ifthe revenue distributions have increasing generalizedfailure rate (IGFR), as is the case for the normal, uni-form, exponential, beta, and many other distributions.The size of the premium chosen by the operating air-line balances the increase in revenue received for eachrequest accepted by its partner with the decreasingprobability that the net revenue will be sufficientlyhigh for its partner to accept.
Corollary 4. The equilibrium acceptance policy undera partner price scheme has an acceptance threshold value:
Jk−1�⇀x�Aj� + 1/h
cj
k �J ck−1�
⇀x�Aj� + p−cj
k �⇀x���
Proof. Add the critical acceptance and transferpricing policies and apply Theorem 1. �
Note that the strategic premium chosen by the oper-ating airline to maximize its own expected revenuecauses the marketing airline to make interline accep-tance decisions that are not centrally optimal. Themarketing airline will decline a request that would bebeneficial to the alliance because the net revenue itreceives does not fully compensate it for the oppor-tunity cost of the inventory used. Figure 3 shows theexpected revenue for the marketing (“M”) and operat-ing (“O”) airlines with no premium versus a positivepremium.Although the premium leads to inefficient accep-
tance decisions for interline itineraries, we will show
Realization
Alliancevalue
M
No sale
Sale
Realization
Alliancevalue
M
O
No sale
SaleAlliance-beneficial sales rejected
xJk–1( )�
x–AjJk–1( )�
x, A j��Jk–1 ( )
xJk–1( )�
x–AjJk–1( )�
x, A j��Jk–1 ( )
(a) No premium
(b) Positive premium
jof Rk
jof Rk
Figure 3 Alliance Value Under the Partner Price SchemeNote. The shaded areas are the expected surplus revenue received by themarketing (M) and operating (O) airlines.
INFORMS
holds
copyrightto
this
article
and
distrib
uted
this
copy
asa
courtesy
tothe
author(s).
Add
ition
alinform
ation,
includ
ingrig
htsan
dpe
rmission
policies,
isav
ailableat
http://journa
ls.in
form
s.org/.

Wright, Groenevelt, and Shumsky: Dynamic Revenue Management in Airline AlliancesTransportation Science 44(1), pp. 15–37, © 2010 INFORMS 29
in §5.5 that the premium may provide indirect bene-fits by improving intraline acceptance decisions.
5.5. Benefits of Surplus SharingAlthough the strategic premium in the partner pricescheme can lead to inefficient interline decisions, theuse of such a scheme may produce higher expectedrevenue over the horizon than other revenue-sharingalternatives. To see why, consider the example pre-sented in Table 3.In period one, airline 2 receives a request for its
intraline itinerary with expected revenue of $50 withprobability one. If airline 2 has the required seat, itwill always accept because its opportunity cost is $0in this period, giving an opportunity cost in period2 of $50. With the bid price scheme, airline 1 wouldaccept its interline itinerary request for any revenuegreater than $50 (sum of the opportunity costs), pay-ing airline 2 exactly its $50 opportunity cost. Inperiod 3, airline 2 would then accept any request withrevenue greater than $50—the opportunity cost of itsintraline inventory in period 3—so it would sell itslast seat, preventing the alliance from selling the valu-able interline itinerary in period 2. The expected rev-enue for airlines 1 and 2 under this scheme is $0 and$100, respectively, with total expected revenue for thealliance of $100.Under the partner price scheme, the transfer price
charged by airline 2 in period 2 will be $775, leadingto an acceptance level of $775 for airline 1 and anopportunity cost of $576 for airline 2 in period 3. Asa result, airline 2 would not sell its intraline itineraryin period 3, leaving the inventory for sale by airline 1in period 2. The expected revenues for airlines 1 and2 under this scheme are $273 and $576, respectively,with total expected revenue for the alliance of $839.This example illustrates the benefits to the alliance
of allowing its partner to share in the surplus rev-enue it receives for interline itineraries. Because air-lines will ignore second-order effects when makingintraline decisions, an airline that receives only itsown opportunity cost for inventory under the bidprice scheme will undervalue its inventory when, inthe future, that inventory might be used by its part-ner to fill a valuable interline request. When operatingairlines receive a portion of the expected surplus rev-enue, they consider the benefit of these future inter-line sales and (at least partially) account for allianceopportunity costs when making intraline decisions.
Table 3 Data for Example Illustrating Benefit of Premiums
Period Itinerary Marketing Distribution Probabilityk Aj airline of Rcj
k qcjk
3 (0, 1) Airline 2 U�50�150 12 (1, 1) Airline 1 U�500�1�500 11 (0, 1) Airline 2 U�25�75 1
The choice between partner price and bid price is,therefore, a tradeoff between the cost of inefficientinterline decisions and the benefit of surplus shar-ing, which helps to convey information that leadsto better intraline decisions. The bid price prorationscheme maintains the efficient interline decisions ofbid price while providing some of the informationsharing of partner price. The relative costs and bene-fits of each scheme depend greatly on the parametersof the alliance, as illustrated in §6.
5.6. Revenue AllocationHere, we discuss briefly the implications of eachdynamic transfer price scheme on the allocation ofrevenue between alliance partners. The relative levelof revenue received by the operating airline for aninterline request will be higher under a partner pricescheme than under a bid price scheme. In the part-ner price scheme, the operating airline is given moredecision rights—it chooses the premium that bene-fits it the most. Therefore, it extracts a portion of thesurplus revenue that the marketing airline can retaincompletely under the bid price scheme. The bid priceproration scheme also provides the operating airlinewith a portion of the surplus revenue. Because therevenue is split according to the value of the inven-tory provided by each partner, it might be arguedthat this is a “fair” distribution. However, bid priceproration sharing, like partner price sharing, does notreward the marketing airline for generating interlinerequests.
5.7. Computational LimitationsGiven that the revenue management of a single air-line network of realistic size requires the adoption ofapproximation methods (see Talluri and van Ryzin2004b), computational limitations place tight restric-tions on the size of the alliance problem that cananalyzed using the full dynamic program describedearlier. For example, the size of the dynamic pro-gram’s state space for an alliance comprised of twoequally sized airlines would be roughly the square ofthe size of the separate single-airline problems. There-fore, an important step from theory to practice willbe the development of approximation methods forsolving the alliance problem. The interaction of thepartners within the game framework may precludethe direct use of existing approximation methods,or the application of existing methods may requiresignificant transformations of the alliance problemdescribed earlier.
6. Numerical ExamplesTo illustrate several of the effects discussed earlier, weexamine the impact of each revenue-sharing scheme
INFORMS
holds
copyrightto
this
article
and
distrib
uted
this
copy
asa
courtesy
tothe
author(s).
Add
ition
alinform
ation,
includ
ingrig
htsan
dpe
rmission
policies,
isav
ailableat
http://journa
ls.in
form
s.org/.

Wright, Groenevelt, and Shumsky: Dynamic Revenue Management in Airline Alliances30 Transportation Science 44(1), pp. 15–37, © 2010 INFORMS
on a set of sample alliances. In §6.1, we exam-ine the relative performance of the three dynamictransfer-pricing schemes analyzed in §5 for two smallalliances—one symmetric and one asymmetric—under changing system parameters. Then, in §6.2,we compare the performance of the best dynamicscheme, the partner price scheme (which can beinterpreted as a dynamic bid price scheme withuntruthful partners), and the three static schemes.As discussed in in §5.7, computational requirementslimit the size of the problems that we could analyze.Though the small sizes of these examples do not allowus to make definitive statements about the perfor-mance of these schemes in real-world networks, theexamples do highlight the fundamental points dis-cussed above.
6.1. Relative Performance of Dynamic SchemesIn this section, we examine two small alliances inwhich each airline operates one flight—A for airline1 and B for airline 2—with 10 seats each. The timehorizon has 30 periods. Revenues are normally dis-tributed and increase stochastically as the time todeparture approaches. See Appendix B for detailedinformation on the parameters.The first example that we examine is a bal-
anced (symmetric) alliance. Each partner sees thesame demand distribution for its intraline itinerary(itinerary A or B) and an equal share of the interlinerequests (AB). The revenue distributions associatedwith the intraline and the interline requests are thesame for both partners.Figure 4 shows the results for this symmetric
alliance as the proportion of intraline requests versusinterline requests grows. The vertical axis representsthe alliance revenue as a percent of the first-best rev-enue. At the far left, customers only request inter-line itineraries so the two schemes that make efficientinterline decisions—the bid price proration scheme
92
94
96
98
100
0.40.20 0.6 0.8 1.0
Fraction of requests for local itineraries
Rev
enue
(pe
rcen
tage
of
firs
t-be
st)
Partnerprice
Bid priceproration
Bid price
Figure 4 Percent of First-Best Total Revenue in Sample SymmetricAlliance
and the bid price scheme—perform optimally. Theinefficiencies of the partner price scheme or, alter-natively, the effects of cheating under the bid pricescheme are also clear. Because each partner behaves inits own self-interest, transfer prices are too high andalliance revenues suffer. As in the prisoner’s dilemma,this produces lower revenues for each partner becausetotal alliance revenue is split 50/50 in this symmetricalliance.On the far right, the alliance is receiving only intra-
line requests and, therefore, behaves as two sepa-rate airlines making individually optimal decisions.Because no interline requests are received, the choiceof sharing scheme does not affect the total value andall schemes perform optimally. Finally, in the regionbetween these two extremes, we see that the inef-ficiencies in both intraline decision making and thehandling of interline requests reduce the performanceof each scheme.To further illustrate the benefits of surplus shar-
ing discussed in §5.5, we now consider an asymmet-ric alliance in which only airline 1 receives requestsfor its intraline itinerary (A) while both airlines mayreceive requests for the interline itinerary (AB). Fig-ure 5 shows the effects on alliance value as the frac-tion of interline requests received by airline 1 movesfrom zero to one. Figure 6 shows the percentage ofalliance revenue extracted by airline 1 for each sce-nario shown in Figure 5.At the far left of Figures 5 and 6, airline 1 receives
all intraline requests while airline 2 receives all inter-line requests. We see in Figure 5 that the partner pricescheme has the best performance while bid price pro-ration outperforms the bid price scheme. On the leftside of Figure 6, we see that under the partner pricescheme, airline 1 receives a relatively large proportionof the alliance value by choosing a high transfer price.Bid price proration balances the contributions of bothairlines while the bid price scheme awards more of
Fraction of connecting requests to airline 1
70
80
90
100
0 0.2 0.4 0.6 0.8 1.0
Rev
enue
(pe
rcen
tage
of
firs
t-be
st)
Bid price
Bid priceproration
Partnerprice
Figure 5 Percent of First-Best Total Revenue in Sample AsymmetricAlliance
INFORMS
holds
copyrightto
this
article
and
distrib
uted
this
copy
asa
courtesy
tothe
author(s).
Add
ition
alinform
ation,
includ
ingrig
htsan
dpe
rmission
policies,
isav
ailableat
http://journa
ls.in
form
s.org/.

Wright, Groenevelt, and Shumsky: Dynamic Revenue Management in Airline AlliancesTransportation Science 44(1), pp. 15–37, © 2010 INFORMS 31
60
80
100
0 0.2 0.4 0.6 0.8 1.0
Bid priceproration
PartnerpriceBid price
(full valued)
Perc
enta
ge o
f al
lianc
e re
venu
eto
air
line
1
Fraction of connecting requests to airline 1
Figure 6 Percent of Alliance Value Captured by Airline 1 in theAsymmetric Alliance
the value generated by the interline itineraries to themarketing airline, airline 2.The left sides of Figures 5 and 6 reinforce the insight
of §5.5: Allowing the operating airline to set its owntransfer price and capture more revenue can improvethe performance of the alliance as a whole becausethis facilitates the sharing of information about thevalue of inventory. The example also shows that bidprice proration can facilitate such information sharingbut to a lesser degree. We should emphasize, how-ever, that the left side of Figures 5 and 6 representsan extreme case in which all sales of the high-valuedinterline itineraries are made by a single airline, asmight be the case in an alliance between a large inter-national airline and a smaller national airline. Whenthe airlines are closer to being equal partners, as inFigure 4, the partner price scheme reduces alliancerevenue as well as the revenue of each partner.Now, on the far right side of Figure 5, airline 2 does
not bring any sales to the alliance so that under the(optimal) bid price proration and bid price schemes,airline 2’s opportunity cost is always zero. There-fore, airline 1 pays nothing per seat to airline 2 andcaptures 100% of the revenue (see Figure 6). The rightside of Figure 5 suggests the benefits of the capac-ity purchase agreements that are typically used fornational and regional alliances, in which the nationaland airline controls all revenue management activi-ties, collects all revenue, and only pays a fixed price(say, a fee per flight) to the intraline alliance part-ner for its participation (see Shumsky 2006 for moredetails on these agreements).
6.2. Comparing Static and Dynamic SchemesHere, we describe experiments that compare the per-formances of static and dynamic schemes in a seriesof networks with increasing heterogeneity in thevalue ratios across itineraries.In the sample network for these experiments, air-
lines 1 and 2 both operate two flights: A and B for
airline 1, and C and D for airline 2. All flights have 4seats remaining and the time horizon has 20 periods.Flights A and C travel into a connecting city whileB and D fly out of that city. Therefore, there are twoconnecting itineraries: AD and CB. For our baselinemodel, the arrival probabilities and revenue distribu-tions are chosen such that the interline value ratios forairline 1 are approximately 0.58 for both itineraries.That is, airline 1’s opportunity cost represents 58% ofthe total opportunity cost of the alliance for each ofthe interline itineraries. (To be more precise, the valueratios depend on the proration rate used. The value0.58 and other value ratios described next are gen-erated under the itinerary-specific SP scheme usingoptimal itinerary-specific proration rates. We providemore details on this scheme next.)We induce heterogeneity in the value ratios by
increasing (stochastically) the revenues and arrivalprobabilities of each airline’s intraline inbounditinerary with corresponding decreases in each air-line’s intraline outbound itinerary. Specifically, theintraline itinerary revenue distributions and arrivalprobabilities are
E�R1Ak � = 250+ 50� q1A
k = 0�1+ �0�1���E�R1B
k � = 250− 50� q1Bk �= 0�1− �0�1���
E�R2Ck � = 150+ 50� q2C
k = 0�1+ �0�1���E�R2D
k � = 150− 50� q2Dk = 0�1− �0�1���
Figure 7 shows our results when the value ratio het-erogeneity factor � is increased from zero to one withall other parameters held constant. At the extremeright, with � = 1, the value ratios of airline 1 havediverged from 0.58 up to 0.92 for AD and down to0.25 for CB.The line labeled “best dynamic” in Figure 7 shows
the highest revenue achieved by the three dynamicschemes (the bid price scheme was the winner for allpoints shown in Figure 7). Figure 7 also shows the
85
90
95
100
0 0.1 0.2 0.3 0.4 0.5 0.6 0.7 0.8 0.9 1.0
Value ratio heterogeneity factor (�)
Perc
enta
ge o
f fi
rst-
best
rev
enue
s
Universal SP(marketing)
Universal SP(airline specific)
Partner price
Best dynamic
Itinerary-specific SP
Figure 7 Percent of First-Best Under Increasing Value RatioHeterogeneity
INFORMS
holds
copyrightto
this
article
and
distrib
uted
this
copy
asa
courtesy
tothe
author(s).
Add
ition
alinform
ation,
includ
ingrig
htsan
dpe
rmission
policies,
isav
ailableat
http://journa
ls.in
form
s.org/.

Wright, Groenevelt, and Shumsky: Dynamic Revenue Management in Airline Alliances32 Transportation Science 44(1), pp. 15–37, © 2010 INFORMS
partner price scheme and allows us to see the impactif each partner distorts reported bid prices for its own(myopic) gain. The remaining lines show the revenuesfrom the three static mechanisms described in §5.3:(1) a single proportion is used to determine airline 1’sshare of the revenue for all interline itineraries (“uni-versal SP (airline specific)”); (2) a single proportionis used to determine the marketing airline’s share ofthe revenue for all interline itineraries (“universal SP(marketing)”); and (3) a different proportion is usedto determine airline 1’s share of the revenue for eachinterline itinerary (“itinerary-specific SP”). For eachstatic scheme, we numerically find the optimal prora-tion ratios so Figure 7 reports the maximum revenuethat can be achieved by each static scheme.To understand the results in Figure 7, note that the
value ratios determine the relative incentive neededby each airline to reserve its inventory for future inter-line requests rather than selling inventory for usein intraline itineraries. When an interline itinerary’svalue ratios are not 0.5, one airline values the inven-tory more than the other and, therefore, requires alarger share of revenues as incentive to make the rightdecision for the alliance as a whole. If the value ratiosacross the alliance are homogeneous (i.e., a given air-line’s opportunity cost represents the same propor-tion of the alliance opportunity cost for all itineraries),then a single (“universal”) proration rate can be usedeffectively. Specifically, on the left side of Figure 7, a58% share for airline 1 for both itineraries is optimal,although the performances of these optimal univer-sal static schemes are slightly inferior to the perfor-mance of the best dynamic scheme. As the valueratios become heterogeneous, a universal prorationrate cannot provide the proper incentives to maxi-mize alliance revenues. On the right side of Figure 7,the performances of the universal static prorationschemes fall substantially below the best dynamicscheme (bid price) and even well below the partnerprice scheme because the value ratios have diverged.This observation applies to both universal static
schemes. In Figure 7, the performance of the universalSP (marketing) scheme also demonstrates that thoughsuch a scheme could be used to provide an incen-tive to each airline to generate demand—an aspect ofthe problem not captured with our model—it fails toprovide the proper incentives with regard to revenuemanagement decisions.As one would expect, the performance of the static
scheme can be improved by choosing proration ratesthat are specific to each itinerary given their valueratios. Figure 8 shows the optimal itinerary-specificproration rates. In this example, using itinerary-specific rates allows static proration to perform signif-icantly better under heterogeneous value ratios, even
0
10
20
30
40
50
60
70
80
90
100
Itinerary AD(�1AD)
Itinerary CB(�1CB)
Air
line
1’s
shar
e of
rev
enue
(%
)
0 0.1 0.2 0.3 0.4 0.5 0.6 0.7 0.8 0.9 1.0
Value ratio heterogeneity factor (�)
Figure 8 Optimal Proration Rates for Itinerary-Specific SP UnderIncreasing Value Ratio Heterogeneity
outperforming the best dynamic scheme here. How-ever, as discussed in §5.7, implementation of optimalitinerary-specific static schemes is difficult in largenetworks.It should also be noted that the case used in Fig-
ure 7 does not include many elements found in prac-tice that would be likely to hurt the performance ofstatic schemes. To keep the number of parameters rea-sonable, in this example we used stationary revenuedistributions; in practice, itinerary prices would beexpected to change over the horizon. As discussedin §5.3, this second form of heterogeneity—over thehorizon—would adversely affect the performance ofstatic schemes. In a large number of additional experi-ments, we have found that the bid price and bid priceproration schemes perform consistently better thanstatic schemes. We now focus on the relative robust-ness of dynamic schemes.Specifically, the performance of a static proration
scheme declines as the characteristics of the alliancechange, while proration rates are held constant. Fig-ure 9 illustrates this point. To generate the figure, wefirst found the optimal proration rates, given � = 0�50,for both universal SP (airline-specific) and itinerary-specific SP. Then, we evaluated the performance of thestatic schemes using these proration rates in networkswith other values of �. This scenario could representa change in the system from an initial state (� = 0�50)that had been the baseline environment for an allianceagreement.Because the best dynamic scheme automatically
adjusts for these changes, its performance does notchange substantially as � changes, ranging from97.5% to 98.5% of first-best. Universal SP (airline-specific) falls far below the best dynamic scheme,dipping below 85% of first-best for � = 1. Wealso see that the itinerary-specific static proration
INFORMS
holds
copyrightto
this
article
and
distrib
uted
this
copy
asa
courtesy
tothe
author(s).
Add
ition
alinform
ation,
includ
ingrig
htsan
dpe
rmission
policies,
isav
ailableat
http://journa
ls.in
form
s.org/.

Wright, Groenevelt, and Shumsky: Dynamic Revenue Management in Airline AlliancesTransportation Science 44(1), pp. 15–37, © 2010 INFORMS 33
85
95
100
Universal SP(airline specific)
Itinerary-specific SP
Perc
enta
ge o
f fi
rst-
best
rev
enue
s
Best dynamic
Partner price
0 0.1 0.2 0.3 0.4 0.5 0.6 0.7 0.8 0.9 1.0
Value ratio heterogeneity factor (�)
90
Figure 9 Percent of First-Best When Using Static Schemes That AreOptimal in a Network with = 0�5
scheme, which is optimal when � = 0�5, performspoorly when value ratio heterogeneity is low (� = 0).Another method to test the robustness of a static
scheme is to use the wrong proration rate for agiven network. In reality, there are many reasons whyalliance members may choose an incorrect rate. Forexample, under commonly used mileage prorationagreements, proration rates are based on the rela-tive mileage of flight legs in an interline itinerary, anattribute that may not correspond with the actual rela-tive value of inventory (see Boyd 1998a). In Figure 10,each curve shows the percent of first-best revenueachieved in a network with � = 0�50 under itinerary-specific SP, holding the proration rate for AD constant,and varying the rate for interline itinerary CB. Thesolid line shows results for the optimal AD prorationrate of 77% (from the plot, we can see that the optimalpair of rates is CB= 39% and AD= 77%).Although a small error (<10%) on either or both
proration rates causes a reduction of less than 2% offirst-best revenue, such an error can be sufficient to
97%
57%67%
87%
77%
Perc
enta
ge o
f fi
rst-
best
rev
enue
s
19 24 29 34 39 44 49 54 59
Airline 1’s revenue share for CB (%)
85
90
95
100
Figure 10 Percent of First-Best in a Network with = 0�5When Airline1’s Revenue Share for AD Varies from 57% to 97%
80
85
90
95
100
2 4 6 8 10 12 14 16
Inventory per flight
Best dynamic
Bestuniversal
static
Itinerary-specific SP
Perc
enta
ge o
f fi
rst-
best
rev
enue
s
Figure 11 Percent of First-Best with Increasing Alliance Size
drop the performance of itinerary-specific SP belowthat of the best dynamic scheme. For example, at � =0�50 in Figure 7, the best dynamic scheme achieves98.11% of first-best revenue. At (87%, 49%) in Fig-ure 10, itinerary-specific SP falls to 97.93% of first-bestrevenue. For more substantial deviations, itinerary-specific SP falls well below 90%.Finally, we examined whether these results are
artifacts caused by the small inventory levels oneach flight. Figure 11 suggests that this is notthe case. For these experiments, we use a net-work with � = 1. Inventory levels and the numberof periods in the horizon are scaled from (2, 10)up to (16, 80), and Figure 11 shows the percent-age of first-best alliance revenues for the univer-sal SP (airline-specific), itinerary-specific SP and bestdynamic schemes. The relative performances of thethree schemes do not change significantly over thisscale range, suggesting that similar results may holdfor larger, more realistic inventory levels and horizonlengths.
7. Summary and Further ResearchAirline alliances are selling increasing numbers ofinterline itineraries, creating the need to understandthe impact of revenue-sharing mechanisms on alliancenetwork performance. Although a few papers in theliterature have addressed the broad challenges facedby airline alliances, this paper is the first to rig-orously analyze the revenue-management behaviorof alliance partners under various proration mech-anisms. We began by defining a multiperiod, two-airline Markov game model of an alliance. Analysisof the model generated fundamental insights aboutthe alliance revenue management problem. We findthat no Markovian transfer-price scheme can guaran-tee optimal (first-best) revenues because the sharingof interline revenue cannot directly affect acceptancedecisions for intraline itineraries. We then show that
INFORMS
holds
copyrightto
this
article
and
distrib
uted
this
copy
asa
courtesy
tothe
author(s).
Add
ition
alinform
ation,
includ
ingrig
htsan
dpe
rmission
policies,
isav
ailableat
http://journa
ls.in
form
s.org/.

Wright, Groenevelt, and Shumsky: Dynamic Revenue Management in Airline Alliances34 Transportation Science 44(1), pp. 15–37, © 2010 INFORMS
the performance of static proration schemes dependson the homogeneity and stability of the relative valuesthat each airline places on the inventory used in inter-line itineraries. Dynamic schemes adapt to changes inthese “value ratios,” but there is no one best dynamicscheme. Dynamic schemes based on bid prices gener-ate (centrally) optimal acceptance decisions for inter-line itineraries, but can fail to provide the operat-ing airline with sufficient incentives to align intralinedecisions. This alignment problem can be amelioratedby allowing the operating airline to set its own trans-fer prices (or, if the operating airline “games” a bidprice system), but the resulting inflation of transferprices can distort interline acceptance decisions.We corroborated each of these insights using
numerical experiments in small example networks.The experiments also served to reinforce observationsabout the advantages and challenges of implementingthe static proration schemes that are currently usedin the industry. In one example, we see that a staticscheme with optimal itinerary-specific proration ratescan slightly outperform the dynamic schemes con-sidered here. Computing these optimal static prora-tion rates and keeping them current, however, can bean enormous challenge for alliance partners, and ourexperiments show that the relative performance of thestatic schemes can decline significantly when the net-work parameters no longer match the proration rates.These observations about computational complex-
ity and practical considerations suggest two areason which future research should focus: approxima-tion methods and information asymmetry. As notedin §5.7, there has been significant work on approx-imating the single-airline network revenue manage-ment problem because of the problem’s size. In thesingle-airline problem, methods such as virtual nest-ing and additive bid prices are used to approximatethe opportunity costs of an itinerary’s inventory. Itwould be natural to examine the impact of using sim-ilar approximation methods in an alliance.In addition, in our model, we have assumed that
the airline partners share demand and revenue fore-casts as well as information about current inventorylevels. As such, we assume that each can preciselycalculate the value function for its partners, whichis unlikely even for the smallest alliances. Futureresearch should focus on the effects of relaxing this“complete information” assumption.Another extension to our research would be to
incorporate more advanced arrival and revenue pro-cesses and feedback into our model. As discussedin §3.2, dependency within the arrival stream couldbe added to the model, perhaps by reformulatingthe arrival process using a customer choice model.In addition, a closed-loop model could be created toupdate forecasts as demand is realized.
Finally, in our model, the airlines use a free salescheme to exchange inventory; inventory is onlyexchanged when it is needed to fulfill a specificinterline request. An alternate scheme is dynamictrading—called soft blocking by Boyd (1998a)—inwhich partners are allowed to “trade” (buy and sell)seats on each other’s flights throughout the horizon,shifting inventory to the partner that can use it tocreate the most value for the alliance. The potentialbenefits of dynamic trading are obvious, as demon-strated by Boyd (1998b), which describes conditionsin which a static LP version of the problem canachieve the first-best revenue. Such a scheme, how-ever, has many technical barriers to implementation.In addition, in a preliminary analysis, we have foundthat in a dynamic environment there are many con-ceptual and computational barriers that make airlinebehavior under dynamic trading difficult to predict.Describing the performance of dynamic trading willalso be an interesting area of further research.
AcknowledgmentsThe authors thank Andy Boyd, Ben Vinod, Serguei Netes-sine, two anonymous reviewers, and an associate editorfor their valuable input. The authors appreciate commentsfrom participants in the Tuck School faculty seminar seriesand thank numerous analysts and revenue managers at AirFrance-KLM, Lufthansa, and United Airlines for providinginformation about the current and future practice of rev-enue management in alliances.
Appendix A.Proofs of Markov perfect equilibrium and correspondingpolicies for decentralized alliance control schemes.
Proof of Theorem 1 Given transfer prices p−cjk �x�, each
carrier’s Bellman (1957) equation is given by (3). The optimalcontrol for the marketing airline is defined by
ucjk �r� ⇀x� = argmax
u∈�0�1���r − p
−cjk �x��u + J c
k−1�⇀x − Aju���
With the finite expectation assumption on the revenue distribu-tions, this control can be rewritten as
ucjk �r� ⇀x� = argmax
u∈�0�1��J c
k−1�⇀x� + �r − p
−cjk �x� − J c
k−1�⇀x�Aj��u��
This is maximized by the function
ucjk �r ⇀x� =
{1 r ≥ J c
k−1�⇀x�Aj� + p
−cjk �x��
0 otherwise�(8)
which is the acceptance policy described in Theorem 1.Because only one revenue request can arrive within each period,
both J ck−1�
⇀x�Aj� and p−cjk �x� are independent of ⇀u−c
k �⇀x�, whichare airline −c’s acceptance decisions (as a marketing airline) inperiod k. Therefore, the best-response acceptance decisions for air-line c, ⇀uc
k�⇀x�, are constant with respect to the partner’s decisions
as a marketing airline. That is,
ucjk �r ⇀x� ⇀u−c
k � = ucjk �r ⇀x��
INFORMS
holds
copyrightto
this
article
and
distrib
uted
this
copy
asa
courtesy
tothe
author(s).
Add
ition
alinform
ation,
includ
ingrig
htsan
dpe
rmission
policies,
isav
ailableat
http://journa
ls.in
form
s.org/.

Wright, Groenevelt, and Shumsky: Dynamic Revenue Management in Airline AlliancesTransportation Science 44(1), pp. 15–37, © 2010 INFORMS 35
Because the distribution of Rcjk is continuous, (1) defines a unique
best response by each airline; there are no “ties,” where r =J c
k−1�⇀x�Aj� + p
−cjk �x�.
If the transfer prices are sufficiently large in all cases so thatthe operating airline will always choose to accept a sale, then themarketing airline’s policies u
cjk �r ⇀x� define a unique equilibrium.
If the operating airline −c may reject a sale, then let u−cjk �r ⇀x� be
the operating airline’s acceptance policy. An argument identicalto the one above shows that the optimal policy for the operatingairline is
u−cjk �r ⇀x� =
{1 p
−cjk �x� ≥ J −c
k−1�⇀x�Aj��
0 otherwise.
Again, for each state of the system, this policy is unique and isindependent of the partner’s action. Therefore, the pairs of bestresponses �u
cjk �r ⇀x�� u
−cjk �r ⇀x�� define a unique equilibrium. This
unique equilibrium exists for each subgame defined by each timeperiod and inventory state. Therefore, these best responses definea unique, pure strategy Markov perfect equilibrium. �
Although throughout the paper we assume that the dis-tribution of R
cjk is continuous, if we allow a probability mass
to exist in the revenue distribution, then one could imaginea mixed-strategy equilibrium. Suppose that the realized rev-enue r = J c
k−1�⇀x�Aj�+p
−cjk �x� has a nonzero probability and
consider the following optimal mixed strategy: Requests areaccepted by the marketing airline with some probability �and rejected with probability 1−� when that particular rev-enue is realized. The value to airline c, however, would beunaffected by any choice of � because the expected value isthe same in both cases. The independence of the accept orreject decisions would, again, ensure that the partners’ deci-sions would be unaffected as well. As such, there would beno obvious benefit to such a policy and the added complex-ity is likely to be prohibitive. Therefore, even if the distri-bution of R
cjk is not continuous, one would expect that the
airlines would play pure strategies.
Proof of Theorem 2 (Static Proration). For this scheme,for a given share proportion r for airline c, the conditional Bell-man (1957) equations take the form
J ck �⇀x� = ∑
j∈Nc
qcjk E
[R
cjk �⇀x�u
cjk �R
cjk �⇀x�
+J ck−1�
⇀x−Ajucjk �R
cjk �⇀x��
]
+ ∑j∈Ns
qcjk E
[ cjR
cjk �⇀x�u
cjk � cjR
cjk �⇀x�
+J ck−1�
⇀x−Ajucjk � cjR
cjk �⇀x��
]
+ ∑j∈Ns
q−cjk E
[ −cjR
−cjk �⇀x�u
−cjk � −cjR
−cjk �⇀x�
+J ck−1�
⇀x−Aju−cjk � −cjR
−cjk �⇀x��
]
+ ∑j∈N−c
q−cjk E
[J ck−1�
⇀x−Aju−cjk �R
−cjk �⇀x��
]
+q0k J c
k−1�⇀x��
J c0 �⇀x�=0 ∀⇀x≥0�
where ucjk �r� x� = argmaxu∈�0�1��ru + J c
k−1�x − Aju��. Therefore,when j ∈ NS , u
cjk � cjR
cjk � ⇀x� = 1 if and only if cjR
cjk ≥
J ck−1�
⇀x�Aj�. Because there is at most one arrival in a period, each
policy ucjk �r� x� is independent of the decisions for other inter-
line itineraries in the same period. Therefore, the threshold strat-egy described above yields a Nash equilibrium and the acceptancerules form a Markov perfect equilibrium. �
Proof of Theorem 3 (Modified Static Proration).
Under this scheme, both airlines may veto an interline acceptancedecision. If both partners accept an interline itinerary, the mar-keting airline −c receives its share of the revenue �1− cj �R
−cjk
while the operating airline receives cjR−cjk . By Theorem 2, the
operating airline will accept the request if and only if cjR−cjk ≥
J ck−1�
⇀x�Aj�, and the marketing airline will accept the request ifand only if �1− cj �R
−cjk ≥ J −c
k−1�⇀x�Aj�. Therefore, the combined
acceptance rule is
R−cjk ≥max�J c
k−1�⇀x�Aj�/ cj �J −c
k−1�⇀x�Aj�/�1− cj ��� �
Proof of Corollary 3 (Static Proration). Proof by in-duction. First, let Hk�
⇀x� denote the first-best revenues for thealliance in period k with remaining inventory ⇀x. In period 0, anyalliance has a value of zero. For an arbitrary period k − 1, k ≥ 1,make the following assumption:
J ck−1�
⇀x� = cHk−1�⇀x� c ∈ �1�2��
It follows then that
J ck−1�
⇀x� = cHk−1�⇀x� c ∈ �1�2��
Any interline itinerary will be accepted if
Rck ≥ max�J c
k−1�⇀x�Aj�/ c�J −c
k−1�⇀x�Aj�/�1− c��
= max� cHk−1�⇀x�Aj�/ c��1− c�Hk−1�
⇀x�Aj�/�1− c��
= Hk−1�⇀x�Aj��
Thus, the alliance makes the same acceptance decision as the cen-tralized controller. Additionally, because the share of revenuesreceived by airline c is c , our inductive assumption holds with
J ck �⇀x� = cHk�
⇀x� c ∈ �1�2�� �
Proof of Theorem 5 (Bid Price Proration). Assume thatairline c has received a request for interline itinerary j in periodk with a fare of r . Under bid price proration, the transfer pricethat carrier c must pay if it decides to accept the itinerary requestis then
p−cjk = J −c
k−1�⇀x�Aj�
Jk−1�⇀x�Aj�
r�
Provided that this transfer price is used, airline c’s optimal accep-tance policy is as given in Theorem 1 and the airlines’ acceptancepolicies constitute a Markov perfect equilibrium. Note that withthis transfer price, we have
r ≥ J ck−1�
⇀x�Aj� + p−cjk ⇔ r ≥ Jk−1�
⇀x�Aj�
⇔ p−cjk ≥ J −c
k−1�⇀x�Aj��
In other words, the marketing carrier accepts the itinerary if andonly if it is beneficial for the alliance as a whole, and this is ifand only if the operating carrier receives at least its opportunitycost in compensation. This proves Theorem 5 and also shows thatthe marketing and operating carriers’ interests are aligned whenit comes to making interline acceptance decisions. �
INFORMS
holds
copyrightto
this
article
and
distrib
uted
this
copy
asa
courtesy
tothe
author(s).
Add
ition
alinform
ation,
includ
ingrig
htsan
dpe
rmission
policies,
isav
ailableat
http://journa
ls.in
form
s.org/.

Wright, Groenevelt, and Shumsky: Dynamic Revenue Management in Airline Alliances36 Transportation Science 44(1), pp. 15–37, © 2010 INFORMS
Appendix B. Table of Parameters for Sample Alliances
Parameter Symmetric alliance Asymmetric alliance
Number of periods 30 30Number of seats on leg operated by airline 1 10 10Number of seats on leg operated by airline 2 10 10Probability of an arrival in each period 1 1
Itinerary A AB B A AB
Fraction of requests (for the symmetric alliance, “intraline” is the 0.5 ∗ intraline 1-intraline 0.5 ∗ intraline 0.5 0.5fraction of requests for A or B, and we vary “intraline” from 0 to 1)
Share of requests to airline 1 100% 50% 0% 100% VariesMean revenue per request (last period) 200 500 200 200 400Growth in mean revenue over all periods (%) 20 20 20 20 20Standard deviation of revenue per request 20 50 20 20 40
Proof of Theorem 6 (Partner Price). Recall that weassume that the operating carrier knows only the distributionof the revenue associated with the request received by the mar-keting carrier, not the actual revenue offered by the prospectivepassenger. The operating carrier also knows both its own andthe marketing carrier’s opportunity cost for the itinerary. In thisscheme, the operating carrier chooses the transfer prices for aninterline itinerary request received by the marketing carrier.
For the remainder of the proof, because the operating airlineis making the decision of interest, we will refer to it as c andthe marketing airline as −c. Thus, the relevant transfer pricesestablished by the operating airline are p
cjk �x�. Given these transfer
prices, the marketing carrier’s Bellman (1957) equation is givenby (3) and the optimal control is described in Theorem 1. Now,we consider the equilibrium transfer price chosen by the operatingcarrier. Assume that marketing airline −c received a request forinterline itinerary j ∈ NS and the operating carrier c has chosena transfer price of p. Then, the conditional (on such a requesthaving been received) expected total current and future revenuesfor airline c are given by
Jcjk−1�
⇀x� +∫
0�p − J c
k−1�⇀x�Aj��u
−cjk �r − p� ⇀x�dF
−cjk �r�
= Jcjk−1�
⇀x� + �p − J ck−1�
⇀x�Aj�� �F −cjk �p + J −c
k−1�⇀x�Aj���
Taking the derivative with respect to p gives
�F −cjk �p + J −c
k−1�⇀x�Aj�� − �p − J c
k−1�⇀x�Aj��f
−cjk
· �p + J −ck−1�
⇀x�Aj��
= �F −cjk �p + J −c
k−1�⇀x�Aj���1− �p − J c
k−1�⇀x�Aj��h
−cjk
· �p + J −ck−1�
⇀x�Aj����
where h−cjk �r� = f
−cjk �r�/F
−cjk �r�. Hence, the optimal transfer price
pcjk satisfies
pcjk = J c
k−1�⇀x�Aj� + 1/h
−cjk �J −c
k−1�⇀x�Aj� + p
cjk ��
Note that the condition of Theorem 3 is equivalent to
g−cjk �J −c
k−1�⇀x�Aj� + p
cjk � = p
cjk + J −c
k−1�⇀x�Aj�
pcjk − J c
k−1�⇀x�Aj�
�
where g−cjk �r� = rh
−cjk �r� is the generalized hazard rate function of
the itinerary’s revenue distribution F−cjk �r�. The RHS of this last
equation decreases from + when pcjk = J c
k−1�⇀x�Aj� to one when
pcjk → . Now, assume that the distribution of R
−cjk has increas-
ing generalized failure rate (IGFR), i.e., g−cjk �r� is nondecreasing.
Given that g−cjk �r� has a finite expectation, it follows from The-
orem 2 of Lariviere (2006) that limr→ g−cjk �r� > 1. Hence, the
operating airline’s optimal transfer price is unique.Finally, because there is at most one arrival per period, the
optimal pricing and acceptance policies for a particular interlineitinerary j are independent of other policies for other itineraries inthe same period. Therefore, the results in this section of AppendixA imply that under the IGFR assumption, the transfer price poli-cies in Theorem 3 and acceptance policies in Theorem 1 form aMarkov perfect equilibrium. �
ReferencesAgarwal, R., O. Ergun. 2007. Network design and allocation mech-
anisms for carrier alliances in liner shipping. Working paper.Georgia Institute of Technology, Atlanta.
Barron, R. II. 1997. Code share agreements: A developing trendin U.S. bilateral aviation negotiations. Indiana Law J. 72529–543.
Belden, T. 2007. Southwest Airlines wants to add international ser-vice. Philadelphia Inquirer. May 11, City Ed., D03.
Bellman, R. 1957. Dynamic Programming. Princeton University Press,Princeton, NJ.
Belobaba, P. 1989. Application of probabilistic decision model toairline seat inventory control. Oper. Res. 37(2) 182–197.
Boyd, E. A. 1998a. Airline alliances. OR/MS Today (October) 28–31.Boyd, E. A. 1998b. Airline alliance revenue management. PROS
Strategic Solutions technical report, PROS Revenue Manage-ment, Houston.
Brueckner, J. 2001. The economics of international codesharing: Ananalysis of airline alliances. Internat. J. Indust. Organ. 19(10)1475–1498.
Brueckner, J., W. T. Whalen. 2000. The price effects of internationalairline alliances. J. Law Econom. 43 503–545.
Cachon, G. P., S. Netessine. 2004. Game theory in supply chainanalysis. D. Simchi-Levi, S. D. Wu, Z.-S. Shen, eds. Handbookof Quantitative Supply Chain Analysis: Modeling in the eBusinessEra. Kluwer, New York.
Cachon, G. P., P. H. Zipkin. 1999. Competitive and cooperativeinventory policies in a two-stage supply chain. Management Sci.45(7) 936–953.
Fernandez de la Torre, P. E. 1999. Airline alliances: The airline per-spective. Master’s thesis, Massachusetts Institute of Technol-ogy, Cambridge.
INFORMS
holds
copyrightto
this
article
and
distrib
uted
this
copy
asa
courtesy
tothe
author(s).
Add
ition
alinform
ation,
includ
ingrig
htsan
dpe
rmission
policies,
isav
ailableat
http://journa
ls.in
form
s.org/.

Wright, Groenevelt, and Shumsky: Dynamic Revenue Management in Airline AlliancesTransportation Science 44(1), pp. 15–37, © 2010 INFORMS 37
Glover, F., R. Glover, J. Lorenzo, C. McMillan. 1982. The pas-senger mix problem in the scheduled airlines. Interfaces 12(3)73–79.
Granot, D., S. Yin. 2008. Competition and cooperation in decentral-ized push and pull assembly systems. Management Sci. 54(4)733–747.
Heyman, D. P., M. J. Sobel. 2004. Stochastic models in operationsresearch. Stochastic Optimization, Vol. II. Dover Publications,Mineola, NY.
Houghtalen, L., O. Ergun, J. Sokol. 2007. Designing mechanisms forthe management of carrier alliances. Working paper, GeorgiaInstitute of Technology, Atlanta.
International Air Transport Association (IATA). 2007. Declaredinterline prorate values. Working paper, http://www.iata.org/nr/rdonlyres/f51dc9a0-4f23-4ae1-b586-617ec8ca6ded/0/dipv_final_conceptv1_0.pdf.
Ito, H., D. Lee. 2007. Domestic code sharing, alliances, and airfaresin the U.S. airline industry. J. Law Econom. 50(2) 355–380.
Kasilingam, R. 1996. Air cargo revenue managment: Characteristicsand complexities. Eur. J. Oper. Res. 96 36–44.
Lariviere, M. A. 2006. A note on probability distributions withincreasing generalized failure rates. Oper. Res. 54(3) 602–604.
Lariviere, M. A., E. L. Porteus. 2001. Selling to the newsvendor:An analysis of price-only contracts. Manufacturing Service Oper.Management 3(4) 293–305.
Littlewood, K. 1972. Forecasting and control of passenger bookings.AGIFORS Sympos. Proc. 12 96–117.
Lott, S. 2006. Alliances expected to grow even larger. Aviation WeekSpace Tech. 164(19) 44.
McGill, J., G. van Ryzin. 1999. Revenue management: Researchoverview and prospects. Transportation Sci. 33(2) 233–256.
Nagarajan, M., Y. Bassok. 2008. A bargaining framework in sup-ply chains: The assembly problem. Management Sci. 54(8)1482–1496.
Nagarajan, M., G. Sošic. 2008. Game-theoretic analysis of coopera-tion among supply chain agents: Review and extensions. Eur.J. Oper. Management 187(3) 719–745.
Netessine, S., R. Shumsky. 2004. Revenue management games:Horizontal and vertical competition. Management Sci. 51(5)813–831.
Park, J. 1997. The effect of airline alliances on markets and economicwelfare. Transportation Res. Part E 33(3) 181–195.
Sheopuri, A., E. Zemel. 2007. The greed and regret (GR) problem.Working paper OM-2007-1, Stern School of Business, New YorkUniversity, New York.
Shumsky, R. A. 2006. The Southwest effect, airline alliances,and revenue management. J. Revenue Pricing Management 5(1)83–89.
Spengler, J. 1950. Vertical integration and antitrust policy. J. PoliticalEconom. 58(4) 347–352.
Talluri, K., G. van Ryzin. 1998. An analysis of bid-price con-trols for network revenue management. Management Sci. 44(11)1577–1593.
Talluri, K., G. van Ryzin. 2004a. Revenue management under a gen-eral discrete choice model of consumer behavior. ManagementSci. 50(1) 15–33.
Talluri, K., G. van Ryzin. 2004b. The Theory and Practice of Rev-enue Management. Kluwer Academic Publishers, Dordrecht,The Netherlands.
U.S. Department of Transportation. 2006. Airline origin anddestination survey (DB1B). Research and Innovative Tech-nology Administration, Bureau of Transportation Statistics,Accessed February 13, 2006, http://www.transtats.bts.gov/DataIndex.asp.
Vinod, B. 2005. Alliance revenue management. J. Revenue PricingManagement (Practice Papers) 4(1) 66–82.
Vulcano, G., G. van Ryzin, C. Maglaras. 2002. Optimal dynamicauctions for revenue management. Management Sci. 48(11)1388–1407.
Wynne, R. 1995. From Queen Airs to RJs: Evolution in major-regional airline alliances and code sharing. Handbook of AirlineEconomics. Aviation Week Group, McGraw-Hill, New York.
You, P. S. 1999. Dynamic pricing in airline seat management forflights with multiple legs. Transportation Sci. 33(2) 192–206.
INFORMS
holds
copyrightto
this
article
and
distrib
uted
this
copy
asa
courtesy
tothe
author(s).
Add
ition
alinform
ation,
includ
ingrig
htsan
dpe
rmission
policies,
isav
ailableat
http://journa
ls.in
form
s.org/.