dynamic revenue management in airline...
TRANSCRIPT
1
Dynamic Revenue Management in Airline Alliances
Christopher P. Wright, Harry Groenevelt Simon Graduate School of Business, University of Rochester, Rochester, New York 14627
[email protected], [email protected]
Robert A. Shumsky Tuck School of Business, Dartmouth College, Hanover, New Hampshire 03755
February, 2009
Major airlines are selling increasing numbers of interline itineraries, in which flights operated by two or
more airlines are combined and sold together. One reason for this increase is the rapid growth of airline al-
liances, which promote the purchase of interline itineraries and therefore virtually extend the reach of each
alliance member’s network. This practice, however, creates a difficult coordination problem: each member
of the alliance makes revenue management decisions to maximize its own revenue, and the resulting beha-
vior may produce sub-optimal revenue for the alliance as a whole. Airline industry researchers and consul-
tants have proposed a variety of static and dynamic mechanisms to control revenue management decisions
across alliances (a dynamic mechanism adjusts its parameters as the number of available seats in the net-
work changes). In this paper, we formulate a Markov-game model of a two-partner alliance that can be
used to analyze the effects of these mechanisms on each partner’s behavior. We begin by showing that no
Markovian transfer pricing mechanism can coordinate an arbitrary alliance. Next, we examine three dy-
namic schemes, as well three forms of the static scheme widely used in practice. We derive the equilibrium
acceptance policies under each scheme and use analytical techniques, as well a numerical analyses of sam-
ple alliances, to generate fundamental insights about partner behavior under each scheme. The analysis and
numerical examples also illustrate how certain transfer price schemes are likely to perform in networks
with particular characteristics.
Key words: revenue management, yield management, airlines, Markov game, alliances
____________________________________________________________________________________

2
1. Introduction When one of the authors recently planned a trip from Boston to Barcelona, British Airways
offered a convenient itinerary for $823. The itinerary began with a leg on British Airways from
Boston to London, followed by a second leg on another airline, Iberia, to Barcelona. We will
call such an itinerary an interline itinerary, for it includes service on multiple airlines. The
availability of this two-leg interline itinerary for this fare is contingent on two decisions: (1) the
airline who sells the ticket (the marketing airline, in this example British airways) must make a
seat available on one leg, and (2) the operator of the other leg (the operating airline, Iberia) must
agree to accept the connecting passenger from the marketing airline. Because both airlines prac-
tice revenue management, these decisions depend upon the price paid by the consumer to the
marketing airline for the ticket and the price paid by the marketing airline to the operating airline
for the use of a seat. This article examines agreements among airlines that govern the latter
price, sometimes called revenue sharing, transfer price, or proration agreements. We show how
these agreements have subtle and potentially significant effects on individual airline behavior as
well as on the total revenue collected by multiple airlines across their combined networks.
It is becoming increasingly important to understand the impact of proration agreements on
airline revenue management because sales of interline itineraries have been growing. This in-
crease is due in part to a type of marketing arrangement called a code-share agreement. Under
this arrangement, the operating airline’s flight is also listed as a flight with the marketing air-
line’s name. In the example above, the second leg had an Iberia flight number, but was also la-
beled British Airways Flight 7073 from London to Barcelona. Analysis of data from the U.S.
Department of Transportation (BTS, 2006) reveals that the fraction of interline itineraries within
the U.S. rose from 10% in 1998 to 20% in 2004, and most of those interline itineraries were
marketed under code-share agreements. Overall, 46% of revenues collected from U.S. domestic
flights in 2004 came from interline itineraries.
A second factor driving up interline traffic is the growth of airline alliances. These alliances
usually combine code-share agreements with other arrangements, such as schedule coordination
and the merger of frequent-flier programs. In March 2006, 59% of all worldwide ASMs (avail-
able seat miles, a measure of total capacity equal to the number of seats multiplied by the number

3
of miles flown, summed over all flights) were flown by airlines belonging to one of the three
largest international alliances, Star, SkyTeam or Oneworld (Lott, 2006). Both international and
U.S. alliance activity are expected to grow (Lott, 2006; Belden, 2007; Shumsky, 2006).
While these international alliances facilitate formal marketing and operational arrangements
among airlines, this paper uses the term alliance in a much weaker sense: an alliance is formed
by any two airlines that exchange interline passengers and that have a proration agreement for
the revenue collected from the sale of interline itineraries.
In practice, the rules for revenue sharing are usually laid out in special prorate agreements
(SPAs) that are negotiated by alliance partners. In the absence of an SPA, airlines follow the
rules set out by the International Air Transport Association (see IATA, 2007, for details of the
rules to be implemented over the next few years). Whether they are encoded in an SPA or by the
IATA, most rules include fixed transfer prices for particular flight/fare-class combinations, or
other simple allocation procedures such as a split in revenue (a proration rate) based on relative
mileage. For example, under such a mileage proration scheme, British Airways would receive
the lion’s share of the $823 in the example above for its Boston-to-London flight. Throughout
this paper we call such rules static schemes, for they do not adjust proration rates as demand is
realized and seats are sold.
Although static schemes are easy to manage, they can lead to suboptimal decision-making by
member airlines and lost revenue for the alliance as a whole. For our example, under mileage
proration Iberia would receive a relatively small share of the ticket revenue when flying interline
passengers. Therefore, Iberia may choose to focus on its own (non-interline) customers and not
hold seats for British Airways customers, who may be more lucrative for the alliance. The un-
derlying flaw in any static proration scheme is that the revenue-sharing proportions are not ad-
justed to reflect the actual value of seat inventory. Because the revenue management system of
each airline in the alliance maximizes the revenue of that airline, an airline may reject an itine-
rary if the transfer price undervalues the real-time value of its seats, even if the total revenue
from the itinerary is large.
Given the deficiencies of static schemes, major airlines are considering dynamic schemes,
such as the use of the real-time opportunity costs of seats, or “bid prices,” as transfer prices. In
this paper we examine dynamic schemes that have been described in the published literature (see

4
Vinod, 2005) and have been suggested to the authors by industry executives and revenue manag-
ers. In the industry there is interest in dynamic schemes, but also much uncertainty. There are
certainly technical and legal barriers to implementation; for example, antitrust legislation in the
U.S. prohibits the exchange of certain types of information among airlines. But another signifi-
cant barrier is uncertainty over how revenue-maximizing airlines would respond to dynamic
schemes, and whether such schemes would produce real benefits to the alliance. In fact, there is
no published literature on this topic and, to our knowledge; there has been no rigorous analysis
of these effects by researchers within the industry. This paper is a first attempt to fill that gap.
Now we summarize the organization of the paper and its results. After reviewing the rele-
vant literature in §2, in §3 we describe our general model for a two-airline alliance. In §4 we
describe a centralized network and determine the first-best policies for a centralized yield man-
agement system. In §5 we describe a two-airline alliance model and analyze static and dynamic
transfer price schemes. In this section we first use a counterexample to show that no dynamic
scheme is guaranteed to maximize alliance-wide revenue, unless the dynamic scheme includes
revenue-sharing rules that depend upon the sample path of inventory sales (note that a scheme
based on sample paths would be orders of magnitude more complex than the static and dynamic
schemes being considered by the airlines). We then derive equilibrium policies for the alliance
partners under certain dynamic schemes, and we use the analysis to highlight the strengths and
weaknesses of the schemes in terms of total alliance revenue. In §6 we describe numerical expe-
riments that support the insights from §5. The experiments also compare the performance of
static and dynamic schemes, given certain network parameters. We find that static schemes can
perform as well as dynamic schemes for certain networks, but that the performance of a static
scheme that is optimal for one network can degrade quickly as the network parameters change.
Dynamic schemes often perform better and are more robust. We find, however, that the perfor-
mance of dynamic schemes can be significantly reduced if each operating airline chooses a trans-
fer price to maximize its own revenue. Such would be the case, for example, if the partners in-
itially agree to use bid prices as transfer prices, but then each partner attempts to increase its rev-
enue by reporting incorrect bid prices. Finally, in §7 we summarize our results and describe fu-
ture research.

5
There are a few caveats for the results in this paper. First, we make strong assumptions about
the amount of information available to each alliance partner. Specifically, we use a Markov
game model to describe the alliance, and we use the Nash equilibrium to describe the airlines’
behavior under each proration scheme. For legal and technical reasons the airlines cannot coor-
dinate their revenue management systems, so it is appropriate to use the tools of noncooperative
game theory. To keep the problem tractable, however, we assume that the airlines share the
same information about the state of the game and the distribution of future events, e.g., each air-
line has perfect information about its partner’s inventory level, and both have identical forecasts
of future arrival probabilities and revenue distributions over the entire alliance network (in tech-
nical terms, we define a game of complete information). While this assumption is not realistic,
we believe that the amount of transparency in the industry is increasing. For example, airlines
regularly use the web to monitor the lowest available fare of their competitors, and hire “market
intelligence services” such as QL2 (www.ql2.com) to gather information about competitor ac-
tions. Our model represents a logical extreme case, and the full-information assumption allows
us to generate fundamental insights on how certain proration schemes behave. We provide addi-
tional details and discussion of our information-sharing assumptions in §3.2. In general, analysis
of games with incomplete information will be an interesting area for further research.
A second caveat is that that the numerical experiments described in §6 were conducted using
small networks, in terms of the number of flights and the number of seats. Again, our purpose is
to gain basic insights, i.e., to identify the fundamental advantages and disadvantages of each
transfer price scheme. In addition, we demonstrate that many of these insights apply as the num-
ber of seats in the network grows. An important area for additional research, however, will be to
examine alliance performance over networks of realistic size.
Finally, at a higher level than our analysis, the alliance partners are engaged in a cooperative
process to determine which routes should be available for interline traffic and what proration
rules to use on those routes. In general, the partners seek to increases alliance-wide revenue and
to allocate revenues so that all members are willing to participate in the alliance. We do not
model this higher-level process. Instead, our model provides information about how airlines be-
have, and how total revenues are affected, given sets of interline routes and particular proration
rules. Models that focus on the higher-level problem have begun to appear in the literature, e.g.,

6
Agarwal and Ergun (2007) examine the allocation mechanism design problem for cargo ship-
pers. For airline revenue management, successful high-level negotiations depend upon informa-
tion about the effects of particular proration schemes on network revenues. To our knowledge,
the model presented here is the first to provide such information.
2. Literature Review Revenue management (also referred to as yield management) and its application to the airline
industry have received a great deal of attention since the 1970s when Littlewood (1972) first de-
scribed the basic problem. In that article, Littlewood introduces the result (now referred to as
Littlewood’s rule) that a request for a seat should be fulfilled only if its revenue exceeds the ex-
pected future value of the seat in question. This intuitive rule forms the basis of many control
policies in both theory and practice.
Numerous authors have expanded on Littlewood’s work. See, for example, Belobaba (1989)
who examines a problem with multiple fare-restriction combinations, Glover et al. (1982) who
looks at the passenger mix problem in a network environment, You (1999) who examines a dy-
namic pricing model, and Talluri and van Ryzin (2004a) who utilize a discrete choice model of
demand. For a more thorough description of the revenue management literature, see the survey
by McGill and van Ryzin (1999) and the book by Talluri and van Ryzin (2004b).
The use of competitive game theory in revenue management has been limited. Vulcano et al.
(2002) examine a dynamic game in which a seller faces a sequence of customers who compete
with each other in an auction for a fixed number of units. Netessine and Shumsky (2004) ex-
amine both horizontal and vertical competition between two airlines, where each airline flies a
single leg.
Several aspects of airline alliances have been examined in the literature. Barron (1997) dis-
cusses many of the legal implications of airline alliances, focusing on code-sharing agreements
used widely in the industry. Park (1997) and Brueckner (2001) examine the economic effects of
alliances on fares, traffic levels, profits and market welfare. Brueckner and Whalen (2000) pro-
vide an empirical analysis of the effects of international alliances on fares, showing that interline
fares charged by alliances are approximately 25% lower than those charged by non-allied carri-
ers. Ito and Lee (2006) examine the impact of domestic alliances on airfares.

7
Little attention, however, has been given to how revenue management should be imple-
mented by an airline alliance. Wynn (1995) describes simple transfer price schemes based on the
value of local fares. Boyd (1998a) discusses the methodological and technical challenges of the
alliance revenue management problem. He also refers to a more formal analysis in an unpub-
lished working paper (Boyd, 1998b) in which he formulates a static linear program to describe
the alliance revenue management problem. Boyd then derives conditions under which the seat
allocation between the two airlines maximizes alliance-wide revenue under this model. Vinod
(2005) describes many of the alliance coordination mechanisms now being considered by the
airlines, but provides no formal analysis of their advantages and disadvantages. Some of the
schemes analyzed in this paper correspond to mechanisms described by Vinod. Shumsky (2006)
argues that low-cost competitors are driving the network airlines to rely on alliances for an in-
creasing proportion of their traffic. Both Shumsky (2006) and Fernandez de la Torre (1999) dis-
cuss the need for more research on the effectiveness of alliance agreements, a need we attempt to
fill here. In their paper on revenue management games, Netessine and Shumsky (2004) describe
and analyze a static alliance revenue-sharing mechanism for a two-leg network based on the ex-
pected flow of passengers. In this paper we analyze the performance of dynamic coordination
mechanisms that are designed for arbitrary alliance networks and are similar to schemes that are
proposed by, or actually used by, the airlines.
Ongoing research by Houghtalin et al. (2007) and Agarwal and Ergun (2007) looks at various
aspects of alliances, focusing specifically on cargo carriers. In addition to the inherent difference
between the cargo and passenger revenue management problems (see Kasilingam 1996), their
analysis differs from ours in two fundamental ways: 1) they focus on the high-level alliance for-
mation problem, with cooperative game theory as the appropriate method, while we formulate a
noncooperative game, given an existing alliance and particular revenue-sharing rules; and 2) they
focus on a deterministic optimization problem in which all demand for cargo service has been
realized before routing decisions are made, while our passenger yield management problem is
most appropriately described by a model in which demand is uncertain and arrives over time.
Finally, this paper is related to the extensive literature on supply chain coordination. See
Nagarajan and Sošić (2008) and Cachon and Netessine (2004) for overviews of the related litera-
ture that use, respectively, cooperative and competitive game theory. There are several attributes

8
of our problem, however, that distinguish it from this research stream. First, the flow of products
in the traditional supply chain literature moves in one direction, from raw materials to the con-
sumer. Therefore the unused product does not move ’sideways’ within a level. Second, in the
supply chain literature, production of a product begins at one level with one set of firms (suppli-
ers) and demand is fulfilled at another level by another set of firms (retailers). Neither attribute
holds for our problem. For a specific contrast, consider the literature on assembly systems, for
we can think of a multi-leg itinerary as a final product assembled from multiple components. In
the traditional supply chain literature, an assembler receives components from several suppliers
that are combined to create a new product to sell (e.g, Nagarajan and Bassok, 2008 and Granot
and Yin, 2008.) In our model either airline may serve as the marketing airline, the de facto as-
sembler, and either airline may serve as the operating airline, the de facto supplier.
In addition, the traditional research on supply chain coordination focuses on either single-
period newsvendor problems (e.g., Lariviere and Porteus, 2001) or repeated games in which in-
ventory is replenished between each repetition of the game (e.g., Cachon and Zipkin, 1999). The
characteristics of such problems are quite different from ours, a finite, multi-period problem with
fixed capacity allocated to a stochastic arrival stream. Certain results from our paper may be
similar in interpretation to results from the research on the economics of supply chains. For ex-
ample, the effect of the partner price scheme in §5.4.3 can be seen as a form of double-
marginalization (Spengler, 1950). In general, however, our problem context, model and key re-
sults are quite different from those in the supply chain literature.
3. General Alliance Network Model We consider a dynamic model of an alliance consisting of two partner airlines (carriers), in-
dexed by { }2,1∈c (in a slight abuse of notation, we will denote the “other” airline by -c instead
of by 3 – c). The model can be seen as an extension of the network model described by Talluri
and van Ryzin (1998) into a two-player game framework.
Each flight leg in the network is characterized by an origin, destination, and departure time
(for the remainder of this paper the terms ‘flight’ and ‘flight leg’ are used interchangeably). The
number of flights operated by airline c is denoted cm and 21 mmm +≡ is the total number of
flights offered by the alliance. The alliance offers n itineraries, and each itinerary is either a sin-

9
gle flight or a series of connecting flights within one or both networks. The set of all itineraries is
denoted N and has cardinality n. Within the alliance, these itineraries are divided into three sub-
sets: those that involve only airline 1’s flights (N1), those that involve only airline 2’s flights (N2)
and those that use flights from both airlines (NS). Let 1n , 2n and Sn be the cardinality of each
subset, so that Snnnn ++= 21 . We will refer to the sets N1 and N2 as intraline itineraries and the
set NS as interline itineraries because at least one leg on any itinerary in NS will not be operated
by the airline that sold the ticket.
We use the matrix A to specify the inventory requirements of the itineraries offered by the al-
liance. The matrix element ij
A is the number of seats on flight i required for itinerary j, and
therefore the column vector jA specifies the total inventory required from the alliance network
to satisfy itinerary j. In discussions below, we will assume that each request is for an individual
passenger (i.e., { }1,0∈ij
A ), however group (multi-seat) requests could be handled by creating
additional columns with each positive element equaling the number of passengers in the group.
For example, an itinerary from Rochester, NY to Denver, CO that passes through Chicago, IL
would have 1’s in the rows for Rochester-Chicago and from Chicago-Denver. To handle a fami-
ly of 4 looking to make the same trip, A would need another column with 4’s in those same rows.
For clarity, A can be partitioned as follows,
such that the first 1n columns have only positive elements in the first 1m rows (airline 1’s net-
work), the next 2n columns have only positive elements in the last 2m rows (airline 2’s network)
and the final Sn columns have positive elements in both sets of rows.
While interline itineraries may be sold by either alliance partner (requests for itineraries in NS
may be received by either airline 1 or 2), we assume that intraline itineraries are only sold by the
airline that operates the flights (requests for itineraries in Nc are only received by airline c). In
practice, airlines do sell tickets for itineraries that are exclusively on another airline’s network.
With some additional notation, this possibility can be incorporated into the model, and all of the
A1
0
0 AS1
AS2
A =
N1 N2 NS1 … n1 n1+1 … n1+ n2 n1+ n2 +1 … n
1
m1
m1+1
m A2

10
following results will continue to hold. To keep the exposition and notation simple we will as-
sume that each airline handles its own intraline requests.
The number of remaining (unsold) seats for flight i is denoted ix . The m-dimensional vector
x is the joint vector of remaining inventory for the alliance: { }.,,, 11 11 mmm xxxxx …… +≡
3.1. The Demand Process
We consider a K-period booking horizon, with the current period, denoted k, decreasing from
K to 0. The probability that airline c receives a request for itinerary j in period k is 0≥cjkq . We
assume that each period is short enough such that the probability that the alliance receives more
than one itinerary request in a given period is negligible. The probability that no request arrives
is then:
0
{1,2}
1 0.∈ ∈
= − ≥∑ ∑ cjk k
c j N
q q (1)
The revenue cjkR associated with a request to airline c for itinerary j in a given period k,
conditional on a request being made, is a nonnegative random variable with known cumulative
distribution function (CDF) ( )cjkF r . We assume that cj
kR has a finite expectation. The comple-
mentary CDF is ( ) 1 ( )= −cj cjk kF r F r . Note that ‘c’ in cj
kR is the carrier that receives the consum-
er’s request (the marketing airline). We assume that ( )cjkF r is differentiable with known density
function ( )cjkf r . However, wherever we express our results in terms of ( )cj
kf r , similar results
can be found for non-continuous distributions.
3.2. Assumptions about the Arrival Process and Information-Sharing
We assume that the distribution of each cjkR is independent of the realized revenue in preced-
ing periods. Even simple (first-order) dependency, while theoretically easy to handle with our
model, would be notationally and computationally cumbersome.
In addition, assume that each player formulates an open-loop dynamic program that does not
utilize the realized arrival/revenue stream as feedback for its optimization problem. One could
imagine several closed-loop variations of our model. For example, demand intensity for a given
itinerary could be characterized by an unknown parameter, which would be updated as demand
is realized. Such models would be quite complex and in practice would likely be handled by up-

11
dating the inputs to the model over the horizon without explicitly accounting for the future ef-
fects of this updating process when calculating the current value functions.
We also assume that there is independence between acceptance decisions in one period and
the arrival process in subsequent periods. Specifically, we assume that a customer, when denied
a ticket, will not submit a new request to the alliance for the same or a similar itinerary. This as-
sumption is consistent with the assumptions that underlie many of the models in the revenue
management literature. Incorporating multiple customer preferences into the optimization prob-
lem is an area of ongoing research (e.g., see Talluri and van Ryzin, 2004a). Within alliances,
this behavior would add an interesting wrinkle to our problem because the revenue management
decisions of each airline could, potentially, affect the arrival process of its partners.
As noted in §1, in our model the airlines share full information about their partner’s invento-
ry levels, forecasts of arrival processes, and revenue distributions. This allows the airlines to
calculate, in each time period, a common expected value for a seat on any flight in the network.
Using the terminology of game theory, we assume that each airline knows the strategies and
payoffs of its partner and therefore plays a game of complete information. While this model is
stylized, it allows us to generate fundamental insights into the advantages and disadvantages of
static and dynamic transfer price schemes.
While we assume that each airline knows the potential payoffs of its partners, we do not as-
sume that each airline immediately observes realized payoffs. Specifically, under the partner
price scheme of §5.4.3, the operating airline must post its transfer prices for interline inventory
without knowing the realized revenue associated with an interline request in that period (of
course, the marketing airline sees any realized revenue). Therefore, the partners are playing a
game of imperfect information. This assumption reflects an important source of information
asymmetry found in the real world. For a given itinerary there exist numerous classes and dis-
tribution channels through which the ticket can be sold; the range of prices across these classes
and channels creates the distribution ( )cjkF r of revenue for each itinerary. Although the operating
airline may know the distribution of revenue because prices are publicly posted, it cannot know
the specific class being sold or channel being used at the moment the marketing airline receives a
specific purchase request.

12
3.3. Assumptions about Revenue Sharing
In general, the proration scheme used by the alliance will influence both the total revenue re-
ceived by the alliance and the allocation of revenues to each of the partners. We assume that the
ultimate goal of each partner is to maximize its own wealth (revenue). It is reasonable to as-
sume, however, that by forming an alliance, the partners are seeking a scheme that increases their
joint profits, using some form of ex-ante revenue distribution (e.g., a participation fee) to ensure
that all members of the alliance will continue to participate. In practice, this problem is often
solved by finding a set of interline routes on each airline that leads to a rough balance in the rev-
enue exchanged between the airlines (Ito and Lee, 2006). The choice of mechanism for the dis-
tribution of total revenues is a bargaining problem that we do not examine here. We assume that
some mechanism has already been chosen and that both airlines are willing to participate in the
alliance. Therefore, our primary focus will be on examining how the various trading schemes
affect total alliance revenue.
4. Centralized Control Here we describe the optimal policy for a single, centralized controller making all decisions
to maximize total alliance revenue. In general, members of an airline alliance cannot adopt cen-
tralized revenue management controls (see the end of this section for further discussion), but
these results are useful as they lead to an upper-bound on the total revenue for the alliance. We
will call this upper bound the first-best revenue.
4.1. Decision Process
The fundamental decision made by the centralized controller is whether to accept or reject a
request for an itinerary j, given the revenue offer cjkR and the current state of the system: the re-
maining periods, k, and the remaining inventory of the alliance, x . Let ( )xJ k denote the total
(current and future) expected value for the alliance given inventory x with k remaining periods
and let ( )jk AxJ ,Δ be the opportunity cost to the alliance of the inventory required for itinerary j:
( ) ( ) ( )jkk
jk AxJxJAxJ −−≡Δ , . (2)
For convenience, let ( ) −∞=xJk whenever one of the components of x is negative.
A policy for centralized control consists of a set of acceptance rules, ( )xu jk ;• , such that
13
( )⎪⎩
⎪⎨⎧
=otherwise.0
, revenue with itinerary for ticket a sell towilling is alliance the,inventory remaining with at time if,1; rj
xkxru j
k
We now define the joint arrival probability, jkq , and the corresponding conditional CDF, j
kF ,
of the conditional revenue, ( )rR jk , for a request made to the alliance (rather than to a particular
partner c) for itinerary j in period k:
jk
jk
jk qqq 21 +=
( ) ( ) ( )rFqq
rFqq
rF jkj
k
jkj
kjk
jkj
k2
21
1
⎟⎟⎠
⎞⎜⎜⎝
⎛+⎟⎟
⎠
⎞⎜⎜⎝
⎛= .
The Bellman equations for optimal centralized control can then be written as:
( ) ( ) ( ) ( )( )[ ]
( ) 00
,,E
0
110
≥∀=
−++= ∑∈
−−
xxJ
xRuAxJxRuRqxJqxJNj
jk
jk
jk
jk
jk
jk
jkkkk
where ( ){ }
( ){ }uAxJruxru jk
u
jk −+= −
∈1
1,0maxarg,
Given a request, the centralized controller either accepts the request, receiving the associated
revenue and reducing the inventory level, or denies the request, moving to the next period with
the same inventory.
4.2. Optimal Policies
The decision faced by the centralized controller is identical to the decision faced by a single
airline that maximizes the revenue generated by the combined network of the alliance. We can,
therefore, apply results derived for a single airline network.
PROPOSITION 1. The optimal acceptance policy for centralized control is of the form:
( ) ( )⎩⎨⎧ Δ≥
= −
.0; if1
; 1
otherwiseAxJr
xruj
kjk
PROOF. See Talluri and van Ryzin 1998, Proposition 1.
14
Under the optimal policy, the alliance accepts any request with associated revenue greater than
or equal to the alliance’s opportunity cost of the inventory used on that itinerary. Simply put, it
accepts a request if it is beneficial (in expectation) to do so.
Practical limitations, however, prevent most alliances between large partners from ceding
control of their revenue management systems to a central controller and using an optimal policy
such as the one described in Proposition 1. Barriers to coordination include technical incompati-
bilities among revenue management systems within an alliance, competitive considerations (al-
liance partners are often competitors on many routes and therefore do not want to merge revenue
management systems), and antitrust laws. There are examples, however, of centralized control
in the airline industry. Regional airlines sometimes allow their national partners to collect all
revenues and make all booking decisions, and revenue-sharing is accomplished with a fixed
payment per flight to the regional partner (e.g., similar arrangements are used in the Continen-
tal/ExpressJet and United/Skywest alliances; see Shumsky, 2006). For the remainder of this pa-
per we compare this centralized policy with the policies followed by airlines when revenue man-
agement decisions are distributed among the partners in the alliance. That is, the following de-
centralized control schemes have been used, or are intended for use, among major airlines such
as the primary members of the SkyTeam, Star and OneWorld alliances.
5. Decentralized Control In this section we examine airline behavior when revenue management decisions are decen-
tralized among alliance partners. We assume that each alliance partner is free to accept or reject
a request for an interline seat, as is true under the free sale system that is commonly used by ma-
jor airline alliances (Boyd, 1998a). In our model, interline sales follow the following steps. First,
an airline (hereafter: the marketing airline) receives a request for an interline itinerary. Next, a
transfer price is set for the seats on flights operated by its partner (the operating airline) that are
needed to complete the itinerary (there are a variety of methods for setting transfer prices, and
we will describe specific schemes in §5.3 and §5.4). Next, the operating airline decides whether
to make its seat available, and then the marketing airline decides whether or not to sell the com-
plete itinerary. Finally, if the itinerary is sold the transfer price is paid to the operating airline.

15
In §5.1, we will describe our model for the alliance under decentralized control. In §5.2, we
will show by counterexample that no transfer pricing scheme can guarantee optimality under
such a system, and we gain insights into the pitfalls inherent in transfer pricing schemes by ex-
amining the equilibrium behavior of the alliance partners under a generic decentralized scheme.
In §5.3 and §5.4, we will describe the equilibrium behavior of the partners under specific transfer
price schemes. In §5.3, we examine static proration, in which revenue from all interline tickets is
split according to a fixed proportion. This scheme is currently used within many alliances. In
§5.4, we analyze three dynamic schemes, which are based on systems proposed by Vinod (2005)
and on systems that are being considered in the industry. In §5.5, we discuss the benefits of al-
lowing the operating airline to set the transfer price and therefore share any surplus revenue re-
ceived by the alliance for an interline request. In §5.6 we consider how revenue is allocated be-
tween partners under each scheme, and in §5.7 we discuss the computational challenges one fac-
es when attempting to calculate the equilibrium behavior of partners in an alliance.
5.1. Decision Process
We model the set of dynamic decisions for both airlines as a finite-horizon Markov game
(Heyman and Sobel, 2004). While at the highest level the formation of the alliance can be
viewed as a cooperative game, the contractual revenue-sharing mechanism must be implemented
within each airline's revenue management system. These revenue management systems are inhe-
rently non-cooperative, optimizing each airline’s revenue without taking into account each deci-
sion’s impact on the partner. Therefore we assume that, given the transfer-pricing rules of the
alliance, the revenue management systems of the airlines are locked in a non-cooperative game.
The two alliance airlines are the players in the game, and in §3.2 we described the informa-
tion available to each player. The players’ possible actions are quite simple: whether to accept or
reject an itinerary request. In addition, under the partner price scheme described in §5.4.3, the
operating airline has one more action, setting the transfer price. Because we use a Markov game,
immediate payments and transition probabilities in each state depend only on the action in that
state.
Let ( )xJ ck denote the total (current and future) expected value for airline c given inventory
x with k remaining periods, with ( )xJ k denoting, as before, the total value for the alliance, so
that ( ) ( ) ( )xJxJxJ kkk21
+= . As in definition (2), the opportunity cost of the inventory used by an
16
itinerary is denoted with a ΔJ term, though here we are concerned with each airline’s individual
opportunity cost,
( ) ( ) ( )jck
ck
jck AxJxJAxJ −−≡Δ , ,
in addition to the opportunity cost of the alliance as a whole, ( )jk AxJ ,Δ . As with centralized
control, we define ( ) −∞=xJ ck whenever a component of x is negative.
A policy for airline c consists of a set of acceptance rules, ( )xu ck ;• , such that:
( )⎪⎩
⎪⎨⎧
=otherwise,0
, revenuenet with itinerary for ticket a sell to willingis airline ,inventory remaining with at time if,1; rj
cxkxru cj
k
Under the partner price scheme, the policy also includes setting the internal transfer price, cjkp ,
for each sub-itinerary.
The transfer price, ( )xpcjk , is a real number associated with each airline c, itinerary j, invento-
ry level x and period k. For certain schemes ( )xpcjk is also a function of the revenue associated
with the request. To simplify the notation, however, we will not include cjkR as an argument of
cjkp . Airline c’s partner must pay ( )xpcj
k to airline c to sell the interline itinerary j. Let ( )xpck be
the n-vector of all transfer prices in period k.
Note that we allow transfer prices to vary across each and every itinerary even if the sub-
itinerary used on the operating airline is the same across multiple itineraries. A specific alliance
arrangement may not allow for this level of detail. In particular, the marketing airline may re-
quest a sub-itinerary from the operating airline without revealing the entire itinerary, and there-
fore within each period the alliance will use a single transfer price for each sub-itinerary on the
operating airline, regardless of the itinerary being sold by the marketing airline. While we do not
examine the precise effects of this assumption, one would expect that a reduction in the amount
of shared information would reduce the overall value of the alliance under decentralized control.
While the specific form of the Bellman equations in the decentralized alliance will depend on
the transfer price scheme used, the general form can be written as,

17
( )( )
( ) ( )( )[ ]
( ) ( )( ) ( )( )( )[ ]
( ) ( )( ) ( )( )( )[ ]
( )( )[ ] ( )
( ) ,00
,
E
,~,~E
,~,~~E
E
,
0
11
01
1
1
1
≥∀=
⎟⎟⎟⎟⎟⎟⎟⎟⎟⎟⎟⎟⎟
⎠
⎞
⎜⎜⎜⎜⎜⎜⎜⎜⎜⎜⎜⎜⎜
⎝
⎛
+−
+−+
+−+
+−+
=
∑
∑
∑
∑
−∈−
−−−
−
∈
−−−
−−−
∈−
∈−
−−
xxJ
xJqRuAxJq
xxRuAxJxxRuxpq
xxRuAxJxxRuxRq
RuAxJRuRq
xpuxJ
c
Njkk
cjk
cjk
jck
cjk
Nj
cjk
cjk
jck
cjk
cjk
cjk
cjk
Nj
cjk
cjk
jck
cjk
cjk
cjk
cjk
Nj
cjk
cjk
jck
cjk
cjk
cjk
cjk
ck
ck
ck
c
S
S
c
(3)
( ){ }
( ){ } ( ) ( ).~ and maxarg, where 11,0
xpRxRuAxJruxru cjk
cjk
cjk
jk
u
cjk
−−
∈−=−+=
The first summation corresponds to airline c’s intraline itinerary requests. As with the cen-
tralized model, airline c must then decide whether to accept a request. The second summation
corresponds to airline c’s interline itinerary requests. Again, it must choose to accept or deny the
request, however, the revenue on which this decision will be made is the revenue associated with
the request less the transfer price paid to the alliance partner. The remaining two summations
correspond to interline and intraline requests to airline c’s partner, while the final term corres-
ponds to the “no arrival” case. While airline c receives no revenue in the cases corresponding to
the final summation, the change in its partner’s inventory does affect its future expected value.
Note that in (3) the accept/reject control variables u represent actions taken by the marketing
airline, and the formulation does not explicitly allow the operating airline to reject a request even
though, under free sale, this action is available to the operating airline. We will see that it will
not be necessary to explicitly model the operating airline’s acceptance policy under any of the
dynamic schemes described in §5.4, for under all three schemes the transfer price is always suf-
ficiently large such that the operating airline will choose to accept the sale. Under the static
schemes of §5.3 the operating airline may choose to reject a sale, and in that Section we will dis-
cuss a modification to (3).
5.2. Non-Optimality of Markovian Transfer-Price Schemes
Before examining specific transfer price schemes in detail, we describe a simple counter-
18
example to demonstrate that no Markovian transfer scheme can guarantee network optimality, as
long as the transfer scheme is based solely on sales of interline itineraries. By ‘Markovian’ we
refer to schemes that are completely defined by the current state of the network and do not de-
pend upon past states. Non-Markovian schemes that depend on the particular sample path (the
history of which airline sold each seat, for how much, and when) could achieve optimality in the
following counter-example. The complexity of such schemes, however, would make them im-
possible to implement.
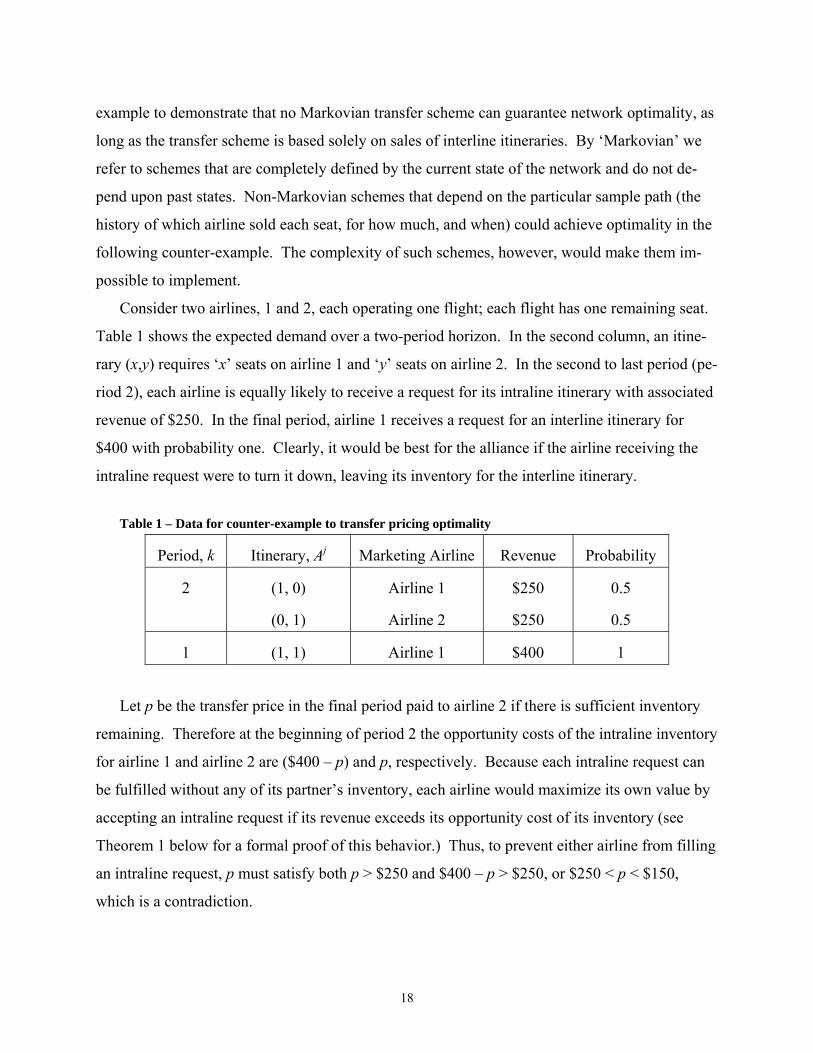
Consider two airlines, 1 and 2, each operating one flight; each flight has one remaining seat.
Table 1 shows the expected demand over a two-period horizon. In the second column, an itine-
rary (x,y) requires ‘x’ seats on airline 1 and ‘y’ seats on airline 2. In the second to last period (pe-
riod 2), each airline is equally likely to receive a request for its intraline itinerary with associated
revenue of $250. In the final period, airline 1 receives a request for an interline itinerary for
$400 with probability one. Clearly, it would be best for the alliance if the airline receiving the
intraline request were to turn it down, leaving its inventory for the interline itinerary.
Table 1 – Data for counter-example to transfer pricing optimality
Period, k Itinerary, Aj Marketing Airline Revenue Probability
2 (1, 0)
(0, 1)
Airline 1
Airline 2
$250
$250
0.5
0.5
1 (1, 1) Airline 1 $400 1
Let p be the transfer price in the final period paid to airline 2 if there is sufficient inventory
remaining. Therefore at the beginning of period 2 the opportunity costs of the intraline inventory
for airline 1 and airline 2 are ($400 – p) and p, respectively. Because each intraline request can
be fulfilled without any of its partner’s inventory, each airline would maximize its own value by
accepting an intraline request if its revenue exceeds its opportunity cost of its inventory (see
Theorem 1 below for a formal proof of this behavior.) Thus, to prevent either airline from filling
an intraline request, p must satisfy both p > $250 and $400 – p > $250, or $250 < p < $150,
which is a contradiction.

19
Note that network optimality could be guaranteed if payments are made for intraline itinera-
ries as well as interline itineraries. For example, assume that the airlines set p=$100. Then, in
period 2, let airline 1 offer $151 to airline 2 if airline 2 agrees not to sell the intraline ticket if a
request for that ticket arrives. Given such a subsidy scheme, neither airline will accept an intra-
line request and the network is optimized. Such transfer payments for intraline tickets, however,
are impossible to implement for a variety of technological, competitive, and legal reasons.
Although no realistic Markovian transfer-price scheme is universally optimal, certain
schemes have intuitive appeal. For example, some practitioners have suggested that a seat’s op-
portunity cost (sometimes called its bid price) would be a logical transfer price (Vinod, 2005).
While we will analyze each transfer price scheme separately, there are some common results
worth noting. These results hold for all the schemes (static and dynamic) analyzed below. The
results will also provide us with more general insights into why any transfer price scheme can
fail to achieve first-best.
THEOREM 1. For the Markov game described in §5.1, there exists a unique, pure strategy
Markov perfect equilibrium in which the marketing airline adopts the policy,
( ) ( ) ( )⎩⎨⎧ +Δ≥
=−
−
.0 , if1
; 1
otherwisexpAxJr
xrucj
kjc
kcjk
PROOF. See Appendix 1.
Theorem 1 shows that the marketing airline will accept any request that provides it with net
revenue that exceeds its opportunity cost of the inventory used in the itinerary. The net revenue
is the revenue received from the external customer for the itinerary minus any transfer price paid
to the operating airline.
The counter-example presented above illustrates an adverse consequence of the result in
Theorem 1. Since there is no transfer price paid for the sale of an intraline itinerary, each airline
makes intraline decisions without considering that decision’s effect on its partner’s revenue.
Therefore, even if a centralized controller were to make all interline acceptance decisions (re-
moving decision rights on interline itineraries from the marketing and operating carriers), the
choice of the revenue-sharing method for interline itineraries would still affect the purely intra-
20
line decisions of the partners. This point is emphasized in the following corollary and subse-
quent discussion.
Corollary 1. The equilibrium control for intraline requests is of the form:
( ) ( )⎩⎨⎧ Δ≥
= −
.0,1
; 1
otherwiseAxJr
xrujc
kcjk
PROOF. Immediate from Theorem 1 and ( ) .for 0 ccj
k Njxp ∈=−
The critical revenue level for the Airline c’s intraline decision is its own opportunity cost of
the inventory used for the itinerary, much like the optimal decision for a single airline. In this
case, however, the optimal (centralized) decision for the alliance – shown in Proposition 1 – is
determined by the total opportunity cost of the itinerary of both partners. That is, the critical
value should be:
( ) ( ) ( )jck
jck
jk AxJAxJAxJ ,,, 111
−−−− Δ+Δ=Δ
We refer to ( )jck AxJ ,1−−Δ , the effect of the change in one airline’s (here, the marketing air-
line’s) inventory on its partner’s value, as the second-order effect. We refer to ( )jck AxJ ,1−Δ , the
effect on the airline’s own value, as the first-order effect. Our intuition is that inventory has a
positive value, however, a simple example demonstrates that second-order effects – which cor-
respond to the partner’s value of the inventory – can be either positive or negative.
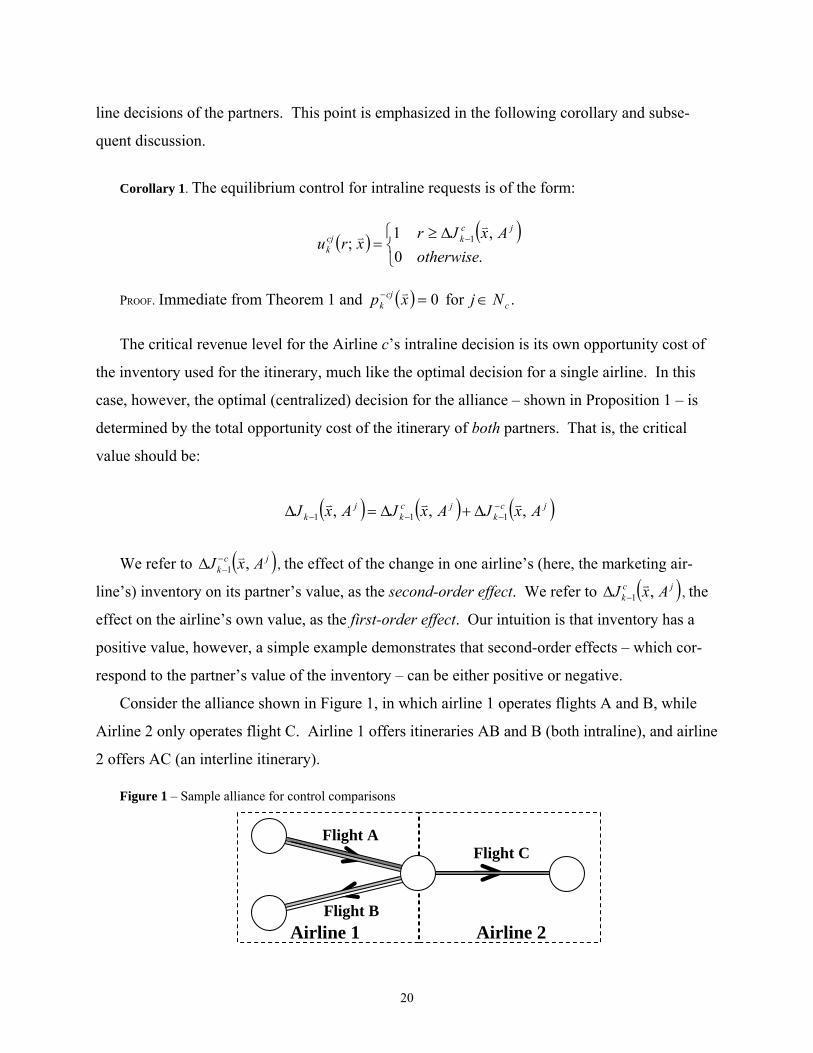
Consider the alliance shown in Figure 1, in which airline 1 operates flights A and B, while
Airline 2 only operates flight C. Airline 1 offers itineraries AB and B (both intraline), and airline
2 offers AC (an interline itinerary).
Airline 1 Airline 2
Figure 1 – Sample alliance for control comparisons
Flight A
Flight B
Flight C

21
Looking at the second-order effect (that on airline 2) of the sale of airline 1’s itineraries, we
expect oppositely signed values. The sale of a B itinerary frees up (in expectation) the A inven-
tory needed by airline 2 to fill an AC request, so we expect a negative opportunity cost for Air-
line 2. That is, airline 2 is better off if airline 1 sells a B itinerary. Conversely, a sale of an AB
itinerary uses up A inventory, so we expect a positive opportunity cost for airline 2; airline 2 is
worse off if airline 1 sells an AB itinerary. Formally, we expect:
( ) ( ) 0, and 0, 21
21 >Δ<Δ −−
ABk
Bk AxJAxJ
Therefore, Airline 1 will overvalue its B itineraries, not selling them when it would benefit
the alliance to do so, and under-value its AB itineraries, selling them when it does not benefit the
alliance. Figure 2 illustrates the effect of these decisions on expected alliance revenue. The
straight lines (horizontal and diagonal) are alliance values, given that the itinerary request is ac-
cepted (“Sale”) or rejected (“No Sale”). The bold lines indicate the acceptance policies in the
decentralized alliance, and alliance losses are shown in gray.
While no transfer price scheme can guarantee that the second-order effect will be incorpo-
rated in each airlines’ intraline decision-making, we will show in §5.5 that certain transfer-price
( ) ( ) 0,21 >Δ −
jk AxJa
Figure 2 – Loss of potential revenue from inefficient intraline itinerary acceptance policies
( )xJk 1−
( ) ( )jk
jk AxJAxJ ,, 111
−− ΔΔ
( )jk AxJ −−1
Realization of
jkR
AllianceValue
( ) ( ) 0,21 <Δ −
jk AxJb
( )xJ k 1−
( ) ( )jk
jk AxJAxJ ,,
111 −− ΔΔ
( )jk AxJ −−1
Realization of
jkR
No Sale
Sale Alliance-harming sales accepted
by airline 1
Alliance-beneficial sales rejected
by airline 1
No Sale
Sale
AllianceValue

22
schemes can indirectly reduce the impact of ignoring second-order effects, leading to more effi-
cient intraline decisions.
5.3. Static Proration
In practice, revenue sharing for interline sales is often governed by static proration (SP) con-
tracts that prorate the revenue received from an accepted request according to fixed proportions.
(Such contracts are often enforced via relatively infrequent, ex-post sharing of revenue informa-
tion, so that the model formulated here is consistent with the information-sharing assumption de-
scribed at the end of §3.2). One form of static proration specifies how revenue should be split
for each and every itinerary. If airline c is the operating airline and carries a customer who paid
the marketing airline r for itinerary j, airline c receives α cjr as a transfer payment while the mar-
keting airline retains (1 – α cj)r in revenue. To simplify the notation we will assume that α -cj =
(1 – α cj), so in this case the marketing airline –c’s share of the revenue is α -cjr for itinerary j.
We will refer to this form of static proration as Itinerary-Specific SP.
In practice, airlines sometimes use a common proration rate for multiple itineraries. The
most extreme version uses a common (or universal) proration rate α for all itineraries. We ex-
amine two types of universal schemes, one based on the identity of the marketing airline and
another that fixes the proportion for each airline and ignores whether an airline is the marketing
or operating carrier. First, under ‘Universal SP (Marketing),’ the marketing airline receives (1 –
α ) r while the operating airline receives α r. In the analysis below it will be useful to associate a
proration rate with a particular airline c, so under Universal SP (Marketing), α c =α if c is the
operating airline and α c =(1 – α ) if c is the marketing airline. Second, under ‘Universal SP
(Airline-specific)’, we assume that airline 1 receives α r and that airline 2 receives (1 – α ) r.
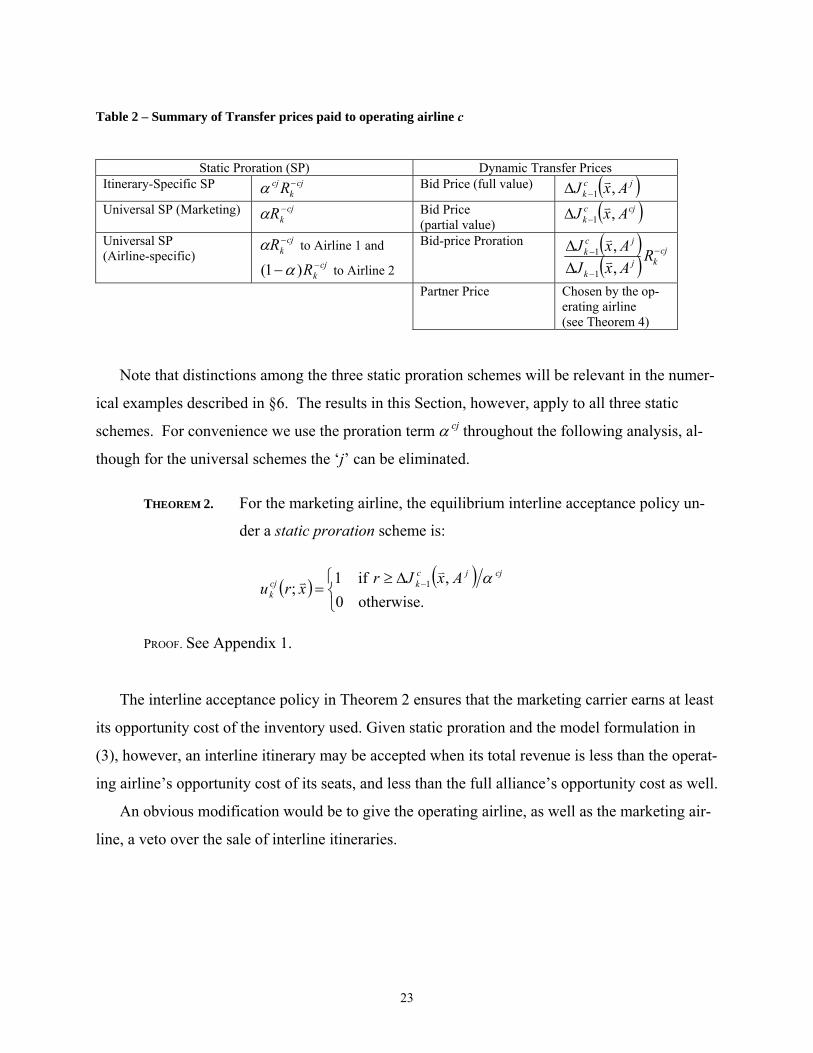
Therefore, α c =α if c=1 and α c =(1 – α ) if c=2. Table 2 summarizes the transfer prices paid to
the operating airline under the static proration schemes. The table also summarizes the dynamic
transfer price schemes that will be described in detail in §5.4
23
Table 2 – Summary of Transfer prices paid to operating airline c
Static Proration (SP) Dynamic Transfer Prices
Itinerary-Specific SP cjk
cj R−α Bid Price (full value) ( )jck AxJ ,1−Δ
Universal SP (Marketing) cjkR −α Bid Price
(partial value) ( )cjc
k AxJ ,1−Δ
Universal SP (Airline-specific)
cjkR −α to Airline 1 and
cjkR −− )1( α to Airline 2
Bid-price Proration ( )( )
cjkj
k
jck R
AxJAxJ −
−
−
ΔΔ
,,
1
1
Partner Price Chosen by the op-erating airline (see Theorem 4)
Note that distinctions among the three static proration schemes will be relevant in the numer-
ical examples described in §6. The results in this Section, however, apply to all three static
schemes. For convenience we use the proration term α cj throughout the following analysis, al-
though for the universal schemes the ‘j’ can be eliminated.
THEOREM 2. For the marketing airline, the equilibrium interline acceptance policy un-
der a static proration scheme is:
( ) ( )⎩⎨⎧ Δ≥
= −
otherwise.0, if1
; 1cjjc
kcjk
AxJrxru
α
PROOF. See Appendix 1.
The interline acceptance policy in Theorem 2 ensures that the marketing carrier earns at least
its opportunity cost of the inventory used. Given static proration and the model formulation in
(3), however, an interline itinerary may be accepted when its total revenue is less than the operat-
ing airline’s opportunity cost of its seats, and less than the full alliance’s opportunity cost as well.
An obvious modification would be to give the operating airline, as well as the marketing air-
line, a veto over the sale of interline itineraries.
24
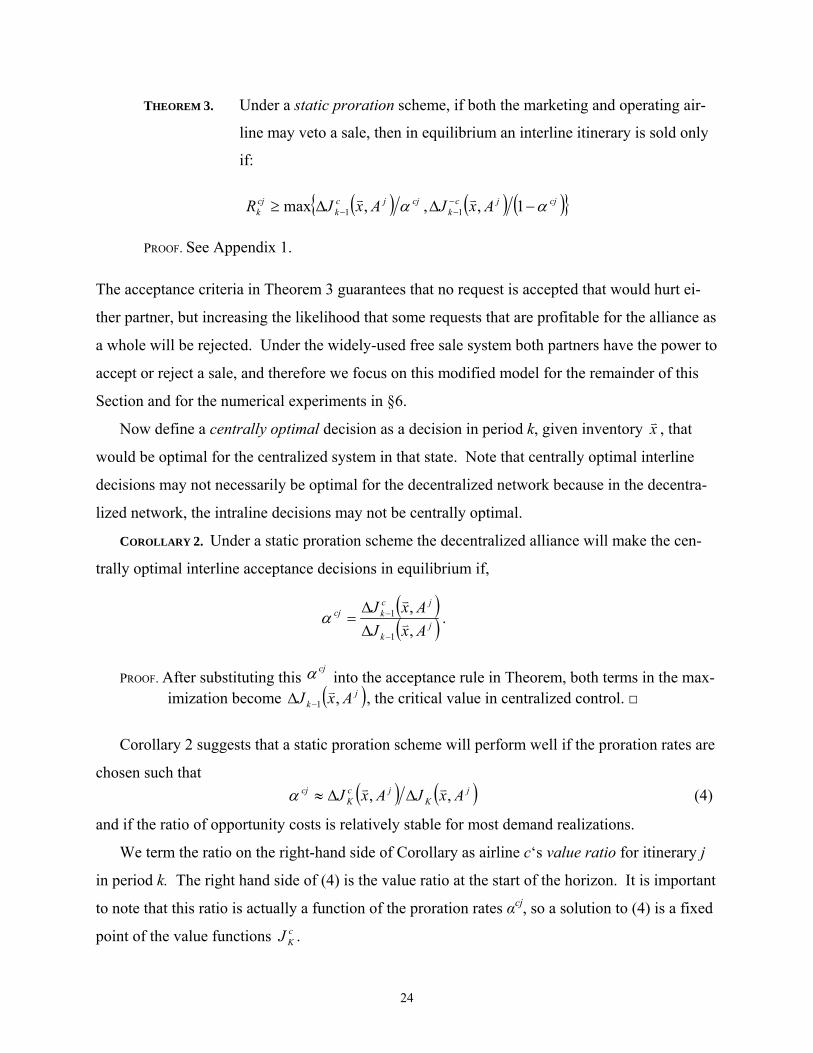
THEOREM 3. Under a static proration scheme, if both the marketing and operating air-
line may veto a sale, then in equilibrium an interline itinerary is sold only
if:
( ) ( ) ( ){ }cjjck
cjjck
cjk AxJAxJR αα −ΔΔ≥ −
−− 1,,,max 11
PROOF. See Appendix 1.
The acceptance criteria in Theorem 3 guarantees that no request is accepted that would hurt ei-
ther partner, but increasing the likelihood that some requests that are profitable for the alliance as
a whole will be rejected. Under the widely-used free sale system both partners have the power to
accept or reject a sale, and therefore we focus on this modified model for the remainder of this
Section and for the numerical experiments in §6.
Now define a centrally optimal decision as a decision in period k, given inventory x , that
would be optimal for the centralized system in that state. Note that centrally optimal interline
decisions may not necessarily be optimal for the decentralized network because in the decentra-
lized network, the intraline decisions may not be centrally optimal.
COROLLARY 2. Under a static proration scheme the decentralized alliance will make the cen-
trally optimal interline acceptance decisions in equilibrium if,
( )( )j
k
jckcj
AxJAxJ
,,
1
1
−
−
ΔΔ
=α .
PROOF. After substituting this cjα into the acceptance rule in Theorem, both terms in the max-
imization become ( )jk AxJ ,1−Δ , the critical value in centralized control. □
Corollary 2 suggests that a static proration scheme will perform well if the proration rates are
chosen such that ( ) ( )j
Kjc
Kcj AxJAxJ ,, ΔΔ≈α (4)
and if the ratio of opportunity costs is relatively stable for most demand realizations.
We term the ratio on the right-hand side of Corollary as airline c‘s value ratio for itinerary j
in period k. The right hand side of (4) is the value ratio at the start of the horizon. It is important
to note that this ratio is actually a function of the proration rates αcj, so a solution to (4) is a fixed
point of the value functions .cKJ

25
Static schemes are simple to implement, requiring relatively little information to be ex-
changed among partners after the initial proration-rate negotiation. In addition, by splitting the
itinerary’s revenue between the partners, such schemes do account for the changing values gen-
erated by entire itineraries. Theorem 3, however, identifies the flaw in any static scheme: the rel-
ative value of seats between the two partners may change over time, and the static policy does
not account for these changes. There are additional barriers to truly effective implementation of
static policies. Finding the appropriate proration ratios for all individual itineraries can be a
daunting task: since the value functions cKJ depend upon the entire set of nS proration ratios, the
system must be optimized over a continuous space with dimension [ ] Sn1,0 , where nS may be in
the thousands. In addition, even if a small set of proration rates seems to work well across a par-
ticular network, static schemes have no internal mechanism to adjust for changing network pa-
rameters. For example, arrival rates and revenue distributions can change dramatically over
time. After a significant change the proration rates must be reoptimized and the alliance contract
negotiated. We will observe the impact of such changes in §6.
We now make one final point about the performance of static proration under a special case:
COROLLARY 3. When the alliance is composed entirely of interline itineraries, it can
achieve first-best revenue by using static proration.
PROOF. See Appendix 1.
Note that Corollary 3 holds for all three forms of static proration described above if the proration
rates are chosen correctly. For Universal SP (Airline-Specific) any proportion will work. For
Universal SP (Marketing), the proportion must be 0.5, while for Itinerary-Specific SP, all itinera-
ries must share the same proportion.
26
5.4. Dynamic Transfer Prices
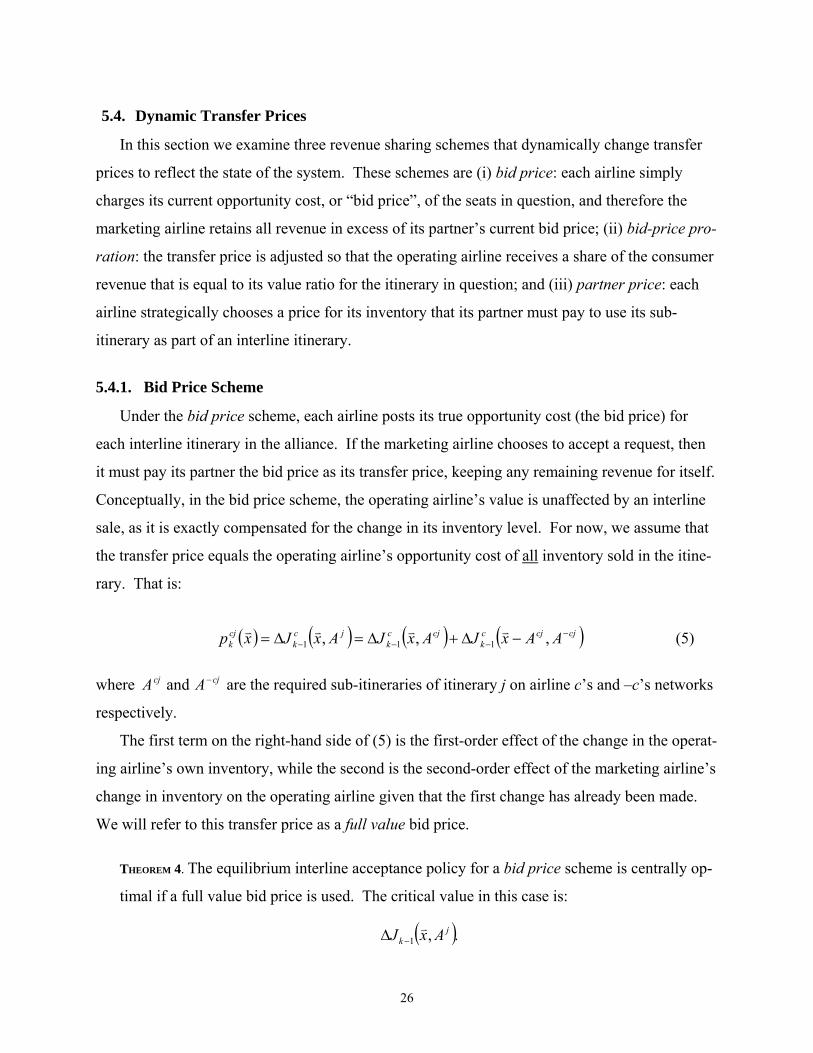
In this section we examine three revenue sharing schemes that dynamically change transfer
prices to reflect the state of the system. These schemes are (i) bid price: each airline simply
charges its current opportunity cost, or “bid price”, of the seats in question, and therefore the
marketing airline retains all revenue in excess of its partner’s current bid price; (ii) bid-price pro-
ration: the transfer price is adjusted so that the operating airline receives a share of the consumer
revenue that is equal to its value ratio for the itinerary in question; and (iii) partner price: each
airline strategically chooses a price for its inventory that its partner must pay to use its sub-
itinerary as part of an interline itinerary.
5.4.1. Bid Price Scheme
Under the bid price scheme, each airline posts its true opportunity cost (the bid price) for
each interline itinerary in the alliance. If the marketing airline chooses to accept a request, then
it must pay its partner the bid price as its transfer price, keeping any remaining revenue for itself.
Conceptually, in the bid price scheme, the operating airline’s value is unaffected by an interline
sale, as it is exactly compensated for the change in its inventory level. For now, we assume that
the transfer price equals the operating airline’s opportunity cost of all inventory sold in the itine-
rary. That is:
( ) ( ) ( ) ( )cjcjck
cjck
jck
cjk AAxJAxJAxJxp −
−−− −Δ+Δ=Δ= ,,, 111 (5)
where cjcj AA − and are the required sub-itineraries of itinerary j on airline c’s and –c’s networks
respectively.
The first term on the right-hand side of (5) is the first-order effect of the change in the operat-
ing airline’s own inventory, while the second is the second-order effect of the marketing airline’s
change in inventory on the operating airline given that the first change has already been made.
We will refer to this transfer price as a full value bid price.
THEOREM 4. The equilibrium interline acceptance policy for a bid price scheme is centrally op-
timal if a full value bid price is used. The critical value in this case is:
( ).,1j
k AxJ −Δ
27
PROOF. Addition of the critical acceptance policy and the transfer price, and application of
Theorem 1 and Proposition 1. □
Theorem 4 shows that the bid price scheme places no premium on the alliance’s opportunity
cost, so its interline acceptance decisions are efficient (i.e., centrally optimal). However, we will
show in §5.5 that use of a bid price scheme can lead to inefficient intraline acceptance decisions,
and these inefficient decisions may reduce total alliance revenue across the horizon.
There are a few implementation issues associated with the bid price scheme. The most im-
portant may be the problem of monitoring to ensure honest posting of bid prices. We will dis-
cuss this issue in Section 5.4.3. Another implementation issue is the choice of bid prices to use.
In the analysis above, we assumed that airlines agree to post their full opportunity costs for each
sub-itinerary. An alternative choice, previously suggested in Vinod (2005), would be to use only
the operating airline’s opportunity cost of its own inventory in the itinerary; i.e., neglecting the
second term in (5). That is:
( ) ( ) ( ) ( )cjcjck
jck
cjck
cjk AAxJAxJAxJxp −
−−− −Δ−Δ=Δ= ,,, 111 .
This choice leads to inefficient acceptance decisions for interline itineraries, for it ignores the
second-order effects of the marketing airline’s change in inventory.
Another issue is how to handle the case when the operating airline’s opportunity cost is nega-
tive. Strict adherence to the policy would require the operating airline to post its true opportunity
cost and, thus, subsidize the marketing airline’s sales. The operating airline would therefore pay
the marketing airline to take its own inventory. It is unlikely that Airlines would be willing to
agree to this method, and a logical alternative would be to simply post a zero price in place of
any negative value. Doing so will produce inefficient interline acceptance decisions. In the nu-
merical experiments of §6 we will use exact, full-value transfer prices for the bid price scheme
and will allow negative transfer prices.
5.4.2. Bid-Price Proration Scheme
In the bid-price proration scheme, as in the bid price scheme, each airline posts its current
opportunity cost for each interline itinerary that its partner sells. However, unlike the bid price
scheme, if the marketing airline chooses to accept a request, then the revenue received is pro-
28
rated by the value ratios of each airline. Specifically, the operating airline (airline c here) rece-
ives,
( )
( ) ( )( )( ) ,
,,
,,,
1
1
11
1 rAxJAxJ
rAxJAxJ
AxJj
k
jck
jck
jck
jck
−
−−−−
−
ΔΔ
=Δ+Δ
Δ (6)
while the marketing airline retains
( )( )
( )( ) r
AxJAxJ
rAxJAxJ
jk
jck
jk
jck
,,
,,
11
1
1
1
−
−−
−
−
ΔΔ
=ΔΔ
− . (7)
The marketing airline is free to fill the itinerary as long as the operating airline’s share of the
revenue exceeds its posted opportunity cost.
THEOREM 5. The equilibrium interline acceptance policy for the bid-price proration scheme is
centrally optimal with critical acceptance values:
( ).,1j
k AxJ −Δ
PROOF. See Appendix 1.
Theorem 5 shows that under the bid-price proration scheme, the airlines respond to interline
requests in a manner identical to their response under the bid price scheme: the interline requests
are accepted if and only if it benefits the alliance to do so.
When the revenue associated with the request exactly equals the total opportunity cost of the
partners – i.e., when there is no surplus revenue – then the bid-price proration scheme gives each
partner the same revenues as the bid price scheme. However, unlike the bid price scheme, when
the surplus revenue is greater than zero, each partner receives a share of the revenue proportional
to its relative opportunity cost. The operating airline’s share can beneficially affect its decisions
for intraline itineraries, resulting in higher revenues over the horizon than with the bid price
scheme (see §5.5).
The bid-price proration scheme also has implementation issues similar to those described for
the bid price scheme. However, because proration rates are used to calculate transfer prices, the
impact of zero and negative opportunity costs requires even more attention. A typical revenue-
sharing arrangement would require these proportions to be between 0 and 1. Because opportuni-

29
ty costs can be negative, however, it is possible for the proportions to be negative, greater than 1,
or even infinite if the two opportunity costs add to zero. Therefore, it is impractical to imple-
ment the scheme exactly as described in equations (6) and (7) and the partners must agree on me-
thods to handle extreme cases. We propose two methods. The first method, like the bid price
scheme, would replace negative opportunity costs with zero and 'round' the proration rates to 0 or
1, ensuring that payments fall between 0 and r. The second method would require an airline with
a negative opportunity cost to subsidize its partner by exactly that amount instead of by an
amount proportional to r, leading to payments in excess of r, or payments in the 'wrong direction'
(i.e., the operating airline pays the marketing airline to use its seats). We use this second method
in the numerical experiments of §6.
5.4.3. Partner price Scheme
In the partner price scheme, each airline posts a dynamically updated list of transfer prices
for each interline itinerary that its partner offers for sale. The partner price scheme can be used
as a model of an actual contract that gives the operating airline the power to set transfer prices. It
is also important to see the partner price scheme as a model for a bid price scheme in which the
partners ‘game’ the system and are untruthful about their bid prices. We will see here that if bid
prices cannot be monitored, each partner has an incentive to post higher prices than its actual bid
prices. In our numerical experiments we will see that such ‘gaming’ of a bid price scheme can
reduce alliance revenue. We will also see that for certain networks the inflation of bid prices can
actually increase alliance revenue.
Now we discuss implementation details of our partner price scheme. Our model is consistent
with the timing of two scenarios: either all transfer prices are set at the beginning of each period,
or the operating airline generates a transfer price on-demand when the marketing airline makes a
particular request. These transfer prices are based on the distribution of the revenues offered to
the marketing airline because the operating airline does not know the actual realization of the
revenue associated with a request (see the discussion at the end of §3.2). The marketing airline,
upon receiving a request, bases its acceptance decision on the realized value of the revenue and
the posted transfer price. Note that the operating airline’s problem is to find the best transfer
price for a ‘take it or leave it offer’, one of the “Greed and Regret” problems described by Sheo-
puri and Zemel (2006).

30
For the following theorem, define ( ) ( ) ( )rFrfrh cjk
cjk
cjk = and ( ) ( )rrhrg cj
kcjk = . Function
cjkg is often called the generalized hazard rate function of cj
kF .
THEOREM 6. The equilibrium transfer price policy for each itinerary satisfies:
( ) ( )( )cjk
jck
cjk
jck
cjk pAxJhAxJp +Δ+Δ= −
−−
− ,1, 11 .
If the distribution of cjkR− has Increasing Generalized Failure Rate (IGFR), i.e.,
( )rg cjk− is non-decreasing, then the transfer price is guaranteed to be unique.
PROOF. See appendix 1.
Theorem 6 shows that the transfer price set by the operating airline (here, airline c) equals its
opportunity cost for the itinerary plus a premium equal to the reciprocal of the hazard rate of the
itinerary’s revenue evaluated at the threshold value of the marketing airline’s acceptance deci-
sion: the sum of the marketing airline’s opportunity cost and the transfer price. Uniqueness of the
transfer price is then guaranteed if the revenue distributions have increasing generalized failure
rate (IGFR), as is the case for the normal, uniform, exponential, beta and many other distribu-
tions. The size of the premium chosen by the operating airline balances the increase in revenue
received for each request accepted by its partner with the decreasing probability that the net rev-
enue will be sufficiently high for its partner to accept.
Corollary 4. The equilibrium acceptance policy under a partner price scheme has an accep-
tance threshold value,
( ) ( ) ( )( )xpAxJhAxJ cjk
jck
cjk
jk
−−− +Δ+Δ ,1, 11 .
PROOF. Addition of the critical acceptance and transfer pricing policies, and application of
Theorem 1.□
31
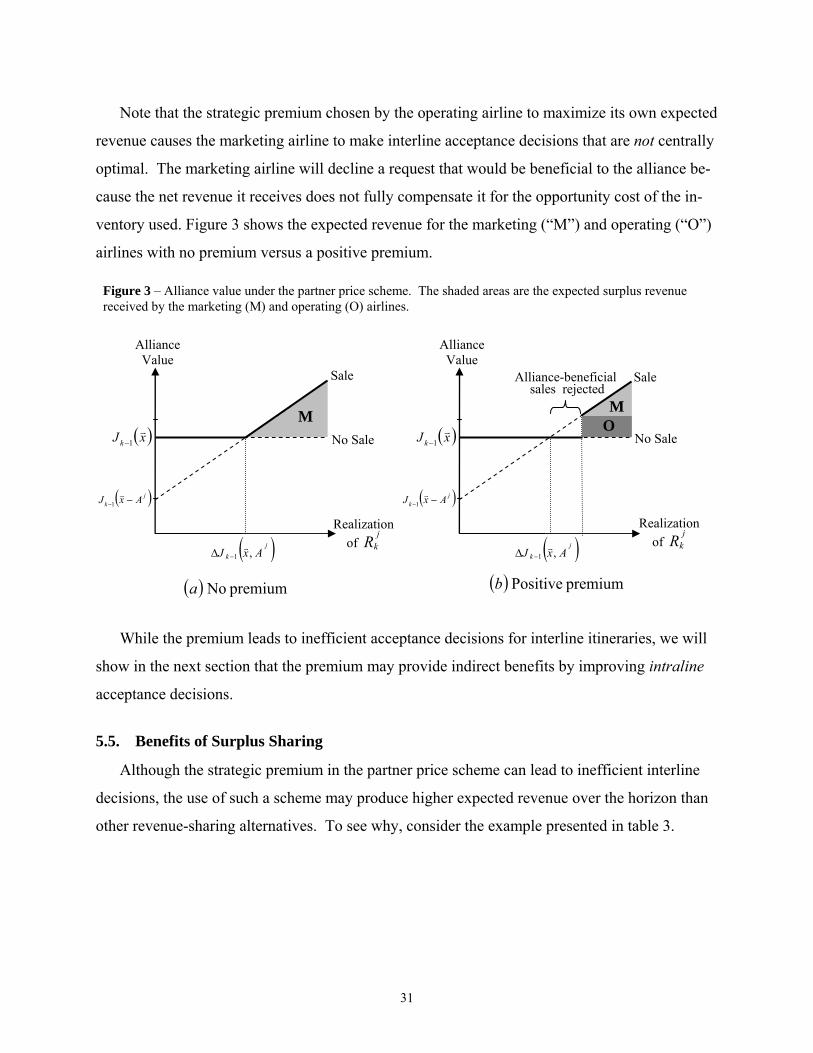
Note that the strategic premium chosen by the operating airline to maximize its own expected
revenue causes the marketing airline to make interline acceptance decisions that are not centrally
optimal. The marketing airline will decline a request that would be beneficial to the alliance be-
cause the net revenue it receives does not fully compensate it for the opportunity cost of the in-
ventory used. Figure 3 shows the expected revenue for the marketing (“M”) and operating (“O”)
airlines with no premium versus a positive premium.
While the premium leads to inefficient acceptance decisions for interline itineraries, we will
show in the next section that the premium may provide indirect benefits by improving intraline
acceptance decisions.
5.5. Benefits of Surplus Sharing
Although the strategic premium in the partner price scheme can lead to inefficient interline
decisions, the use of such a scheme may produce higher expected revenue over the horizon than
other revenue-sharing alternatives. To see why, consider the example presented in table 3.
( ) premium Noa
Figure 3 – Alliance value under the partner price scheme. The shaded areas are the expected surplus revenue received by the marketing (M) and operating (O) airlines.
( )xJ k 1−
( )jk AxJ ,1−Δ
( )jk AxJ −−1
Realization of
jkR
AllianceValue
( ) premium Positiveb
Realization of
jkR
( )xJ k 1−
( )jk AxJ ,1−Δ
( )jk AxJ −−1
AllianceValue
M M O
No Sale
Sale
No Sale
SaleAlliance-beneficial sales rejected
32
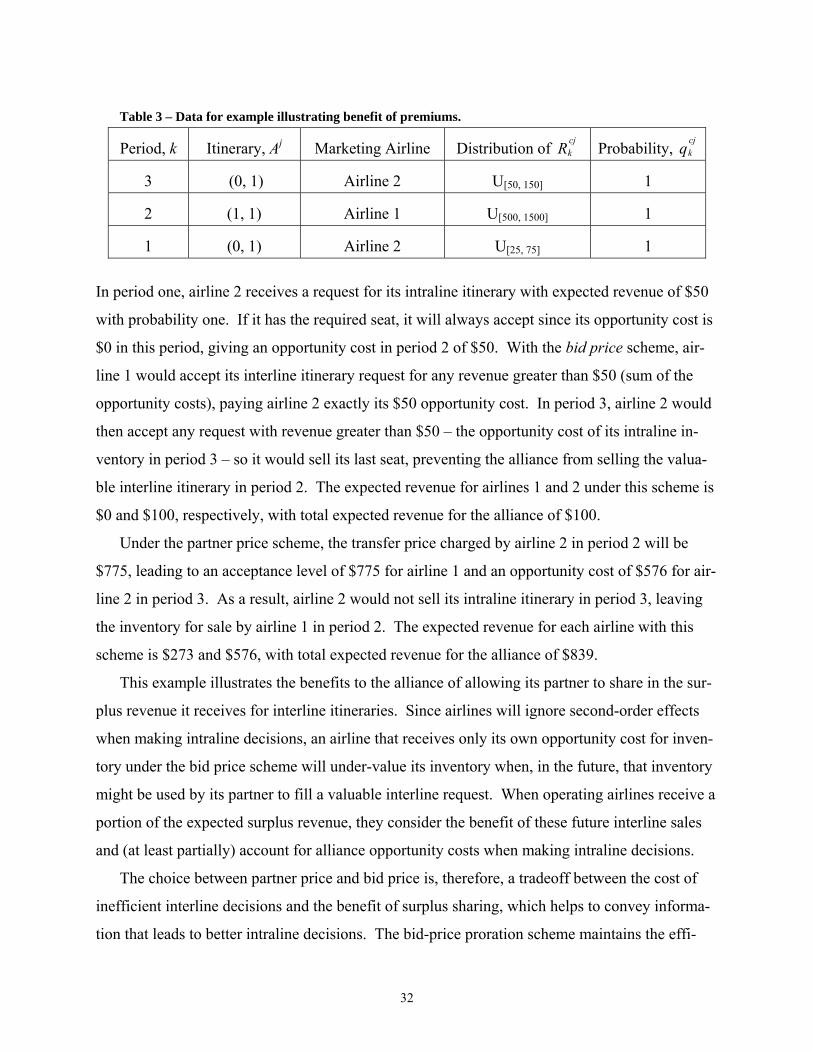
Table 3 – Data for example illustrating benefit of premiums.
Period, k Itinerary, Aj Marketing Airline Distribution of cjkR Probability, cj
kq
3 (0, 1) Airline 2 U[50, 150] 1
2 (1, 1) Airline 1 U[500, 1500] 1
1 (0, 1) Airline 2 U[25, 75] 1
In period one, airline 2 receives a request for its intraline itinerary with expected revenue of $50
with probability one. If it has the required seat, it will always accept since its opportunity cost is
$0 in this period, giving an opportunity cost in period 2 of $50. With the bid price scheme, air-
line 1 would accept its interline itinerary request for any revenue greater than $50 (sum of the
opportunity costs), paying airline 2 exactly its $50 opportunity cost. In period 3, airline 2 would
then accept any request with revenue greater than $50 – the opportunity cost of its intraline in-
ventory in period 3 – so it would sell its last seat, preventing the alliance from selling the valua-
ble interline itinerary in period 2. The expected revenue for airlines 1 and 2 under this scheme is
$0 and $100, respectively, with total expected revenue for the alliance of $100.
Under the partner price scheme, the transfer price charged by airline 2 in period 2 will be
$775, leading to an acceptance level of $775 for airline 1 and an opportunity cost of $576 for air-
line 2 in period 3. As a result, airline 2 would not sell its intraline itinerary in period 3, leaving
the inventory for sale by airline 1 in period 2. The expected revenue for each airline with this
scheme is $273 and $576, with total expected revenue for the alliance of $839.
This example illustrates the benefits to the alliance of allowing its partner to share in the sur-
plus revenue it receives for interline itineraries. Since airlines will ignore second-order effects
when making intraline decisions, an airline that receives only its own opportunity cost for inven-
tory under the bid price scheme will under-value its inventory when, in the future, that inventory
might be used by its partner to fill a valuable interline request. When operating airlines receive a
portion of the expected surplus revenue, they consider the benefit of these future interline sales
and (at least partially) account for alliance opportunity costs when making intraline decisions.
The choice between partner price and bid price is, therefore, a tradeoff between the cost of
inefficient interline decisions and the benefit of surplus sharing, which helps to convey informa-
tion that leads to better intraline decisions. The bid-price proration scheme maintains the effi-

33
cient interline decisions of bid price while providing some of the information sharing of partner
price. The relative costs and benefits of each scheme depend greatly on the parameters of the
alliance, as illustrated in §6.
5.6. Revenue Allocation
Here we discuss briefly the implications of each dynamic transfer price scheme on the alloca-
tion of revenue between alliance partners. The relative level of revenue received by the operat-
ing airline for an interline request will be higher under a partner price scheme than under a bid
price scheme. In the partner price scheme, the operating airline is given more decision rights – it
chooses the premium that benefits it the most. Therefore, it extracts a portion of the surplus rev-
enue that the marketing airline is able to retain completely under the bid price scheme. The bid-
price proration scheme also provides the operating airline with a portion of the surplus revenue.
Because the revenue is split according to the value of the inventory provided by each partner, it
might be argued that this is a ‘fair’ distribution. But bid-price proration sharing, like partner
price sharing, does not reward the marketing airline for generating interline requests
5.7. Computational Limitations
Given that the revenue management of a single airline network of realistic size requires the
adoption of approximation methods (see Talluri and van Ryzin, 2004), computation limitations
place tight restrictions on the size of the alliance problem that can analyzed using the full dynam-
ic program described above. For example, the size of the dynamic program’s state space for an
alliance comprised of two equally-sized airlines would be roughly the square of the size of the
separate single-airline problems. Therefore, an important step from theory to practice will be the
development of approximation methods for solving the alliance problem. The interaction of the
partners within the game framework may preclude the direct use of existing approximation me-
thods, or the application of existing methods may require significant transformations of the al-
liance problem described above.
6. Numerical Examples To illustrate several of the effects discussed above, we examine the impact of each revenue-
sharing scheme on a set of sample alliances. In §6.1 we examine the relative performance of the

34
three dynamic transfer-pricing schemes analyzed in §5 for two small alliances – one symmetric
and one asymmetric – under changing system parameters. Then, in §6.2, we compare the per-
formance of the best dynamic scheme, the partner price scheme (which can be interpreted as a
dynamic bid price scheme with untruthful partners) and the three static schemes. As discussed in
in §5.7, computational requirements limit the size of the problems that we could analyze. While
the small sizes of these examples do not allow us to make definitive statements about the per-
formance of these schemes in real-world networks, the examples do highlight the fundamental
points discussed above.
6.1. Relative Performance of Dynamic Schemes
In this section we examine two small alliances, in which each airline operates one flight – A
for airline 1 and B for airline 2 – with 10 seats each. The time horizon has 30 periods. Revenues
are normally distributed and increase stochastically as the time to departure approaches. See
Appendix 2 for detailed information on the parameters.
The first example that we examine is a balanced (symmetric) alliance. Each partner sees the
same demand distribution for its intraline itinerary (itinerary A or B) and an equal share of the
interline requests (AB). The revenue distributions associated with the intraline and the interline
requests are the same for both partners.

35
Figure 4 – Percent of first-best total revenue in sample symmetric alliance.
92%
94%
96%
98%
100%
0 0.2 0.4 0.6 0.8 1
Fraction of Requests for Local Itineraries
Rev
enue
(% o
f firs
t-bes
t)
Partner Price
Bid-Price Proration
Bid Price
Figure 4 shows the results for this symmetric alliance as the proportion of intraline requests
verses interline requests grows. The vertical axis represents the alliance revenue as a percent of
the first-best revenue. At the far left, customers only request interline itineraries, so the two
schemes that make efficient interline decisions – the bid-price proration scheme and the bid price
scheme – perform optimally. The inefficiencies of the partner price scheme, or alternatively the
effects of cheating under the bid price scheme, are also clear. Because each partner behaves in
its own self-interest, transfer prices are too high and alliance revenues suffer. As in the Prison-
er’s Dilemma, this produces lower revenues for each partner because total alliance revenue is
split 50/50 in this symmetric alliance.
On the far right, the alliance is receiving only intraline requests and therefore behaves as two
separate airlines making individually optimal decisions. Because no interline requests are re-
ceived, the choice of sharing scheme does not affect the total value and all schemes perform op-
timally. Finally, in the region between these two extremes, we see that the inefficiencies in both
intraline decision-making and the handling of interline requests reduce the performance of each
scheme.

36
To further illustrate the benefits of surplus sharing discussed in §5.5, we now consider an
asymmetric alliance in which only airline 1 receives requests for its intraline itinerary (A), while
both airlines may receive requests for the interline itinerary (AB). Figure 5 shows the effects on
alliance value as the fraction of interline requests received by airline 1 moves from zero to one.
Figure 6 shows the percentage of alliance revenue extracted by airline 1 for each scenario shown
in Figure 5.
At the far left of Figures 5 and 6 airline 1 receives all intraline requests while airline 2 rece-
ives all interline requests. We see in Figure 5 that the partner price scheme has the best perfor-
mance while bid-price proration outperforms the bid price scheme. On the left side of figure 6
we see that under the partner price scheme airline 1 receives a relatively large proportion of the
alliance value by choosing a high transfer price. Bid-price proration balances the contributions
of both airlines while the bid price scheme awards more of the value generated by the interline
itineraries to the marketing airline, airline 2.
The left sides of Figures 5 and 6 reinforce the insight of §5.5: allowing the operating airline
to set its own transfer price and capture more revenue can improve the performance of the al-
liance as a whole, for it facilitates the sharing of information about the value of inventory. The
example also shows that bid-price proration can facilitate such information-sharing, but to a less-
er degree. We should emphasize, however, that the left side of the figure represents an extreme
case in which all sales of the high-valued interline itineraries are made by a single airline, as
might be the case in an alliance between a large international airline and a smaller national air-
line. When the airlines are closer to being equal partners, as in Figure 4, the partner price
scheme reduces alliance revenue as well as the revenue of each partner.
Now, on the far right side of Figure 5, airline 2 does not bring any sales to the alliance, so
that under the (optimal) bid-price proration and bid price schemes airline 2’s opportunity cost is
always zero. Therefore, airline 1 pays nothing, per seat, to airline 2 and captures 100% of the
revenue (see Figure 6). The right-hand side of the plot suggests the benefits of the capacity pur-
chase agreements that are typically used for national/regional alliances, in which the national air-
line controls all revenue management activities, collects all revenue, and only pays a fixed price
(say, a fee per flight) to the intraline alliance partner for its participation (see Shumsky, 2006, for
more details on these agreements).
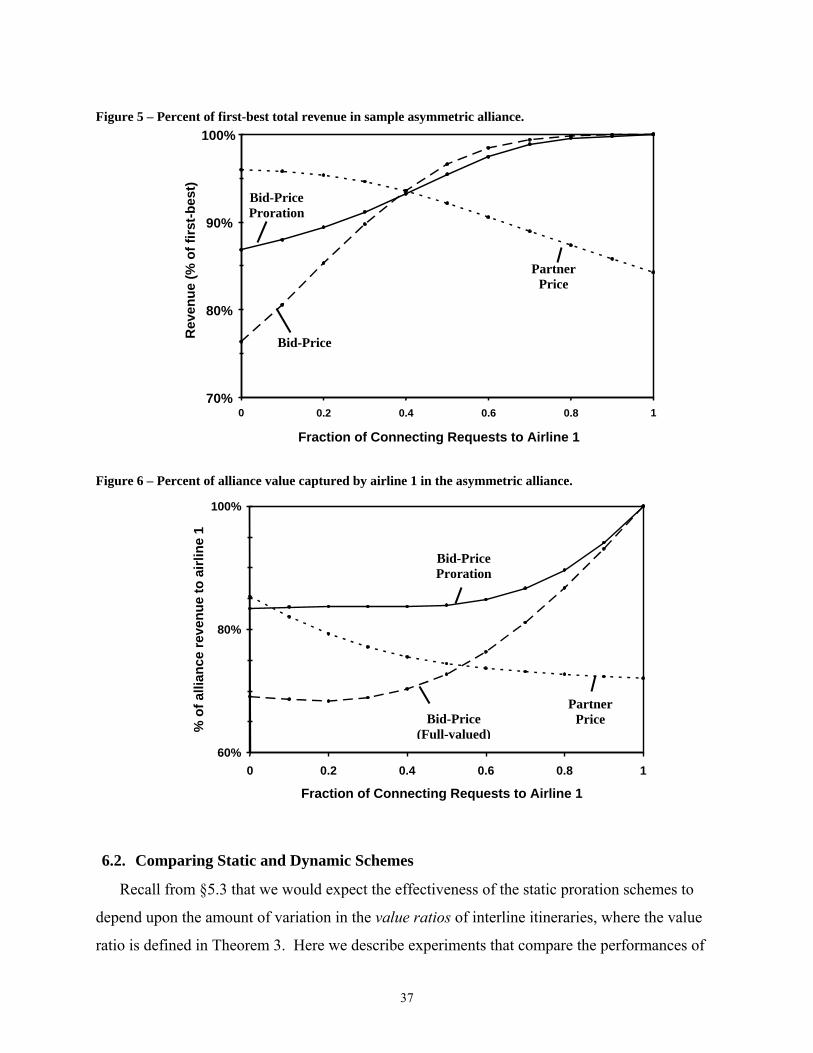
37
Figure 5 – Percent of first-best total revenue in sample asymmetric alliance.
Figure 6 – Percent of alliance value captured by airline 1 in the asymmetric alliance.
6.2. Comparing Static and Dynamic Schemes
Recall from §5.3 that we would expect the effectiveness of the static proration schemes to
depend upon the amount of variation in the value ratios of interline itineraries, where the value
ratio is defined in Theorem 3. Here we describe experiments that compare the performances of
60%
80%
100%
0 0.2 0.4 0.6 0.8 1
Fraction of Connecting Requests to Airline 1
Bid-Price Proration
Partner Price Bid-Price
(Full-valued)% o
f alli
ance
reve
nue
to a
irlin
e 1
Fraction of Connecting Requests to Airline 1
70%
80%
90%
100%
0 0.2 0.4 0.6 0.8 1
Rev
enue
(% o
f firs
t-bes
t)
Bid-Price
Bid-Price Proration
Partner Price

38
static and dynamic schemes in a series of networks with increasing heterogeneity in the value
ratios.
In the sample network for these experiments, airlines 1 and 2 both operate two flights: A and
B for airline 1, and C and D for airline 2. All flights have 4 seats remaining, and the time hori-
zon has 20 periods. Flights A and C travel into a connecting city, while B and D fly out. There-
fore, there are two connecting itineraries: AD and CB. For our baseline model, the arrival prob-
abilities and revenue distributions are chosen such that airline 1’s interline value ratios are ap-
proximately 0.58 for both itineraries. That is, airline 1’s opportunity cost represents 58% of the
total opportunity cost of the alliance for each of the interline itineraries. (To be more precise, the
value ratios depend upon the proration rate used. The value 0.58 and other value ratios described
below are generated under the Itinerary-Specific SP scheme, using optimal itinerary-specific pro-
ration rates. We provide more details on this scheme, below.)
We induce heterogeneity in the value ratios by increasing (stochastically) the revenues and
arrival probabilities of each airline’s intraline inbound itinerary, with corresponding decreases in
each airline’s intraline outbound itinerary. Specifically, the intraline itinerary revenue distribu-
tions and arrival probabilities are:
[ ] ( )[ ] ( )[ ] ( )[ ] ( )ββ
ββββββ
1.01.0501501.01.0501501.01.0502501.01.050250
22
22
11
11
−=−=+=+=−=−=+=+=
Dk
Dk
Ck
Ck
Bk
Bk
Ak
Ak
qREqREqREqRE
Figure 7 shows our results when the value ratio heterogeneity factor, β, is increased from 0 to
1, with all other parameters held constant. At the extreme right, with β =1, airline 1’s value ra-
tios have diverged from 0.58 up to 0.92 for AD and down to 0.25 for CB.
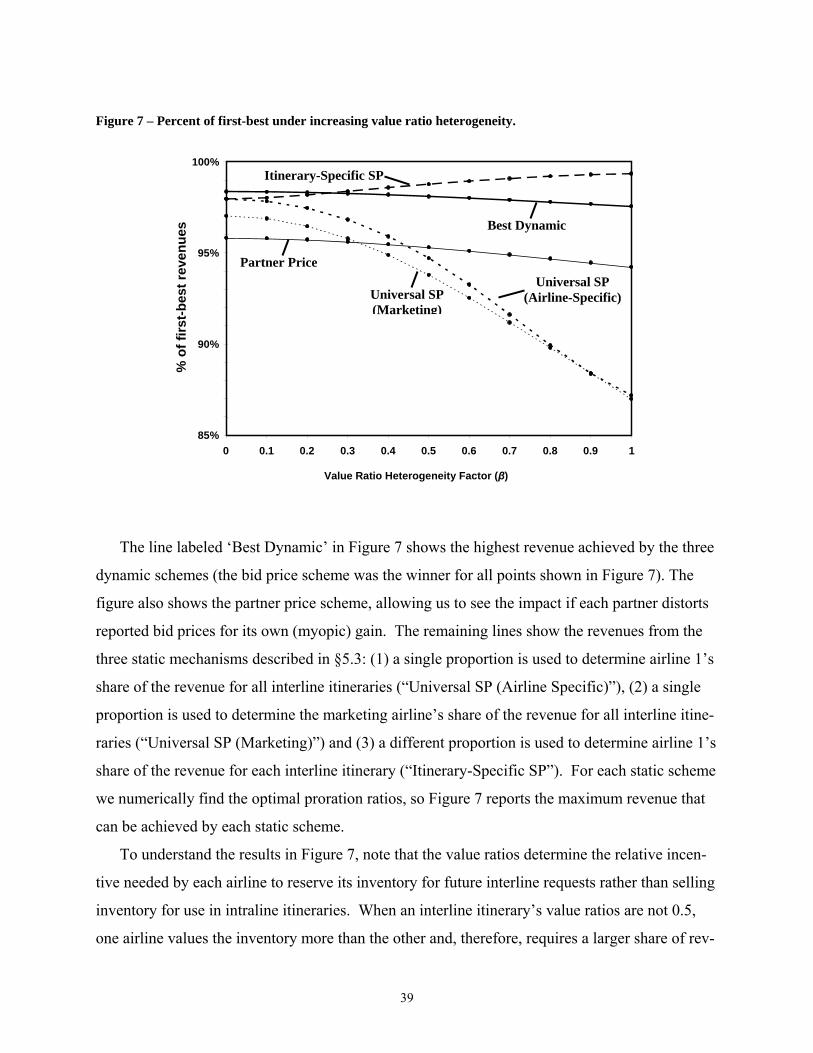
39
Figure 7 – Percent of first-best under increasing value ratio heterogeneity.
The line labeled ‘Best Dynamic’ in Figure 7 shows the highest revenue achieved by the three
dynamic schemes (the bid price scheme was the winner for all points shown in Figure 7). The
figure also shows the partner price scheme, allowing us to see the impact if each partner distorts
reported bid prices for its own (myopic) gain. The remaining lines show the revenues from the
three static mechanisms described in §5.3: (1) a single proportion is used to determine airline 1’s
share of the revenue for all interline itineraries (“Universal SP (Airline Specific)”), (2) a single
proportion is used to determine the marketing airline’s share of the revenue for all interline itine-
raries (“Universal SP (Marketing)”) and (3) a different proportion is used to determine airline 1’s
share of the revenue for each interline itinerary (“Itinerary-Specific SP”). For each static scheme
we numerically find the optimal proration ratios, so Figure 7 reports the maximum revenue that
can be achieved by each static scheme.
To understand the results in Figure 7, note that the value ratios determine the relative incen-
tive needed by each airline to reserve its inventory for future interline requests rather than selling
inventory for use in intraline itineraries. When an interline itinerary’s value ratios are not 0.5,
one airline values the inventory more than the other and, therefore, requires a larger share of rev-
85%
90%
95%
100%
0 0.1 0.2 0.3 0.4 0.5 0.6 0.7 0.8 0.9 1
Value Ratio Heterogeneity Factor (β)
% o
f firs
t-bes
t rev
enue
s
Universal SP (Marketing)
Universal SP (Airline-Specific)
Partner Price
Best Dynamic
Itinerary-Specific SP

40
enues as incentive to make the right decision for the alliance as a whole. If the value ratios
across the alliance are homogeneous (i.e., a given airline’s opportunity cost represents the same
proportion of the alliance opportunity cost for all itineraries), then a single (‘universal’) proration
rate can be used effectively. Specifically, on the left side of Figure 7, a 58% share for airline 1
for both itineraries is optimal, although the performances of these optimal universal static
schemes are slightly inferior to the performance of the best dynamic scheme. As the value ratios
become heterogeneous, a universal proration rate cannot provide the proper incentives to maxim-
ize alliance revenues. On the right side of Figure 7, the performances of the universal static pro-
ration schemes fall substantially below the best dynamic scheme (bid price) and even well below
the partner price scheme because the value ratios have diverged.
This observation applies to both universal static schemes. In Figure 7 the performance of the
Universal SP (Marketing) scheme also demonstrates that while such a scheme could be used to
provide an incentive to each airline to generate demand – an aspect of the problem not captured
with our model - it fails to provide the proper incentives with regards to revenue management
decisions.
Figure 8 – Optimal proration rates for Itinerary-Specific SP under increasing value ratio heterogeneity.
0%
10%
20%
30%
40%
50%
60%
70%
80%
90%
100%
Itinerary AD (α1AD)
Itinerary CB (α1CB)
Airl
ine
1’s
shar
e of
reve
nue
0 0.1 0.2 0.3 0.4 0.5 0.6 0.7 0.8 0.9 1
Value Ratio Heterogeneity Factor (β)

41
As one would expect, the performance of the static scheme can be improved by choosing
proration rates that are specific to each itinerary, given their value ratios. Figure 8 shows the op-
timal itinerary-specific proration rates. In this example, using itinerary-specific rates allows stat-
ic proration to perform significantly better under heterogeneous value ratios, even out-
performing the best dynamic scheme here. However, as discussed in §5.7, implementation of
optimal itinerary-specific static schemes is difficult in large networks.
It should also be noted that the case used in Figure 7 does not include many elements found
in practice that would be likely to hurt the performance of static schemes. To keep the number
of parameters reasonable, in this example we used stationary revenue distributions, while in
practice itinerary prices would be expected to change over the horizon. In a large number of ad-
ditional experiments we have found that the bid price and bid-price proration schemes perform
consistently better than static schemes, and we now focus on the relative robustness of dynamic
schemes.
Specifically, the performance of a static proration scheme declines as the characteristics of
the alliance change, while proration rates are held constant. Figure 9 illustrates this point. To
generate the figure, we first find the optimal proration rates, given β = 0.50, for both Universal
SP (Airline –Specific) and Itinerary-Specific SP. Then, we evaluate the performance of the static
schemes using these proration rates in networks with other value of β. This scenario could
represent a change in the system from an initial state (β = 0.50) that had been the baseline envi-
ronment for an alliance agreement.

42
Figure 9 – Percent of first-best when using static schemes that are optimal in a network with β=0.5
Because the best dynamic scheme automatically adjusts for these changes, its performance
does not change substantially as β changes, ranging from 97.5% to 98.5% of first best. Universal
SP (Airline-Specific) falls far below the best dynamic scheme, dipping below 85% of first best
for β=1. We also see that the itinerary-specific static proration scheme that is optimal when
β=0.5 performs poorly when value ratio heterogeneity is low, β=0.
Another method to test the robustness of a static scheme is to use the wrong proration rate for
a given network. In reality, there are many reasons why alliance members may choose an incor-
rect rate. For example, under commonly-used mileage proration agreements, proration rates are
based on the relative mileage of flight legs in an interline itinerary, an attribute that may not cor-
respond with the actual relative value of inventory (see Boyd, 1998a). In Figure 10, each curve
shows the percent of first-best revenue achieved in a network with β = 0.50, under Itinerary-
Specific SP, holding the proration rate for AD constant, and varying the rate for interline itine-
rary CB. The solid line shows results for the optimal AD proration rate of 77% (from the plot we
can see that the optimal pair of rates is CB=39% and AD=77%).
85%
95%
100%
Universal SP (Airline-Specific)
Itinerary-Specific SP %
of f
irst-b
est r
even
ues Best Dynamic
Partner Price
0 0.1 0.2 0.3 0.4 0.5 0.6 0.7 0.8 0.9 1
Value Ratio Heterogeneity Factor (β)
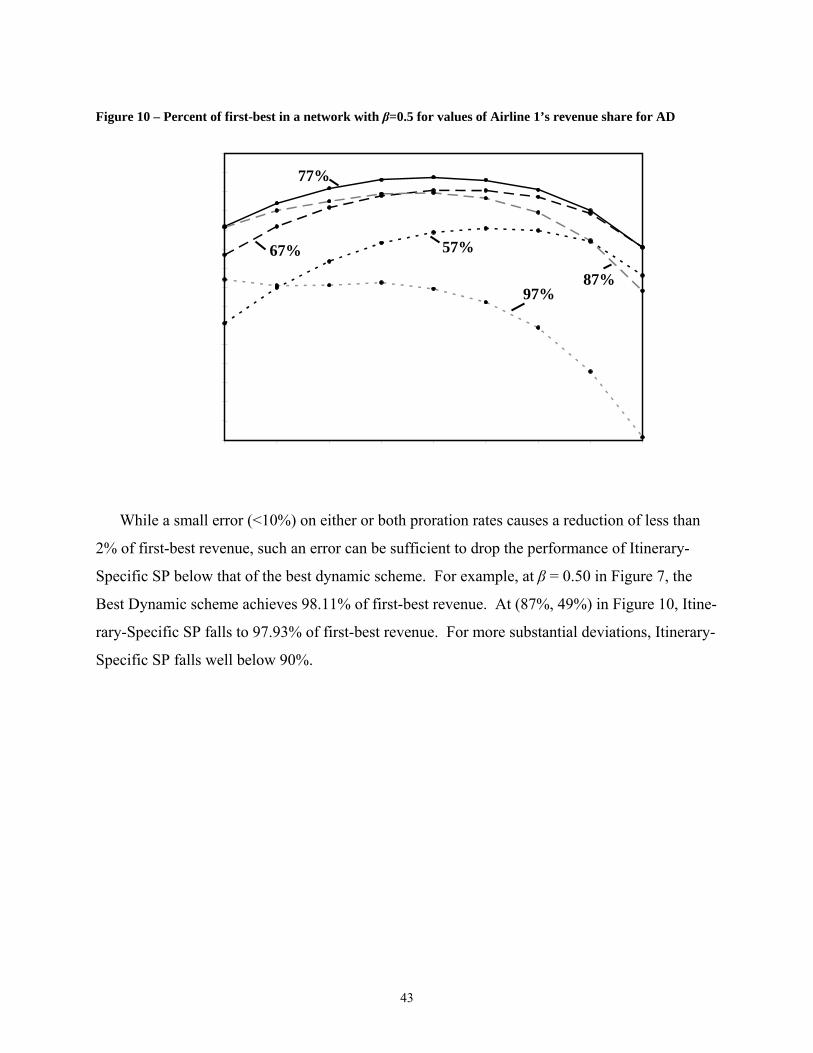
43
Figure 10 – Percent of first-best in a network with β=0.5 for values of Airline 1’s revenue share for AD
While a small error (<10%) on either or both proration rates causes a reduction of less than
2% of first-best revenue, such an error can be sufficient to drop the performance of Itinerary-
Specific SP below that of the best dynamic scheme. For example, at β = 0.50 in Figure 7, the
Best Dynamic scheme achieves 98.11% of first-best revenue. At (87%, 49%) in Figure 10, Itine-
rary-Specific SP falls to 97.93% of first-best revenue. For more substantial deviations, Itinerary-
Specific SP falls well below 90%.
97%
57% 67%
87%
77%

44
Figure 11 – Percent of first-best with increasing alliance size.
Finally, we examined whether these results are artifacts caused by the small inventory levels
on each flight. Figure 11 suggests that this is not the case. For these experiments we use a net-
work with β = 1. Inventory levels and the number of periods in the horizon are scaled from
(2,10) up to (16,80), and Figure 11 shows the percentage of first-best alliance revenues for the
Universal SP (Airline-Specific), Itinerary-Specific SP and Best Dynamic schemes. The relative
performances of the three schemes do not change significantly over this scale range, suggesting
that similar results may hold for larger, more realistic inventory levels and horizon lengths.
7. Summary and Further Research Airline alliances are selling increasing numbers of interline itineraries, creating the need to
understand the impact of revenue-sharing mechanisms on alliance network performance. While
a few papers in the literature have addressed the broad challenges faced by airline alliances, this
paper is the first to rigorously analyze the revenue-management behavior of alliance partners un-
der various proration mechanisms. We began by defining a multi-period, two-airline Markov
game model of an alliance. Analysis of the model generated fundamental insights about the al-
liance revenue management problem. We find that no Markovian transfer-price scheme can
80%
85%
90%
95%
100%
2 4 6 8 10 12 14 16
Inventory per Flight
Best Dynamic
Best Universal
Static
Itinerary-Specific SP %
of f
irst b
est r
even
ues

45
guarantee optimal (first-best) revenues because the sharing of interline revenue cannot directly
affect acceptance decisions for intraline itineraries. We then show that the performance of static
proration schemes depends upon the homogeneity and stability of the relative values that each
airline places on the inventory used in interline itineraries. Dynamic schemes adapt to changes
in these ‘value ratios,’ but there is no one best dynamic scheme. Dynamic schemes based on bid
prices generate (centrally) optimal acceptance decisions for interline itineraries, but can fail to
provide the operating airline with sufficient incentives to align intraline decisions. This align-
ment problem can be ameliorated by allowing the operating airline to set its own transfer prices
(or, if the operating airline ‘games’ a bid-price system), but the resulting inflation of transfer
prices can distort interline acceptance decisions.
We corroborated each of these insights using numerical experiments in small example net-
works. The experiments also served to reinforce observations about the advantages and chal-
lenges of implementing the static proration schemes that are currently used in the industry. In
one example, we see that a static scheme with optimal itinerary-specific proration rates can
slightly outperform the dynamic schemes considered here. Computing these optimal static pro-
ration rates and keeping them current, however, can be an enormous challenge for alliance part-
ners, and our experiments show that the relative performance of the static schemes can decline
significantly when the network parameters no longer match the proration rates.
These observations about computational complexity and practical considerations suggest two
areas on which future research should focus: approximation methods and information asymme-
try. As noted in §5.7, there has been significant work on approximating the single-airline net-
work revenue management problem because of the problem’s size. In the single-airline problem,
methods such as virtual nesting and additive bid prices are used to approximate the opportunity
costs of an itinerary’s inventory. It would be natural to examine the impact of using similar ap-
proximation methods in an alliance.
In addition, in our model we have assumed that the airline partners share demand and reve-
nue forecasts as well as information about current inventory levels. As such, we assume that
each can precisely calculate its partner’s value function, which is unlikely even for the smallest
alliances. Future research should focus on the effects of relaxing this ‘complete information’
assumption.

46
Another extension to our research would be to incorporate more advanced arrival and reve-
nue processes and feedback into our model. As discussed in §3.2, dependency within the arrival
stream could be added to the model, perhaps by reformulating the arrival process using a cus-
tomer choice model. In addition, a closed-loop model could be created to update forecasts as
demand is realized.
Finally, in our model the airlines use a free sale scheme to exchange inventory; inventory is
only exchanged when it is needed to fulfill a specific interline request. An alternate scheme is
dynamic trading - called soft blocking by Boyd 1998a – in which partners are allowed to "trade"
(buy and sell) seats on each other's flights throughout the horizon, shifting inventory to the part-
ner that can use it to create the most value for the alliance. The potential benefits of dynamic
trading are obvious, as demonstrated by Boyd 1998b, which describes conditions in which a stat-
ic LP version of the problem can achieve the first-best revenue. Such a scheme, however, has
many technical barriers to implementation. In addition, in a preliminary analysis we have found
that in a dynamic environment there are many conceptual and computational barriers that make
airline behavior under dynamic trading difficult to predict. Describing the performance of dy-
namic trading will also be an interesting area of further research.

47
Appendix 1 Proof of Markov Perfect Equilibrium and corresponding policies for decentra-
lized alliance control schemes.
THEOREM 1 Given transfer prices )(xp cjk− , each carrier’s Bellman equation is given by (3). The
optimal control for the marketing airline is defined by
( ) ( ) ( ){ }uAxJuxprxru jck
cjk
u
cjk −+−= −
−
∈1
}1,0{)(maxarg, .
With the finite expectation assumption on the revenue distributions, this control can be rewritten
( ) ( ) ( )( ){ }uAxJxprxJxru jck
cjk
ck
u
cjk ,)(maxarg, 11
}1,0{−
−−
∈Δ−−+= ,
which is maximized by the function
( ) ( )⎩⎨⎧ +Δ≥
=−
−
otherwisexpAxJr
xrucj
kjc
kcjk 0
)( ,1; 1 , (8)
the acceptance policy described in Theorem 1.
Because only one revenue request can arrive within each period, both ( )jck AxJ ,1−Δ and )(xp cj
k−
are independent of ( )xu ck− , airline -c’s acceptance decisions (as a marketing airline) in period k.
Therefore, the best response acceptance decisions for airline c, ( )xu ck , are constant with respect
to the partner’s decisions as a marketing airline. That is,
( ) ( )xruuxru cjk
ck
cjk ;,; =− .
Because the distribution of cjkR is continuous, (8) defines a unique best response by each airline;
there are no ‘ties’ where ( ) )( ,1 xpAxJr cjk
jck
−− +Δ= .
If the transfer prices are sufficiently large in all cases so that the operating airline will always
choose to accept a sale, then the marketing airline’s policies ( )xrucjk ; define a unique equili-
brium. If the operating airline -c may reject a sale, then let ( )xru cjk ;ˆ − be the operating airline’s
acceptance policy. An argument identical to the one above shows that the optimal policy for the
operating airline is,

48
( ) ( )⎩⎨⎧ Δ≥
=−−
−−
.0 ,)(1
;ˆ 1
otherwiseAxJxp
xrujc
kcj
kcjk
Again, for each state of the system, this policy is unique and is independent of the partner’s ac-
tion. Therefore, the pairs of best responses ( ) ( )[ ]xruxru cjk
cjk ;ˆ,; − define a unique equilibrium.
This unique equilibrium exists for each subgame defined by each time period and inventory
state, and therefore these best responses define a unique, pure strategy Markov perfect equili-
brium. ■
Although throughout the paper we assume that the distribution of cjkR is continuous, if we allow
a probability mass to exist in the revenue distribution, then one could imagine a mixed-strategy
equilibrium. Suppose that the realized revenue ( ) )( ,1 xpAxJr cjk
jck
−− +Δ= has a nonzero proba-
bility, and consider the following optimal mixed strategy: requests are accepted by the marketing
airline with some probability γ and rejected with probability 1 – γ when that particular revenue is
realized. The value to airline c, however, would be unaffected by any choice of γ since the ex-
pected value is the same in both cases. The independence of the accept/reject decisions would,
again, ensure that the partners’ decisions would be unaffected as well. As such, there would be
no obvious benefit to such a policy and the added complexity is likely to be prohibitive. There-
fore, even if the distribution of cjkR is not continuous, one would expect that the airlines would
play pure strategies.
THEOREM 2 (Static Proration) For this scheme, for a given share proportion, αr for airline c,
the conditional Bellman equations take the form:
( )
( ) ( ) ( )( )[ ]( ) ( ) ( )( )[ ]
( ) ( ) ( )( )[ ]( )( )[ ] ( )
( ) 0≥∀=
⎟⎟⎟⎟⎟⎟⎟⎟⎟
⎠
⎞
⎜⎜⎜⎜⎜⎜⎜⎜⎜
⎝
⎛
+−
+−+
+−+
+−+
=
−∈
−−−
−
∈
−−−−
−−−−−−
∈−
∈−
∑
∑
∑
∑
−
xxJ
xJqxRuAxJEq
xRuAxJxRuxREq
xRuAxJxRuxREq
xRuAxJxRuxREq
xJ
c
ckk
Nj
cjk
cjk
jck
cjk
Nj
cjk
cjcjk
jck
cjk
cjcjk
cjk
cjcjk
Nj
cjk
cjcjk
jck
cjk
cjcjk
cjk
cjcjk
Nj
cjk
cjk
jck
cjk
cjk
cjk
cjk
ck
c
s
s
c
0
,
,
,,
,,
,,
0
10
1
1
1
1
ααα
ααα
where { }1{0,1}
( , ) arg max ( )cj c jk k
uu r x ru J x A u−
∈= + − . Therefore when Sj N∈ , ( ) 1, =xRu cj
kcjcj
k α if and
only if ( )jck
cjk
cj AxJR ,1−Δ≥α . Since there is at most one arrival in a period, each policy ),( xru cjk

49
is independent of the decisions for other interline itineraries in the same period. Therefore the
threshold strategy described above yields a Nash equilibrium, and the acceptance rules form a
Markov perfect equilibrium. ■
THEOREM 3 (Modified Static Proration) Under this scheme, both airlines may veto an interline
acceptance decision. If both partners accept an interline itinerary, the marketing airline -c rece-
ives its share of the revenue, ( ) cjk
cj R −− α1 , while the operating airline receives cjk
cj R −α . By
Theorem 2, the operating airline will accept the request if and only if ( )jck
cjk
cj AxJR ,1−− Δ≥α and
the marketing airline will accept the request if and only if ( )jck
cjk
cj AxJR ,)1( 1−−
− Δ≥−α . There-
fore, the combined acceptance rule is,
( ) ( ) ( ){ }.1,,,max 11cjjc
kcjjc
kcj
k AxJAxJR αα −ΔΔ≥ −−−
−
■
COROLLARY 3 (Static Proration): Proof by induction. First, let ( )xHk denote the first-best
revenues for the alliance in period k with remaining inventory x . In period 0, any alliance has a
value of 0. For an arbitrary period k – 1, k ≥ 1, make the following assumption:
( ) ( ) { }2,111 ∈= −− cxHxJ kcc
k α .
It follows then that:
( ) ( ) { }2,111 ∈Δ=Δ −− cxHxJ kcc
k α .
Any interline itinerary will be accepted if:
( ) ( ) ( ){ }( ) ( ) ( ) ( ){ }
( )jk
cjk
ccjk
c
cjck
cjck
ck
AxH
AxHAxH
AxJAxJR
,
1,1,,max
1,,,max
1
11
11
−
−−
−−−
Δ=
−Δ−Δ=
−ΔΔ≥
αααα
αα
.
Thus, the alliance makes the same acceptance decision as the centralized controller. Additional-
ly, since the share of revenues received by airline c is αc, our inductive assumption holds with:
( ) ( ) { }2,1∈= cxHxJ kcc
k α ■
50
THEOREM 5 (Bid-Price Proration): Assume that airline c has received a request for interline
itinerary j in period k with a fare of r. Under bid-price proration, the transfer price that carrier c
must pay if it decides to accept the itinerary request is then:
( )( )r
AxJAxJ
p jk
jckcj
k ,,
1
1
−
−−−
ΔΔ
= .
Provided that this transfer price is used, airline c’s optimal acceptance policy is as given in Theo-
rem 1 and the airlines’ acceptance policies constitute a Markov perfect equilibrium. Note that
with this transfer price we have
( ) ( ) ( )jck
cjk
jk
cjk
jck AxJpAxJrpAxJr ,,, 111
−−
−−
−− Δ≥⇔Δ≥⇔+Δ≥ ,
in other words, the marketing carrier accepts the itinerary if and only if it is beneficial for the al-
liance as a whole, and this is if and only if the operating carrier receives at least its opportunity
cost in compensation. This proves theorem 5, and also shows that the marketing and operating
carriers’ interests are aligned when it comes to making interline acceptance decisions. ■
THEOREM 6 (Partner Price): Recall that we assume that the operating carrier knows only the
distribution of the revenue associated with the request received by the marketing carrier, not the
actual revenue offered by the prospective passenger. The operating carrier also knows both its
own and the marketing carrier’s opportunity cost for the itinerary. In this scheme, the operating
carrier chooses the transfer prices for an interline itinerary request received by the marketing car-
rier.
For the remainder of the proof, since the operating airline is making the decision of inter-
est we will refer to it as c and the marketing airline as –c. Thus, the relevant transfer prices es-
tablished by the operating airline are )(xpcjk . Given these transfer prices, the marketing carrier’s
Bellman equation is given by (3) and the optimal control is described in Theorem 1. Now we
consider the equilibrium transfer price chosen by the operating carrier. Assume that marketing
airline -c received a request for interline itinerary Sj N∈ and the operating carrier c has chosen a
transfer price of p. Then the conditional (on such a request having been received) expected total
current and future revenues for airline c are given by

51
( ) ( )( ) ( ) ( )
( ) ( )( ) ( )( )jck
cjk
jck
cjk
cjk
cjk
jck
cjk
AxJpFAxJpxJ
rdFxpruAxJpxJ
,~,
,,
111
0 11
−−
−−−
∞ −−−−
Δ+Δ−+=
−Δ−+ ∫
Taking the derivative with respect to p gives
( )( ) ( )( ) ( )( )
( )( ) ( )( ) ( )( )[ ]jck
cjk
jck
jck
cjk
jck
cjk
jck
jck
cjk
AxJphAxJpAxJpF
AxJpfAxJpAxJpF
,,1,~,,,~
111
111
−−
−−
−−
−
−−
−−
−−
−
Δ+Δ−−Δ+=
Δ+Δ−−Δ+
where ( ) ( ) ( )rFrfrh cjk
cjk
cjk
−−− = . Hence the optimal transfer price cjkp satisfies
( ) ( )( )cjk
jck
cjk
jck
cjk pAxJhAxJp +Δ+Δ= −
−−
− ,1, 11
Note that the condition of Theorem 3 is equivalent to
( )( ) ( )( )jc
kcjk
jck
cjkcj
kjc
kcj
k AxJpAxJp
pAxJg,,
,1
11
−
−−−
−−
Δ−Δ+
=+Δ ,
where ( ) ( )rrhrg cjk
cjk
−− = is the generalized hazard rate function of the itinerary’s revenue distri-
bution ( )rF cjk− . The RHS of this last equation decreases from +∞ when ( )jc
kcjk AxJp ,1−Δ= to 1
when ∞→cjkp . Now assume that the distribution of cj
kR − has Increasing Generalized Failure
Rate (IGFR), i.e., ( )rg cjk− is non-decreasing. Given that ( )rg cj
k− has a finite expectation, it fol-
lows from Theorem 2 of Lariviere (2006) that ( ) 1lim >−∞→ rg cj
kr , and hence the operating air-
line’s optimal transfer price is unique.
Finally, because there is at most one arrival per period, the optimal pricing and accep-
tance policies for a particular interline itinerary j are independent of other policies for other itine-
raries in the same period. Therefore the results in this section of the appendix imply that under
the IGFR assumption, the transfer price policies in Theorem 3 and acceptance policies in Theo-
rem 1 form a Markov perfect equilibrium. ■

52
Appendix 2 – Table of Parameters for Sample Alliances.
Parameter Symmetric Alliance Asymmetric Alliance
Number of periods 30 30
Number of seats on leg oper-ated by airline 1
10 10
Number of seats on leg operated by airline 2
10 10
Probability of an arrival in each period 1 1
Itinerary A AB B A AB
Fraction of requests For the Symmetric Alliance, “intraline” is the fraction of requests for A or B, and we vary “intraline” from 0 to 1.
0.5*intraline 1-intraline 0.5*intraline 0.5 0.5
Share of requests to airline 1 100% 50% 0% 100% varies
Mean revenue per request (last period)
200 500 200 200 400
Growth in mean revenue over all periods
20% 20% 20% 20% 20%
Std dev of revenue per request
20 50 20 20 40
Acknowledgements The authors would like to thank Andy Boyd, Ben Vinod, Serguei Netessine, two anonymous re-
viewers and an associate editor for their valuable input. We appreciate comments from partici-
pants in the Tuck School faculty seminar series. Finally, we thank numerous analysts and reve-
nue managers at Air France-KLM, Lufthansa, and United for providing us with information
about the current and future practice of revenue management in alliances.

53
References
Anupindi, R., Y. Bassok and E. Zemel. 2001. “A general framework for the study of decentra-lized distribution systems. M&SOM, 3(4). 373-381.
Agarwal, R. and O. Ergun. 2007. “Network Design and Allocation Mechanisms for Carrier Al-liances in Liner Shipping”. Working Paper. Georgia Institute of Technology.
Baron, R. II. 1997. Code Share Agreements: A Developing Trend in US Bilateral Aviation Ne-gotiations. Indiana Law Journal. 72 529-543.
Belden, T. 2007. “Southwest Airlines wants to add international service,” The Philadelphia En-quirer, May 11, 2007, City-D Edition, pg. D03.
Bellman, R. 1957. Dynamic Programming. Princeton University Press.
Belobaba, P. 1989. Application of Probabilistic Decision Model to Airline Seat Inventory Con-trol. Operations Research. 37 (2) 182-197.
Boyd, E. A. 1998a. Airline Alliances. OR/MS Today. October 28-31.
Boyd, A. E. 1998b. Airline Alliance Revenue Management. PROS Strategic Solutions Technical Report, PROS Revenue Management, 3100 Main Street, Suite #900, Houston, TX 77002.
Brandenburger, A. M. and H. Stuart, 2000, Biform Games, Harvard NOM Research Paper No. 00-06. Available at SSRN: http://ssrn.com/abstract=264199.
Brueckner, J. 2001. The Economics of International Codesharing: An Analysis of Airline Al-liances. International Journal of Industrial Organization. 19 (10) 1475-1498.
Brueckner, J. and Whalen, W. T. 2000. The Price Effects of International Airline Alliances. Journal of Law & Economics. 43 503-545.
Bureau of Transportation Statistics, U.S. Government (BTS). 2006. Airline Origin and Destina-tion Survey (DB1B). Available at http://www.transtats.bts.gov/DataIndex.asp.
Cachon, G.P. and Zipkin, P.H. 1999. Competitive and Cooperative Inventory Policies in a Two-Stage Supply Chain. Management Science, Vol. 45, No. 7, pp. 936-953.
Cachon, G.P. and S. Netessine. 2004. Game theory in Supply Chain Analysis. in Handbook of Quantitative Supply Chain Analysis: Modeling in the eBusiness Era. edited by D. Simchi-Levi, S. D. Wu and Z.-S. Shen. Kluwer, New York.
Chod, J., and N. Rudi. 2006. Strategic Investments, Trading and Pricing under Forecast Updat-ing. Forthcoming in Management Science.
Fernandez de la Torre, P. E. 1999. Airline alliances: The airline perspective. Masters thesis, Massachusetts Institute of Technology, Cambridge, MA.
Glover, F., Glover, R., Lorenzo, J. and McMillan, C. 1982. The Passenger Mix Problem in the Scheduled Airlines. Interfaces. 12 (3) 73-79.
Granot, D. and S. Yin. 2004. Competition and Cooperation in Decentralized Push and Pull As-sembly Systems. Management Science, Vol. 54, No. 4, pp. 733-747.

54
Heyman, D. P. and M. J. Sobel. 2004. Stochastic Models in Operations Research, Vol. II: Sto-chastic Optimization. Dover Publications, Mineola, NY.
Houghtalen, L., O. Ergun, J. Sokol. 2007. Designing mechanisms for the management of carrier alliances. Working paper, Georgia Institute of Technology.
International Air Transport Association (IATA), 2007. “Declared Interline Prorate Values,” working paper, available at, http://www.iata.org/nr/rdonlyres/f51dc9a0-4f23-4ae1-b586-617ec8ca6ded/0/dipv_final_conceptv1_0.pdf
Ito, H., and D. Lee. 2005. Domestic Codesharing, Alliances and Airfares in the U.S. Airline In-dustry. Forthcoming in The Journal of Law and Economics.
Kasilingam, R. 1996. “Air cargo revenue managment: Characteristics and complexities.” Euro-pean Journal of Operational Research, 96, 36-44.
Lariviere, M.A. 2006. A Note on Probability Distributions with Increasing Generalized Failure Rates. Operations Research, 54 (3), 602-604.
Lariviere, M.A. and E. L. Porteus. 2001. Selling to the Newsvendor: An Analysis of Price-Only Contracts. Manufacturing and Service Operations Management, 3 (4), 293-305.
Lederer, P. 1993. A Competitive Network Design Problem with Pricing. Transportation Science. 27 (1) 25-38.
Lee, T. and Hersh, M. 1993. A Model for Dynamic Airline Seat Inventory Control with Multiple Seat Bookings. Transportation Science. 27 (3) 252-265.
Lin, M. 2004. Strategic Airline Alliances and Endogenous Stackelberg Equilibria. Transporta-tion Research Part E. 40 (5) 357-384.
Littlewood, K. 1972. Forecasting and Control of Passenger Bookings. AGIFORS Symposium Proceedings. 12 96-117.
Lott, S. 2006. “Alliances expected to grow even larger,” Aviation Week and Space Technology, May 8, Vol. 164, No. 19, pg. 44.
McGill, J. and van Ryzin, G. 1999. Revenue Management: Research Overview and Prospects. Transportation Science. 33 (2) 233-256.
Mundhenk, M., Goldsmith, J., Lusena, C. and Allender, E. 2000. Complexity of Finite-Horizon Markov Decision Process Problems. Journal of ACM. 47 (4) 681-720.
Nagarajan, M. and Y. Bassok. 2008. A Bargaining Framework in Supply Chains: The Assembly Problem. Management Science, Vol. 54, No. 8, pp. 1482-1496.
Nagarajan, M. and G. Sošić. 2008. Game-Theoretic Analysis of Cooperation Among Supply Chain Agents: Review and Extensions. European Journal of Operations Management. 187 (3) 719-745.
Netessine, S. and Shumsky, R. 2004. Revenue Management Games: Horizontal and Vertical Competition. Management Science. 51 (5) 813-831.
Park, J. 1997. The Effect of Airline Alliances on Markets and Economic Welfare. Transportation Research Part E. 33 (3) 181-195.

55
Puterman, M. 2005. Markov Decision Process: Discrete Stochastic Dynamic Programming. John Wiley and Sons.
Sheopuri, A. and E. Zemel. 2006. The Greed and Regret (GR) Problem. Working Paper, Stern School of Business, New York University, New York.
Shumsky, R. A. 2006. The Southwest Effect, Airline Alliances, and Revenue Management. Journal of Revenue and Pricing Management, Vol. 5, No. 1.
Simpson, R. 1989. Using Network Flow Techniques to Find Shadow Prices for Markets and Seat Inventory Control. MIT Transportation Laboratory Memorandum M89-1.
Spengler, J. 1950. Vertical integration and antitrust policy. J. Political Economy 58(4) 347–352.
Talluri, K. and van Ryzin, G. 1998. An Analysis of Bid-Price Controls for Network Revenue Management. Management Science. 44 (11) 1577-1593.
Talluri, K. and van Ryzin, G. 1999. A Randomized Linear Programming Method for Computing Network Bid Prices. Transportation Science. 33 (2) 207-216.
Talluri, K. and van Ryzin, G. 2004. Revenue Management Under a General Discrete Choice Model of Consumer Behavior. Management Science. 50 (1) 15-33.
Talluri, K. and van Ryzin, G. 2004 The Theory and Practice of Revenue Management. Kluwer Academic Publishers.
Vinod, B. 2005. Alliance Revenue Management. Journal of Revenue and Pricing Management (Practice Papers), 4(1) 66-82.
Vulcano, G., van Ryzin, G. and Maglaras, C. 2002. Optimal Dynamic Auctions for Revenue Management. Management Science. 48 (11) 1388-1407.
White, D. 2003. Markov Decision Processes. John Wiley and Sons.
Wynne, R. 1995. From Queen Airs to RJs: Evolution in Major-Regional Airline Alliances and Code Sharing. Handbook of Ailrine Economics. Aviation Week Group, McGraw-Hill, New York.
You, P.S. 1999. Dynamic Pricing in Airline Seat Management for Flights with Multiple Legs. Transportation Science. 33 (2) 192-206.