dynamic pressure calibration - white sands missile … workshops...dynamic pressure calibration...
TRANSCRIPT

1
June22, 2004 Transducer Workshop 2004, All rights reserved.
1
Dynamic Pressure Calibration
Based on ISA-37.16.01-2002“A Guide for the Dynamic Calibration of
Pressure Transducers”
June22, 2004 Transducer Workshop 2004, All rights reserved.
2
Introduction to the Tutorial
• Tutorial based on ISA S37.16.01A Guide for the Dynamic Calibration of Pressure Transducers 2002
• Presented with permission of ISA• All material is copyright ISA and The
Dynamic Consultant, LLC• Section & Figure references are from the
Standard

2
June22, 2004 Transducer Workshop 2004, All rights reserved.
3
Instructor
• Jon Wilson, Principal ConsultantThe Dynamic Consultant, LLC– Over 45 years in testing and instrumentation
Test Engineer, Lab Manager, Applications Engineering Manager, Marketing Manager, Consultant & Lecturer (since 1985)
– Chrysler Corp., ITT Cannon Electric, Motorola, Endevco, The Dynamic Consultant
– ISA SP37 Committee Member
June22, 2004 Transducer Workshop 2004, All rights reserved.
4
History
• Originally ASME Standard• ANSI Std. since 1972• ASME > ISA in 1996• 1997 ISA SP37.16 Subcommittee on
Pressure Transducers began update• Result: ISA-S37.16 A Guide for the
Dynamic Calibration of Pressure Transducers

3
June22, 2004 Transducer Workshop 2004, All rights reserved.
5
Contributors
• Some people here were major contributors
• Any Working Group members present,please stand and be recognized
June22, 2004 Transducer Workshop 2004, All rights reserved.
6
Introduction to the Standard
• Need to measure rapidly changing pressures
• First need to characterize the transducer• Recent advances in dynamic pressure
generators• Recent advances in data acquisition have
improved accuracy and frequency range

4
June22, 2004 Transducer Workshop 2004, All rights reserved.
7
Intent of S37.16
• Document current techniques• Identify possible pitfalls• Improve communication in the field• Not a step-by-step procedure• Not discussion of all factors affecting
pressure measurement• Concentrates on what affects dynamic
response
June22, 2004 Transducer Workshop 2004, All rights reserved.
8
What’s in it?
• Scope, Purpose, Table of Symbols• Transducer properties, dynamic pressure
sources, use of pressure sources• Problems of transducer installation,
electronic signal conditioning• Data recording methods, recommended
reporting procedures

5
June22, 2004 Transducer Workshop 2004, All rights reserved.
9
Section 1, Scope
• Establishes minimum specifications for design and performance characteristics for pressure transducers; uniform acceptance and qualification tests, including calibration techniques and test conditions; and drawing symbols for use in electrical schematics.
June22, 2004 Transducer Workshop 2004, All rights reserved.
10
Section 2, Purpose
• Establishes guidelines for calibration of dynamic pressure transducers
• Covers pressure transducers, primarily those used in measurement systems
• Applies to absolute, differential, gage and sealed reference transducers

6
June22, 2004 Transducer Workshop 2004, All rights reserved.
11
Section 3, Symbols
• Terminology and symbols are consistent with ISA SP51.1, SP37.1 and IEEE “Dictionary of Standards”
June22, 2004 Transducer Workshop 2004, All rights reserved.
12
Table of Symbols

7
June22, 2004 Transducer Workshop 2004, All rights reserved.
13
4, TRANSDUCER PROPERTIES
• Transfer function > Frequency response• Assumed:
LinearSecond orderSingle degree of freedom
June22, 2004 Transducer Workshop 2004, All rights reserved.
14
4.1, Underdamped Second-Order

8
June22, 2004 Transducer Workshop 2004, All rights reserved.
15
Transfer Function
June22, 2004 Transducer Workshop 2004, All rights reserved.
16
PE Transfer Function
• PE cannot respond to static pressure• Add high-pass RC to transfer function

9
June22, 2004 Transducer Workshop 2004, All rights reserved.
17
Output Response to Step
• Figure 3 plots Equation 4.4 for various ζ
June22, 2004 Transducer Workshop 2004, All rights reserved.
18
Effect of Damping, 1

10
June22, 2004 Transducer Workshop 2004, All rights reserved.
19
Effect of Damping, 2
June22, 2004 Transducer Workshop 2004, All rights reserved.
20
Transient Response

11
June22, 2004 Transducer Workshop 2004, All rights reserved.
21
4.2, General Transducer Properties
• Many properties relating to static pressure measurement are typically provided by manufacturers.
• This section discusses those with specific application to dynamic measurement.
June22, 2004 Transducer Workshop 2004, All rights reserved.
22
4.2.1, Sensitivity
• Ratio of output change to input change– Usually voltage per pressure unit
• Represented by constant K of Equations 4.2 & 4.3
• If 4.2 (steady state capable), can be established by static measurements
• If 4.3 (no steady state output), dynamic measurement is required

12
June22, 2004 Transducer Workshop 2004, All rights reserved.
23
4.2.2, Linearity
• The closeness of a calibration curve to a specified straight line
• CAVEAT: Reference line must be unambiguously specified
• Any deviation from a straight line is a non-linearity
• Usually expressed as % of full scale output
June22, 2004 Transducer Workshop 2004, All rights reserved.
24
4.2.3, Range
• Measurand values over which a transducer is intended to measure
• Specified by upper and lower limits• Lower limit usually determined by noise• Upper limit may be determined by excess
non-linearity or by mechanical or electrical clipping

13
June22, 2004 Transducer Workshop 2004, All rights reserved.
25
4.2.4, Creep (Drift)
• Change in output over a specific time– Measurand held constant– Environmental conditions held constant– Excitation (if any) held constant
• Usually expressed as % of full scale output per unit time at specified conditions
June22, 2004 Transducer Workshop 2004, All rights reserved.
26
4.2.5, Hysteresis
• Maximum difference in output, at any measurand value within the range, when the value is approached first with increasing then with decreasing measurand
• Usually expressed as % of full scale output

14
June22, 2004 Transducer Workshop 2004, All rights reserved.
27
4.2.6, Proof Pressure
• Pressure that may be applied to the sensing element of a transducer without changing the transducer performance beyond specified tolerances
June22, 2004 Transducer Workshop 2004, All rights reserved.
28
4.2.7, Repeatability
• Maximum difference in output at the same measurand value applied consecutively under the same conditions and in the same direction
• Usually expressed as % of full scale output

15
June22, 2004 Transducer Workshop 2004, All rights reserved.
29
4.2.8, Acceleration Compensation
• Integral accelerometer element that reduces the transducer’s sensitivity to motion
• Usually expressed as equivalent applied pressure per g or m/s2
June22, 2004 Transducer Workshop 2004, All rights reserved.
30
4.2.9, Thermal Sensitivity Shift
• Change in sensitivity of transducer as a result of a change in steady-state operating temperature
• Usually specified as % per degree C or degree F

16
June22, 2004 Transducer Workshop 2004, All rights reserved.
31
4.2.10, Resolution
• Smallest discernible signal• May be referred to as “threshold”• May be specified in measurand units
– psi, Pascal, etc.
June22, 2004 Transducer Workshop 2004, All rights reserved.
32
4.2.11, Noise
• Any signal in the measurement system other than the desired pressure response
• May be specified in electrical units or equivalent pressure units

17
June22, 2004 Transducer Workshop 2004, All rights reserved.
33
4.3, Properties in Frequency Domain
• Properties in the frequency domain are described by the transfer functionRef. Eq. 4.2 and 4.3
June22, 2004 Transducer Workshop 2004, All rights reserved.
34
4.3.1, Amplitude Response
• Frequency response (transfer function) can be computed from Eq. 4.2 or 4.3 by substituting jω for s and computing magnitude
• Figure 1 is a normalized plot that shows deviations from flat response
• Frequency response plot indicates resonant frequencies, bandwidth and damping

18
June22, 2004 Transducer Workshop 2004, All rights reserved.
35
4.3.2, Phase Response
• Phase of transfer function vs frequency• Substitute jω for s and compute phase as ω varies
• Figure 2 is an example of phase response plots
• In time domain, phase indicates instantaneous shape of response and contributes to time lag of response
June22, 2004 Transducer Workshop 2004, All rights reserved.
36
4.3.3, Resonant Frequency
• Measurand frequency that gives maximum output amplitude
• Lowest frequency resonance usually most important; may be many
• Second order system approximation is usually valid (if first resonance is dominant)
• Amplitude response determined by damping

19
June22, 2004 Transducer Workshop 2004, All rights reserved.
37
4.4, Properties in Time Domain
• Descriptions of the transducer response to a specified input, usually a step function
June22, 2004 Transducer Workshop 2004, All rights reserved.
38
4.4.1, Ringing Frequency• Sometimes referred to as “damped natural
frequency”• Frequency of free oscillation when excited by
step function• Related to resonant frequency by:

20
June22, 2004 Transducer Workshop 2004, All rights reserved.
39
4.4.2, Damping
• Energy dissipation that, with natural frequency, determines frequency response and transient response characteristics of transducer
• After step-change, underdampedoscillates decaying to final steady value, overdamped does not overshoot, critically damped returns to steady state fastest
June22, 2004 Transducer Workshop 2004, All rights reserved.
40
4.4.3, Damping Ratio
• Ratio of actual to critical damping, ζ• Dynamic pressure transducers have very
low damping– Natural frequency and ringing frequency
approximately equal• ζ determines overshoot and ringing as well
as maximum response at resonance, Q

21
June22, 2004 Transducer Workshop 2004, All rights reserved.
41
4.4.4, Rise Time
• Time for output to rise from 10% to 90% of its final value in response to step change of measurand
• Rise time is related to transducer frequency response
June22, 2004 Transducer Workshop 2004, All rights reserved.
42
4.4.5, Overshoot• Amount of output measured beyond final steady
output value in response to step change of measurand
• Maximum theoretical overshoot of ideal second-order transducer is 100% when ζ is zero

22
June22, 2004 Transducer Workshop 2004, All rights reserved.
43
4.4.6, Settling Time (1)
• Time required, after step-change of measurand, for output to settle within a small specified percentage (usually 5%) of its final value; with small ζ:
June22, 2004 Transducer Workshop 2004, All rights reserved.
44
4.4.6, Settling Time (2)
• Number of oscillations to settle within 5% for ideal second-order transducer:

23
June22, 2004 Transducer Workshop 2004, All rights reserved.
45
4.4.7, Discharge Time Constant
• Time for transducer to discharge its signal to 37% of original value after step-change measurand
• Equivalent to discharge time constant of an R-C circuit
• Relates to low frequency capability for both transient and continuous measurements
June22, 2004 Transducer Workshop 2004, All rights reserved.
46
5, DYNAMIC PRESSURE GENERATORS
• Two basic classes: periodic and aperiodic• Periodic are most often sine-wave
generators– Limited amplitude and frequency– Need transfer standard
• Aperiodic generate a pulse or a step– Large variation in amplitudes and rise times

24
June22, 2004 Transducer Workshop 2004, All rights reserved.
47
Aperiodic Pressure Generators
June22, 2004 Transducer Workshop 2004, All rights reserved.
48
Periodic Pressure Generators

25
June22, 2004 Transducer Workshop 2004, All rights reserved.
49
5.1, Shock Tubes (1)
• Two sections of tubing separated by diaphragm, different pressures in each section
• When diaphragm is suddenly ruptured, a shock wave is formed in the lower pressure section of the tube
• 10-15 diameters down the tube, shock wave creates positive pressure step
June22, 2004 Transducer Workshop 2004, All rights reserved.
50
5.1, Shock Tubes (2)
• Characteristics of shock wave depend on tube dimensions, temperature, initial pressure, gas used, initial pressures, etc.
• Amplitude of pressure step depends on:shock wave velocity and initial absolute pressure and temperature in low pressure section

26
June22, 2004 Transducer Workshop 2004, All rights reserved.
51
5.1.1, Sidewall Transducer Mounting
• Transducer mounted flush in sidewall of low pressure section will measure “incident” pressure when shock wave passes it
• Using air as the gas in the low pressure section, pressure amplitude can be computed from Rankine-Hugoniotrelations
June22, 2004 Transducer Workshop 2004, All rights reserved.
52
5.1.1, Rankine-Hugoniot Equations

27
June22, 2004 Transducer Workshop 2004, All rights reserved.
53
5.1.1, Using Rankine-Hugoniot
• Use static-wall temperature of shock tube• Measure velocity of shock wave using two
sensors known distance apart and timing passage; pressure transducers are most common– 0.5% uncertainty in velocity produces at least 1%
uncertainty in computed pressure-step amplitude• Use smallest and fastest rise time transducers to
minimize the rise time of the pressure step caused by passage of shock wave
June22, 2004 Transducer Workshop 2004, All rights reserved.
54
5.1.1, Theoretical Rise Time
• Theoretical rise time for circular diaphragm pressure transducers mounted flush in the sidewall of a shock tube is:

28
June22, 2004 Transducer Workshop 2004, All rights reserved.
55
5.1.1, When to Use Side Mounting
• 1. When similar to application• 2. When maximum accuracy of pressure-
step amplitude is desired• 3. To minimize transducer ringing• 4. When incident wave is considerably
cleaner than reflected wave
June22, 2004 Transducer Workshop 2004, All rights reserved.
56
5.1.2, End-wall Mounting
• End of low-pressure section sealed off, shock wave will reflect from it (“reflected wave”)
• Transducer flush in end plate sees only reflected wave
• Shorter rise time and higher pressure than incident wave
• Rise time (nanoseconds) short enough to excite ringing in almost all transducers

29
June22, 2004 Transducer Workshop 2004, All rights reserved.
57
5.1.2, Pressure Step
• When air is the working gas, pressure step behind the reflected shock wave is:
June22, 2004 Transducer Workshop 2004, All rights reserved.
58
5.1.2, When to Use End-wall
• 1. To determine transducer ringing frequencies
• 2. When similar to application• 3. When maximum pressure-step
amplitude is required• 4. When maximum duration of constant
pressure behind the shock wave is desired• 5. When transducer is recess mounted

30
June22, 2004 Transducer Workshop 2004, All rights reserved.
59
5.1.3, Other Considerations
• Walls and end plate experience vibration• Blank off the sensing end of the
transducer from the pressure wave, without altering acceleration components
• Use heavy walled tubing and end plate• Shock mount the tube• Shock wave causes temperature transient,
could affect some transducers
June22, 2004 Transducer Workshop 2004, All rights reserved.
60
5.1.4, Recommended Operating Conditions
• When reflected mode used, should be operated under tailored conditions (Ref. 2, 26 &28)
• Transducer should be flush mounted• Shock tube must be free of moisture and
debris• Acceleration and transient temperature
characteristics should be determined before calibration

31
June22, 2004 Transducer Workshop 2004, All rights reserved.
61
5.2, Shockless Pressure-step Generators
• Most use fast-opening valve, no shock wave
• Produce increasing or decreasing pressure steps
• Most use gas, some use liquid
June22, 2004 Transducer Workshop 2004, All rights reserved.
62
5.2.3, Commercial Pressure Step Generator (1)
• Pressure step magnitude determined by measuring static pressure before & after gives good accuracy
• Duration of constant pressure after the step can be controlled
• Initial pressure and pressure step can be controlled over wide ranges
• Operation is faster and simpler than shock tube

32
June22, 2004 Transducer Workshop 2004, All rights reserved.
63
5.2.3, Commercial Pressure Step Generator (2)
• Acceleration and temperature transients are present in shockless generator
• Not as severe as with shock tube• Acceleration and temperature transient
characteristics of transducer should be characterized before calibrating
June22, 2004 Transducer Workshop 2004, All rights reserved.
64
5.2.3, Recommended Operating Conditions
• 1. Transducer flush mounted with minimum dead volume
• 2. Rise time of generator should be less than 1/5 that of the transducer
• 3. Amplitude of pressure steps should cover the range of the transducer
• 4. Calibration medium should be similar to that in use
• 5. Pressure steps should be same direction as in use
33
June22, 2004 Transducer Workshop 2004, All rights reserved.
65
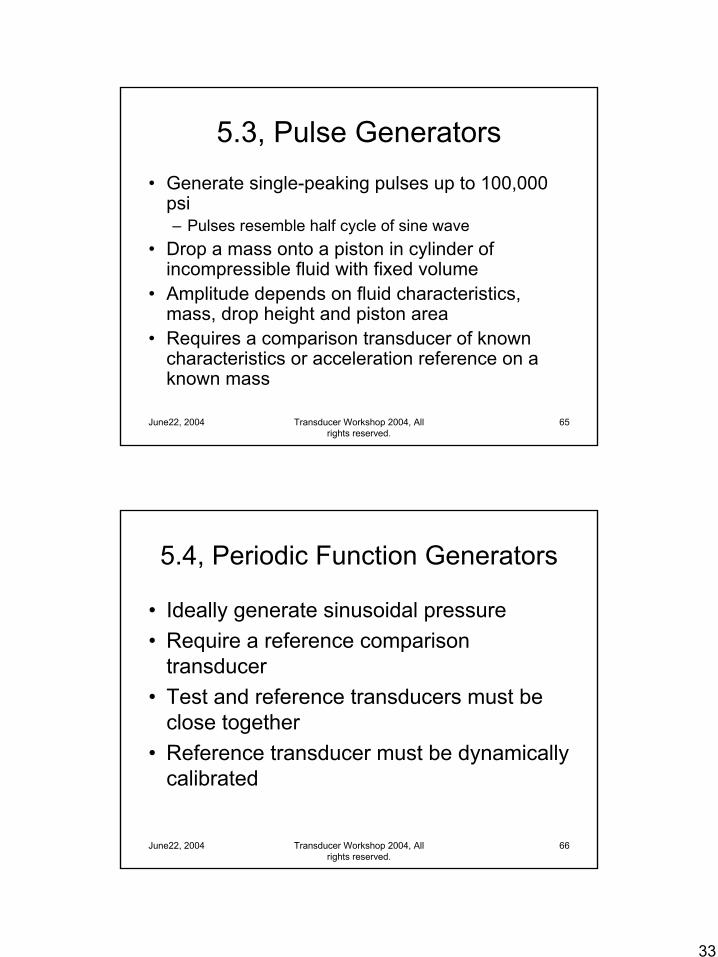
5.3, Pulse Generators• Generate single-peaking pulses up to 100,000
psi– Pulses resemble half cycle of sine wave
• Drop a mass onto a piston in cylinder of incompressible fluid with fixed volume
• Amplitude depends on fluid characteristics, mass, drop height and piston area
• Requires a comparison transducer of known characteristics or acceleration reference on a known mass
June22, 2004 Transducer Workshop 2004, All rights reserved.
66
5.4, Periodic Function Generators
• Ideally generate sinusoidal pressure • Require a reference comparison
transducer• Test and reference transducers must be
close together• Reference transducer must be dynamically
calibrated
34
June22, 2004 Transducer Workshop 2004, All rights reserved.
67
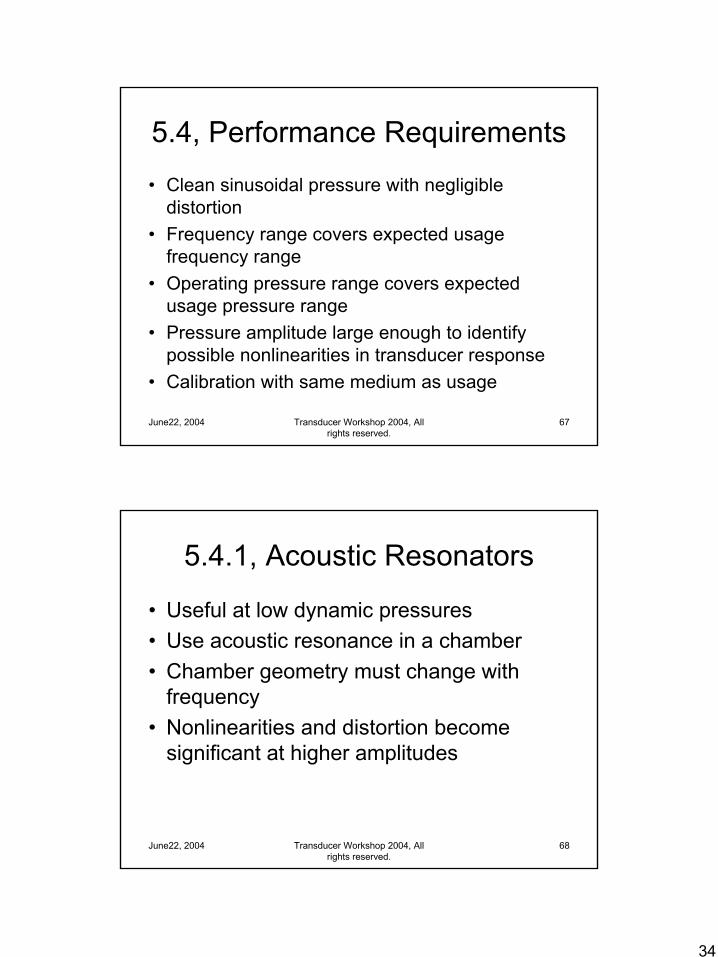
5.4, Performance Requirements
• Clean sinusoidal pressure with negligible distortion
• Frequency range covers expected usage frequency range
• Operating pressure range covers expected usage pressure range
• Pressure amplitude large enough to identify possible nonlinearities in transducer response
• Calibration with same medium as usage
June22, 2004 Transducer Workshop 2004, All rights reserved.
68
5.4.1, Acoustic Resonators
• Useful at low dynamic pressures• Use acoustic resonance in a chamber• Chamber geometry must change with
frequency• Nonlinearities and distortion become
significant at higher amplitudes

35
June22, 2004 Transducer Workshop 2004, All rights reserved.
69
5.4.2, Variable-volume Generators (1)
• Small fixed mass of working fluid, alternately compressed and expanded in small chamber
• Chamber has high natural frequency to avoid resonant effects
• Piston or diaphragm varies pressure• “Pistonphone” is an example• Mostly used for sound pressure calibrators
June22, 2004 Transducer Workshop 2004, All rights reserved.
70
5.4.2, Variable-volume generators (2)
• Isentropic compression; pressure follows piston position
• Po = equilbrium pressure• ℓo = equilibrium piston position• γ = ratio of specific heats

36
June22, 2004 Transducer Workshop 2004, All rights reserved.
71
5.4.2, Variable-volume generators (3)
• If piston motion is sinusoidal, pressure can be expressed by Eq. 5.7; and dynamic pressure by Eq. 5.8 (clearly nonsinusoidal)
• Limited amplitude and frequency ranges
June22, 2004 Transducer Workshop 2004, All rights reserved.
72
5.4.3, Variable-mass Generators
• Fixed chamber volume with rate of fluid flow into or out of the chamber varied to produce dynamic pressure pulsations
• Larger pressure amplitudes at high frequencies than the variable-volume generators
• Siren-type devices modulating flow from a constant pressure source
• Not commercially produced for pressure calibration
37
June22, 2004 Transducer Workshop 2004, All rights reserved.
73
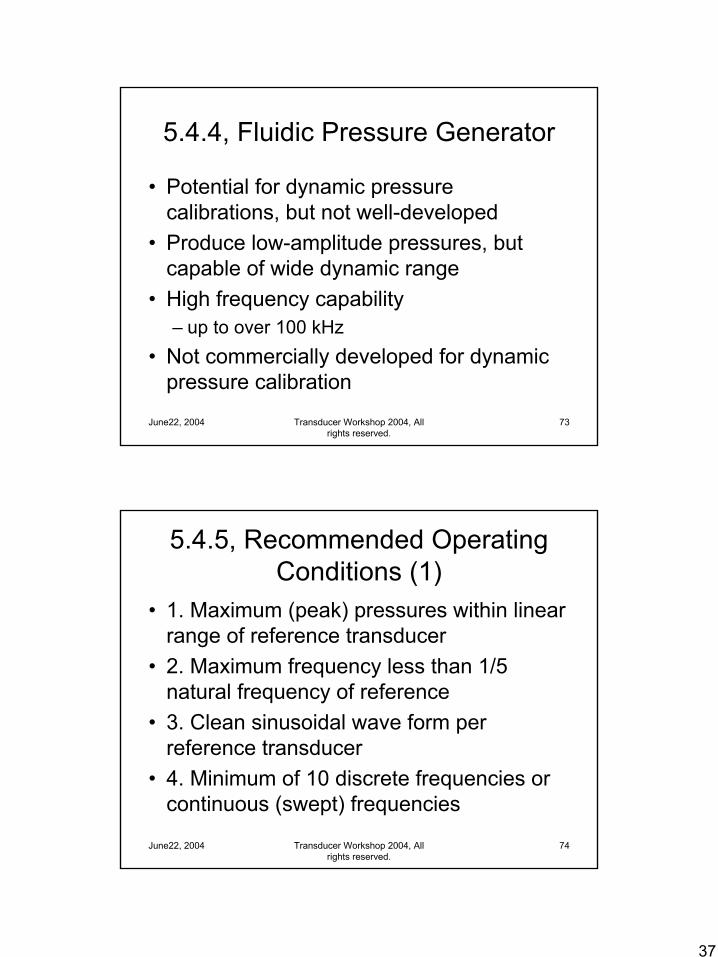
5.4.4, Fluidic Pressure Generator
• Potential for dynamic pressure calibrations, but not well-developed
• Produce low-amplitude pressures, but capable of wide dynamic range
• High frequency capability – up to over 100 kHz
• Not commercially developed for dynamic pressure calibration
June22, 2004 Transducer Workshop 2004, All rights reserved.
74
5.4.5, Recommended Operating Conditions (1)
• 1. Maximum (peak) pressures within linear range of reference transducer
• 2. Maximum frequency less than 1/5 natural frequency of reference
• 3. Clean sinusoidal wave form per reference transducer
• 4. Minimum of 10 discrete frequencies or continuous (swept) frequencies
38
June22, 2004 Transducer Workshop 2004, All rights reserved.
75
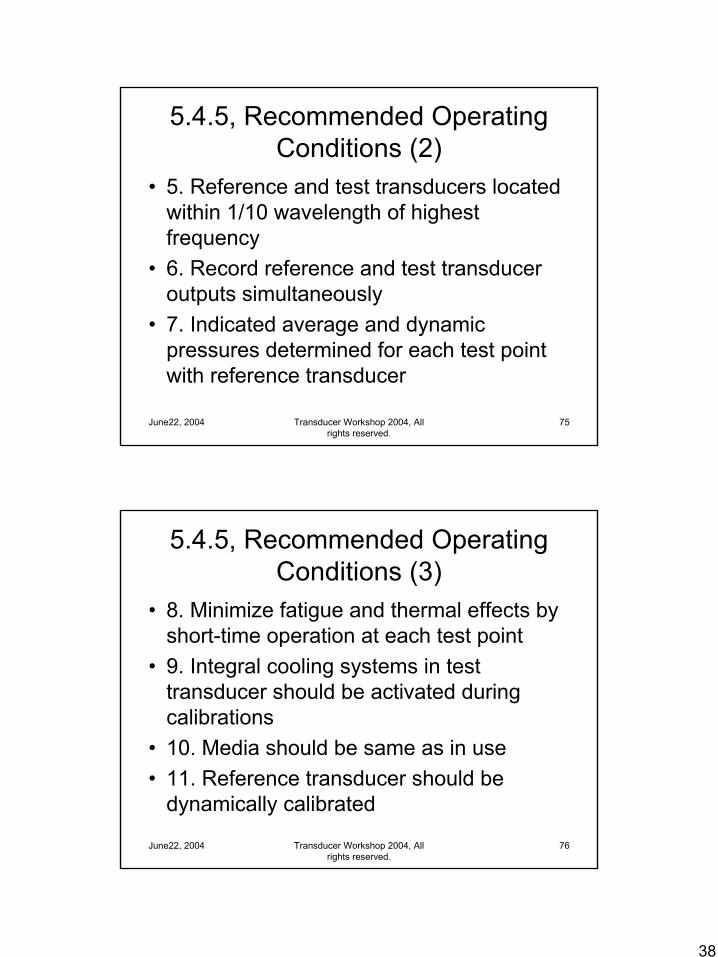
5.4.5, Recommended Operating Conditions (2)
• 5. Reference and test transducers located within 1/10 wavelength of highest frequency
• 6. Record reference and test transducer outputs simultaneously
• 7. Indicated average and dynamic pressures determined for each test point with reference transducer
June22, 2004 Transducer Workshop 2004, All rights reserved.
76
5.4.5, Recommended Operating Conditions (3)
• 8. Minimize fatigue and thermal effects by short-time operation at each test point
• 9. Integral cooling systems in test transducer should be activated during calibrations
• 10. Media should be same as in use• 11. Reference transducer should be
dynamically calibrated

39
June22, 2004 Transducer Workshop 2004, All rights reserved.
77
6, MEASUREMENT OF TRANSDUCER PROPERTIES
• Pressure transducer calibration could more accurately be called “characterization”
• Complete calibration involves determining several characteristics or properties of a transducer
June22, 2004 Transducer Workshop 2004, All rights reserved.
78
6.1, Sensitivity (1)
• May be established with periodic or aperiodic pressure generators
• Preferable to use a method that does not require a reference transducer
• Shock tubes can provide uncertainties approaching 2%
• Other techniques may be even better, but may be limited in amplitude or frequency range

40
June22, 2004 Transducer Workshop 2004, All rights reserved.
79
6.1, Sensitivity (2)
• Step pressure sources produce oscillatory output
• In shock tube reflected wave may disturb transducer before oscillations decay
• Quick-opening valve generators apply undisturbed pressure long after oscillations decay
June22, 2004 Transducer Workshop 2004, All rights reserved.
80
6.1, Sensitivity (3)
• If transducer does not respond to static pressure, waiting for oscillations to decay may contribute error
• Example: RC roll-off at 1 Hz will decay 5% in approximately 8 milliseconds
• Sinusoidal generators are more straightforward, but limited in amplitude and frequency

41
June22, 2004 Transducer Workshop 2004, All rights reserved.
81
6.2, Amplitude Response (1)
• Most important and most difficult to obtain• Ideally calibrated with swept sinusoidal
generator• Sine generators not flat frequency
response• Need reference transducer for comparison• Natural frequency of reference must be at
least 5 times measurand frequencies
June22, 2004 Transducer Workshop 2004, All rights reserved.
82
6.2, Amplitude Response (2)
• Sinusoidal generators incapable of high enough frequencies
• Some dynamic pressure transducers have frequency response to 500 kHz or greater
• Require aperiodic generator like shock tube

42
June22, 2004 Transducer Workshop 2004, All rights reserved.
83
6.2.1, Sinusoidal Pressure
• Acoustic effects limit practicability of sinusoidal generators at high frequencies
• Practical frequency limit is a few thousand hertz
• Higher frequencies produce distortions– May affect response of test or reference– May affect test and reference differently
• RMS detection is recommended for all steady-state sinusoidal measurements
June22, 2004 Transducer Workshop 2004, All rights reserved.
84
6.2.2, Aperiodic Sources• Shock tube can provide amplitude and phase
response by transforming output from time domain to frequency domain
• Assume pressure input is step function• Best to use reflected wave (end-wall mounting)
to get closest to step function• Acceleration, thermal, and coupling port effects
must be minimized• Recommended sampling rate 5 times highest
frequency

43
June22, 2004 Transducer Workshop 2004, All rights reserved.
85
6.3, Phase Response
• Reference transducer should have negligible phase shift in test frequency range
• Located test and reference transducers on opposite sides of measurement cavity
• Electronic filter cutoff frequency at least a decade above measurement frequencies
• Derive from shock tube measurement (FFT)
June22, 2004 Transducer Workshop 2004, All rights reserved.
86
6.4, Resonant Frequency
• Best determined by reflected wave in shock tube• Determine from peak of frequency response
curve• Calculate from ringing frequency:

44
June22, 2004 Transducer Workshop 2004, All rights reserved.
87
6.5, Ringing Frequency
• Response of an underdamped transducer to a step or impulse input; damped oscillatory transient
• Frequency can be derived from time history
• May have multiple ringing frequencies• Frequency response below lowest ringing
frequency approximates SDoF
June22, 2004 Transducer Workshop 2004, All rights reserved.
88
6.6, Damping Ratio (1)
• Can be obtained from amplitude response using sine-wave generator
• Can be measured using an aperiodicgenerator

45
June22, 2004 Transducer Workshop 2004, All rights reserved.
89
6.6, Damping Ratio (2)
• Amplification factor of resonance on amplitude-ratio curve is related to damping ratio, and is plotted in Fig. 1:
June22, 2004 Transducer Workshop 2004, All rights reserved.
90
6.6, Damping Ratio (3)
• Solving that relationship for ζ:

46
June22, 2004 Transducer Workshop 2004, All rights reserved.
91
6.6, Damping Ratio (4)
• With step input, damping ration can be calculated from Eq. 6.5, where N is the number of complete cycles over which the measurement is made
June22, 2004 Transducer Workshop 2004, All rights reserved.
92
6.6, Damping Ratio (5)
• Oscillatory response for Eq. 6.5

47
June22, 2004 Transducer Workshop 2004, All rights reserved.
93
6.6, Damping Ratio (6)
• Best accuracy is achieved when N = 1• Then, Eq. 6.5 becomes:
June22, 2004 Transducer Workshop 2004, All rights reserved.
94
6.7, Rise Time
• Apply step input and measure time for output to go from 10% to 90% of final value
• Rise time of step input must be less than 1/5 rise time of transducer for <1% error
• Rise time of recording system must be short enough to introduce negligible error

48
June22, 2004 Transducer Workshop 2004, All rights reserved.
95
6.8, Overshoot
• Observe response to step input• Overshoot is peak output – average output
divided by average output:
June22, 2004 Transducer Workshop 2004, All rights reserved.
96
7, TRANSDUCER INTERFACES
• When installing for calibration or measurement consider:
• 1. Strain effects• 2. Cavity of passage resonances• 3. Temperature effects• 4. Acceleration effects• Other environmental and physical factors
may affect accuracy or noise
49
June22, 2004 Transducer Workshop 2004, All rights reserved.
97
7.1, Mounting, Strain Effects
• Non-precision mounting or over-torquingmay cause strain in the transducer housing
• May show up as change of sensitivity, zero shift or mechanically induced noise
• Can be evaluated by calibrating with recommended torque, then with over-torque and/or under-torque
June22, 2004 Transducer Workshop 2004, All rights reserved.
98
7.2, Cavities & Passages
• Any connecting line or cavity between the test transducer and the pressure source will affect transducer response
• Effect gets worse as frequency increases• Above 10 kHz transducer must be flush
mounted• Mount in same configuration as intended
use
50
June22, 2004 Transducer Workshop 2004, All rights reserved.
99
7.3, Temperature Effects (1)
• Many pressure transducers experience a change of sensitivity or a change of zero output caused by temperature difference
• May also be affected by transient temperature
• Temperature effects must be evaluated and characterized before attempting to calibrate
June22, 2004 Transducer Workshop 2004, All rights reserved.
100
7.3, Temperature Effects (2)
• Evaluate with steady state or sinusoidal pressure at two or more stabilized temperatures
• Evaluate with steady state or sinusoidal pressure while rapidly changing or cycling temperature
• Evaluate with steady state or sinusoidal pressure while exposing sensing surfact to heat lamp and/or electronic flash
51
June22, 2004 Transducer Workshop 2004, All rights reserved.
101
7.3.1, Liquid-cooled Transducers
• One method of reducing temperature effects is to provide liquid cooling
• Intrinsic cooling uses passageways in the transducer case and/or diaphragm
• Cooled adapter provides a liquid cooled mounting adapter
• Cooling should be activated during temperature characterization and calibration
June22, 2004 Transducer Workshop 2004, All rights reserved.
102
7.3.2 Gas-bleed Method
• In the most extreme temperature environments (i.e. rocket engines), constant flow of cool gas (helium) is bled into a cavity in front of the diaphragm from a high pressure supply
• Provides heat shield and minimizes passage resonances
• Shock tube calibration can help determine best gas bleed parameters

52
June22, 2004 Transducer Workshop 2004, All rights reserved.
103
7.3.3, Diaphragm Coatings
• Silicone rubber or silicone grease may be applied to the transducer diaphragm to protect from short-term exposures
• Properly applied, has little effect on performance above about 10 psi full scale ranges
• Most accurate calibration requires that the coating be in place
June22, 2004 Transducer Workshop 2004, All rights reserved.
104
7.4, Acceleration Effects
• Dynamic pressure may cause vibrations in the mounting structure; may induce acceleration and/or strain effects in transducer
• Evaluate by mounting transducer in a blind hole (to block pressure) and perform calibration process
• Any output must be caused by non-pressure effects

53
June22, 2004 Transducer Workshop 2004, All rights reserved.
105
8, ELECTRONIC CONSIDERATIONS
• Signal conditioning and data acquisition and recording equipment must be compatible with test and standard units
• Rise time less than 1/5 that of transducer• Frequency response should introduce
negligible error over calibration frequency range
June22, 2004 Transducer Workshop 2004, All rights reserved.
106
8.1, Noise
• Noise may be a problem if transducer output is low
• Noise may originate in any part of the system
• Insufficient signal to noise ratio makes calibration data difficult to interpret

54
June22, 2004 Transducer Workshop 2004, All rights reserved.
107
8.1.1, Transducer Noise
• Acceleration, thermal effects, electromagnetic fields, improper mounting may cause noise
• Noise may be generated internally by strain gage elements or electronic circuitry
• Low-impedance output transducers are generally less susceptible to these sources than high-impedance
June22, 2004 Transducer Workshop 2004, All rights reserved.
108
8.1.2, Cable Noise
• Cable may pick up extraneous noise or may generate noise internally
• Friction between layers of cable may generate static charges (PE transducers are especially susceptible)
• Imperfect shielding or ground loops may induce noise
• IEPE transducers are less susceptible

55
June22, 2004 Transducer Workshop 2004, All rights reserved.
109
8.1.3, Amplifier Noise
• All amplifiers have a noise characteristics• Usually quantified referred to the input• Independent of input cabling
June22, 2004 Transducer Workshop 2004, All rights reserved.
110
8.1.4, System Noise
• All previously mentioned sources plus inductively and capacitively coupled noise
• Proper grounding, avoiding ground loops, and differential amplifiers minimize
• Shielded twisted pair or coaxial cabling plus single point ground minimize
• Use dependable, verifiable ground point

56
June22, 2004 Transducer Workshop 2004, All rights reserved.
111
8.2, Cabling
• PE transducers require high quality low-noise coaxial cable
• IEPE and bridge-type transducers minimize cable noise problems
• Ideal calibration uses same cable as in intended use
June22, 2004 Transducer Workshop 2004, All rights reserved.
112
8.3, Voltage Amplifier
• Bridge type and IEPE transducers use voltage amplifiers for impedance matching and for ranging signal for downstream
• PE transducers should not be used with an older voltage type amplifier – use a charge amplifier instead

57
June22, 2004 Transducer Workshop 2004, All rights reserved.
113
8.3.1, Slew Rate• Maximum rate of change of output voltage from
the amplifier (especially for large signals)• Slew rate limits maximum frequency and
minimum rise time for full-power response from amplifier
June22, 2004 Transducer Workshop 2004, All rights reserved.
114
9, DATA ACQUISITION & ANALYSIS
• Data acquired by digital oscilloscope or recorder
• Analyze in time domain• Analyze in frequency domain

58
June22, 2004 Transducer Workshop 2004, All rights reserved.
115
9.1, Digital Oscilloscope or Recorder
• With shock tube, rise-time should be less than 1/5 that of the signal
• Can be measured by application of a square wave to properly terminated input terminal
• Frequency response determined by sampling rate and anti-alias filtering
• Best if flat to frequency beyond resonance of transducer
June22, 2004 Transducer Workshop 2004, All rights reserved.
116
9.2, Data Analysis
• May be time domain analysis for amplitude calibration, damping determination, etc.
• May be frequency domain analysis for transfer function, etc.

59
June22, 2004 Transducer Workshop 2004, All rights reserved.
117
9.2.1, Time Analysis
• Only requires faithful reproduction of waveform of test and reference transducers
• Flat amplitude and linear phase response are required over full frequency range
• Sampling rate should be high enough, and anti alias filter selected, to avoid aliasing
June22, 2004 Transducer Workshop 2004, All rights reserved.
118
9.2.2, Frequency Analysis
• Multi-channel spectrum analyzers available
• FFT of each channel or transfer function between reference and test channels
• Coherence function should be near 1.0 over the frequency range

60
June22, 2004 Transducer Workshop 2004, All rights reserved.
119
10, REPORTING TEST RESULTS
• Data presented in meaningful manner• Information depends on complexity of
equipment and procedures• May require detailed explanation of test
conditions and supporting information
June22, 2004 Transducer Workshop 2004, All rights reserved.
120
10.1, Test Conditions
• Test equipment• Environmental conditions• Mounting configuration• Special considerations

61
June22, 2004 Transducer Workshop 2004, All rights reserved.
121
10.1.1, Test Equipment
• Unique or non-standard equipment requires description and definition of capabilities
• Use recorded-time histories of reference transducer and response of readout equipment to square wave inputs
• Transfer function and coherence may be useful
June22, 2004 Transducer Workshop 2004, All rights reserved.
122
10.1.2, Environmental and Related
• Dynamic pressure changes are often accompanied by rapid temperature changes, vibration and acceleration
• Comments or data explaining their effects• Output of blocked-off transducer in shock
tube test, for example

62
June22, 2004 Transducer Workshop 2004, All rights reserved.
123
10.2, Results and Discussion
• Transducer response to pressure step in shock tube
• Other previously mentioned data• Definition of terms used
June22, 2004 Transducer Workshop 2004, All rights reserved.
124
References
• 1. Jon S. Wilson, “Pressure Measurement Principals and Practices”, Sensors Magazine, Vol. 20 No. 1, January 2003
• 2. Jim Lally and Dan Cummiskey, “Dynamic Pressure Calibration”, Sensors Magazine, Vol. 20 No. 4, April 2003
• 3. ISA-S37.16.01-2002, “A Guide for the Dynamic Calibration of Pressure Transducers, Instrument Society of America

63
June22, 2004 Transducer Workshop 2004, All rights reserved.
125
More References
• 4. Jon S. Wilson (Ed.), Dynamic Pressure Measurement Technology, Publ. Endevco, San Juan Capistrano, CA, 1991
• 5. Abundant references (77) provided in the standard.
June22, 2004 Transducer Workshop 2004, All rights reserved.
126
CONCLUSION
QUESTIONS, COMMENTS & DISCUSSION

64
June22, 2004 Transducer Workshop 2004, All rights reserved.
127
THANK YOU FOR YOUR
PARTICIPATION
June22, 2004 Transducer Workshop 2004, All rights reserved.
128
CONTACT INFORMATION:
• Jon Wilson, Principal ConsultantThe Dynamic Consultant, LLC4959 East Karsten DriveChandler, AZ 85249-7175Voice & FAX: 480-699-9274Email: [email protected]