dynamic models with spatial conditionas in revenue management
TRANSCRIPT

Dynamic Models with Spatial Conditionsin Revenue Management
Yu OGASAWARA
Safety Science and Technology
Graduate School of Science and Technology, Hirosaki University
September, 2017

Dynamic Models with Spatial Conditionsin Revenue Management
Yu OGASAWARA
A Thesis
Submitted to the Graduate School of Science and Technology
In Partial Fulfillment of the Requirements for the Degree of
Doctor of Philosophy in Engineering
Safety Science and Technology
Graduate School of Science and Technology, Hirosaki University
September, 2017

Advisory Committee
Masamichi KON Associate Professor Committee Chair
Hiroshi NAKAZATO Professor Committee Member
Tomoyuki NAGASE Associate Professor Committee Member
Makoto SAKAKI Professor Committee Member
Kimitoshi TSUTAYA Professor Committee Member

i
Acknowledgments
I am deeply grateful to Dr. Masamichi Kon from Hirosaki University for accepting me to his
laboratory and guiding me warmly. Also, I thank to Dr. Tomoyuki Nagase for teaching me about
how to write a paper in English. I would like to thank to Dr. Hiroshi Nakazato for asking me to
do cooperative research. Further, I thank to Yuriko Furusawa for advising me from a viewpoint of
actual fields.
Finally, I thank my family for always supporting me.

ii
Abstract
Revenue Management (RM) is a field that deals with decision-making: what product to sell to
which customers at what price under fixed capacity, uncertain demand, large fixed cost and perish-
able products. Traditional applications in RM are airline, hotel and car rental industries. Recently,
RM is applied to not only the traditional industries, but also hospitality’s services or entertainment
industries, such as golf courses, restaurants, casinos, theaters and etc. In the decision-making of
RM, there are allocation problems to decide when to sell which product to which customers. Mod-
els for dealing with simultaneous requests is called a dynamic model.
This paper focuses on the spatial seats’ layout and suggests three dynamic models with seats in
a table and seats placed in rows such as a restaurant, theater or stadium. States of the seats in the
models stand for how seats are reserved by customers. Therefore, we can consider congestion and
booking position which has not been treated in RM, by the new dynamic models.
This study proposes a model with seats in tables and indicates the model’s properties such as
monotonicity. In addition, from the monotonicities we can see the fact that differences of departure
rate among parties cause to multiply variations of optimal policy. A tendency of a range where
variation of optimal policies enlarges is shown by numerical examples. From a spatial point of view,
monotonicity of degree of congestion in a facility and the relation between the number of seats that
a party has and the expected revenue are indicated. Finally, we mention the relationship between
a problem of this model and a challenge which is integration of RM and Customer Relationship
Management (CRM).
Related to the seat problem, we consider a simple case where seats are set on a single line. In
this paper, a model for this problem is called a single line seats model. This model decides which
position should be allocated to arrival parties. This study shows that ends of a block of vacant seats
should be allocated to a party with any size and any fare class. This feature of this model shows that

iii
a single line seats model can be extended over traditional dynamic model [26].
Furthermore, we introduce a choice-based seating position model. In this model, a customer
selects a position of the seat in a facility where seats are placed on multiple lines, and one seat bun-
dles one fare class. This model is also based on a choice-based network RM model which has been
intensively researched and studied for many years. We apply Choice-based Deterministic Linear
Programming (CDLP) and a decomposition approximation method to approximately compute an
optimal policy of the model. Solutions of the approximation methods can be efficiently obtained
when customer’s behavior is based on Multinomial Logit (MNL) choice model, although this model
with large block of vacant seats is normally difficult to obtain optimal solutions for our proposed
model. Numerical examples for the model have been conducted and the policies which are calcu-
lated from the approximation methods are estimated by Monte Carlo simulation. The solutions of
this model indicate that higher revenue is able to be implemented by considering customer’s choice
behavior among seat positions even though it is optimal to accept all requests at any time if we do
not take account of the customer’s choice behavior.

iv
Contents
Acknowledgments i
Abstract ii
1 Introduction 1
2 Seats in Tables 7
2.1 Introduction . . . . . . . . . . . . . . . . . . . . . . . . . . . . . . . . . . . . . . 7
2.2 Formulation . . . . . . . . . . . . . . . . . . . . . . . . . . . . . . . . . . . . . . 9
2.3 Structural Properties . . . . . . . . . . . . . . . . . . . . . . . . . . . . . . . . . 13
2.4 Numerical Examples . . . . . . . . . . . . . . . . . . . . . . . . . . . . . . . . . 21
2.5 Relation to Congestion . . . . . . . . . . . . . . . . . . . . . . . . . . . . . . . . 24
2.5.1 Numerical Examples . . . . . . . . . . . . . . . . . . . . . . . . . . . . . 30
2.6 Relation to Other Models and Current RM’s Problems . . . . . . . . . . . . . . . . 32
2.7 Conclution . . . . . . . . . . . . . . . . . . . . . . . . . . . . . . . . . . . . . . . 33
3 Single Line Seats Model 37
3.1 Introduction . . . . . . . . . . . . . . . . . . . . . . . . . . . . . . . . . . . . . . 37
3.2 Formulation for Single Line Seats Model . . . . . . . . . . . . . . . . . . . . . . 37
3.3 Properties of Single Line Seats Model . . . . . . . . . . . . . . . . . . . . . . . . 40
3.4 Numerical Examples . . . . . . . . . . . . . . . . . . . . . . . . . . . . . . . . . 45
3.4.1 Numerical Example Using Algorithm 3 . . . . . . . . . . . . . . . . . . . 45
3.4.2 Counter-example . . . . . . . . . . . . . . . . . . . . . . . . . . . . . . . 48
3.5 Application of Single Line Seats Model . . . . . . . . . . . . . . . . . . . . . . . 48

v
3.6 Conclution . . . . . . . . . . . . . . . . . . . . . . . . . . . . . . . . . . . . . . . 49
4 Choice-based Seating Position Model 52
4.1 Introduction . . . . . . . . . . . . . . . . . . . . . . . . . . . . . . . . . . . . . . 52
4.2 Formulation for Choice-based Seating Position Model . . . . . . . . . . . . . . . . 52
4.3 Approximation Model . . . . . . . . . . . . . . . . . . . . . . . . . . . . . . . . 54
4.3.1 Choice-based Deterministic Linear Programming (CDLP) . . . . . . . . . 55
4.3.2 Decomposition Approximation Method . . . . . . . . . . . . . . . . . . . 59
4.4 Applying MNL choice model to customer’s behavior . . . . . . . . . . . . . . . . 61
4.5 Numerical Example . . . . . . . . . . . . . . . . . . . . . . . . . . . . . . . . . . 64
4.6 Conclusion . . . . . . . . . . . . . . . . . . . . . . . . . . . . . . . . . . . . . . 66
5 Summary and Future issues 67
Bibliography 69

vi
List of Figures
1.1 Three cases of a state. . . . . . . . . . . . . . . . . . . . . . . . . . . . . . . . . . 2
2.1 States in the cases without cancellation process (Case 1) and with cancellation pro-
cess (Case 2). . . . . . . . . . . . . . . . . . . . . . . . . . . . . . . . . . . . . . 8
2.2 A facility with arriving parties, tables and decisions. . . . . . . . . . . . . . . . . 9
2.3 Arrival rate. . . . . . . . . . . . . . . . . . . . . . . . . . . . . . . . . . . . . . . 31
2.4 Departure rate. . . . . . . . . . . . . . . . . . . . . . . . . . . . . . . . . . . . . 31
2.5 Revenue. . . . . . . . . . . . . . . . . . . . . . . . . . . . . . . . . . . . . . . . 32
2.6 ExSS for max-policy and SS-policy. . . . . . . . . . . . . . . . . . . . . . . . . . 32
2.7 Expected total revenue. . . . . . . . . . . . . . . . . . . . . . . . . . . . . . . . . 33
3.1 Variations of the state X = (0, 0, 1, 1, 0, 0, 0, 0, 0, 0). . . . . . . . . . . . . . . . . 39
3.2 A1 = (4, 1) and A′1 = (4, 2) for the state X = (0, 0, 1, 1, 0, 0, 0, 0, 0, 0). . . . . . 39
3.3 An example of modifying three lines to single line. . . . . . . . . . . . . . . . . . 48
3.4 Modifying multiple line with two types fare classes. . . . . . . . . . . . . . . . . 49
4.1 Average revenue for each approximation method. . . . . . . . . . . . . . . . . . . 65

vii
List of Tables
2.1 Arrival rates, departure rates, and expected revenues of Sample 1. . . . . . . . . . 21
2.2 Optimal policies for p = 1 in periods n. . . . . . . . . . . . . . . . . . . . . . . . 22
2.3 The range in Theorem 2.9 for the states X and X . . . . . . . . . . . . . . . . . . . 23
2.4 The range and the difference for Sample 2. . . . . . . . . . . . . . . . . . . . . . . 23
2.5 The widths of the ranges for the samples. . . . . . . . . . . . . . . . . . . . . . . 24
3.1 Arrival rate and fare for p in n. . . . . . . . . . . . . . . . . . . . . . . . . . . . . 47
3.2 The maximum expected revenues Un(Xk) for n and k. . . . . . . . . . . . . . . . 47
3.3 The optimal policies for n and Xk. . . . . . . . . . . . . . . . . . . . . . . . . . . 47
3.4 Arrival rate and fare for p in n. . . . . . . . . . . . . . . . . . . . . . . . . . . . . 48

viii
List of Abbreviations
RM: revenue management
NRM: network revenue management
RRM: restaurant revenue management
SP: seats per person
SS: surplus seats
ExSS: expectation of the number of excess seats
CRM: customer relationship management
CDLP: choice-based deterministic linear programming
MNL: multinomial logit

1
Chapter 1
Introduction
There are many industries which have fixed capacity and large fixed cost. Examples of the
industries are airline, hotel, rental car and etc. Revenue Management (RM) is a field that is to manage
the decision-making process in the industries. There are many kinds of the decision-making in RM.
Talluri and van Ryzin [38] said that basic categories of demand-management decisions in RM are
structural decisions, price decisions and quantity decisions. (See 1.1.1 in [38] for detail.) Quantity
decision is to decide whether to accept or reject a request, given a structure and product prices. This
thesis focuses on this quantity decision.
There are a static model and a dynamic model for this quantity decision. The static model
is under an assumption which is that a request with lower fare class arrives earlier. We can see
generally static model and description about that in [38] and [2]. Koide and Ishii [25] presents the
static model with overbooking and cancellation for hotel industry.
On the other hand, the dynamic model is to find optimal policies under an assumption which is
that requests of customers with a variety of fare classes simultaneously arrive throughout booking
horizon. The optimal policy indicates that what product to sell to which customer in each pe-
riod. The dynamic model with seats of one type is named a single-leg model. Lee and Hersh [26]
suggested several single-leg models and its property such as monotonicity. They assume that re-
quests arrive according to Poisson process, and approximate it by discretizing a booking horizon.
Subramanian et al. [36] extended Lee and Hersh’s model by cancellation and overbooking. Also,
Subramanian et al. [36] indicated properties of their model and how to discretize the booking hori-
zon. El-Haber and El-Taha [11] extended the Subramanian et al.’s model to one with two types of

2
seats, which means they connected the model with Network Revenue Management (NRM).
NRM is able to manage multiple resources simultaneously. An example of a product in NRM
is tickets to depart to a destination via some transit points. Such a kind of the tickets are seen in
airlines or trains industries. In the trains industries, the transit points are stations. Multiple seats
among the transit points are reserved at the same time when the ticket is purchased. We can see a
summary of NRM in Chapter 3 of [38] and [5].
In our models, we considered a system with seats, such as a restaurant, theater or stadium.
Generally, states of a system in dynamic models are presented as remaining time to deadline (or
passed time from starting time to accept requests) and the number of remaining seats (or the number
of booked seats). Then, the number of remaining seats is focused in this paper. If there is one kind
of seats, then the state is commonly represented by natural number which includes zero. (In this
paper, Z+ stands for the set of the positive integral number throughout.) Three cases where three
seats are occupied in facilities with five seats are shown in Figure 1.
Figure 1.1. Three cases of a state.
Case 1, Case 2 and Case 3 in Figure 1 present the number of normal remaining seats, seats in
tables and seats placed on lines, respectively. Case 2 can be regarded as a restaurant or cafeteria.
Case 3 is seen in a theater or stadium. Then, it is not appropriate to treat the cases as one state.
In Case 2, a manager of the facility might not recognize to able to accept an arriving couple even
though two seats are not occupied. Also, in Case 3, a couple might not be willing to sit by separating
in a facility such as an opera or Kabuki. For Case 3, Talluri and van Ryzin [38] actually point out this
problem in p. 573. Hence, if we apply a general dynamic model to the seats with the physical feature
like Case2 or Case 3, then there is a problem which is how we capture actual decision-making.
This thesis focuses on seats with this spatial condition and suggests several models which are
included the physical features. Using this approach, we can find some relationships between revenue

3
and decision-making under the physical condition such as congestion or booking position that has
not ever been handled in RM.
In Chapter 2, an allocation problem for seats and tables system, which is related to Case 2,
is described. The problem has already been modeled in restaurant RM. However, the models are
difficult to reveal structural properties because they are too complex to analyze. This fact does not
allow to link models in restaurant RM to general models in RM. Thus, we assume some conditions
to simplify a model. From this way, some monotonicities of the model are obtained. From the
monotonicities, we can find out that differences among departure rates of parties cause to enlarge
variation of the optimal policies. Furthermore, the number of persons who are in the facility and the
number of excess seats for a party are taken into the model. Finally, the relation between the model
and customer relationship management is briefly mentioned.
In regard to seats placed on lines which depicted as Case 3 in Figure 1, Talluri and van Ryzin [38]
state that the case is difficult from bin-packing effects if groups arrive and sit together. However,
Their pointing out is intuitive because there is not a model with booking position in RM. Therefore,
we cannot incorporate a customer’s choice for a seating position to RM.
In Chapter 3, we suggests a simply model where a system allocates seats placed on a single
line to a party. The model is named single line seats model. It is described that allocating ends of a
vacant seats block to a party is an optimal policy if the party should be accept. This property leads to
a relationship between the single line seats model and a traditional model [26]. Finally, application
of the single line seats model is briefly described.
Chapter 4 then introduce a new model where a customer chooses a seating position by his/her
preference. The model is called choice-based seating position model in this thesis. The choice-
based seating position model is formulated by using an approach of single line seats model which
have been already mentioned in Chapter 3. The choice-based seating position model is used to
decide an offer set which is an available set of seating positions for an arriving customer. The prob-
lem is firstly modeled by dynamic programming. To find approximate solutions for the problem,
we apply Choice-based Deterministic Linear Programming (CDLP) method and decomposition ap-
proximation method to the choice-based seating position model. If choice behavior of all arriving
customers depends on Multinomial Logit (MNL) choice model, then we can efficiently search de-
cision space for the optimal offer set. Finally, offer sets computed by each approximation method

4
are estimated by numerical example.

5
List of Symbols for Chapter 2
P : set of arriving parties
I: set of tables
P : the number of different party sizes
I: the number of different table sizes
gp: party size for p ∈ P
ti: table size for i ∈ I
mi: the number of the table for i ∈ I
Pi: party set which is able to be allocated the table i ∈ I
Ip: table set which is able to be allocated to the party p ∈ P
N : size of time period
T0: set of time periods 0, 1, · · · , N
T1: set of time periods 1, · · · , N
Xi: state space for the table i ∈ I
Xn: state space for a facility
rnp : expected revenue for the party p ∈ P in n ∈ T0
λnp (X): arrival rate for the party p ∈ P and the stateX ∈ Xn in the period n ∈ T0, and λnp (X) > 0

6
qnip(X): departure rate for the party p ∈ Pi, i ∈ I , and the state X ∈ Xn in the period n ∈ T0
λn0 : probability of a null event in period n ∈ T0
χ: maximum of |Xn| for n ∈ T0
Un(X): maximum expected revenue from operating over periods n to 0 in a state X
∆ipUn(X): opportunity cost of accepting the party p ∈ P for the table i ∈ Ip in n;
∆ipUn(X) = Un(X)− Un(X + eip)
d: policy vector; d = (dp) where dp is a policy for p ∈ P
xi: the number of parties who sit in the table i ∈ I for submatrix xi of X ∈ Xn, n ∈ T0
f(X): the number of people in the state X ∈ Xn, n ∈ T0
SPp(X): average of the number of seats of the party p ∈ P for the state X ∈ Xn, n ∈ T0
SSp(X): the number of surplus seats of the party p ∈ P for the state X ∈ Xn, n ∈ T0
αnp : coefficient which converts comfort which the party p ∈ P obtains by an extra seat in n ∈ T1
into a price
Un(X): maximum expected revenue which includes αnp , p ∈ P, n ∈ T1
Pn(X): probability of being X ∈ Xn in n ∈ T0\N
Ωmin,Ωmax, and ΩSS : optimal policies for all time periods calculated by min-policy, max-policy,
and SS-policy, respectively
ExSS(Ω): expectation of the number of excess seats which is obtained by a optimal policies Ω
from n = N to n = 0

7
Chapter 2
Seats in Tables
2.1 Introduction
Traditional applications of the RM are airline, hotel and car rental industries. Researches, prob-
lems, traditional models, and a glossary of revenue management for airline can be found in McGill
and Ryzin [28]. Recently, for non-traditional industries, Chiang, Chen and Xu [10] reviewed recent
application and techniques of RM. One of the non-traditional industries which is applicable to the
theory of RM is restaurant industry. The revenue management for restaurant is called restaurant
revenue management (RRM). In this chapter, we consider this RRM. Two problems are known in
RRM. One of the problems is a table mix problem [21] which is used to decide an optimal structure
for tables in a restaurant. The another problem is a party mix problem [14] which is used to ob-
tain an optimal seating policy for arriving parties. There are not many researches which deal with
the seating policy. Bertsimas and Shioda [6] presented some models: an integer programming, a
stochastic programming, and an approximation dynamic programming model. Guerriero et al. [14]
suggested a dynamic programming model with no waiting line, reservation, and meal duration by
using the techniques of NRM.
These studies have focused on making models and algorithms for evaluating the expected total
revenue approximately.The reason is that it is difficult to exactly calculate the seating policy. The
difficulty is due largely to the curse of dimensionality.
Each restaurant has several kinds of tables, that is, the restaurant has several capacities. It is
known that a model in the NRM is more complex than a model with single-resources. A part
8
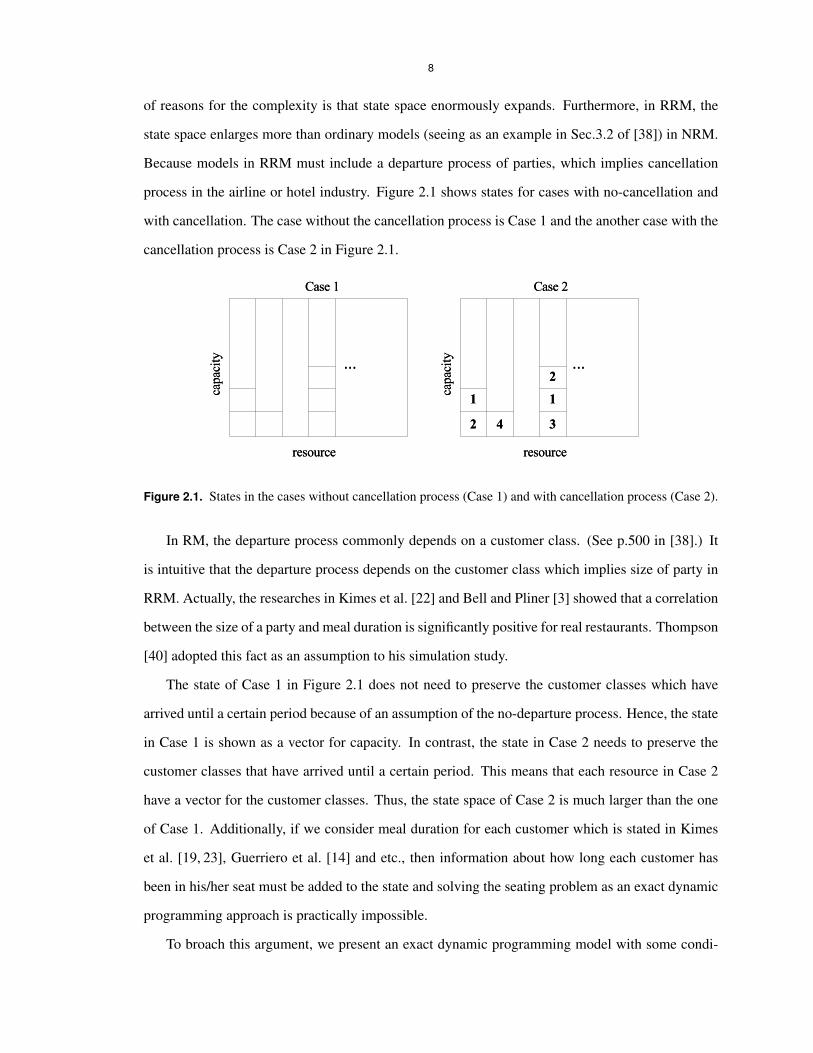
of reasons for the complexity is that state space enormously expands. Furthermore, in RRM, the
state space enlarges more than ordinary models (seeing as an example in Sec.3.2 of [38]) in NRM.
Because models in RRM must include a departure process of parties, which implies cancellation
process in the airline or hotel industry. Figure 2.1 shows states for cases with no-cancellation and
with cancellation. The case without the cancellation process is Case 1 and the another case with the
cancellation process is Case 2 in Figure 2.1.
Figure 2.1. States in the cases without cancellation process (Case 1) and with cancellation process (Case 2).
In RM, the departure process commonly depends on a customer class. (See p.500 in [38].) It
is intuitive that the departure process depends on the customer class which implies size of party in
RRM. Actually, the researches in Kimes et al. [22] and Bell and Pliner [3] showed that a correlation
between the size of a party and meal duration is significantly positive for real restaurants. Thompson
[40] adopted this fact as an assumption to his simulation study.
The state of Case 1 in Figure 2.1 does not need to preserve the customer classes which have
arrived until a certain period because of an assumption of the no-departure process. Hence, the state
in Case 1 is shown as a vector for capacity. In contrast, the state in Case 2 needs to preserve the
customer classes that have arrived until a certain period. This means that each resource in Case 2
have a vector for the customer classes. Thus, the state space of Case 2 is much larger than the one
of Case 1. Additionally, if we consider meal duration for each customer which is stated in Kimes
et al. [19, 23], Guerriero et al. [14] and etc., then information about how long each customer has
been in his/her seat must be added to the state and solving the seating problem as an exact dynamic
programming approach is practically impossible.
To broach this argument, we present an exact dynamic programming model with some condi-

9
tions for seating policies in this chapter.
2.2 Formulation
Consider a facility with tables such as a restaurant, cafeteria, etc. Parties arrive to the facility to
be served. If they are served there, they depart. The facility has several tables with various kinds of
size which means the number of chairs in a table. A system of the facility decides whether to accept
arriving parties or not. If the system accepts an arriving party, the system also decides which table to
allocate. The system cannot allocate a table to the party of which size is larger than one of the table.
The allocated party gives a benefit to the facility. The facility has opening hours. The system aims
to maximize the total revenue over the horizon by controlling for arriving parties. These conditions
are shown in Figure 2.2.
Figure 2.2. A facility with arriving parties, tables and decisions.
To simplify a model, some conditions are given to parties and tables. The conditions are that a
composition of the tables cannot be modified to suit the arriving parties, sizes of the parties cannot
be divided to suit the tables, and the sizes of the parties do not exceed a largest table size in the
facility. Further, tables of the same size and seats are not distinguished. Set P = 1, · · · , P and
I = 1, · · · , I. The notations about the party and the table are shown as
• P : the number of different party sizes,
• I: the number of different table sizes,

10
• gp: the party size for p ∈ P ,
• ti: the table size for i ∈ I ,
• mi: the number of the table for i ∈ I .
To simplify, we regard p ∈ P as a party with party size gp, and i ∈ I as a table with table size
ti, respectively. Throughout this chapter, assume that g1 < g2 < · · · < gP and t1 < t2 < · · · < tI .
In addition, it is indicated as
• Pi = p ∈ P : gp ≤ ti: the party set which is able to be allocated a table i ∈ I ,
• Ip = i ∈ I : gp ≤ ti: the table set which is able to be allocated to the party p ∈ P .
For a set S, let |S| be the number of elements of S. Set P i = |Pi| and Ip = |Ip|.
The opening horizon is sufficiently divided into the N periods n ∈ 1, · · · , N. Set
T0 = 0, 1, · · · , N and T1 = 1, · · · , N. One event of the customer’s arrival or departure occurs
in the period n. A period n = 0 corresponds to closing of the facility. Parties arrive according to
time-dependent Poisson process while the facility is opening. Subramanian et al. [36] explained for
this discretization method.
All of them are walk-in customers, without reservation. Departure process of the parties depends
on not their length of staying time, but the state of facility and the period. Notations about the state
space, the arrival and departure rate, and expected revenue are shown as
• Xi = xi = (xip) : xip ≥ 0, p ∈ Pi ;∑p x
ip ≤ mi : state space for a table i ∈ I where xip is
the number of parties who are sitting in a table i ∈ Ip,
• Xn = X = (x1| · · · |xI) : xi ∈ Xi, i ∈ I;∑i
∑p x
ip ≤ N − n : state space for a facility
with a submatrix xi in a period n ∈ T0,
• rnp : the expected revenue for a party p ∈ P in a period n ∈ T0,
• λnp (X): the arrival rate for a party p ∈ P and a state X ∈ Xn in a period n ∈ T0, where
λnp (X) > 0,
• qnip(X): the departure rate for a party p ∈ Pi where i ∈ I , and a state X ∈ Xn in a period
n ∈ T0,

11
• λn0 : a probability of a null event in period n ∈ T0.
Referring to p.15 in [34], we can obtain a maximum of |Xn| for n: χ = maxn|Xn| as
χ =I∏i=1
(mi + P iP i
). (2.1)
The (2.1) is helpful to roughly estimate size of state space for a facility. From the assumption
of the arrival and the departure process in a period n ∈ T0, the equation
P∑p=1
λnp (X) +∑p∈P
∑i∈Ip
qnip(X) + λn0 (X) = 1 (2.2)
is obtained.
For each n ∈ T0, let Un(X) be the maximum expected revenue from operating over periods n
to 0. Firstly, suppose the maximum expected revenue in a general form as follows.
Un(X) =P∑p=1
λnp (X)(
rnp −mini∈Ip
∆ipUn−1(X)
)++ Un−1(X)
+P∑p=1
∑i∈Ip
qnip(X)Un−1(X − eip)
+
1−P∑p=1
λnp (X)−P∑p=1
∑i∈Ip
qnip(X)
Un−1(X), (2.3)
X ∈ Xn, n ∈ T1,
where eip = (x1| · · · |xI) in which xip = 1 and otherwise 0, (a)+ = maxa, 0, and
∆ipUn(X) = Un(X) − Un(X + eip). Boundary conditions are that Un(X) = −∞ for
X /∈ Xn, n ∈ T0, andU0(X) = 0 forX ∈ X0. Let n ∈ T1. The mini∈Ip ∆ipUn(X) means a thresh-
old price for a party p ∈ Pi , such that the party p who arrives for the state X in n is acceptable if rnp
is not less than the threshold price mini∈Ip ∆ipUn(X) and not acceptable if rnp is less than the thresh-
old price mini∈Ip ∆ipUn(X) (See pp.31-32 in [38].). ∆i
pUn(X) is an opportunity cost of accepting
the party p for the table i ∈ Ip in n. Note that λn0 (X) = 1 −∑Pp=1 λ
np (X) −
∑Pp=1
∑i∈Ip q
nip(X)

12
from (2.2). The first term of the right hand in (2.3) indicates a expected value in a case where a
party arrives at a facility in a period n. If a p is accepted in the table i ∈ Ip, then a expected value
for the case is rnp −∆ipUn−1(X) in n. The second term indicates a expected value in a case where
a party sitting in a facility leaves in a period n. The third term is for a case where no event occurs
in a period n. From (2.3), an optimal policy is indicated as below.
Optimal policy: an optimal policy for a party p ∈ P and a state X ∈ Xn is that if
rnp − mini∈Ip ∆ipUn−1(X) ≥ 0, then a party p is accepted in a table arg mini∈Ip ∆i
pUn−1(X),
and if rnp −mini∈Ip ∆ipUn−1(X) < 0, then a party p is denied.
Then, some assumptions are supposed to simplify (2.3).
Assumption 2.1. λnp (X) = λnp for p ∈ P , n ∈ T0 and X ∈ Xn.
Assumption 2.2. qnip(X) = xipqnip for i ∈ I , p ∈ Pi, n ∈ T0 and X ∈ Xn.
Assumption 2.1 indicates that arrival rates do not depend on states, which means that congestion
level of a facility does not affect the arrival rates.
Assumption 2.2 indicates that a party p in a table i and a period n departs independently of other
parties sitting in other tables, which implies that parties do not memorize how long they are sitting
in a facility.
Under these assumptions, (2.3) can be rewritten as
Un(X) =P∑p=1
λnp
(rnp −min
i∈Ip∆ipUn−1(X)
)++ Un−1(X)
+P∑p=1
∑i∈Ip
xipqnipUn−1(X − eip)
+
1−P∑p=1
λnp −P∑p=1
∑i∈Ip
xipqnip
Un−1(X), (2.4)
X ∈ Xn, n ∈ T1.
Boundary conditions are that Un(X) = −∞ forX /∈ Xn, n ∈ T0, and U0(X) = 0 forX ∈ X0.
The first term, the second term, and the third term of (2.4) are called the arrival part, the departure

13
part, and the null part, respectively. (2.4) is close to a equation which is extended by cancellation
process for the model with upgrades which is suggested as (1) in Steinhardt and Gönsch [35].
However, state space of the model in Steinhardt and Gönsch [35] is different from the one which is
defined in this paper as previously shown in Figure 2.1. Note that the first term of (2.4) is a case
of the one of (1) in Steinhardt and Gönsch [35] because of physical bundles between parties and
tables, and the condition on which composition of the tables and size of the parties are fixed. For
proofs as following sections, policy vector d is defining.
For n ∈ T1 and X ∈ Xn, a policy vector d = (dp) is said to be acceptable if for any p ∈ P , the
following conditions (i) or (ii) holds.
(i) dp = 0.
(ii) dp ∈ Ip and X + edpp ∈ Xn−1.
Dn(X) is defined as
Dn(X) = d = (dp) : d is acceptable, n ∈ T1, X ∈ Xn.
2.3 Structural Properties
Supposing the Assumption 2.3 as below, a monotonicity which is similar to the monotonicity
suggested as Proposition 1 in Steinhardt and Gönsch [35] is obtained for ∆ipUn(X) in (2.4).
Assumption 2.3. qnδp = qnδ′p for p ∈ P with Ip ≥ 2, δ, δ′ ∈ Ip with δ = δ′, and n ∈ T0.
Lemma 2.4. Under Assumptions 2.1 to 2.3, for a given p ∈ P , n ∈ T0 and X ∈ Xn,
∆δpUn(X) ≤ ∆δ′
p Un(X) (2.5)
where δ, δ′ ∈ Ip, tδ < tδ′ ,∑p x
δp < mδ, and
∑p x
δ′p < mδ′ .
Proof: Un(X + eδp) ≥ Un(X + eδ′p ) should be indicated by induction for ∆δ
pUn(X) ≤ ∆δ′p Un(X).
For n = 0, it is obvious that U0(X + eδp) = U0(X + eδ′p ) = 0. Then, assume that
Un−1(X + eδp) ≥ Un−1(X + eδ′p ). In the following, we are indicating the orderings of each part.
Firstly, an order of the arrival part is indicated. The arrival part of (2.4) is rewritten using the

14
optimal vector as
maxd∈Dn(X)
∑p|dp =0
λnp (rnp + Un−1(X + edpp )) +∑
p|dp=0λnpUn−1(X)
.Let optimal policy vectors for Un(X + eδp) and Un(X + eδ
′p ) be d(δ)∗ and d(δ′)∗, respectively.
For a given p ∈ P , there are four cases for d(δ)∗p and d(δ′)∗
p as follows.
i) In the case d(δ)∗p = 0 and d
(δ′)∗p = 0, we should make a comparison between
rnp + Un−1(X + eδp + ed
(δ)∗pp ) and rnp + Un−1(X + eδ
′p + e
d(δ′)∗pp ) for the arrival parts of
Un(X + eδp) and Un(X + eδ′p ). Further, this case is divided into two cases for ordering between
d(δ)∗p and d(δ′)∗
p .
i-1) In the case d(δ)∗p ≤ d
(δ′)∗p , from the inductive hypothesis,
rnp + Un−1(X + eδp + ed
(δ)∗pp ) ≥ rnp + Un−1(X + eδ
′p + e
d(δ)∗pp ) ≥ rnp + Un−1(X + eδ
′p + e
d(δ′)∗pp ) is
obtained
i-2) In the case d(δ)∗p > d
(δ′)∗p , from the inductive hypothesis and num-
ber of capacities of tables, d(δ)∗p ≤ δ′ and d
(δ′)∗p = δ is obtained. Thus,
rnp + Un−1(X + eδp + ed
(δ)∗pp ) ≥ rnp + Un−1(X + eδ
′p + eδp) = rnp + Un−1(X + eδ
′p + e
d(δ′)∗pp ).
ii) In the case d(δ)∗p = 0 and d
(δ′)∗p = 0, we should make a comparison between Un−1(X + eδp)
and rnp + Un−1(X + eδ′p + e
d(δ′)∗pp ). From the inductive hypothesis and d
(δ)∗p = 0,
Un−1(X + eδp) ≥ rnp + Un−1(X + eδp + ed
(δ′)∗pp ) ≥ rnp + Un−1(X + eδ
′p + e
d(δ′)∗pp ).
iii) In the case d(δ)∗p = 0 and d
(δ′)∗p = 0, we should make a comparison between
rnp + Un−1(X + eδp + ed
(δ)∗pp ) and Un−1(X + eδ
′p ). From the inductive hypothesis and d(δ)∗
p = 0,
rnp + Un−1(X + eδp + ed
(δ)∗pp ) ≥ Un−1(X + eδp) ≥ Un−1(X + eδ
′p ).
iv) In the case d(δ)∗p = d
(δ′)∗p = 0, from the inductive hypothesis, It is obvious that
Un−1(X + eδp) ≥ Un−1(X + eδ′p ).
Next, we consider the departure parts. To simplify the notation, we set qnp = qnip, i ∈ Ip. For the
p, the departure parts of Un(X + eδp) and Un(X + eδ′p ) are
∑i∈Ip
(xip + eδip )qnpUn−1(X + eδp − eip) (2.6)

15
and
∑i∈Ip
(xip + eδ′ip )qnpUn−1(X + eδ
′p − eip), (2.7)
respectively, where ekip = 1 if i = k and otherwise ekip = 0. (2.6) and (2.7) can stand for
qnp
· · ·+ (xδp + 1)Un−1(X + eδp − eδp) + · · ·+ xδ
′p Un−1(X + eδp − eδ
′p ) + · · ·
= qnp
Un−1(X) + x1
pUn−1(X + eδp − e1p) + · · ·
(2.8)
and
qnp
· · ·+ xδpUn−1(X + eδ
′p − eδp) + · · ·+ (xδ′
p + 1)Un−1(X + eδ′p − eδ
′p ) + · · ·
= qnp
Un−1(X) + x1
pUn−1(X + eδ′p − e1
p) + · · ·, (2.9)
respectively. Therefore, from the inductive hypothesis,
∑i∈Ip
(xip + eδip )qnpUn−1(X + eδp − eip) ≥∑i∈Ip
(xip + eδ′ip )qnpUn−1(X + eδ
′p − eip)
is obtained.
Finally, we consider the null parts. For the p, the null parts of Un(X + eδp) and Un(X + eδ′p ) are
1− λnp −∑i∈Ip
(xip + eδip )qnp
Un−1(X + eδp) (2.10)
and
1− λnp −∑i∈Ip
(xip + eδ′ip )qnp
Un−1(X + eδ′p ), (2.11)
respectively. In these equations, the coefficients of the Un−1(X + eδp) and Un−1(X + eδ′p ) are the

16
same. Thus,
1− λnp −∑i∈Ip
(xip + eδp)qnp
Un−1(X + eδp) ≥
1− λnp −∑i∈Ip
(xip + eδ′p )qnp
Un−1(X + eδ′p )
is obtained from the inductive hypothesis.
From these ordering of the arrival parts, the departure parts, and the null parts of Un(X + eδp)
and Un(X + eδ′p ), the (2.5) is indicated.
Assumption 2.3 means that departure rate depends on only a period and a party size. For p ∈ P
and n ∈ T0, we denote qnip, i ∈ Ip as qnp . For this assumption, Kimes et al. [20] suggested that meal
duration which relates to the departure rate did not depend on position, configuration, and size of
tables while it depended on the size of a party. Robson and Kimes [31] reported that meal duration
of a party which sits in an oversize table is not different from the one of a party which sits in a
right-size table. Therefore, Assumption 2.3 can be considered as realistic one.
For n ∈ T0, i ∈ I and the submatrix xi of X ∈ Xn, set xi :=∑p x
ip. Furthermore, let X ∈ Xn
and X ∈ Xn be the states with submatrices xi and xi, respectively, where X = X and xi = xi for
i ∈ I . This assumption for X and X is used in the remainder of this section.
Claim 2.5 is obtained from Lemma 2.4.
Claim 2.5. Let d∗ = (d∗p) and d
∗ = (d∗p) be optimal policy vectors for the X and X , respectively.
For each p ∈ P , if d∗p = 0 and d∗
p = 0, then d∗p = d∗
p.
Proof: From d∗p = 0 and d∗
p = 0, arrival parts of Un(X) and Un(X) are
λnp (rnp + Un−1(X + ed∗p)) (2.12)
and
λnp (rnp + Un−1(X + ed∗p)), (2.13)
respectively. From xi = xi, the table sets which are able to be d∗p and d∗
p for p ∈ P are the same.
Then, d∗p = d∗
p is obtained.
Suppose an assumption for the ordering of departure process of parties p ∈ P , and a proposition
17
about a monotonicity of ∆ipUn(X) for p ∈ P as below.
Assumption 2.6. For n ∈ T0 and ψ,ψ′ ∈ P with ψ < ψ′, qnψ ≥ qnψ′ .
Proposition 2.7. Under Assumptions 2.1 to 2.6, for a given δ ∈ I with P δ ≥ 2, ψ,ψ′ ∈ Pδ with
ψ < ψ′ and n ∈ T0,
∆δψUn(X) ≤ ∆δ
ψ′Un(X). (2.14)
Proof: It is obtained by induction. Un(X + eδψ) ≥ Un(X + eδψ′) should be indicated for
∆δψUn(X) ≤ ∆δ
ψ′Un(X). In the case n = 0, U0(X + eδψ) = U0(X + eδψ′) is clear. Then,
assume that ∆δψUn−1(X) ≤ ∆δ
ψ′Un−1(X).
Firstly, we consider about the arrival parts. Let the optimal vectors for the states X + eδψ and
X + eδψ′ be d(ψ)∗and d(ψ′)∗
, respectively.
i) In the case d(ψ)∗p = 0 and d(ψ′)∗
p = 0, we make a comparison between rnp +Un−1(X+eδψ+ed
(ψ)∗pp )
and rnp + Un−1(X + eδψ′ + ed
(ψ′)∗pp ). The optimal vectors for the states X + eδψ and X + eδψ′
are d(ψ)∗p = d
(ψ′)∗p from Claim 1 because capacities of the states are the same. Hence,
rnp + Un−1(X + eδψ + ed
(ψ)∗pp ) ≥ rnp + Un−1(X + eδψ′ + e
d(ψ′)∗pp ) is indicated.
ii) In the case d(ψ)∗p = 0 and d
(ψ′)∗p = 0, we compare rnp + Un−1(X + eδψ + e
d(ψ)∗pp )
to Un−1(X + eδψ′). From the inductive hypothesis and d(ψ′)∗p = 0,
rnp + Un−1(X + eδψ + ed
(ψ)∗pp ) ≥ Un−1(X + eδψ) ≥ Un−1(X + eδψ′) is obtained.
iii) In the case d(ψ)∗p = 0 and d
(ψ′)∗p = 0, we make a comparison between Un−1(X + eδψ)
and rnp + Un−1(X + eδψ′ + ed
(ψ′)∗pp ). From the inductive hypothesis and d
(ψ)∗p = 0,
Un−1(X+eδψ) > rnp+Un−1(X+eδψ+ed
(ψ)∗pp ) ≥ rnp+Un−1(X+eδψ+e
d(ψ′)∗pp ) ≥ rnp+Un−1(X+eδψ′
+ed
(ψ′)∗pp ) is obtained.
iv) In the case d(ψ)∗p = 0 and d(ψ′)∗
p = 0, it is obvious.
Then, we consider the departure parts of Un(X + eδψ) and Un(X + eδψ′) which are
P∑p=1
∑i∈Ip
(xip + eδiψp)qnpUn−1(X + eδp − eip) (2.15)

18
and
P∑p=1
∑i∈Ip
(xip + eδiψ′p)qnpUn−1(X + eδ′p − eip), (2.16)
respectively, where ekilp = 1 if i = k and p = l, otherwise ekilp = 0.
We should consider only the cases p = ψ, i = σ and p = ψ′, i = δ for (2.15) and (2.16) as
· · ·+ qnψUn−1(X) + xδψqnψUn−1(X + eδψ − eδψ) + · · · (2.17)
· · ·+ xδψ′qnψ′Un−1(X + eδψ − eδψ′) + · · ·
and
· · ·+ xδψqnψUn−1(X + eδψ′ − eδψ) + · · · (2.18)
· · ·+ qnψ′Un−1(X) + xδψ′qnψ′Un−1(X + eδψ′ − eδψ′) + · · · .
From the inductive hypothesis and Assumption 2.6, it is indicated that
P∑p=1
∑i∈Ip
(xip + eδiψp)qnpUn−1(X + eδp − eip) ≥P∑p=1
∑i∈Ip
(xip + eδiψ′p)qnpUn−1(X + eδ′p − eip).
Finally, we consider the null parts. It is clear that coefficients of the null parts of Un(X + eδψ)
and Un(X + eδψ′) are the same.
From the ordering of the each part, we obtain that ∆δψUn(X) ≤ ∆δ
ψ′Un(X).
Assumption 2.6 means that a party stochastically stays longer than the smaller one. Assumption
2.6 is considered as realistic one as previously mentioned in section 2.1. Remark 2.8 for Proposition
2.7 is indicated as follows.
Remark 2.8. Note that the monotonicity of Proposition 2.7 does not depend on the expected revenue
rnp , which is same as Lemma 2.4. Seeing the proof for Proposition 2.7, we can recognize that
Assumption 2.6 is used only in the terms of Un−1(X) in (2.17) and (2.18). Further, the orderings
for the each part expect the the terms ofUn−1(X) in (2.17) and (2.18) is conditioned by the inductive
hypothesis and facts of the cases. Thus, the ordering of Proposition 2.7 is conditioned by only the

19
ordering of departure rates between the parties.
Thus, from Proposition 2.7 and its character, a difference between the maximal expected rev-
enues Un(X) and Un(X) stems from differences for departure rates among parties. If there are
differences for departure rates among parties, then they are affected by all factors; arrival rates, re-
wards, and etc. as a matter of course. However, if there are not the differences for departure rates
among parties, then there is not the difference between Un(X) and Un(X), nevertheless the parties
have difference parameters each other.
From the monotonicities which is indicated in this paper, a sufficient condition which is able to
reduce variations of optimal policies can be obtained. The sufficient condition is shown as Theorem
2.9. For a given party p ∈ P , set d∗p = mini ∈ Ip : mi −
∑k∈Pi x
ik > 0.
Theorem 2.9. If the condition
rnp /∈[min∆d
∗pp Un−1(X),∆d
∗pp Un−1(X),max∆d
∗pp Un−1(X),∆d
∗pp Un−1(X)
](2.19)
is satisfied for a given p ∈ P and n ∈ T1, then d∗p = d∗
p, where d∗ = (d∗p) and d
∗ = (d∗p) are the
optimal vectors for the states X and X , respectively.
Proof: i) In the case d∗p = 0 and d∗
p = 0, from Claim 2.5, d∗p = d∗
p.
ii) In the case d∗p = 0 and d∗
p = 0, from d∗p = 0, we obtain that
λnpUn−1(X) > maxdp|dp =0
λnp (rnp + Un−1(X + edpp ))
. (2.20)
In addition, (2.20) can be rewritten to
λnpUn−1(X) > λnp (rnp + Un−1(X + ed∗pp )) (2.21)
from the condition xi = xi. We also obtain that
λnpUn−1(X) ≤ λnp (rnp + Un−1(X + ed∗pp )) (2.22)

20
because of d∗p = 0. From (2.21) and (2.22), we indicate
∆d∗pp Un−1(X) ≤ rnp < ∆d∗
pp Un−1(X) (2.23)
as a condition for d∗p = 0 and d∗
p = 0.
iii) In the case d∗p = 0 and d∗
p = 0, calculating this case similar to the case ii), we can obtain
∆d∗pp Un−1(X) ≤ rnp < ∆d∗
pp Un−1(X) (2.24)
as a condition for d∗p = 0 and d∗
p = 0.
iv) In the case d∗p = 0 and d∗
p = 0, it is clear.
Then, the relation between d∗p and d∗
p in (2.23) and (2.24) is d∗p = d∗
p = d∗p due to xi = xi,
Lemma 2.4, and d∗p, d
∗p = 0. Therefore, if a range which does not include the ranges (2.23) and
(2.24):
rnp /∈[min∆d
∗pp Un−1(X),∆d
∗pp Un−1(X),max∆d
∗pp Un−1(X),∆d
∗pp Un−1(X)
](2.25)
is satisfied, then d∗p = d∗
p.
The remark of the Theorem 2.9 is below.
Remark 2.10. The range (2.19) indicates a sufficient condition which makes the same optimal pol-
icy for the state X and X . The width of the range |∆d∗pp Un−1(X) − ∆d
∗pp Un−1(X)| stands for
difficulty of reducing variety of the optimal policies. If the width becomes narrower, then it is more
difficult to insert the expected revenue rnp into the range and optimal policies go to depend on only
capacities for tables.
The width of the range |∆d∗pp Un−1(X) − ∆d
∗pp Un−1(X)| can be rewritten to
|Un−1(X) − Un−1(X) + Un−1(X + ed
∗pp ) − Un−1(X + e
d∗pp )| where Proposition 2.7 is ap-
plicable to Un−1(X)−Un−1(X) and Un−1(X+ed
∗pp )−Un−1(X+e
d∗pp ). If there are not differences
in departure rates among parties, then the width is effected by nothing because the width is zero,
regardless of existing differences in arrival rates or expected revenues among the parties. As a
consequence of this property, existing the differences in departure rates among parties is an only
trigger for expanding varieties of optimal policies.

21
2.4 Numerical Examples
In this section, we confirm the feature which is stated in Remark 2.10. Numerical examples are
computed using an equation which is applied Assumptions 2.1 to 2.6 to (2.4). Configurations for
tables and parties are which N = 20,P = 2, I = 2, g1 = 1, g2 = 2, t1 = 1, t2 = 2, m1 = 2,
and m2 = 2. From this parameter set, χ = 18 by using (2.1). Arrival rates, departure rates, and
expected revenues for each party p ∈ P and n ∈ T0 are shown in Table 2.1.
The parameters set in Table 2.1 is named Sample 1. Sample 1 has a single peak for the arrival
rates, departure rates, and expected revenues. The expected revenues in Sample 1 are set to increase
as they get closer to the peak time. Optimal policies for p = 1 which is computed from Sample 1
are shown in Table 2.2. The values in cells of Table 2.2 stand for policy vectors.
Seeing optimal policies for states (2|1,0) and (2|0,1), we can find that the optimal policies in
n = 16 and 17 are difference between the states; nevertheless capacities for the states are the same.
Let the states (2|1,0) and (2|0,1) be X and X , respectively. To confirm Theorem 2.9 for the states,
∆d∗1
1 Un−1(X) and ∆d∗1
1 Un−1(X) where d∗1 = 2, are shown in Table 2.3 which also includes the
expected revenue rn1 to make a comparison easily.
Table 2.1. Arrival rates, departure rates, and expected revenues of Sample 1.
Arrival Rate Departure Rate Reward
n λn1 λn2 qn1 qn2 rn1 rn2
0-5 .021 .014 .018 .014 3 6
6-7 .105 .070 .088 .070 4 8
8-11 .150 .100 .125 .100 5 10
12-13 .105 .070 .088 .070 4 8
14-20 .021 .014 .018 .014 3 6
r161 and r17
1 are put in the ranges between ∆d∗1
1 Un−1(X) and ∆d∗1
1 Un−1(X) for n = 16 and
n = 17. Then, for a case where there is not difference in departure rates between parties, we have
computed the range. Sample 2 is the case in which the departure rates for p = 2 become the same
as the ones for p = 1 for Sample 1. ∆d∗1
1 Un−1(X), ∆d∗1
1 Un−1(X), and the width of the range are
shown as Table 2.4.

22
Tabl
e2.
2.O
ptim
alpo
licie
sfo
rp=
1in
peri
odsn
.
n\X
2|0,
22|
2,0
2|0,
02|
1,1
2|0,
12|
1,0
0|0,
20|
2,0
0|0,
00|
1,1
0|0,
10|
1,0
1|0,
21|
2,0
1|0,
01|
1,1
1|0,
11|
1,0
0–
––
––
––
––
––
––
––
––
–
10
02
02
21
11
11
11
11
11
1
20
02
02
21
11
11
11
11
11
1
30
02
02
21
11
11
11
11
11
1
40
02
02
21
11
11
11
11
11
1
50
02
02
21
11
11
11
11
11
1
60
02
02
21
11
11
11
11
11
1
70
02
02
21
11
11
11
11
11
1
80
02
02
21
11
11
11
11
11
1
90
02
02
21
11
11
11
11
11
1
100
02
02
21
11
11
11
11
11
1
110
02
02
21
11
11
11
11
11
1
120
02
02
21
11
11
11
11
11
1
130
02
02
21
11
11
11
11
11
1
140
02
00
01
11
11
11
11
11
1
150
02
00
01
11
11
11
11
11
1
160
02
00
21
11
11
11
11
11
1
17–
–2
–0
21
11
11
11
11
11
1
18–
–2
––
–1
11
11
1–
–1
–1
1
19–
––
––
––
–1
–1
1–
–1
––
–
20–
––
––
––
–1
––
––
––
––
–

23
Table 2.3. The range in Theorem 2.9 for the states X and X .
n rn1 ∆d∗1
1 Un−1(X) ∆d∗1
1 Un−1(X)0 3 – –
1 3 0.000 0.000
2 3 0.147 0.147
3 3 0.282 0.282
4 3 0.405 0.406
5 3 0.518 0.521
6 4 0.622 0.626
7 4 1.348 1.360
8 5 1.785 1.814
9 5 2.551 2.601
10 5 2.932 3.006
11 5 3.174 3.262
12 4 3.337 3.434
13 4 3.172 3.272
14 3 3.095 3.193
15 3 3.040 3.140
16 3 2.989 3.090
17 3 2.941 3.043
Table 2.4. The range and the difference for Sample 2.
n ∆d∗1
1 Un−1(X) ∆d∗1
1 Un−1(X) Dif.
0 – – –
1 0.000 0.000 0.000
2 0.147 0.147 0.000
3 0.282 0.282 0.000
4 0.405 0.405 0.000
5 0.518 0.518 0.000
6 0.622 0.622 0.000
7 1.348 1.348 0.000
8 1.786 1.786 0.000
9 2.555 2.555 0.000
10 2.940 2.940 0.000
11 3.189 3.189 0.000
12 3.359 3.359 0.000
13 3.199 3.199 0.000
14 3.128 3.128 0.000
15 3.075 3.075 0.000
16 3.026 3.026 0.000
17 2.980 2.980 0.000
We can confirm that the width of (2.19) is zero since there is not difference in the departure rates

24
between the parties. Remember that there is difference in the arrival rates and the expected revenues
between the parties. Additionally, how the range has influence on the difference for departure rates
is indicated. Let additional datasets in where the departure rate for p = 2 is multiplied by 0.75, 0.5,
and 0.25 for Sample 1 be Sample 3, 4, and 5, respectively. The widths of the ranges for the states
X and X which are computed from Sample 1 to 5 are shown in Table 2.5. We can recognize that
the widths enlarge for all n if the differences for the departure rates enlarge. Thus, what increasing
difference for the departure rates enlarges the width of the range is suggested.
Table 2.5. The widths of the ranges for the samples.
n Sample2 Sample1 Sample3 Sample4 Sample5
1 0.000 0.000 0.000 0.000 0.000
2 0.000 0.000 0.000 0.000 0.000
3 0.000 0.001 0.001 0.002 0.002
4 0.000 0.001 0.003 0.004 0.006
5 0.000 0.003 0.005 0.008 0.011
6 0.000 0.004 0.008 0.013 0.017
7 0.000 0.013 0.025 0.038 0.052
8 0.000 0.029 0.058 0.088 0.119
9 0.000 0.050 0.101 0.154 0.209
10 0.000 0.074 0.150 0.229 0.310
11 0.000 0.088 0.180 0.275 0.374
12 0.000 0.097 0.198 0.302 0.410
13 0.000 0.101 0.204 0.311 0.421
14 0.000 0.098 0.199 0.302 0.407
15 0.000 0.100 0.202 0.306 0.411
16 0.000 0.101 0.204 0.308 0.411
17 0.000 0.101 0.204 0.308 0.410
2.5 Relation to Congestion
In RM for hospitality industry such as RRM, degree of consumed resources is expressed by
occupancy rate [16] which is an important management index. On the other hand, customers do not
apparently have the pleasure of the occupancy rate. In the case, the occupancy rate can be regarded
as congestion level from the customer’s eye.
Facilities with seats in table have several conditions, such as a waiting line, reconstructable
table and etc. A waiting line and reconstructable table are considered in [6] and [14], respectively.

25
However, congestion as a condition has not been focused on in the seating problem. In this section,
from a viewpoint of congestion, we discuss the model suggested in this chapter.
A facility of which a person can see a state of the inside actually exists. Then, we can consider
that a arriving rate of the person depends on a congestion level of the facility. The number of
customer in the facility is included in the model of this chapter since states of the model preserve
the number of each party. For each X ∈∪Nn=1Xn, we define
f(X) =P∑p=1
∑i∈Ip
gpxip,
which stands for the number of people on a state X , and f(X) is called the congestion level of X .
Using this f , we obtain the following Proposition 2.11 which is a generalization of Lemma 2.4.
Proposition 2.11. Let p ∈ P , n ∈ T0 and X ∈ Xn. Suppose that Assumption 2.2 and 2.3 are
satisfied, and that λ(X ′) ≥ λ(X ′′) for any X ′, X ′′ ∈ Xn with f(X ′) ≤ f(X ′′). In addition, let
δ, δ′ ∈ Ip with∑p x
δp < mδ, and
∑p x
δ′p < mδ′ . If tδ < tδ′ , then
∆δpUn(X) ≤ ∆δ′
p Un(X). (2.26)
Proof: From (2.4),
Un(X) =P∑p=1
λnp (fX)(
rnp −mini∈Ip
∆ipUn−1(X)
)++ Un−1(X)
+P∑p=1
∑i∈Ip
xipqnpUn−1(X − eip)
+
1−P∑p=1
λnp (fX)−P∑p=1
∑i∈Ip
xipqnp
Un−1(X), (2.27)
X ∈ Xn, n ∈ T1.
Boundary conditions are that Un(X) = −∞ for X /∈ Xn, n ∈ T0, and U0(X) = 0 for X ∈ X0.
Then, λnp (X + eδp) in Un(X + eδp) is equal to s λnp (X + eδ′p ) in Un(X + eδ
′p ). Therefore, (2.26) can
be proved similar to Lemma 2.4.
Allocating a party a table with larger size than the party size is called upgrade. Further, a

26
structure that the maximum expected revenue does not increase when the manager of the facility
upgrades is called the upgrade structure. Proposition 2.11 means that the upgrade structure is
held if Assumption 2.1 is removed and the arrival rate is non-increasing function in the number of
customers who are in the facility.
Consider a relationship between this upgrade structure and vacant seats. Upgrading an arriving
party is increasing the number of seats of the party, that is, upgrading leads to increasing the party’s
space. We have already had optimal policies from (2.3). Here we provide variation of this optimal
policies. For each p ∈ P , n ∈ T1 and X ∈ Xn, we propose
min I∗np(X) =i∗np(X), (2.28)
max I∗np(X) =i∗np(X) (2.29)
where I∗np(X) = arg mini∈Ip ∆i
pUn−1(X) An optimal policy which is produced by (2.28) is called
a min-policy. Similarly, an optimal policy which is produced by (2.29) is called a max-policy. For
these optimal policies, we can get the following Lemma 2.12 of the upgrade structure.
Lemma 2.12. Let n ∈ T0, p ∈ P , and δ, δ′ ∈ Ip with δ = δ′ and tδ < tδ′ . In addition, let X ∈ Xn
with∑p x
δp < mδ,
∑p x
δ′p < mδ′ . If a policy is the min-policy or max-policy, then
∆δpUn(X) ≤ ∆δ′
p Un(X).
Proof: Let d∗ = (d∗p) be the optimal policy vector which is given by (2.28). Similarly, let d
∗ = (d∗p)
be an optimal policy vector which is obtained by (2.29). We just show the case of applying d∗ since
it is clearly for the case of applying d∗ from Lemma 2.4. In the case of applying d∗, we should see
only the arrival parts because the departure and the null parts are the same as the ones of Lemma
2.4. Let d(δ)∗p and d(δ′)∗
p be d∗p for Un(X + eδp) and Un(X + eδ
′p ), respectively. In addition, let d(δ)∗
p
and d(δ′)∗p be d∗
p for Un(X + eδp) and Un(X + eδ′p ), respectively.
i) d(δ)∗p = 0, d(δ′)∗
p = 0:
i - 1) d(δ)∗p ≤ d(δ′)∗
p :
It is the same as the case d(δ)∗p ≤ d(δ′)∗
p .
i - 2) d(δ)∗p > d
(δ′)∗p :

27
We divide the case of min Ip into five cases.
i - 2 - 1) δ′ < min Ip:
From d(δ)∗p = d(δ′)∗
p , it follows that rnp +Un−1(X+ eδp+ ed
(δ)∗pp ) = rnp +Un−1(X+ eδp+ e
d(δ)∗pp )
= rnp +Un−1(X + eδp + ed
(δ′)∗pp ) = rnp +Un−1(X + eδp + e
d(δ′)∗pp ) ≥ rnp +Un−1(X + eδ
′p + e
d(δ′)∗pp ).
i - 2 - 2) δ′ = min Ip:
Comparing X + eδp and X + eδ′p , we have that δ′ = d(δ)∗
p and δ′ ≤ d(δ′)∗p . Hence,
rnp + Un−1(X + eδp + ed
(δ)∗pp ) = rnp + Un−1(X + eδp + e
d(δ)∗pp ) = rnp + Un−1(X + eδp + eδ
′p ) ≥
rnp + Un−1(X + eδ′p + e
d(δ′)∗pp ).
i - 2 - 3) δ < min Ip < δ′:
It is the same as i - 2 - 1).
i - 2 - 4) δ = min Ip:
In this case, d(δ)∗p ≤ δ′ and d(δ′)∗
p = δ. Hence,
rnp + Un−1(X + eδ′p + e
d(δ′)∗pp ) = rnp + Un−1(X + eδ
′p + e
d(δ′)∗pp ) = rnp + Un−1(X + eδ
′p + eδp)
≤ rnp + Un−1(X + eδp + ed
(δ)∗pp ) = rnp + Un−1(X + eδp + e
d(δ)∗pp ).
i - 2 - 5) δ > min Ip:
It is the same as i - 2 - 1).
For cases ii) d(δ)∗p = 0, d(δ′)∗
p = 0, iii) d(δ)∗p = 0, d(δ′)∗
p = 0,and iv) d(δ)∗p = d
(δ′)∗p = 0, it is the
same procedure as the case of dp.
Then, applying d∗, it follows that ∆δ
pUn(X) ≤ ∆δ′p Un(X).
From Lemma 2.12, Algorithm 1, which is similar to an algorithm suggested by Steinhardt and
Gönsch [35], and Algorithm 2 are presented.
Algorithm 1 An algorithm to calculate a min-policy.Input p, n and X ∈ Xn.Solve i∗ = mini|i ∈ Ip,
∑Pp=1 x
ip < mi.
if i∗ exists and rnp ≥ ∆i∗p Un−1(X), then
Accept the request of p to i∗.else
Deny the request of p.end if
It is obvious that a computational cost of Algorithm 2 is larger that the one of Algorithm 1.
Though we might consider that Algorithm 2 is useless, we can regard that Algorithm 2 upgrades as

28
Algorithm 2 An algorithm to calculate a max-policy.Input p, n and X ∈ Xn.tmp← 0Solve i∗ = mini|i ∈ Ip,
∑Pp=1 x
ip < mi.
if i∗exits and rnp ≥ ∆i∗p Un−1(X), then
tmp = i∗
while tmp+ 1 exits and ∆tmpp Un−1(X) = ∆tmp+1
p Un−1(X) dotmp = tmp+ 1
end whileAccept the request of pを to tmp = i
∗.else
Deny the request of p.end if
much as possible while preserving the expected revenue.
Then, we propose two indices SP (Seats per a person) and SS (Surplus Seats). For each p ∈ P
and X ∈∪Nn=0Xn, we define SPp(X) as
SPp(X) =
∑
i∈Ipxipti∑
i∈Ipxipgp
if∑i∈Ip x
ip = 0,
1 if∑i∈Ip x
ip = 0,
which stands for average of the number of seats of the party, and SSp(X) as
SSp(X) =∑i∈Ip
xip(ti − qp), (2.30)
which stands for the number of surplus seats of the party. Remark that SP and SS are considered in
an arriving point of a party.
For p ∈ P , i ∈ Ip and X∪Nn=1Xn, ∆i
pSP (X) = SPp(X + eip) − SPp(X) and
∆ipSS(X) = SSp(X+eip)−SSp(X) stand for deflections of SP and SS when a party p is accepted
to a table i in a state X , respectively. Theorem 2.13 and Theorem 2.14, which relate to ∆ipSP (X)
and ∆ipSS(X), respectively, are indicated following.
Theorem 2.13. Under all assumptions in Lemma Lemma 2.12, ∆δpSP (X) < ∆δ′
p SP (X).
Theorem 2.14. Under all assumptions in Lemma Lemma 2.12, ∆δpSS(X) < ∆δ′
p SS(X).
Proofs of these theorems are omitted because these are obvious from definitions of SS and SP.

29
Theorems 2.13 and 2.14 present trade-off relationships between SP or SS and the maximum
expected revenue.
Robson and Kimes [31] reported that a party given an oversize table felt more comfortable than
a right-size table. From this report, assume that it is true. Here, the maximum expected revenue on
which a facility focuses and comfort on which customers focus have a trade-off relationship.
Using SP as an index, comfort decreases contrary to intuition when a party is accepted because
the index SP takes an average. However, for SS, the problem dose not occur because the addition
of the number of seats is only implemented. Therefore, we use only SS as an index for the number
of seats which parties have.
From a viewpoint of customer’s comfort, Algorithm 2 is better than Algorithm 1. In addition,
consider a policy with ∆ipSS(X) for n ∈ T1, n ∈ Xn, p ∈ P and i ∈ Ip. Let αnp be coefficients
which convert comfort which a party p ∈ P obtains by an extra seat in n ∈ T1 into a price. For
each n ∈ T0 and X ∈ Xn, we propose Un(X) as maximum expected revenue which includes
αnp , p ∈ P, n ∈ T1. Un(X) are defined as follows.
Un(X) =P∑p=1
λnp
(maxi∈Ip
(rnp + αnp∆i
pSS(X)−∆ipUn−1(X)
))++ Un−1(X)
+P∑p=1
∑i∈Ip
xipqnp Un−1(X − eip)
+
1−P∑p=1
λnp −P∑p=1
∑i∈Ip
xipqnp
Un−1(X), (2.31)
X ∈ Xn, n ∈ T1.
Boundary conditions are that Un(X) = −∞ for X /∈ Xn, n ∈ T0, and U0(X) = 0 for X ∈ X0.
Optimal policies of (2.31) are named SS-policy. The SS-policy is indicated as below.
SS-policy: An optimal policy for a party p ∈ P and a state X ∈ Xn in time
n ∈ T1 is to accept to allocate arg maxi∈Ip(rnp + αnp∆i
pSS(X) − ∆ipUn−1(X)) to the
party p if maxi∈Ip(rnp + αnp∆ipSS(X) − ∆i
pUn−1(X)) ≥ 0, or to deny to do so if
maxi∈Ip(rnp + αnp∆ipSS(X)−∆i
pUn−1(X)) < 0.
Let Pn(X) be a probability of being on a state X ∈ Xn in n ∈ T0, where Pn(0) = 1,

30
0 = (0, · · · , 0| · · · |0, · · · , 0) and Pn(X) = 0, n /∈ T0orX /∈∪Nn=0Xn. Here, a policy vec-
tor for a state X ∈ Xn and time n ∈ T1 presents dn = (dnp ) ∈ Dn(X). To simply, let
dnδψ = (dnδψp) ∈ Dn(X − eδψ) for n ∈ T1, X ∈ Xn, ψ ∈ P and δ ∈ Iψ. Then, we can de-
note Pn(X) as a recessive form;
Pn(X) = Pn+1(X)
∑
p|dn+1p =0
λn+1p + (1−
P∑p=1
λn+1p −
P∑p=1
∑i∈Ip
xipqip)
+
P∑p=1
∑i∈Ip
V nip(X)
+P∑p=1
∑i∈Ip
(xip + 1)qipPn+1(X + eip)
for n ∈ T0\N,X ∈ Xn, where V nip(X) indicates as
V nip(X) =
λn+1p Pn+1(X − eip) ifX − eip ∈ Xn+1, d
n+1ipp = i,
0 otherwise.(2.32)
Using this Pn(X), the expectation of the number of excess seats is represented as below.
Expectation of the number of excess seats in time n ∈ T0 (ExSS) :
∑X∈Xn
Pn(X)P∑p=1
∑i∈Ip
xip(ti − gp).
This ExSS is helpful to estimate degree of congestion which a policy generates in n ∈ T0.
2.5.1 Numerical Examples
We observe revenue and congestion which αnp affect by computing ExSS from some
policies; the min-policy, the max-policy and the SS-policy. Expected congestion level and
ExSS can be obtained optimal policies throughout all n ∈ T0 and X ∈ Xn. Then, let
dn(X) = (dp) ∈ Dn(X), n ∈ T1, X ∈ Xn. In addition, Set d∗n(X) as optimal ones for n ∈ T1
and X ∈ Xn, and d∗n = (d∗
n(X))X∈Xn , n ∈ T1. Let optimal policies for all time period, states, and
arriving parties be Ω = (d∗N ,d
∗N−1, · · · ,d∗
1). At this Ω, let Ωmin, Ωmax and ΩSS be Ω calculated

31
by the min-policy, the max-policy and the SS-policy, respectively. In addition, let ExSS(Ω) be
ExSS which is obtained by a policy Ω from n = N to n = 0.
Input data is as follows. N = 100. Configuration of parties and tables are
P = 4, I = 4, g1 = 1, g2 = 2, g3 = 3, g4 = 4, t1 = 1, t2 = 2, t3 = 3, t4 = 4 ,m1 = 2,m2 = 2
,m3 = 3 and m4 = 4. The arrival rate, departure rate and revenue for each time
n ∈ T0 are shown in Figure 2.3, Figure 2.4 and Figure 2.5, respectively. Further,
αn1 = 2, αn2 = 4, αn3 = 6, αn4 = 8, n ∈ T0.
Figure 2.3. Arrival rate.
Figure 2.4. Departure rate.
Figure 2.6 presents ExSS for each time n which is computed from the min-policy, the max-
policy, and the SS-policy. The policies are obtained from the input data.
Getting closer to n = 0, ExSS(ΩSS) increases more than ExSS(Ωmin) and ExSS(Ωmax)
from effect of αnp . ExSS(Ωmin) is similar to ExSS(Ωmax) without at near closing time. The
reason for this is what arriving requests do not occur after closing time. It is intuitive that difference
between ExSS of the min-policy and the max-policy is generated at only near closing time even
though the maximum revenues obtained by these policies are the same.
Then, consider revenue which includes SS. LetX0 = (0|0, 0|0, 0, 0|0, 0, 0, 0) be the initial state.

32
Figure 2.5. Revenue.
Figure 2.6. ExSS for max-policy and SS-policy.
ForX0, letExRev(Ωmin) andExRev(Ωmax) be the included revenue from n = N to n = 0 using
policies Ωmin and Ωmax, respectively. In the following Figure 2.7, Un(X0) and ExRev(Ωmin) for
each n ∈ T0 are shown, where ExRev(Ωmax) is not presented because it is almost the same as
ExRev(Ωmin).
Seeing Figure 2.7, we can find that ExRev(Ωmin) decreases more than Un(X0) on n ∈ T0. It
means that the min-policy sacrifices a lot of customers’ comfort if The number of customers’ seats
and customers’ comfort have positive correlation.
2.6 Relation to Other Models and Current RM’s Problems
αnp , p ∈ P, n ∈ T0 introduced in the previous section are apparently seen as additional revenue
that the facility can obtain later, or values of estimate for customers’ comfort that the facility want
to give for the customers. However, it is actually difficult to estimate αnp , p ∈ P, n ∈ T0.

33
Figure 2.7. Expected total revenue.
Arriving parties are segmented by only their sizes in this model. It may be better to consider
relationships a facility and the customers, additionally. The examples of the customer with the
relationships are walk-in customer or regular customer. It means that the model imports Customer
Relationship Management (CRM). This necessity of integration between RM and CRM is reported
as RM’s challenge in [41].
Then, we state about the model from a viewpoint of the additional revenue, in other words, long-
term revenue. In RM, decision-making with short-term revenue and long-term revenue have been
dealt with by Klein and Kolb [24]. They proposed a model with arriving customers who change
their behavior by a facility’s decision. However, we know that it is difficult to apply this approach
to the dynamic model in this chapter because of enlargement of computational cost.
2.7 Conclution
In this chapter, we introduced a dynamic model with seats in tables and its structural properties.
Further, we mentioned to take congestion level or surplus seat in the model.
Theorem 2.9 indicates that differences of departure rate among parties cause to increase the
variations of optimal policies, that is, increase requisite data capacity for optimal policies of each
party and time period. If the parameters set is that P = 4, I = 2, gp = p, t1 = 2, t2 = 4, m1 = 6,
and m2 = 7 where p ∈ P , then χ = 9240 in (2.1). However, if there is not difference in departure
rates for the case, the maximum of the variations of the optimal policies is reduced to 56.
As for adopting congestion level and reward for upgrade, it leads to have variation of optimal
policies; min-policy, max-policy and SS-policy. Applying the min-policy or max-policy, we can use

34
upgrade structure in this model. Further, it is held in the case where more congested makes lower
arriving rates of parties.

35
List of Symbols for Chapter 3
P : set of size of arriving parties
P : the largest size in P
C: the number of resources
C: set of the resources; C = 1, · · · , C
N : size of time period
T0: set of time periods 0, 1, · · · , N
T1: set of time periods 1, · · · , N
rnp : fare of a request p ∈ P in n ∈ T1
λnp (X): arrival rate of the party p ∈ P in n ∈ T1
λn0 : rate of no-event in n ∈ T1
Xn: state space in n ∈ T0
(a, b) ∈ Ap(X): policy space for the request p ∈ P, n ∈ T1 and X ∈ Xn where a and b are a size
of segment and an index of the segment a, respectively
Un(X): maximum expected revenue from operating over periods n to 0 in the state X ∈ Xn
G: set of fare classes
J : set of kinds of arriving requests; J = P ×G
Un(X): maximum expected revenue with multi-fare classes

36
d ∈ Ap(X): policy space for the request p ∈ P, n ∈ T1 and X ∈ Xn where d is a size of segment
∆dpUn(X): opportunity cost of accepting the party p ∈ P for the segment d;
∆dpUn(X) = Un(X)− Un(X + ed−p − ed)

37
Chapter 3
Single Line Seats Model
3.1 Introduction
When we book a seat on a plane or bullet train, we can often choose seat location. However, the
assignment of seat location is more important if a facility is a theater or a stadium. These facilities
are shown as applications of revenue management in Kimes and Wirtz [23].
In this chapter, consider a dynamic model with seats placed on lines, such as a sushi bar (bar
counter), theater, or stadium. Then, the model is taken account of seating position. However, if
we identify all positions, then the number of elements of the state space is 2H , where H means
the number of seats, and the computation is actually impossible. Hence, we reduce the state space
and decision space by utilizing an approach of formulation for a pyramid game in [18]. Then, we
consider a simple case in which the number of line is one. A model which deals with this case is
called the single line seats model.
3.2 Formulation for Single Line Seats Model
Batch request p ∈ P = 1, · · · , P arrives for booking resources which are placed on a single
line during the booking horizon, where request p has a request demanding p resources. The re-
sources can be regarded as seats at a counter in a restaurant, a part of seats on a plane or bullet train
or a part of seats in a theater or stadium. LetC be the number of the resources. SetC = 1, · · · , C.
Suppose that the batch requests cannot be separated and need adjacent available resources which
38
are equal in size when the resources are allocated to the request. Let the booking horizon be suf-
ficiently discreted into N time periods so that no more than one request arrives in each period
n ∈ 1, · · · , N. The time period progresses from N to 1, and 0 is terminal time on the booking
horizon. Suppose that there is a single fare class. (A case for multi fare class is mentioned in the
next section.) Let T0 and T1 be 0, · · · , N and 1, · · · , N, respectively. The fare depends on the
size of the request and the time period. Let rnp be a fare of the request p ∈ P in time period n ∈ T1.
Arrival rates of the requests also depend on the size of requests and the time period. Let λnp be an
arrival rate of the request p ∈ P in time period n ∈ T1. We set λn0 = 1−∑p∈P λ
np , and λn0 stands
for rate of no-event in n ∈ T1. Cancellation, overbooking and walk-in are ignored. To simplify
the state of the resources, we do not distinguish between left and right side of the resources’ state.
Further, if we identify every position on the resources, then it is irrelevant because of generating
various states to which the same requests can be accepted. However, this redundancy of the states
can be removed, as shown next. Let a1, a2, · · · , aC be states of resources with size C where ak = 1
if the resource is booked and ak = 0 if the resource is unbooked, a0 = 1 and aC+1 = 1. When
there are ak, ak+1, · · · , al(1 ≤ k ≤ l ≤ C) and ak−1 = 1, ak = ak+1 = · · · = al = 0, al+1 = 1,
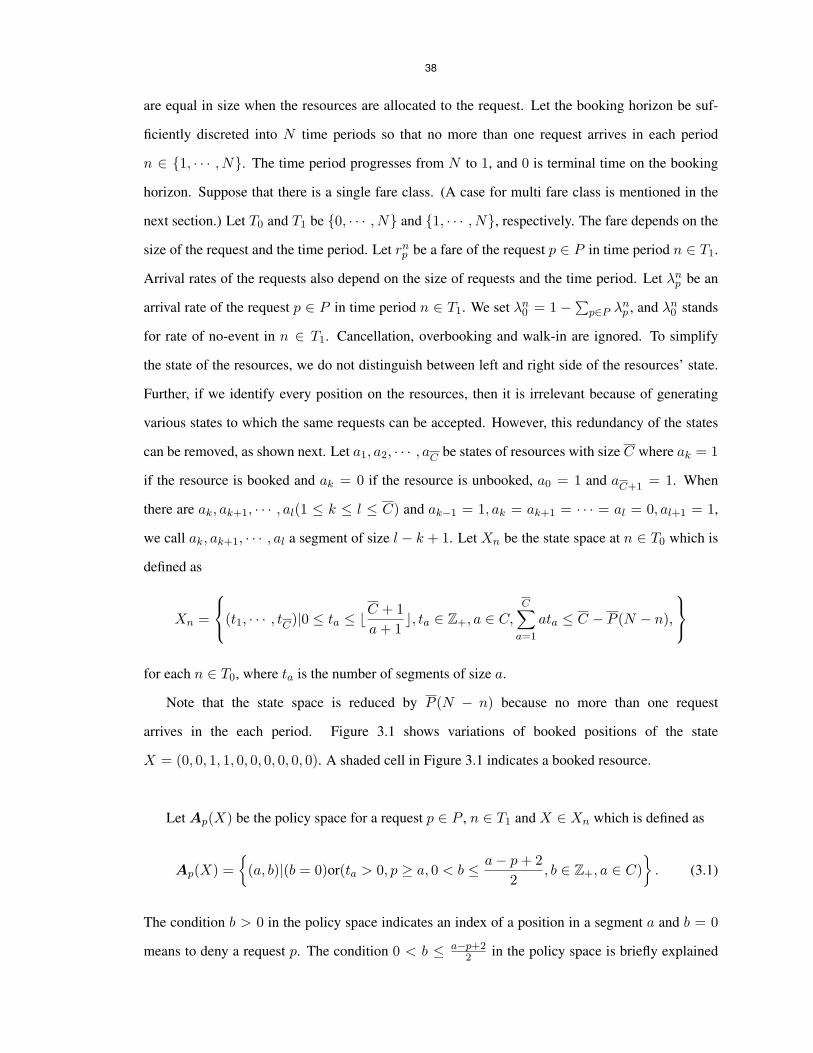
we call ak, ak+1, · · · , al a segment of size l − k + 1. Let Xn be the state space at n ∈ T0 which is
defined as
Xn =
(t1, · · · , tC)|0 ≤ ta ≤ ⌊C + 1a+ 1
⌋, ta ∈ Z+, a ∈ C,C∑a=1
ata ≤ C − P (N − n),
for each n ∈ T0, where ta is the number of segments of size a.
Note that the state space is reduced by P (N − n) because no more than one request
arrives in the each period. Figure 3.1 shows variations of booked positions of the state
X = (0, 0, 1, 1, 0, 0, 0, 0, 0, 0). A shaded cell in Figure 3.1 indicates a booked resource.
Let Ap(X) be the policy space for a request p ∈ P , n ∈ T1 and X ∈ Xn which is defined as
Ap(X) =
(a, b)|(b = 0)or(ta > 0, p ≥ a, 0 < b ≤ a− p+ 22
, b ∈ Z+, a ∈ C). (3.1)
The condition b > 0 in the policy space indicates an index of a position in a segment a and b = 0
means to deny a request p. The condition 0 < b ≤ a−p+22 in the policy space is briefly explained

39
Figure 3.1. Variations of the state X = (0, 0, 1, 1, 0, 0, 0, 0, 0, 0).
as follows. We can easily recognize 0 < b < a2 + 1 because the right side and the left side of
the resources are indistinguishable. If Ap = (a, b), b > 0, then the range of index of the booked
resources is from b to b + p − 1 and a relational expression b + p − 1 ≤ a − b + 1 is established
where a− b+ 1 is an inverted edge of b.
Figure 3.2 shows policies on which a request p = 1 is accepted to a = 4 for a state
X = (0, 0, 1, 1, 0, 0, 0, 0, 0, 0). As shown in Figure 3.2, we can confirm that the state can be modi-
fied if the policy is changed.
Figure 3.2. A1 = (4, 1) and A′1 = (4, 2) for the state X = (0, 0, 1, 1, 0, 0, 0, 0, 0, 0).
Let Un(X) be maximum expected revenue which a facility with the resources on initial state
X ∈ Xn can be obtained from optimally operating over the period n to 0. Un(X) are shown as
following equation:
Un(X) =∑p∈P
λnp max(a,b)∈Ap(X)
∑b|b=0
(rnp + Un−1(X + eb−1 + ea−(p+b−1) − ea)) +∑b|b=0
Un−1(X)
+ λn0Un−1(X),
X ∈ Xn, n ∈ T1 (3.2)

40
where ei = (ei1, · · · , eiC), i ∈ 0 ∪ C, eix = 1 if x = i and 1 ≤ i ≤ C, eix = 0 if x = i and
1 ≤ i ≤ C, and e01 = e0
2 = · · · = e0C
= 0. Boundary conditions for (3.2) are Un(X) = −∞,
X /∈ Xn and U0(X) = 0.
3.3 Properties of Single Line Seats Model
It is difficult to find optimal policies and the maximum expected revenue Un(X) because a size
of the policy space enlarges exponentially. However, we can reduce the search range of the policy
space by using the following Proposition 3.1.
Proposition 3.1. Given a request p ∈ P and X ∈ Xn for n ∈ T1, if there exists a policy
Ap = (a, b) ∈ Ap(X) such that b ≥ 1, then
max(a,b)∈Ap(X)
∑b|b=0
(rnp + Un−1(X + eb−1 + ea−(p+b−1) − ea)
)= max
(a,1)∈Ap(X)
(rnp + Un−1(X + ea−p − ea)
). (3.3)
Proof: Given a request p′ ∈ P and X ∈ Xn for n ∈ T0\N , for Proposition 3.1, it should be shown
that if there exists a policy (a, b) ∈ Ap′(X) such that b ≥ 1, then
Un(X + eψ−1 + eδ−(p′+ψ−1) − eδ) ≤ Un(X + eδ−p′ − eδ)
for any (ψ, δ) ∈ Ap′(X) by the inductive method. For the case n = 0, it is obvious that
U0(X+eψ−1 +eδ−(p′+ψ−1)−eδ) = U0(X+eδ−p′−eδ) = 0 from the boundary conditions. Then,
assume that Un−1(X + eψ−1 + eδ−(p′+ψ−1) − eδ) ≤ Un−1(X + eδ−p′ − eδ), (ψ, δ) ∈ Ap′(X).
Fix any (ψ, δ) ∈ Ap′(X). To simplify notation, set X(ψ) = X + eψ−1 + eδ−(p′+ψ−1) − eδ and
X(1) = X + eδ−p′ − eδ. It can be shown easily that
Un(X(ψ)) =∑p∈P
λnp max(a(ψ),b(ψ))∈Ap(X(ψ))
∑b(ψ)|b(ψ) =0
(rnp + Un−1(X(ψ) + ea(ψ)−p − ea(ψ)))
+∑
b(ψ)|b(ψ)=0
Un−1(X(ψ))
+ λn0Un−1(X(ψ))

41
and
Un(X(1)) =∑p∈P
λnp max(a(1),b(1))∈Ap(X(1))
∑b(1)|b(1) =0
(rnp + Un−1(X(1) + ea(1)−p − ea(1)))
+∑
b(1)|b(1)=0
Un−1(X(1))
+ λn0Un−1(X(1)).
Let A∗p(X(ψ)) = (a(ψ)∗, b(ψ)∗) be an optimal policy for a request p ∈ P and X(ψ). Likewise, let
A∗p(X(1)) = (a(1)∗, b(1)∗) be an optimal policy for a request p ∈ P and X(1).
i) b(ψ)∗ = 0, b(1)∗ = 0:
We should make a comparison between Un−1(X+eψ−1+eδ−(p′+ψ−1)−eδ+ea(ψ)∗−p−ea(ψ)∗)
and Un−1(X+eδ−p′−eδ+ea(1)∗−p−ea(1)∗). Furthermore, this case is divided in two cases because
the case X(ψ) + ea(ψ)∗−p − ea(ψ)∗ /∈ Xn−1 exists if ψ − 1 and δ − (p′ + ψ − 1) are changed in the
case: a(ψ)∗ = ψ − 1 ∨ a(ψ)∗ = δ − (p′ + ψ − 1).
i-1) a(ψ)∗ = ψ − 1, a(ψ)∗ = δ − (p′ + ψ − 1):
From the condition of this case and the inductive hypothesis, Un−1(X + eψ−1 + eδ−(p′+ψ−1)
−eδ+ea(ψ)∗−p−ea(ψ)∗) ≤ Un−1(X+eδ−p′−eδ+ea(ψ)∗−p−ea(ψ)∗) ≤ Un−1(X+eδ−p′−eδ+ea(1)−p
−ea(1)).
i-2) a(ψ)∗ = ψ − 1 or a(ψ)∗ = δ − (p′ + ψ − 1):
Un−1(X + eψ−1 + eδ−(p′+ψ−1) − eδ + ea(ψ)∗−p − ea(ψ)∗)∣∣∣a(ψ)∗=ψ−1 or a(ψ)∗=δ−(p′+ψ−1)
≤ Un−1(X+eδ−p′−gp−eδ) = Un−1(X+eδ−p′−eδ+eδ−p′−gp−eδ−p′) ≤ Un−1(X+eδ−p′−eδ+
ea(1)∗−gp − ea(1)∗).
Therefore, Un(X(ψ)) ≤ Un(X(1)) is obtained in the case i) from i-1) and i-2).
ii) b(ψ)∗ = 0, b(1)∗ = 0:
We should make a comparison between Un−1(X + eψ−1 + eδ−(p′+ψ−1) − eδ)
and rnp + Un−1(X + eδ−p′ − eδ + ea(1)∗−p − ea(1)∗). From the fact b(1)∗ = 0,
rnp+Un−1(X+eδ−p′−eδ+ea(1)∗−p−ea(1)∗) ≥ Un−1(X+eδ−p′−eδ) ≥ Un−1(X+eψ−1+eδ−(p′+ψ−1)
− eδ). Therefore, Un(X(ψ)) ≤ Un(X(1)) is obtained in this case ii).
iii) b(ψ)∗ = 0, b(1)∗ = 0:
We should compare rnp + Un−1(X + eψ−1 + eδ−(p′+ψ−1) − eδ + ea(ψ)∗−p − ea(ψ)∗) with
Un−1(X + eδ−p′ − eδ). This case is divided in two cases from a reason which is the same as the
42
one in the case i).
iii-1) a(ψ) = ψ − 1, a(ψ) = δ − (p′ + ψ − 1):
rnp+Un−1(X+eψ−1+eδ−(p′+ψ−1)−eδ+ea(ψ)∗−p−ea(ψ)∗) ≤ rnp+Un−1(X+eδ−p′−eδ+ea(ψ)∗−p
− ea(ψ)∗) ≤ Un−1(X + eδ−p′ − eδ) is obtained.
iii-2) a(ψ) = ψ − 1ora(ψ) = δ − (p′ + ψ − 1):
rnp + Un−1(X + eψ−1 + eδ−(p′+ψ−1) − eδ + ea(ψ)∗−p − ea(ψ)∗)∣∣∣a(ψ)∗=ψ−1 or a(ψ)∗=δ−(p′+ψ−1)
≤ rnp+Un−1(X+eδ−p′−gp−eδ) = Un−1(X+eδ−p′−eδ+eδ−p′−gp−eδ−p′) ≤ Un−1(X+eδ−p′−eδ).
Therefore, Un(X(ψ)) ≤ Un(X(1)) is obtained in the case iii) from the cases iii-1) and iii-2).
iv) b(ψ)∗ = 0, b(1)∗ = 0:
Un(X(ψ)) ≤ Un(X(1)) is easily obtained from the inductive hypothesis.
Consequently, Proposition 3.1 is proofed from the cases: i) - vi).
Note that Proposition 3.1 does not related to fares rnp . This fact shows that Proposition 3.1 is
achieved in any orderings of the fares rnp among requests p ∈ P . Further, this is important for
multi-fare classes case which is mentioned below.
We additionally show maximum expected revenue for a case with multi-fare classes. Let
G = 1, · · · , G be a set of fare class. Set J = P × G as kinds of arriving request. In this
multi-fare class case, the state space does not need to be changed from the one of the case of single
fare class. At its decision space, its definition does not be changed because only an arriving party’s
size relates to consumption for seats. Thus, maximum expected revenue with multi-fare class is the
following equation.
Un(X) =∑
(p,g)∈Jλn(p,g) max
(a,b)∈Ap(X)
∑b|b=0
(rn(p,g) + Un−1(X + eb−1 + ea−(p−b−1) − ea))
+∑b|b=0
Un−1(X)
+ λn0 Un−1(X)
, X ∈ Xn, n ∈ T1. (3.4)
Boundary conditions for (3.4) are Un(X) = −∞, X /∈ Xn and U0(X) = 0 A similar property to
Proposition 3.1 is obtained in (3.4).
Proposition 3.2. Given a request (p, g) ∈ J and X ∈ Xn for n ∈ T1, if there exists a policy

43
Ap = (a, b) ∈ Ap(X) such that b ≥ 1, then
max(a,b)∈Ap(X)
∑b|b =0
(rn(p,g) + Un−1(X + eb−1 + ea−(p+b−1) − ea)
)= max
(a,1)∈Ap(X)
(rn(p,g) + Un−1(X + ea−p − ea)
). (3.5)
Proof: Procedure for this proof is the same as Proposition 3.1’s one.
Proposition 3.1 and Proposition 3.2 also indicate that we should deal with only
(a, b) ∈ Ap(X), b = 1 or b = 0 for a request p (or (p, g)) and state X ∈ Xn to solve the maximum
expected revenue. This leads to a remarkable fact for the case XN = eC which is that all re-
sources are not occupied with requests at the beginning of the booking horizon. Details of this fact
are explained in the following Remark 3.3.
Remark 3.3. Let X ∈ Xn, n ∈ T0 be the set of states which are obtained when the maximum
expected revenue is solved in the case XN = eC. From Proposition 3.2 and the condition of XN ,
Xn = ex|0 ≤ x ≤ C − P (N − n), n ∈ T0. The x can be regarded as the number of unbooked
resources. Set Vn(x) = Un(ex) and A′p(x) = b|(x ≥ p, b = 1) or b = 0, x ∈ 0 ∪ C. Then, it
follows that
Vn(x) =∑
(p,g)∈Jλn(p,g) max
rn(p,g) + Vn−1(x− p), Vn−1(x)
+ λn0 Vn−1(x),
0 ≤ x ≤ C, n ∈ T1. (3.6)
Boundary conditions are V0(x) = 0 and Vn(x) = −∞, x < 0.
(3.6) can be regarded as a single-leg model with multiple booking class and multiple seat book-
ing in [26]. This fact indicates that the maximum expected revenue and the optimal policy which
is obtained by the single-leg model is the same as the ones which is obtained by the model of this
paper for the case XN = eC. However, (3.6) cannot be applied to the case: XN = eC.
We deal with only single fare class case as below to simplify. From Proposition 3.1, the policy
space can be rewritten in the following form because a in Ap(X) is only decided if a booking

44
request p is accepted.
Ap(X) = d|(d = a, ta ≥ 0, a ≥ p) or (d = 0) .
d = 0 in the policy space stands for denying a request. By using this Ap(X), (3.2) can be rewritten
as the following equation:
Un(X) =∑p∈P
λnp maxd∈Ap(X)
∑d|d=0
(rnp + Un−1(X + ed−p − ed)) +∑d|d=0
Un−1(X)
+λn0Un−1(X),
X ∈ Xn, n ∈ T1. (3.7)
Further, (3.7) is rewritten in the following equation
Un(X) =∑p∈P
λnp
rnp − mind∈Ap(X)
∆dpUn−1(X)
+
+ Un−1(X),
X ∈ Xn, n ∈ T1. (3.8)
where (k)+ = maxk, 0, ∆dpUn−1(X) = Un−1(X)−Un−1(X+ed−p−ed) and ∆0
pUn(X) =∞.
mind∈Ap(X)
∆dpUn−1(X) can be seen as threshold price. From (3.8), it is obvious to acquire the
following Theorem 3.4.
Theorem 3.4. For a given X ∈ X0, Un(X) is non-decreasing in n.
Then, an algorithm is shown as below. Algorithm 3 is to calculate an optimal policy d∗ for
a given p, n and X ∈ Xn by using the threshold price. Ap(X)\0 in Algorithm 3 stands for
Ap(X)\0.
If arg mind∈Ap(X)\0
∆dpUn−1(X) is not unique, then without loss of generality, the smallest d
is selected in Algorithm 3. Note that we cannot reduce the search range for segments a of Ap(X)
in Algorithm 3.
We might expect that there is a structural property of the upgrade model which is seen in Stein-

45
hardt and Gönsch [35] and Lemma 2.4. This means that, for all n ∈ T0 and X ∈ Xn, if there exist
d ∈ Ap(X) and d′ ∈ Ap(X) such that d = 0, d′ = 0 and d ≤ d′, then ∆dpUn(X) ≤ ∆d′
p Un(X).
Indeed, the monotonicity does not exist. To demonstrate the non-monotonicity, a counter-example
is shown in the next section.
Algorithm 3Input n,X ∈ Xn and p.d∗ ← 0if Ap(X)\0 = ϕ then
calculate mind∈Ap(X)\0
∆dpUn−1(X) and
mindarg mind∈Ap(X)\0
∆dpUn−1(X).
d∗ ← mindarg min
d∈Ap(X)\0∆dpUn−1(X)
if rnp ≥ mind∈Ap(X)\0
∆dpUn−1(X) then
d∗ ← d∗
end ifend if
3.4 Numerical Examples
This section shows numerical examples in which maximum expected revenues and optimal
policies are calculated by using Algorithm 3 on a small scale. One of the examples is the counter-
example which was mentioned in the previous section.
3.4.1 Numerical Example Using Algorithm 3
A data-set is C = 6, N = 4, P = 3, X4 = (0, 1, 1, 0, 0, 0). Arrival rates and fares are
shown in Table 3.1. From maxn |Xn| = 9, to simplify notation, elements of the state space are
X1 = (0, 1, 1, 0, 0, 0), X2 = (1, 0, 1, 0, 0, 0), X3 = (0, 0, 1, 0, 0, 0), X4 = (0, 2, 0, 0, 0, 0), X5 =
(1, 1, 0, 0, 0, 0), X6 = (2, 0, 0, 0, 0, 0), X7 = (0, 1, 0, 0, 0, 0), X8 = (1, 0, 0, 0, 0, 0), X9 = (0, 0, 0,
0, 0, 0).
The maximum expected revenues and the optimal policies which are calculated from the data-
set are shown in Table 3.2 and 3.3, respectively. Specifically, a calculation process for p = 1 and
X2 ∈ X3 in the Table 3.3 is explained as follows.
Suppose that calculations are terminated at n = 2 by backward induction. We

46
calculate for d = 1 because of A1(X2)\0 = ϕ. For a policy 1 ∈ A1(X2),
∆11U2(X2) = U2(X2) − U2(X3) = 28.8 − 24.4 = 4.4. For a policy 3 ∈ A1(X2),
∆31U2(X2) = U2(X2) − U2(X5) = 28.8 − 16.2 = 12.6. Therefore, from
mind∈A1(X2)\0
∆d1U2(X2) = 4.4 ≤ r3
1 = 10, d∗ = 1 is demonstrated. Accordingly, the max-
imum expected revenues and the optimal policies for all states in all time periods can be calculated.

47
Table 3.1. Arrival rate and fare for p in n.
λnp rnp
n\p 1 2 3 1 2 3
1 0.2 0.3 0.5 10 20 30
2 0.4 0.3 0.2 10 20 30
3 0.4 0.3 0.2 10 20 30
4 0.3 0.2 0.1 10 20 30
Table 3.2. The maximum expected revenues Un(Xk) for n and k.
k\n 4 3 2 1 0
1 41.61 41.08 36.00 23.00 0.00
2 - 32.32 28.80 23.00 0.00
3 - 19.40 24.40 23.00 0.00
4 - 25.84 18.00 8.00 0.00
5 - 21.70 16.20 8.00 0.00
6 - - 6.00 2.00 0.00
7 - 16.04 13.20 8.00 0.00
8 - - 5.20 2.00 0.00
9 0.00 0.00 0.00 0.00 0.00
Table 3.3. The optimal policies for n and Xk.
p = 1 p = 2 p = 3k\n 4 3 2 1 4 3 2 1 4 3 2 1
1 2 2 2 2 2 2 2 2 3 3 3 3
2 - 1 1 1 - 0 0 3 - 3 3 3
3 - 0 0 3 - 3 0 3 - 3 3 3
4 - 2 2 2 - 2 2 2 - 0 0 0
5 - 1 1 1 - 2 2 2 - 0 0 0
6 - - 1 1 - - 0 0 - - 0 0
7 - 2 2 2 - 2 2 2 - 0 0 0
8 - - 1 1 - - 0 0 - - 0 0
9 0 0 0 0 0 0 0 0 0 0 0 0

48
3.4.2 Counter-example
Note that if request p is accepted, then all optimal policies in Table 3.3 take the smallest d.
However, this feature is not held in the counter-example which is shown in this subsection. A data-
set of this counter-example is C = 6, N = 3, P = 3 and X4 = (0, 1, 1, 0, 0, 0). Arrival rates and
fares of this counter-example are shown in Table 3.4. Notations of elements of the state space are
the same as the ones that was mentioned in the previous example.
Notice that the booking request p = 2 is accepted for all states in n = 1, 2 because
the request p = 2 must arrive. Therefore, the maximum expected revenues can be easily
calculated until n = 2. Since ∆21U2(X1) = U2(X1) − U2(X2) = 40 − 20 = 20 and
∆31U2(X1) = U2(X1) − U2(X4) = 40 − 40 = 0, the optimal policy for p = 1 and X1 ∈ X3 is
d∗ = 3. Thus, it shows non-monotonicity of ∆dpUn(X) in d( = 0). This counter-example indicates
that Algorithm 3 is needed for calculating optimal policies and maximum expected revenues.
Table 3.4. Arrival rate and fare for p in n.
λnp rnp
n\p 1 2 3 1 2 3
1 0.0 1.0 0.0 10 20 30
2 0.0 1.0 0.0 10 20 30
3 0.4 0.3 0.2 10 20 30
3.5 Application of Single Line Seats Model
The single line seats model is applicable to a multi-line case if each line is not distinguished as
shown in Figure 3.3. We can see this case as a single line seats model with any initial state. Thus,
Figure 3.3. An example of modifying three lines to single line.
we can calculate optimal allocating position by using Algorithm 3. Further, if one fare class links
to one seat, and arrivals of requests for each fare class are independent in different fare classes, then

49
we can solve optimal policies for each fare class. Figure 3.4 shows an example where seats with
multiple lines and multiple fare classes are modified to adopt the single line seats model.
Figure 3.4. Modifying multiple line with two types fare classes.
3.6 Conclution
In this chapter, the single line seats model was introduced. Proposition 3.2 shows that we should
allocate ends of vacant seats block to arriving request with any fare class and any size in order to
obtain the maximum expected revenue. From the property, the relationship between the single line
seats model and a basic dynamic model in [26] is revealed. Further, we indicate the conditions which
make possible to apply the single line seats model for multiple lines with multiple fare classes.
From Remark 3.3, we can find that the single line seats is a extended one from basic dynamic
models. However, customers cannot select their seating positions in the model suggested in this
chapter. Nowadays, we can often select seating positions when we book seats because of devel-
opment of online reservation system. In the next chapter, we mention optimal control for booking
requests if arriving customers can choose their seating positions.

50
List of Symbols for Chapter 4
n: remaining time to the terminal time
N : size of time period
λ: arrival rate
T0: set of time periods 0, 1, · · · , N
T1: set of time periods 1, · · · , N
m: the number of size of the longest segment
M : set of segments 1, · · · ,m
c: initial state in time N ; c = (c1, · · · , cm)T
X: state space
(a, b) ∈ Ω(x): possible choice set for x ∈ X where a and b indicates a size of a segment and an
index of the segment a, respectively
S ⊆ Ω(x): offer set
Ω: all possible choice set; Ω =
(a, b)|a ∈M, b ∈ Z+, 0 < b ≤ a+12
P(a,b)(S): probability which is that an arriving customer decides to book the position (a, b) ∈ S
when offer set is S
P0(S): probability of no-purchase when offer set is S
A(a,b): changes of the numbers of segments when a customer chooses (a, b) ∈ Ω;
A(a,b) = eb−1 + ea−b − a
51
A: A = (A(a,b))(a,b)∈Ω
Un(x): maximum expected revenue which a facility obtains optimally operating from n to 0, given
the state x ∈ X in n ∈ T0
∆(a,b)Un(x): opportunity cost of the seat (a, b) at the state x in time n
R(S): expected revenue when offer set is S
P (S): probability vector when offer set is S; P (S) = (P(a,b)(S))(a,b)∈Ω
Q(S): expected changing capacities when offer set is S; Q(S) = AP (S) and
Q(S) = (Q1(S), · · · , Qm(S))
UCDLP : maximum expected revenue obtained from CDLP
π: estimate of the marginal value of capacity on each segment; π = (π1, · · · , πm)T
σ: estimate of the marginal value of time
β: heuristic parameter in decomposition approximation method; 0 ≤ β ≤ 1
y: binary vector which indicates whether positions are available or not
v(a,b): customer’s preference of purchasing the position (a, b) ∈ Ω
v0: customer’s preference of no-purchase

52
Chapter 4
Choice-based Seating Position Model
4.1 Introduction
Incorporating customer’s purchasing behavior into dynamic models has been researched for
decades. Talluri and van Ryzin [37] suggested a single-leg model with customer’s behavior, and
showed some properties for the model. In NRM, Gallego et al. [13], Zhang and Cooper [42], Liu
and van Ryzin [27], Bront et al. [8] and etc. studied NRM model with customer’s behavior to
reveal structural properties and efficiently calculate approximate solutions. The NRM model with
customer’s behavior is called choice-based NRM model. Recently, Sierag et al. [33] suggested
choice-based NRM model with overbooking and cancellation. Topics or models with customer’s
behavior are summarized in [32] as overview.
In this chapter, we show a dynamic model with seating position and customer’s behavior by
using the approaches of choice-based NRM. The dynamic model has multiple lines and multiple
fares where each fare links to each seat.
4.2 Formulation for Choice-based Seating Position Model
Consider a facility with multiple seat lines. Assume that these lines do not distinguished. In
addition, each fare class links to a seat, and arrivals of requests for each fare class are independent
in different fare classes. From these assumptions, we can line seats up at each fare class and deal
with the problem at each fare class. Hence, we consider the problem with only one fare class.

53
Booking horizon is sufficiently discretized into n = 1, · · · , N . The times n indicate remaining
time to the terminal time n = 0. Assume that size of requests has one, and no more than one request
arrives at n. Let λ be rate of the requests which is dependent in times, and set T0 = 0, · · · , Nand
T1 = 1, · · · , N
States of the facility are shown by the numbers of adjacent vacant seats. We call this vacant seats
a segment. If the segment have n seats, we call the size of the segment n. The left side and right
side of the segments are not distinguished. Let m be the number of size of the longest segment. Set
M = 1, · · · ,m. Therefore, c = (c1, · · · , cm)T stands for an initial state of the facility in time N
where T means transpose, and ci indicates the initial number of segments of size i. State space is
defined as
X =
(x1, · · · , xm)|0 ≤ xi ≤m∑k=1
ck⌊k + 1i+ 1
⌋, xi ∈ Z+, i ∈M.
where ⌊k+1i+1 ⌋means how many segments of size i is generated from a segment of size k. In addition,
note that we do not use the assumption which is that one request arrives in time n at most, to avoid
complication.
In this model, if arriving customers book seats, then they select which segment and which
position. Choices that a system of the facility can offer are defined as below.
Ω(x) =
(a, b)|xa > 0, b ∈ Z+, 0 < b ≤ a+ 12
, a ∈M, x ∈ X.
The empty set ∅ ⊆ Ω(x), x ∈ X indicates not to offer seating positions for arriving requests,
which is “deny” in dynamic models without customer’s behavior. For each x ∈ X , Ω(x) is
called the possible choice set. The system of the facility decides a subset of the possible choice
set S ⊆ Ω(x), x ∈ X on a beginning time point of each time duration. The subset S is called offer
set. Arriving customers choose their booking positions from the offer sets which are decided by
the system of the facility. The system aims to maximize expected revenue over booking horizon by
deciding offer sets at each time and states.
Customers’ behavior in this model is defined discretely, which can also be seen in [27, 37].
Arriving customers probabilistically choose their seating positions. Let P(a,b)(S) be a probability
which is that an arriving customer decides to book the position (a, b) ∈ S when S ⊆ Ω(x), x ∈ X is
offered. Set P0(S) = 1−∑
(a,b)∈S P(a,b)(S), S ⊆ Ω(x), x ∈ X , and P0(S) indicates a probability

54
of no-purchase of customer’s behavior when S ⊆ Ω(x), x ∈ X is offered.
Then, consider changes of the numbers of segments if an arriving customer chooses
(a, b) ∈ S ⊆ Ω(x), x ∈ X . When the customer chooses the segment with size a and its index
b, the change of state is eb−1 + ea−b − ea, which means that the segment with size a is split into a
segments with size b− 1 and a− b, where ei indicates i-th unit vector for each i ∈M , and e0 indi-
cates zero vector. Set A(a,b) = eb−1 + ea−b − ea, and it is the changes of the numbers of segments
when an arriving customer chooses (a, b). In addition, define the matrix A = (A(a,b))(a,b)∈Ω where
Ω =
(a, b)|a ∈M, b ∈ Z+, 0 < b ≤ a+ 12
.
Using dynamic programming, let Un(x) be the maximum expected revenue which the facility
obtains optimally operating from n to 0, given the state x in time n.
Un(x) = maxS⊆Ω(x)
λ∑
(a,b)∈SP(a,b)(S)(r + Un−1(x+A(a,b)))
+ (λP0(S) + (1− λ))Un−1(X), n ∈ T1, x ∈ X. (4.1)
Boundary conditions are U0(x) = 0, UN+1(x) = 0, x ∈ X , Un(0) = 0 and
Un(x) = 0, x /∈ X,n ∈ T1. (4.1) is rewritten by P0(S) = 1 −∑
(a,b)∈S P(a,b)(S) as the fol-
lowing equations.
Un(x) = maxS⊆Ω(x)
λ∑
(a,b)∈SP(a,b)(S)(r −∆(a,b)Un−1(x))
+ Un−1(x),
n ∈ T1, x ∈ X (4.2)
where ∆(a,b)Un(x) = Un(x)− Un(x+A(a,b)) which means opportunity cost of a seat (a, b) at the
state x in time n.
4.3 Approximation Model
In (4.2) using dynamic programming, it is obviously difficult to compute if m and the numbers
of initial segments enlarge by the curse of dimensionality mentioned in Section 2.1. Several approx-

55
imation methods for this problem in NRM have been studied. Among them, some approximation
methods have been suggested for the choice-based NRM models. Gallego et al. [13] suggested
Choice-based Deterministic Linear Programming (CDLP) which utilizes DLP (Deterministic Lin-
ear Programming), which is the one of the approximation methods in NRM. Further, Liu and van
Ryzin [27] suggested decomposition approximation method which is from dynamic programming
decomposition method, which is a traditional approximation method in NRM. In this section, we
apply CDLP and decomposition approximation method to the choice-based seating position model.
4.3.1 Choice-based Deterministic Linear Programming (CDLP)
Let the numbers of segments (means capacity) be continuous, and arrival rates be deterministic
number, similar to Gallego et al. [13] and Liu and van Ryzin [27].
We set
R(S) =∑
(a,b)∈SrP(a,b)(S), S ⊆ Ω(x), x ∈ X,
which means the expected revenue if offer set is S. Define P (S) = (P(a,b)(S))(a,b)∈Ω. In addition,
let Q(S) be the expected changing capacities if offer set is S. Since the capacities is continuous,
Q(S) = AP (S)
where Q(S) = (Q1(S), · · · , Qm(S)), and Qi(S) means the expected changing number of the
segment with size i if S is offered.
Then, if any subsets are generated from Ω, impossible combination of offer set would be created
on actual transition from c. Therefore, we make the assumption for initial state c as below.
Assumption 4.1. On transition from a given initial state c over time horizon, there exists states
x+ = (xi)i∈M ∈ X , such that xi > 0, i ∈M
We do not consider not to move to the states x+ by deficiency of time because we identify
that N is sufficiently large. We can see whether c satisfies the assumption if we trace transitions
of states. However, we can confirm whether c satisfies a sufficient condition for the assumption
from the simple fact which is that a segment β is increased by one at most if a segment α(> β)
is consumed. We propose an algorithm to confirm that. The order of the algorithm is O(m2). In

56
Algorithm 4, suppose that m > 1.
Algorithm 4 An algorithm to confirm whether c satisfies Assumption 4.1.1: Input c
2: flag← False
3: for i = 1 to m− 1 do
4: if there exists j such that cj = 0, i < j and ci = 0, then
5: j∗ ← minj
6: cj∗ ← cj∗ − 1
7: end if
8: end for
9: if cm = 0 then
10: flag← True
11: end if
12: Output flag
Let t(S) be the total number of time periods in which S is offered. Then, we allow t(S) to be
continuous, which means that we can use the set S for some fraction of a time period. Note that the
sequence to offer S is arbitrary.
Then, we obtain the maximum expected revenue UCDLP by CDLP.
UCDLP = max∑S⊆Ω
λR(S)t(S) (4.3)
s.t. 0 ≤ c+∑S⊆Ω
λQ(S)t(S)
∑S⊆Ω
t(S) ≤ N
t(S) ≥ 0, ∀S ⊆ Ω.
The dual problem of (4.3) is the following
min πT c+ Tσ (4.4)
s.t. − λπTQ(S) + σ ≥ λR(S), ∀S ⊆ Ω

57
π ≥ 0, σ ≥ 0.
π and σ are dual variables corresponding to the first and second constraint equations in (4.3) where
π = (π1, · · · , πm)T . From sensitivity analysis (referring [7, 17]) for (4.4), we can instinctively
see that π means an estimate of the marginal value of capacity on each segment, and σ means an
estimate of the marginal value of time.
Similar to Liu and van Ryzin [27], we mention the expected revenue which is obtained from
initial state c and time N . Define µ as control policy, which maps states to control actions (offer
sets). Sµ(n|Fn) is an action in time n under the policy µ where Fn indicates the history of the
system up to time n. To simplify notations, we omit Fn in the following sections. N(Sµ(n))
denotes a |Ω|-dimensional random vector which indicates the number of position purchased in time
n under the policy µ. N(a,b)(Sµ(n)) = 1, (a, b) ∈ Ω means a sale of the position (a, b) and
N(a,b)(Sµ(n)) = 0, (a, b) ∈ Ω means no sale of the the position (a, b). M denotes the class of all
admissible policies. Noting that∑Nn=1AN(Sµ(n)) is the changing quantities of the segments from
N to 1,
0 ≤ c+N∑n=1
AN(Sµ(n)) (a.s.)
is satisfied.
From these notations, (4.2) is denoted as the general form;
U∗ = maxµ∈M
E
[r
N∑n=1
eTN(Sµ(n))]
(4.5)
s.t. 0 ≤ c+N∑n=1
AN(Sµ(n)) (a.s.)
Sµ(n) ⊆ Ω, n ∈ T1,
where e = (1, · · · , 1)T . We can obtain the following proposition which indicates the upper bound
of (4.2) from the similar way in Liu and van Ryzin [27].
Proposition 4.2. U∗ ≤ UCDLP .
Proof: Let Sµ∗(n), n ∈ T1 be optimal controls. 0 ≤ c+∑Nn=1AN(Sµ∗(n)) since µ∗ is admissible

58
policy. Then, set
tµ∗(S) = E
[N∑n=1
1Sµ∗ (n)(S)]
and tµ∗(S) is the expected total time in which S has been offered under the policy µ∗ where
1Sµ∗ (n)(S), S ∈ Ω is indicator function as
1Sµ∗ (n)(S) =
1 S = Sµ∗(n)
0 otherwise.
From Wald’s equation (see p.521 in [12]),
N∑n=1
E[N(a,b)(Sµ∗(n))
]=∑S⊆Ω
λP(a,b)(S)tµ∗(S)
and 0 ≤ c +∑S⊆Ω λAP (S)tµ∗(S) are obtained. In addition,
U∗ =∑Nn=1 re
TE [N(Sµ∗(t))] =∑S⊆Ω λre
TP (S)tµ∗(S). From definitions of Q(S) and
R(S), we can find that tµ∗(S) is a feasible solution for the problem (4.3). Hence U∗ ≤ UCDLP is
shown.
A definition of efficient set in choice-based NRM model which is shown in [27] is ineffective in
this model. The definition of efficient set is shown as a reference.
Definition 4.3. For an offer set K, if there exists a set of convex weights α(S), S ⊆ Ω satisfying∑S α(S) = 1 and α(S) ≥ 0,∀S ⊆ Ω such that
R(K) <∑S
α(S)R(S)
Q(K) ≥∑S
α(S)Q(S),
then the set K is said to be inefficient. If there does not exit the weight, K is said to be efficient.
Optimality of the efficient set cannot be applied for choice-based seating position model. The
optimality are shown as several forms in [27, 37, 42]. As a reference, we indicate the proposition
shown by [27].

59
Proposition 4.4 (Liu and Ryzin [27]). A set K is efficient if and only if, for some
ξ = (ξ1, · · · , ξm)T ≥ 0, K is the optimal solution to
maxSR(S)− ξTQ(S).
Noting ξ ≤ 0 in choice-based seating position model, we can use this proposition for the only
case ξ = 0. Therefore, the definition of efficient set is hardly used to this model.
We apply column generation (specifically cutting plane method [7]) to (4.3), referring to [13,27].
Let S ⊆ Ω. The reduced CDLP for the limited subset S is
UCDLP (S) = max∑S∈S
λR(S)t(S) (4.6)
s.t. −∑S∈S
λQ(S)t(S) ≤ c
∑S∈S
t(S) ≤ N
t(S) ≥ 0, ∀S ∈ S,
where π and σ are the optimal solution of the dual problem for (4.6). These dual variables π and
σ are corresponding to the first and second constraint equations of (4.6), respectively. We solve the
following sub-problem to produce whether the dual solution is feasible for (4.3).
maxS
λ(R(S) + πTQ(S))− σ. (4.7)
If the optimal value of (4.7) is non-positive, then the dual solution is feasible and optimal so-
lution for (4.3). If the optimal value of (4.7) is positive, then we include the solution to S and
recalculate (4.6).
4.3.2 Decomposition Approximation Method
The solutions given by CDLP are times to allocate to each offer set. That has problem which
is that a sequence of offering the sets through booking time is arbitrary. This means that we cannot

60
identify what states and times to apply the offer sets, even though we can see how much time
to allocate to each offer set. To resolve this problem of CDLP, Liu and van Ryzin [27] suggested
decomposition approximation method for choice-based NRM models. In the rest of this chapter, the
decomposition approximation method improved by Bront et al. [8] is applied to the choice-based
seating position model. In the decomposition approximation method, we decompose (4.2) in each
segment by using its marginal value which is given as the dual solution π = (π1, · · · , πm)T , that is,
Un(x) ≈ U in(xi) +∑l =i
πlxl, n ∈ T1, i ∈M,x = (x1, · · · , xm) ∈ X. (4.8)
Phase 1: calculate one-dimensional dynamic programming
We calculate the one-dimensional dynamic programming
U in(xi), n ∈ T1, i ∈M,x = (x1, · · · , xm) ∈ X, (a, b) ∈ S ⊆ Ω(x).
From (4.8),
∆(a,b)Un(x) = Un(x)− Un(x+A(a,b))
≈ U in(xi)− U in(xi + eTi A(a,b))− (πT − πieTi )A(a,b), n ∈ T1, i ∈M,
x = (x1, · · · , xm) ∈ X, (a, b) ∈ S ⊆ Ω(x). (4.9)
is obtained. Using (4.8) and (4.9),
U in(xi) = maxS∈Si(xi)
λ ∑(a,b)∈S
P(a,b)(S)(r + (πT − πieTi )A(a,b) −∆(a,b)Uin−1(xi))
+ U in−1(xi)
(4.10)
is produced from (4.2) where Sj(xj) = S|S ⊆ Ω(x), xi = xj , x ∈ X. Sj(xj) indicates the
action space if the value of the i-th element of the state is xj .
Phase 2: find offer sets
Finally, using U in(xi) calculated in Phase 1, we approximately calculate the deflection vector
∆U in(x) = Un(x) − Un(x − ei) for each i ∈ M , n ∈ T1, and x ∈ X , and find offer sets for each
time n ∈ T1 and state x ∈ X by using the deflection vectors.

61
Consider a heuristic parameter 0 ≤ β ≤ 1 and calculate
∆U in(x) ≈ ∆U in(x) = β∆U in(xi) + (1− β)πi, i ∈M,n ∈ T1, x = (x1, · · · , xm) ∈ X, (4.11)
where ∆U in(xi) = U in(xi) − U in(xi − 1) and ∆U in(0) = 0. Using ∆U in(x), for each time n ∈ T1
and state x ∈ X , solve
maxS⊆Ω(x)
λ ∑(a,b)∈S
P(a,b)(S)(r −∆UTn−1(x)A(a,b))
(4.12)
where ∆UTn (x) = (∆U1n(x), · · · ,∆Umn (x)). From this way, we can obtain offer sets for each time
and state by decomposition approximation method.
4.4 Applying MNL choice model to customer’s behavior
Remark that the approximation methods are effective ones for the curse of dimensionality.
Specifically, the approach of CDLP is to resolve it by sacrificing sequences of offer sets, and the
approach of decomposition approximation method is to reduce it by decomposing states. However,
these methods do not resolve enlarging size of possible offer set. The numbers of seats of a fare class
in theater, stadium, opera, Kabuki and etc. are actually very large. The dimensionm is derived from
the number of seats at the longest line. Since the number of possible offer set is considerably ef-
fected by the dimension, it is obvious that the number of all subsets of Ω is exponentially increased.
In the approximation methods, this problem appears in calculating (4.7), (4.10) and (4.12).
We show to able to resolve this problem under an assumption which is that customers’ be-
havior depends on Multinomial Logit (MNL) choice model, which can be also seen in [13, 27].
What customers’ behavior depends on MNL choice model means that coustomers have a preference
(weight) for each position, and select a position depending by their preferences. In the following
chapter, we consider that all customers treat all possible positions as their selections. Then, let

62
y = (y(a,b))(a,b)∈Ω be a binary vector where
y(a,b) =
1 (a, b) is available,
0 (a, b) is non-available,
which indicates whether the position (a, b) is available or not. Using the y, we define
P(a,b)(y) =v(a,b)y(a,b)∑
(α,β)∈Ω v(α,β)y(α,β) + v0(4.13)
as a probability that a customer chooses the position (a, b) ∈ Ω, where v(a,b) ≥ 0 and v0 > 0
are preferences of purchasing the position (a, b) and no-purchase, respectively. Applying the MNL
choice model to (4.2), (4.7) and (4.12), we obtain
Un(x) = maxy∈Y (x)
λ∑
(a,b)∈Ω(r −∆(a,b)Un−1(x))v(a,b)y(a,b)∑(a,b)∈Ω v(a,b)y(a,b) + v0
+ Un−1(x),
n ∈ T1, x ∈ X, (4.14)
λ maxy∈0,1|Ω|
∑(a,b)∈Ω(r + πTA(a,b))v(a,b)y(a,b)∑
(a,b)∈Ω v(a,b)y(a,b) + v0− σ (4.15)
and
maxy∈Y (x)
λ∑
(a,b)∈Ω(r −∆(a,b)Un−1(x))v(a,b)y(a,b)∑(a,b)∈Ω v(a,b)y(a,b) + v0
, (4.16)
respectively, where
Y (x) =
(y(a,b))(a,b)∈Ω|y(a,b) ∈ 0, 1Ω(x)(a, b), (a, b) ∈ Ω, x ∈ X (4.17)
and
1Ω(x)(a, b) =
1 (a, b) ∈ Ω(x)
0 otherwise.
The following Proposition 4.5 is Proposition 6 in [27].

63
Proposition 4.5 (Liu and van Ryzin [27]). Consider a problem
maxy∈0,1|Ω|
∑(a,b)∈Ω ξ(a,b)v(a,b)y(a,b)∑(a,b)∈Ω v(a,b)y(a,b) + v0
. (4.18)
When ξ(a,b), (a, b) ∈ Ω are ranked in a decreasing order, let ξ[i] be the i-th value, that is,
ξ[1] ≥ · · · ≥ ξ[i] ≥ · · · ≥ ξ[|Ω|].
Then, there is a critical value k∗, 1 ≤ k∗ ≤ Ω such that
y∗(a,b) =
1 ξ(a,b) ≥ ξ[k∗],
0 ξ(a,b) < ξ[k∗]
where y∗ = (y∗(a,b)) is an optimal solution for the above problem (4.18).
Furthermore, we show the proposition which is easily obtained from Proposition 4.5.
Proposition 4.6. Given a state x ∈ X , consider the problem
maxy∈Y (x)
∑(a,b)∈Ω ξ(a,b)v(a,b)y(a,b)∑(a,b)∈Ω v(a,b)y(a,b) + v0
. (4.19)
When ξ(a,b), (a, b) ∈ Ω are ranked in a decreasing order, let ξ[i] be the i-th value, that is,
ξ[1] ≥ · · · ≥ ξ[i] ≥ · · · ≥ ξ[|Ω(x)|].
Then, there is a critical value k∗, 1 ≤ k∗ ≤ Ω such that
y∗(a,b) =
1 ξ(a,b) ≥ ξ[k∗], 1Ω(x)(a, b) = 1
0 otherwise
where y∗ = (y∗(a,b)) is an optimal solution for the above problem (4.19).

64
Proof: Consider the problem
maxy∈Y ′(x)
∑(a,b)∈Ω(x) ξ(a,b)v(a,b)y(a,b)∑(a,b)∈Ω(x) v(a,b)y(a,b) + v0
(4.20)
where
Y ′(x) =
(y(a,b))(a,b)∈Ω(x)|y(a,b) ∈ 0, 1, (a, b) ∈ Ω(x), x ∈ X. (4.21)
It is obvious that the problem (4.19) is the same as the problem (4.20) because terms of (a, b) such
that 1Ω(x)(a, b) = 0 is zero in (4.19). Hence, Proposition 4.6 is obtained by applying Proposition
4.5 to the problem (4.20).
Proposition 4.5 is helpful to search optimal solutions of this model. From the proposition, we
can solve (4.15) by calculating |Ω| patterns at most. However, we need to calculate 2|Ω| patterns
without Proposition 4.6 in the worst case. Similarly, we can use Proposition 4.6 for effectively
solving (4.14) and (4.16).
4.5 Numerical Example
In this section, we estimate the each approximation method by Monte Carlo simula-
tion. Set N = 100, λ = 0.3, r = 10 and c = (0, 0, 4, 4). For preferences, let
v(1,1) = 0.5, v(2,1) = 1.5, v(3,1) = 2.0, v(3,2) = 3.0, v(4,1) = 2.5, v(4,2) = 3.5 and v0 = 2.0.
Configurations of the approximation methods are suggested as below.
DP: DP means that using offer sets which are obtained by (4.14).
CDLP-LX: Using solutions obtained by CDLP, we allocate offer sets with positive time to each
occurred state in backward lexicographical order. The backward lexicographical order means
that we allocate offer sets to each occurred state in backward order when we regard the offer
sets as character strings and sort the strings in lexicographical order. For examples, when
there are offer sets (1, 1), (3, 1) and (2, 1), (3, 1), (3, 2) with positive allocating time, we
firstly select (2, 1), (3, 1), (3, 2). In this way, we set that positions in each offer set have
been sorted in lexicographical order.

65
CDLP-RND: We randomly choose an offer set from offer sets with positive allocating time.
DCOMP-0, DCOMP-0.5, DCOMP-1: DCOMP-0, DCOMP-0.5 and DCOMP-1 indicate to use of-
fer sets which are computed by the decomposition approximation method with β = 0,
β = 0.5 and β = 1, respectively.
FULL-OPEN: This indicates that we always open unbooked seats.
We trace paths of state from n = N to n = 0 by 100 times, and we calculate averages of total
obtained revenue for each history. The result is shown in Figure 4.1 where the vertical axis indicates
the average revenue and the horizontal axis indicates the number of times of the paths.
Figure 4.1. Average revenue for each approximation method.
In this result, we can see that CDLP-LX and DP make higher revenue than FULL-OPEN which
is actually no-control. All decomposition approximation methods with β = 0, 0.5 and 1 make
lower revenue than FULL-OPEN. Note that differences among the methods are not generated if a
customer’s preference of no-purchase is zero. The reason is that it is optimal to accept all customers’
requests if all arriving customers always book positions, since revenue obtained from each customer
is the same. Therefore, the differences among the methods are derived from customers’ behavior,
that is, we can obtain higher revenue by controlling choices of seating position for customers even
though fares for all seats are the same.

66
4.6 Conclusion
In this chapter, we proposed choice-based seating position model which deals with customers
who choose their booking position or no-purchase on their preferences in a facility with multiple
lines under some assumptions. In addition, we showed upper bound of the expected revenue and that
we can apply techniques of choice-based NRM to the dynamic model with seating position. In the
numerical example, it is indicated that we can obtain higher revenue by CDLP than FULL-OPEN.
If customers’ behavior depends on MNL choice model, we can efficiently calculate optimal offer
sets by Propositions 4.5 and 4.6. For the model by dynamic programming, we can reduce searching
in action space and may prospect to obtain the highest revenue although the curse of dimensionality
is not resolved. Using CDLP method, we can use linear programming and can efficiently solve
the sub-problem by Proposition 4.5, that is, we can deal with large m, c and N . Further, it is
suggested that CDLP may be effective approximation methods for choice-based seating position
model since there is a case in which offer sets obtained by CDLP can generate higher revenue than
FULL-OPEN. On the other hand, in the decomposition approximation method, a part of procedures
for finding optimal offer sets cannot be effectively calculated. Also, it is suggested that the method
may be not effective in the numerical example. This result is different from ones in [27] and [8]
which treat a basic choice-based NRM model. The reason may be that the elements of states in
choice-based seating position model, means segment, are strongly related among segments with
different size, which is different from normal RM models.
For the choice-based seating position model, there is the effective way to calculate offer sets if
all customers depend on the same preference. Bront et al. [8] have presented that the sub-problem
in the basic choice-based NRM model with multiple customer’s segment is NP-hard if the choices
of the customer’s segments overlap with each other. They also suggested that the problem can be
solved in practical time since the problem is conducted by a mixed integer programming. In this
chapter, we do not concern multiple customer’s segments with different preferences (for example,
membership or non-membership who have different enthusiasm for services provided by facilities,
which is opera or Kabuki). This issue which leads to include actual conditions to the choice-based
seating position model may join to their works which consider the basic choice-based NRM model.

67
Chapter 5
Summary and Future issues
In the party mix problem, we provided some assumptions to simplify existing models, and
showed the upgrade structure and the range of generating variations of optimal policies. However,
it is mysterious that how the assumption of departure of customers depending on exponential distri-
bution can apply to actual facilities. Distribution of the staying time, which is called meal duration,
has not been focused, although fundamental statistics for that have been studied. If there are ser-
vices where departures of customers can be approximated by exponential distribution, then we can
achieve the maximum expected revenue in the services by deciding whether each arriving party is
accepted to allocate the smallest table or not.
However, when there are customers hoping to sit in large tables (for example, they have many
baggages), is it the best way to always allocate available smallest tables to the parties? Consider-
ing with the work in [15] which shows that customer satisfaction leads to increase the customer’s
loyalty for a facility, the relationship between the number of seats that a party has and the facility’s
expected revenue are regarded as the result under the condition in which customers make much
account of comfort given by sitting in large table. Actually, the customers may be a part of people
but not all, that is, there are many kinds of customers. As an issue relating to this problem, Wang et
al. [41] reported that integration between RM and Customer Relationship Management (CRM) is a
challenging for RM theory. Recently, Klein and Kolb [24] suggested a model with considering cus-
tomers who change their behavior by a facility’s decision-making. However, it is difficult to apply
their approach to a dynamic model from a viewpoint of computational cost. Thus, the integration is
still a future issue.

68
In the chapter 3, we proposed a dynamic model with seating positions, using an approach of
formulation of pyramid game by Fujita [18]. In the model, we showed that allocating edges of a
vacant seat block to an arriving party is optimal policy, in addition, the model is extended from a
Lee and Hersh’s model which is one of traditional dynamic models. From the result, we produced
the algorithm which is used to calculate optimal policies and the maximum expected revenue. The
model is simple. However, it stands for complex transitions of states which are derived from the
condition that is a group is seated together, and can extensively apply to the case of multiple lines if
the each line is not distinguished.
In the chapter 4, we consider to include customers’ behavior for seating positions to the dynamic
model, which can be seen in online reservation system. We assumed that each seat line is not
distinguished, and one seat links to one fare class. Arriving customers decide whether to book
which seating position or not by their preference for each seating position. In this model, action
space is exponentially increased since the action of a system is a subset of possible seating positions.
However, if the customers’ behavior for choosing their seating position depends on MNL model,
then we showed that the optimal offer set can be solved, effectively. This means that insights and
results which is obtained by studies of choice-based NRM model, which have been studied for
about the last decade, can be used to the choice-based seating position model. In addition, we can
consider more extension for the model, for example, to consider arriving parties, customers with
various behavior without MNL model, and etc. Unless the seating position is focused, this direction
is not produced and do not lead to allow the industries, for example, opera, theater, sport stadium,
Kabuki, and etc. to increase their revenue by controlling only offer set of seating position on their
existing systems.
In this thesis, we focused the spatial conditions of seats on dynamic models, and new models
and their properties have been shown. These results have theory of RM include new approach which
is to consider congestion level and seating position. We can perceive new direction and insight in
RM from these results.

69
Bibliography
[1] Mordecai Avriel. Nonlinear programming: analysis and methods. Courier Corporation, 2003.
[2] Christiane Barz. Risk-Averse Capacity Control in Revenue Management (Ph. D. thesis). 2007.
[3] Rick Bell and Patricia L Pliner. Time to eat: the relationship between the number of people
eating and meal duration in three lunch settings. Appetite, 41(2):215–218, 2003.
[4] Moshe E Ben-Akiva and Steven R Lerman. Discrete choice analysis: theory and application
to travel demand, volume 9. MIT press, 1985.
[5] Dimitris Bertsimas and Ioana Popescu. Revenue management in a dynamic network environ-
ment. Transportation science, 37(3):257–277, 2003.
[6] Dimitris Bertsimas and Romy Shioda. Restaurant revenue management. Operations Research,
51(3):472–486, 2003.
[7] Dimitris Bertsimas and John N Tsitsiklis. Introduction to linear optimization, volume 6.
Athena Scientific Belmont, MA, 1997.
[8] Juan José Miranda Bront, Isabel Méndez-Díaz, and Gustavo Vulcano. A column generation
algorithm for choice-based network revenue management. Operations Research, 57(3):769–
784, 2009.
[9] Shelby Brumelle and Darius Walczak. Dynamic airline revenue management with multiple
semi-markov demand. Operations Research, 51(1):137–148, 2003.
[10] Wen-Chyuan Chiang, Jason CH Chen, and Xiaojing Xu. An overview of research on revenue
management: current issues and future research. International Journal of Revenue Manage-
ment, 1(1):97–128, 2006.

70
[11] Sharbel El-Haber and Muhammad El-Taha. Dynamic two-leg airline seat inventory control
with overbooking, cancellations and no-shows. Journal of Revenue and Pricing Management,
3(2):143–170, 2004.
[12] Kiyonori Kunisawa Feller W. An introduction to probability theory and its applications (in
japanese). Kinokuniya Ci., Ltd., page 547, 1970.
[13] Guillermo Gallego, Garud Iyengar, R Phillips, and Abha Dubey. Managing flexible products
on a network. Technical report, CORC Technical Report TR-2004-01, Department of Indus-
trial Engineering and Operations Research, Columbia University, 2004.
[14] Francesca Guerriero, Giovanna Miglionico, and Filomena Olivito. Strategic and operational
decisions in restaurant revenue management. European Journal of Operational Research,
237(3):1119–1132, 2014.
[15] Heesup Han and Kisang Ryu. The roles of the physical environment, price perception, and
customer satisfaction in determining customer loyalty in the restaurant industry. Journal of
Hospitality & Tourism Research, 33(4):487–510, 2009.
[16] D.K. Hayes and A. Miller. Revenue Management for the Hospitality Industry. John Wiley &
Sons, 2011.
[17] Konno Hiroshi. Linear programming (in Japanese). 1987.
[18] Touji Hujita. Mutually dependent markov decision processes: 1 stage model (in japanese).
RIMS Kokyuroku, 1990:204–212, 2016.
[19] Sheryl E Kimes, Deborah I Barrash, and John E Alexander. Developing a restaurant
revenue-management strategy. The Cornell Hotel and Restaurant Administration Quarterly,
40(5):183–29, 1999.
[20] Sheryl E Kimes and Stephani KA Robson. The impact of restaurant table characteristics
on meal duration and spending. Cornell Hotel and Restaurant Administration Quarterly,
45(4):333–346, 2004.

71
[21] Sheryl E Kimes and Gary M Thompson. An evaluation of heuristic methods for determining
the best table mix in full-service restaurants. Journal of Operations Management, 23(6):599–
617, 2005.
[22] Sheryl E Kimes and Jochen Wirtz. Has revenue management become acceptable? findings
from an international study on the perceived fairness of rate fences. Journal of Service Re-
search, 6(2):125–135, 2003.
[23] Sheryl E Kimes, Jochen Wirtz, and Breffni M Noone. How long should dinner take? mea-
suring expected meal duration for restaurant revenue management. Journal of Revenue and
Pricing Management, 1(3):220–233, 2002.
[24] Robert Klein and Johannes Kolb. Maximizing customer equity subject to capacity constraints.
Omega, 55:111–125, 2015.
[25] Takeshi Koide and Hiroaki Ishii. The hotel yield management with two types of room prices,
overbooking and cancellations. International Journal of Production Economics, 93:417–428,
2005.
[26] Tak C Lee and Marvin Hersh. A model for dynamic airline seat inventory control with multiple
seat bookings. Transportation Science, 27(3):252–265, 1993.
[27] Qian Liu and Garrett Van Ryzin. On the choice-based linear programming model for network
revenue management. Manufacturing & Service Operations Management, 10(2):288–310,
2008.
[28] Jeffrey I McGill and Garrett J Van Ryzin. Revenue management: Research overview and
prospects. Transportation science, 33(2):233–256, 1999.
[29] Yu Ogasawara. A condition for reducing expansive variations of optimal policy in restaurant
revenue management. Scientiae Mathematicae Japonicae, 80(1):93–107, 2017.
[30] Yu Ogasawara. A dynamic model with resources placed on single line in revenue management.
The Journal of the Operations Research Society of Japan, 60(2):91–100, 2017.
[31] Stephani KA Robson and Sheryl E Kimes. Don’t sit so close to me: Restaurant table charac-
teristics and guest satisfaction. Cornell Hospitality Report, 9(2):6–16, 2009.

72
[32] Zuo-Jun Max Shen and Xuanming Su. Customer behavior modeling in revenue management
and auctions: A review and new research opportunities. Production and operations manage-
ment, 16(6):713–728, 2007.
[33] DD Sierag, GM Koole, Robert D van der Mei, JI van der Rest, and Bert Zwart. Revenue
management under customer choice behaviour with cancellations and overbooking. European
Journal of Operational Research, 246(1):170–185, 2015.
[34] Richard P Stanley. Enumerative Combinatorics. Vol. 1, vol. 49 of Cambridge Studies in Ad-
vanced Mathematics. Cambridge University Press, Cambridge, 1997.
[35] Claudius Steinhardt and Jochen Gönsch. Integrated revenue management approaches for
capacity control with planned upgrades. European Journal of Operational Research,
223(2):380–391, 2012.
[36] Janakiram Subramanian, Shaler Stidham Jr, and Conrad J Lautenbacher. Airline yield manage-
ment with overbooking, cancellations, and no-shows. Transportation Science, 33(2):147–167,
1999.
[37] Kalyan Talluri and Garrett Van Ryzin. Revenue management under a general discrete choice
model of consumer behavior. Management Science, 50(1):15–33, 2004.
[38] Kalyan T Talluri and Garrett van Ryzin. The Theory and Practice of Revenue Management,
volume 68. Springer Science & Business Media, 2005.
[39] Kensuke Tanaka. Convex analysis and optimization theory (in Japanese). Makino shoten,
1994.
[40] Gary M Thompson. (mythical) revenue benefits of reducing dining duration in restaurants.
Cornell Hospitality Quarterly, 50(1):96–112, 2009.
[41] Xuan Lorna Wang, Cindy Yoonjoung Heo, Zvi Schwartz, Patrick Legohérel, and Frédéric
Specklin. Revenue management: Progress, challenges, and research prospects. Journal of
Travel & Tourism Marketing, 32(7):797–811, 2015.
[42] Dan Zhang and William L Cooper. Revenue management for parallel flights with customer-
choice behavior. Operations Research, 53(3):415–431, 2005.