dynamic hotspots of nitrous oxide and methane in coastal ... › intecol... · dynamic hotspots of...
TRANSCRIPT

Dynamic hotspots of nitrous oxide and methane in coastal marshes:
Responses to two long-term fertilization experiments
Serena Moseman-Valtierra1, Kevin D. Kroeger2
[email protected] 1 University of Rhode Island, Department of Biological Sciences,
Kingston RI 02881 2 USGS Coastal and Marine Science Center, Falmouth MA 02540
http://sdo.gsfc.nasa.gov/

Despite small size, coastal salt marshes affect global carbon sequestration
Temperate Forests: 53 Tg C year-1
Tropical Forests: 78.5 Tg C year-1
Salt Marshes: 5-87 Tg C year-1
Reviewed in Mcleod et al. 2011 Front. Ecol. Environ.

0
-2
-1
0
1
2
3
4
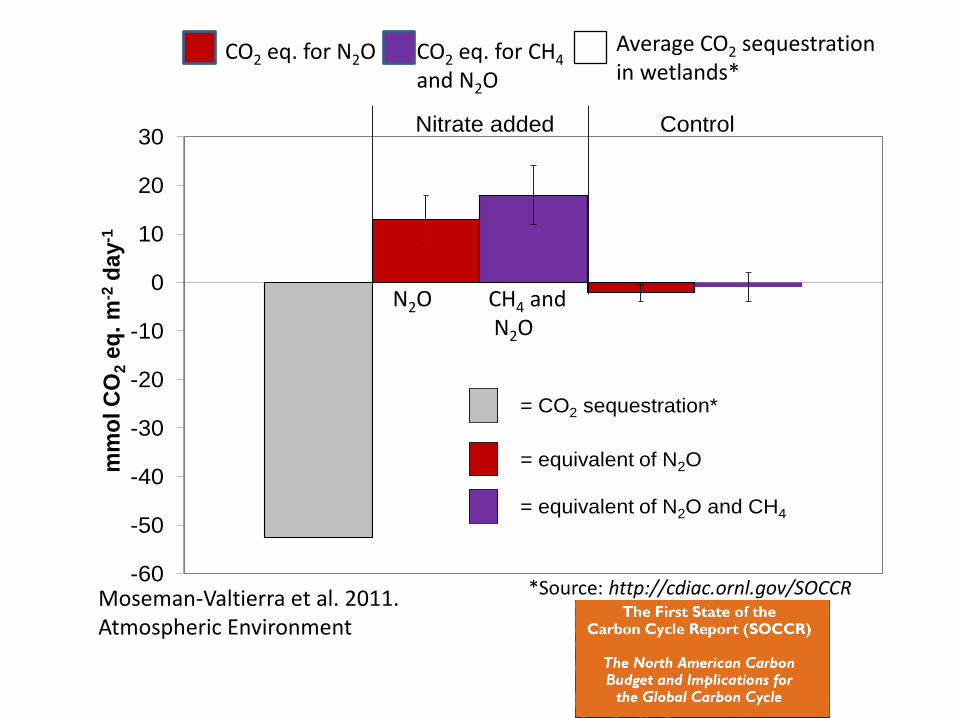
Short-term nitrate addition shifted salt marsh from N2O sink to source
= Nitrate added = Control
July ‘09 April ‘10 June ‘10
(Moseman-Valtierra et al. 2011. Atmospheric Environment)
Plots received single pulses of nitrate (0.5L of 300 mM)
mm
ol N
2O
m-2
h-1
-60
-50
-40
-30
-20
-10
0
10
20
30m
mo
lC
O2
eq
. m
-2d
ay
-1
= CO2 sequestration*
= equivalent of N2O
= equivalent of N2O and CH4
Nitrate added Control
CO2 eq. for N2O CO2 eq. for CH4
and N2O
Average CO2 sequestration in wetlands*
N2O CH4 and N2O
*Source: http://cdiac.ornl.gov/SOCCR Moseman-Valtierra et al. 2011. Atmospheric Environment

…but what happens over longer time scales?
?

Two Long-term Experiments
Plum Island Sippewissett


7-8 year fertilization at Plum Island (T.I.D.E.S.)
70 mM NO3-
15X background
Map from Johnson and Fleeger et al. 2009

During a transient doubling of fertilization…
= Pre- fertilization pulse (7/12)
= Pulse of 30X Fertilization (7/17)
= Reference marsh (Unfertilized)
mm
ol N
2O
m-2
h-1
-0.5
0.5
1.5
= Post- fertilization Pulse (7/19) Pre-
Pulse
Post-
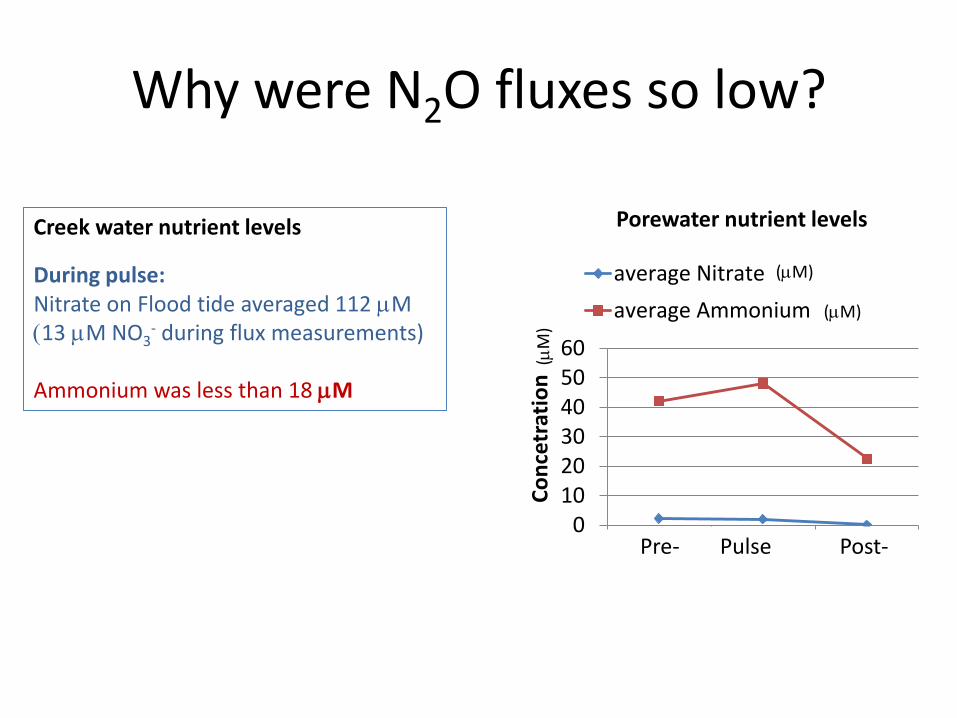
Why were N2O fluxes so low?
Porewater nutrient levels
0102030405060
1 2 3C
on
cetr
atio
n (
uM
)
average Nitrate (uM)
average Ammonium (uM)
(mM)
Creek water nutrient levels
During pulse: Nitrate on Flood tide averaged 112 mM
(13 mM NO3- during flux measurements)
Ammonium was less than 18 mM
Pre- Pulse Post-
(mM)
(mM
)

N2O fluxes reflect porewater nitrate concentrations
0 0
2.1
0.2 0
0
0.5
1
1.5
2
2.5
1 2 3 4 5mm
ol N
2O
m-2
h-1
Plot Number
0.01.02.03.04.05.06.07.08.09.0
1 2 3 4 5
nit
rite
+nit
rate
(mM
)
Plot Number

Direction of N2O flux reverses when the fertilization ceases
-0.5
0.5
1.5
-10
-9
-8
-7
-6
-5
-4
-3
-2
-1
0
1
um
ol N
2O
m-2
h-1
mm
ol N
2O
m-2
h-1
mm
ol N
2O
m-2
h-1
2010 2011

Why did results of long- and short- term experiments differ?
-20
-15
-10
-5
0
5
0 50 100 150 200
um
ol N
2O
m-2
h-1
nitrite + nitrate (mM)
Long-term N short term N

Conclusions
• Long term (7-8 year) fertilization did not affect N2O or CH4 fluxes…but nutrient concentrations were not very high and not constant.
• Marshes may be resilient! N reductions may prevent or limit GHG emissions.
Plum Island
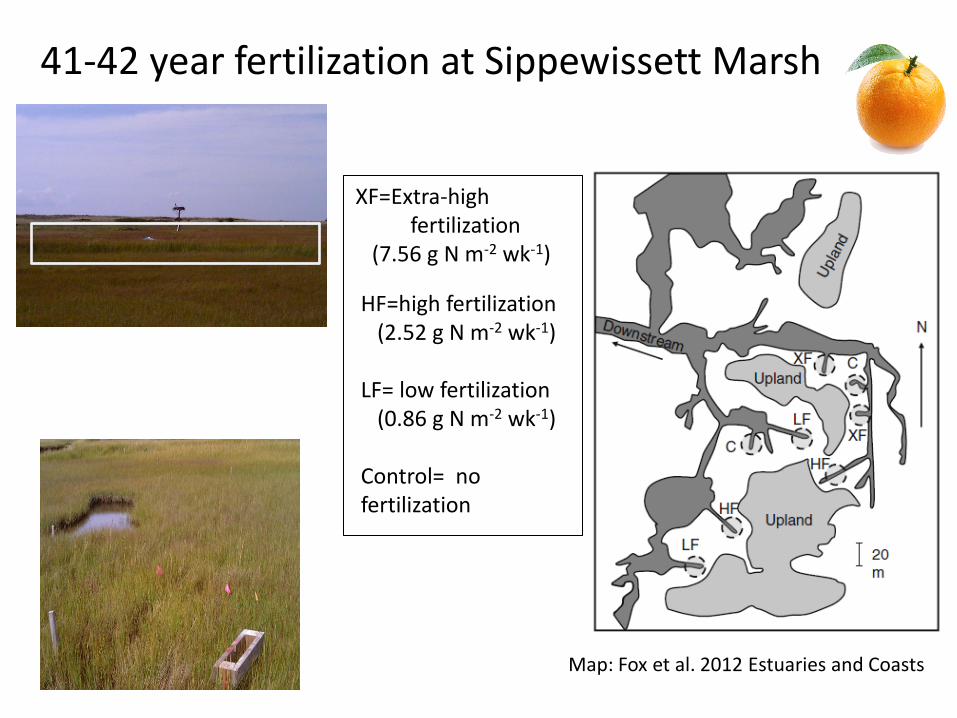
Map: Fox et al. 2012 Estuaries and Coasts
XF=Extra-high fertilization (7.56 g N m-2 wk-1)
HF=high fertilization (2.52 g N m-2 wk-1) LF= low fertilization (0.86 g N m-2 wk-1) Control= no fertilization
41-42 year fertilization at Sippewissett Marsh

N2O fluxes display spatial variability
LF, 0
-20
-15
-10
-5
0
5
mm
ol
N2O
m-2
h
-1
2010
= XHF, Extra-high fertilization (7.56 g N m-2 wk-1)
= XF (7.56 g N m-2 week-1)
= HF (2.52 g N m-2 week-1)
= LF (0.86 g N m-2 week-1)
= Control ( 0 g N m-2 week-1)
No significant differences between treatments

Nearly all N2O fluxes completely reverse directions between 2 years
-5
0
5
mm
ol
N2O
m-2
h -1
LF, 0
-20
-15
-10
-5
0
5
mm
ol
N2O
m-2
h
-1
2010 2011

Why such a difference between years?
• One possibility is temperature:
No difference over time in: Salinity, pH, Oxidation reduction
23
27.6
0
10
20
30
Tem
pe
ratu
re (
de
g. C
)
2010 2011

Highest N2O flux in plot with highest pore water ammonium
-20
-15
-10
-5
0
5
10
0 100 200 300 400
um
ol N
2O
m-2
h-1
ammonium (mM)
Sippewissett Plum Island short term N Plum Island
Combined data from 2010 and 2011 in both experiments

0
10
20
30
40
50
60
um
ol C
H4
m-2
h-1
0 0
-10
0
10
20
30
40
50
um
ol C
H4
m-2
h-1
Highest methane fluxes in plots with high fertilization (HF)
2010 2011
F3=8.89, p=0.05
12
22
0
55
0 0 0 0 0
20
40
60
1 2 3 4 5 6 7 8mm
ol C
H4 m
-2 h
-1
Plot Number
…but high variability in 2011 = XF (7.56 g N m-2 week-1)
= HF (2.52 g N m-2 week-1)
= LF (0.86 g N m-2 week-1)
= Control ( 0 g N m-2 week-1)
mm
ol C
H4 m
-2 h
-1
mm
ol C
H4 m
-2 h
-1

-40
-20
0
20
40
60
80
100
120
-200 -100 0 100 200 300 400
mm
ol C
H4 m
-2 h
-1
Oxidation-Reduction Potential (Eh)
XHF HF LF control
= XF (7.56 g N m-2 week-1)
= HF (2.52 g N m-2 week-1)
= LF (0.86 g N m-2 week-1)
= Control ( 0 g N m-2 week-1)
Soil oxidation-reduction potential
Why were methane fluxes not as large in plots with the highest fertilization (XF)?

Several questions remain
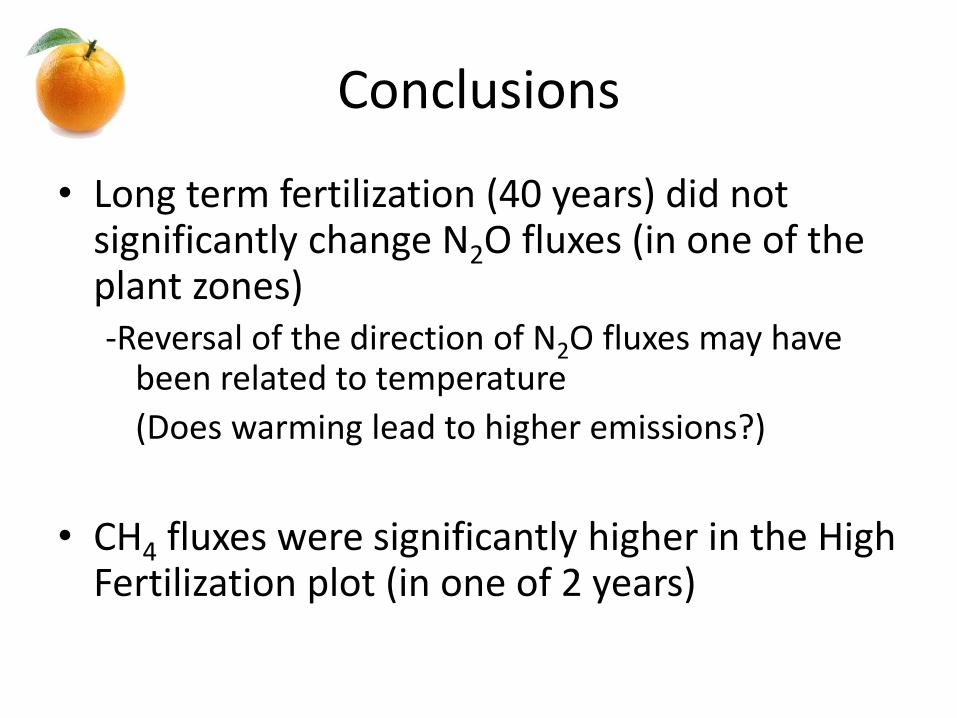
Conclusions
• Long term fertilization (40 years) did not significantly change N2O fluxes (in one of the plant zones) -Reversal of the direction of N2O fluxes may have
been related to temperature
(Does warming lead to higher emissions?)
• CH4 fluxes were significantly higher in the High Fertilization plot (in one of 2 years)
-2
-1
0
1
2
3
4
5
6
7
8
9
um
ol N
2O
m-2
h-1
2010-2011
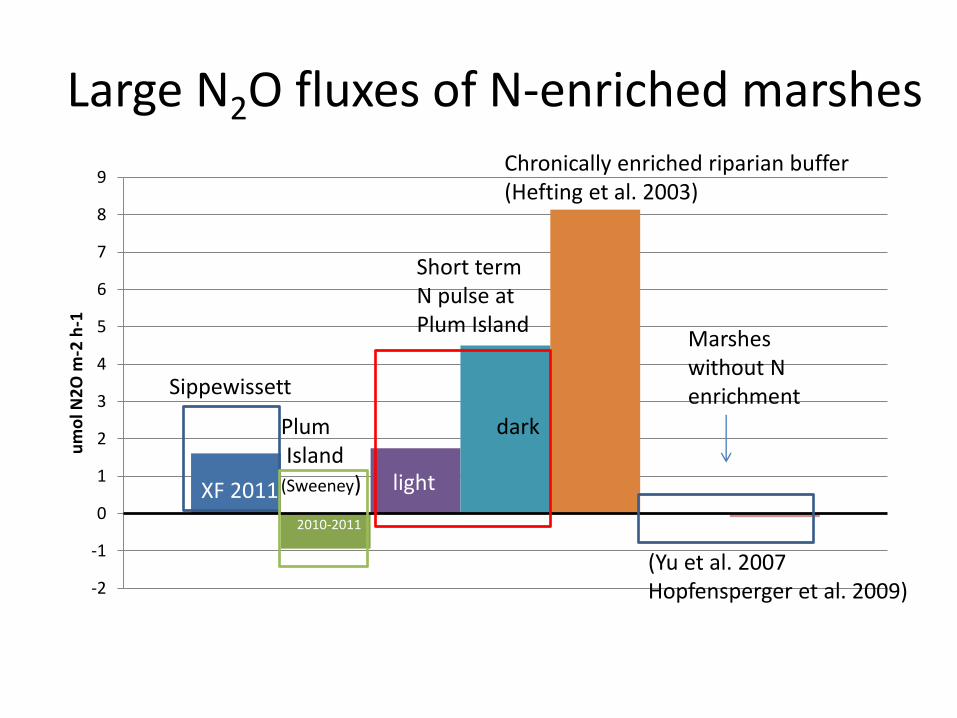
Large N2O fluxes of N-enriched marshes
Marshes without N enrichment Sippewissett
Plum Island (Sweeney)
Short term N pulse at Plum Island
Chronically enriched riparian buffer (Hefting et al. 2003)
(Yu et al. 2007 Hopfensperger et al. 2009)
light
dark
XF
XF 2011
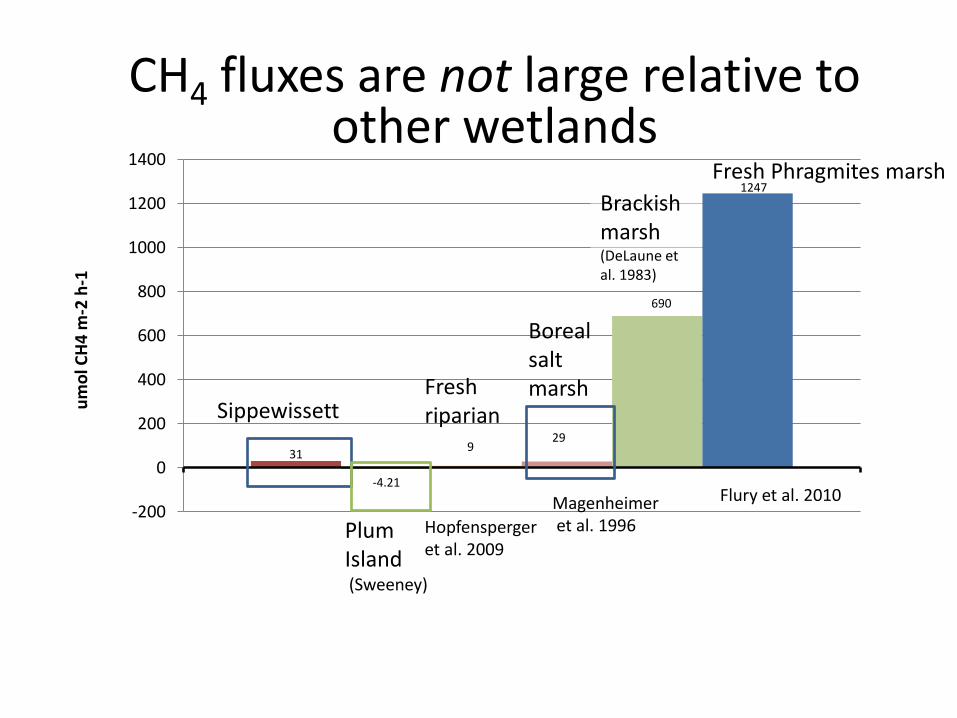
31
-4.21
9 29
690
1247
-200
0
200
400
600
800
1000
1200
1400
um
ol C
H4
m-2
h-1
Fresh riparian Hopfensperger et al. 2009
Boreal salt marsh
Brackish marsh (DeLaune et al. 1983)
Magenheimer et al. 1996
CH4 fluxes are not large relative to other wetlands
Sippewissett
Plum Island (Sweeney)
Fresh Phragmites marsh
Flury et al. 2010

Future directions: The “Real” N experiments Studying relationships of GHG fluxes to
plant zones with in situ analyzers
NERR Science Collaborative: K. Kroeger, J. Tang, O. Abdul-Aziz, N. Ganju, A. Leschen, T. Surgeon-Rogers, S. Emmett-Mattox, I.Emmer, S. Crooks, P. Megonigal, T. Walker, C. Weidman
Colors indicate distinct zones in Sage Lot Pond (Waquoit Bay)
Waquoit Bay, MA
Narragansett Bay, RI Testing potential interactions of N loading and warming
Collaborator: B. Govenar

Acknowledgements
• Students: Rosalinda Gonzalez (Woods Hole Partnership Education Program), Kelsey Fisher, David McChesney
(Boston College)
• Collaborators : Dr. Linda Deegan, Dr. Ivan Valiela,
Dr. Jianwu Tang (Marine Biological Laboratory),
Dr. Breea Govenar (Rhode Island College)
Field support: (USGS)Wally Brooks, Adrian Green, Sandy Baldwin; Kate Morkeski, David Johnson (MBL)
Nutrient Analyses: Linda Green (URI), Paul Henderson (WHOI)
• Funding: USGS Mendenhall Post-Doctoral Research Fellowship
USDA Agricultural Experiment Station and University of Rhode Island (start-up funding)
National Estuarine Research Reserve System Science Collaborative 2012-2014
Rhode Island Research Alliance Collaborative Grant 2012