lehmann edinburgh 2011 - university of...
TRANSCRIPT
Biochar Science:Progress and Hurdles to Adoption
Johannes Lehmann
Department of Crop and Soil Sciences, Cornell University
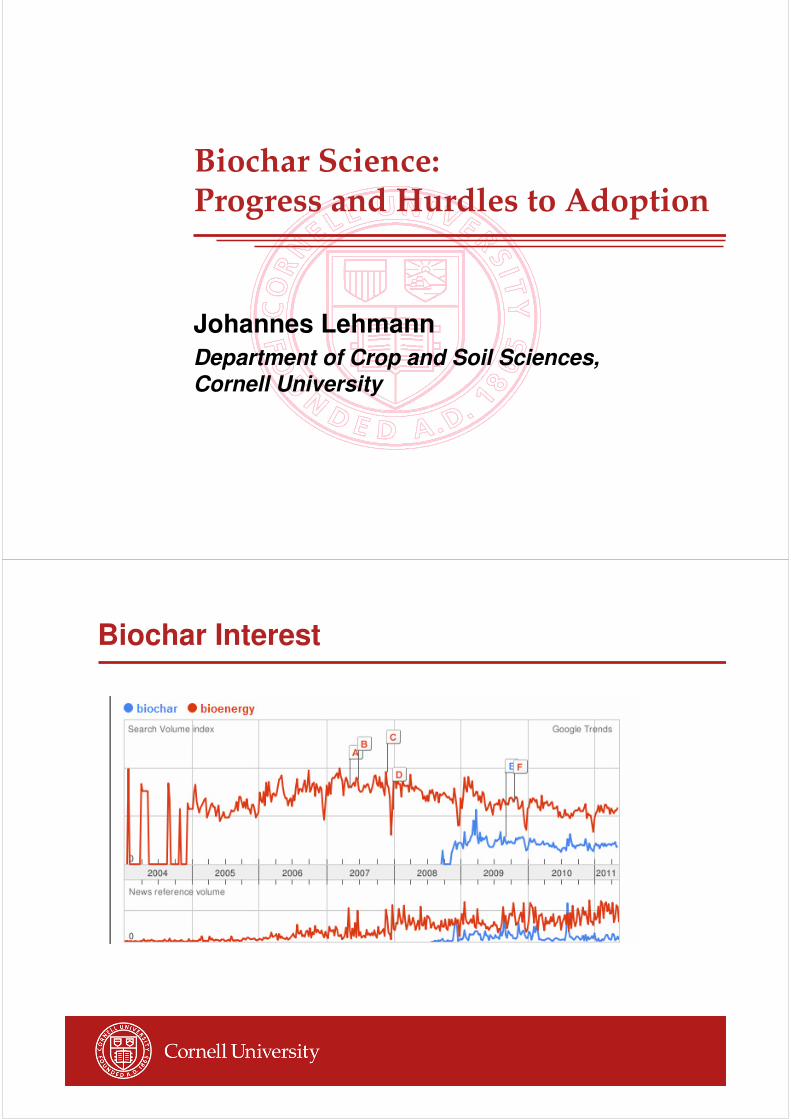
Biochar Interest

Activity in Biochar Science
2002 2003 2004 2005 2006 2007 2008 2009 2010 2011
Nu
mb
er
of
pu
blic
atio
ns in
IS
I W
eb
of
Scie
nce
0
20
40
60
80
100
120
140
160
Pro
po
rtio
n o
f b
ioch
ar
an
d c
ha
rco
al
as a
fra
ctio
n o
f co
mp
ost
(%)
0
20
40
60
80
100
Biochar
Charcoal
Biochar+charcoal
extr
apola
tion
2011: Jan-Apr
CSIRO
NRDC
DEFRA
EU-JRCCAR
Biochar book
Interest in Biochar Science
2010 downloads in the journal “Plant and Soil”
76920091-2321The rhizosphere: a playground and battlefield for soilborne pathogens and beneficial microorganisms
79720091-2321Plant root growth, architecture and function
81520101-2329Release of plant-borne flavonoids into the rhizosphere and their role in plant nutrition
83420101-2326Plant performance in stressful environments: interpreting new and established knowledge of the
roles of arbuscular mycorrhizas
88820101-2327Effects of biochar from slow pyrolysis of papermill waste on agronomic performance and soil fertility
89020091-2321Acquisition of phosphorus and nitrogen in the rhizosphere and plant growth promotion by
microorganisms
92420071-2300Mycorrhizal responses to biochar in soil â concepts and mechanisms
95120091-2320Mycorrhizal associations and other means of nutrition of vascular plants: understanding the global
diversity of host plants by resolving conflicting information and developing reliable
1,00520091-2321Plant-microbe-soil interactions in the rhizosphere: an evolutionary perspective
1,22520032255Plant growth promoting rhizobacteria as biofertilizers
Article Requests Jan to Oct 2010
YearIssueVolumeTitle

Interest in Biochar Science
Most downloaded articles in the journal “Organic Geochemistry”
Interest in Biochar Science
Most cited in the journal “Organic Geochemistry” published in the last 5 years

Biochar Entry Points
EnergyProduction
SoilImprovement
Mitigation ofClimate Change
Social, Financial Benefits
WasteManagement
Climate Change Mitigation

Climate Change Mitigation
Baldock and Smernik, 2002, Organic Geochemistry 33, 1093-1109Bruun et al., 2008, Organic Geochemistry 39, 839-845Cheng et al., 2008, Journal of Geophysical Research, 113, G02027Lehmann et al, 2008, Nature Geoscience 1, 832 - 835 Liang et al, 2008, Geochimica et Cosmochimica Acta 72, 6096-6078Kuzyakov et al., 2009, Soil Biology and Biochemistry 41, 210-219 Major et al., 2009, Global Change Biology 16, 1366-1379
About 1.5 to 2 orders of magnitude greater
than uncharred biomass
Spokas, 2010, Carbon Management 1, 289-303
Climate Change Mitigation

Climate Change Mitigation
0 300 600 900
emit.
reduct.
emit.
reduct.
emit.
reduct.
emit.
reduct.
emit.
reduct.
Greenhouse gases (kg CO2e t-1
dry feedstock)
LUC & fieldemiss.agrochems
field ops
other
stable C
avoid foss fuelgen. & comb.land-use seq.
reduced soilN2O emiss.avoid compost
La
te
sto
ve
r
Ea
rly
sto
ve
rS
witch
gra
ss B
Yard
wa
ste
Net = - 864
Net = - 793
Net = - 442
Net = + 36
Net = - 885
Sw
itch
gra
ss A
(b)0 300 600 900
emit.
reduct.
emit.
reduct.
emit.
reduct.
emit.
reduct.
emit.
reduct.
Greenhouse gases (kg CO2e t-1
dry feedstock)
LUC & fieldemiss.agrochems
field ops
other
stable C
avoid foss fuelgen. & comb.land-use seq.
reduced soilN2O emiss.avoid compost
La
te
sto
ve
r
Ea
rly
sto
ve
rS
witch
gra
ss B
Yard
wa
ste
Net = - 864
Net = - 793
Net = - 442
Net = + 36
Net = - 885
Sw
itch
gra
ss A
(b)
Roberts et al, 2010, Environmental Science and Technology 44, 827–833
Climate Change Mitigation
C Intensity of Offset Energy
CoalOilGas
Severity
of
Fert
ility
Constr
ain
ts
Biochar production in
place of combustion
is less ideal where
the system’s energy
replaces C-intensive
fuels and where soil
fertility is not a
constraint
Woolf et al, 2010, Nature Communications 1, 56

Climate Change Mitigation
Research Needs:
� Mature projects
� Long-term trials (?)
� Nitrous oxide, methane (?)
(WB Report Draft)
Climate Change Mitigation
Woolf et al, 2010, Nature Communications 1, 56
Moving beyond
global mitigation potential
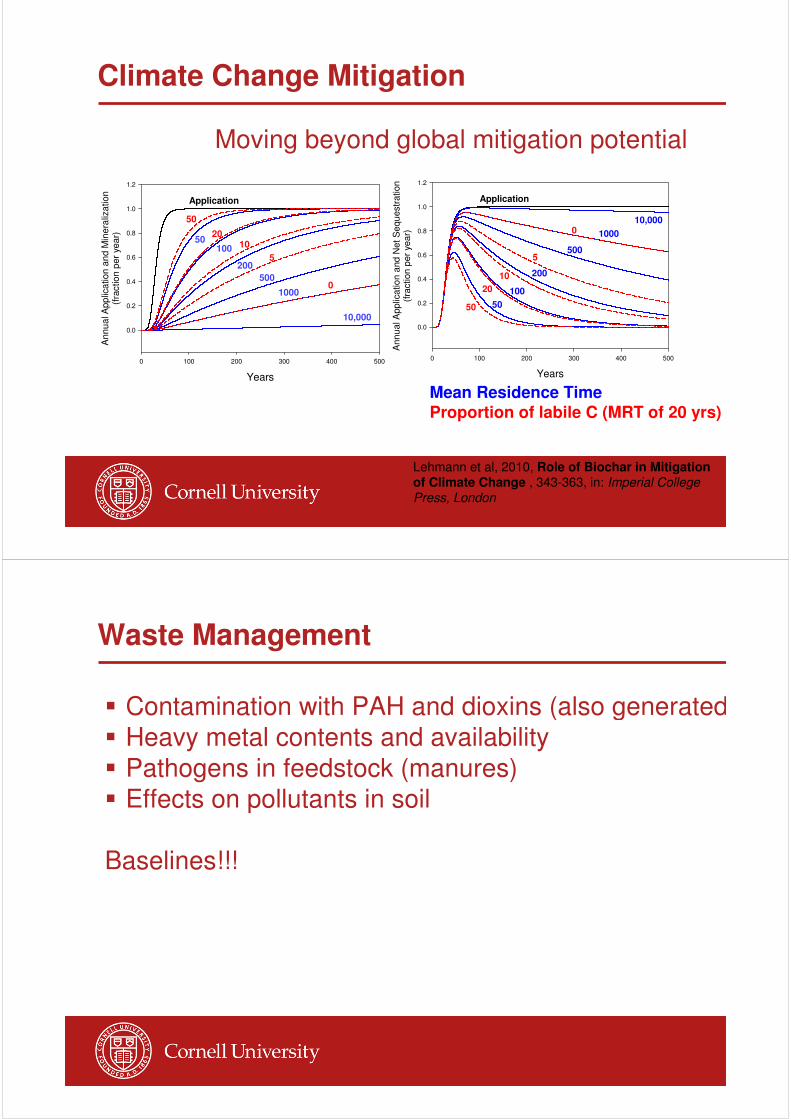
Climate Change Mitigation
Moving beyond global mitigation potential
Years
0 100 200 300 400 500
An
nu
al A
pp
lica
tio
n a
nd M
ine
raliz
atio
n(f
ractio
n p
er
yea
r)
0.0
0.2
0.4
0.6
0.8
1.0
1.2
Application
100
500
1000
10,000
50
200
50
10
5
0
20
Years
0 100 200 300 400 500
Ann
ual A
pp
lica
tio
n a
nd
Net S
equ
estr
ation
(fra
ction
per
yea
r)
0.0
0.2
0.4
0.6
0.8
1.0
1.2
Application
100
500
1000
10,000
50
200
50
10
5
0
20
Mean Residence Time
Proportion of labile C (MRT of 20 yrs)
Lehmann et al, 2010, Role of Biochar in Mitigationof Climate Change , 343-363, in: Imperial College Press, London
Waste Management
� Contamination with PAH and dioxins (also generated)
� Heavy metal contents and availability
� Pathogens in feedstock (manures)
� Effects on pollutants in soil
Baselines!!!

Bioenergy Production
Bioenergy Production
Research and Development Needs:
� Systems at scale (energy output, emissions,
economics)
� Wider environmental impact (water, air, biodiversity)
Roberts et al, 2010, Environmental Science and Technology 44, 827–833
Syngas energy sensitivity
Energy yield input 50% of
baseline (baseline)
150% of baseline
Net energy (MJ) 1509 4116 6722
% change -63% 0% 63%
Net CO2e (kg) -703 -864 -1025
% change -19% 0% 19%

Soil Improvement
Soil constraints addressed by biochar?
� Soil acidity and Al toxicity
� Low retention of plant-available water
� Low nutrient retention
� High bulk density and low penetrability
� Low infiltration
� Low inoculation by beneficial MOs (AM, BNF)
� High disease pressure
� …and growth promotion
Soil Improvement
Australia
10 t/ha biochar from paper
mill waste+ wood chips
(550°C; pH 9.4; 8.2)
Van Zwieten et al., 2010, Plant and Soil 327:235–246
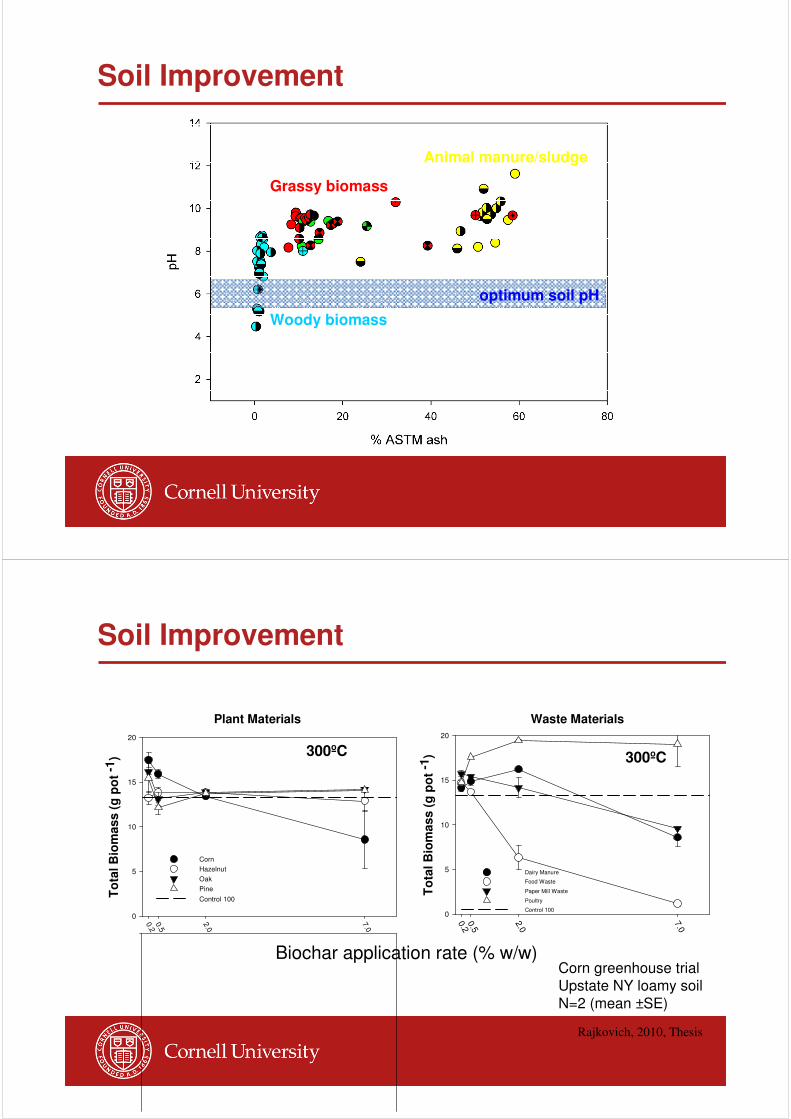
Soil Improvement
Woody biomass
Grassy biomass
Animal manure/sludge
optimum soil pH
Rajkovich, 2010, Thesis
Soil Improvement
Dairy Manure
Food Waste
Paper Mill Waste
Poultry
Control 100
0.2
0.5
2.0
7.0
To
tal B
iom
ass
(g
po
t -1
)
0
5
10
15
20
300ºC
0.20.5
2.0
7.0
To
tal B
iom
as
s (
g p
ot
-1)
0
5
10
15
20
300ºC
20 20
Corn
Hazelnut
Oak
Pine
Control 100
Waste MaterialsPlant Materials
Corn greenhouse trial
Upstate NY loamy soil
N=2 (mean ±SE)
Biochar application rate (% w/w)

Rajkovich, 2010, Thesis
Soil Improvement
Corn greenhouse trial
Upstate NY loamy soilTotal Na (mg kg-1
)
0 2000 4000 6000 8000 10000 12000 14000 16000
Bio
mass p
roduction (
g p
ot-1
)
0
5
10
15
20
25
0.2%
0.5%
2.0%
7.0%
7%, r2=0.61
2%, r2=0.50
0.5%, r2=0.01
0.2%, r2=0.06
Biochar application rate:
Organic Carbon (mg g-1
)
0 10 20 30
Cation
Exchan
ge
Cap
acity (
mm
ol c k
g-1
)
0
100
200
300
r2=0.909CEC=2.81C+9.1
r2=0.784CEC=8.60C-18.6
Anthrosols
Adjacent Soils
DS
ACU
LG
HAT
Other Anthrosols
(Sombroek et al., 1993)
Biochar-rich terra preta soils
Biochar-poor soils
Soil Improvement
Cation retention
Liang et al., 2006, Soil Sci. Soc. Am. J. 70: 1719-1730

Soil Improvement
Cation retention2 3 4 5 6 7 8 9 10 11
0
50
100
150
200
250
2 3 4 5 6 7 8 9 10 11
0
50
100
150
200
250
2 3 4 5 6 7 8 9 10
0
50
100
150
200
250
2 3 4 5 6 7 8 9 10
0
50
100
150
200
250
2 3 4 5 6 7 8 9 10
0
50
100
150
200
250
2 3 4 5 6 7 8 9 10
0
500
1000
1500
2000
2500
2 3 4 5 6 7 8 9 10
0
500
1000
1500
2000
2500
2 3 4 5 6 7 8 9 10
0
500
1000
1500
2000
2500
pH
Su
rfa
ce c
harg
e (
mm
ole
kg
C-1
)
New-BCHF
BC30
BC70 QC
NY
BC-HA
New-BCGW
CT
Negative charge
Positive charge
���������������� �������
>2000
<20 >7
<3
Cheng et al. 2008, Geochim Cosmochim Acta, 72, 1598-1610
130-year-old Biochar
(from pig iron production) in
comparison to biochar made
with traditional kilns
Laird et al, 2010, Geoderma 158, 436-442
Soil Improvement
Typic Hapludoll, IowaHardwood charcoalColumn experiment, n=6

Cheng and Lehmann, 2009, Chemosphere 75, 1021-1027
Soil Improvement
Incubation, n=2
Hydroquinone
(hydrophobic)
Soil Improvement
Nitrogen Use Efficiency?
Chan et al., 2007 AJSR 45, 629-634

Soil Improvement
Biochar application in 2007
Corn stover biochar (550°C)
Nitrogen study in 2009
N-15 labeled ammonium
Three replicatesBiochar application rate (t ha
-1)
Year
Secondary N
fertilizer (% of
recommended
fertilizer
application)
0 12
2007 50 55.7 46.6
100 68.7 58.7
2008 50 78.3 80.4
100 116.2 116.3
2009 50 72.9 69.6
100 112.3 121.6
Corn N uptake (kg ha-1)
Guerena, unpubl. data
Soil Improvement
Nitrogen Retention
Nitrogen Derived From Fertilizer (kg total N ha-1
)
-5 0 5 10 15 20 25 30 35
0
10
20
30
40
50
60
Biochar 0 (t/ha)
Biochar 12 (t/ha)
Guerena, unpubl. data
*
*

Soil Improvement
Moving beyond average responses
treatm
en
ts
Verheijen et al, 2010, EU-JRC Report
Soil Improvement
Research Needs:
� Functional relationship between biochar properties
and crop response
� Improvement of properties during pyrolysis (CEC,
surface area, pore sizes)
� Long-term field research
Complexity comparable to compost, manure or
fertilizer management!

Integrating Knowledge
Development Needs for Biochar Projects
Decision support tools for:
� Life-cycle emission reductions and energy budgets
� Functional relationship production vs properties
(that matter!)
� Business models
� Soil application
� Ethical discussion and social acceptability