dynamic fracture of concrete in compression: 3d …framcos.org/framcos-10/full-papers/234154.pdf ·...
TRANSCRIPT

10th International Conference on Fracture Mechanics of Concrete and Concrete Structures
FraMCoS-X G. Pijaudier-Cabot, P. Grassl and C. La Borderie (Eds)
1
DYNAMIC FRACTURE OF CONCRETE IN COMPRESSION: 3D FINITE ELEMENT
ANALYSIS AT MESO- AND MACRO-SCALE
S. GAMBARELLI* AND J. OŽBOLT
†
* Materials testing Institute, University of Stuttgart
Pfaffenwaldring 4c, 70569 Stuttgart, Germany
e-mail: [email protected]
† Institute of Construction Materials, University of Stuttgart
Pfaffenwaldring 4, 70569 Stuttgart, Germany
e-mail: [email protected]
Key words: impact loads, rate sensitivity, dynamic fracture, mesoscale modeling, microplane
material model
Abstract: In the present paper fracture of normal strength concrete under static and dynamic
compressive loading is numerically investigated. 3D finite element simulations are carried out at
macro- and meso-scale. At meso-scale the analysis is performed with and without accounting for
the interface zone (IZ) between aggregate and mortar. Aggregate is assumed to be linear elastic and
mortar is modeled using rate-dependent microplane model. In the framework of the study the
differences between meso- and macro-modeling approaches are investigated. It is shown that the
macroscopic analysis is principally able to account for the major effects related to the dynamic
fracture of concrete and that the IZ has not strong influence on the response of concrete. Dynamic
resistance of concrete in compression (apparent strength) depends on a number of parameters and it
is mainly influenced by the structural inertia effects that are closely related to the load induced
damage.
1 INTRODUCTION
Understanding dynamic fracture behavior
of concrete at high strain rates is fundamental
for the safety assessment and design of
concrete structures subjected to dynamic
loading (impact and blast). It is well known
that the behavior of concrete structures is
strongly influenced by the loading rate [1].
Compared to quasi-static load, concrete under
impact load acts in a different way. First, there
is a strain-rate influence on strength, stiffness,
and ductility, and, second, there is inertia
activated which influence the resistance and
failure mode of concrete. The results of
dynamic experimental tests show that after
reaching some critical strain rate concrete
resistance progressively increases with
increase of strain rate. This type of response is
typical for many different problems, e.g.
compression, direct tension, bending, pull-out
of anchors, etc. [1,2].
The compressive strength of concrete under
dynamic loading is usually tested using
hydraulic machines, drop hammers machines
and split Hopkinson pressure bars (SHPB).
The first two allow testing all shapes and sizes
of the specimens with Length/Diameter
(L/D) 2 [3]. However, they are not able to
achieve strain rates higher than 10 s-1
. The
SHPB can attain strain rates between 100÷10
4
s-1
, but the variety of dimensions of the
specimens is very small (with L/D = 0.3÷1) to

S. Gambarelli and J. Ožbolt
2
ensure the proper functioning of the setup.
Independently of the used testing technique,
all the available experimental data show that
the dynamic compressive resistance of
concrete increases with the increase of the
strain rate [4-13]. Based on the available tests
results, the compressive dynamic increase
factor (CDIF), defined as the ratio of dynamic
to static resistance, has been introduced to
derive some empirical formulae evaluating the
strength enhancement as a result of the strain
rate effect [8-11,14-16].
Although the definition of dynamic
compressive strength through the CDIF factor
has attracted considerable interest in structural
design, it should be pointed out that the
strength enhancement of concrete at high
loading rates is not a material property. As
shown in [17], a relevant scatter of the CDIF
data has been detected in all available
experimental tests. The reasons for the
contrasting results have been widely discussed,
with the conclusion that the strength
enhancement of concrete under dynamic
compressive loading is influenced by several
parameters, partially related to the material
itself and partially to the structural effects. For
relatively low loading rates the moderate
increase of resistance with increasing loading
rate is mainly controlled by the strain rate-
dependent response of concrete. This is partly
due to the inertia at material micro-scale and
partly is a consequence of the viscose response
of concrete due to the water content. These
two effects can be accounted for by the
constitutive law. However, the main reason for
the progressive increase of resistance with
increase of loading rate is activation of inertia
at the macro-scale that is due to different
reasons such as: structural inertia, inertia due
to hardening or softening of concrete, crack
propagation and crack branching [1,2,18].
When modeling at meso- or macro-scale these
effects should be automatically accounted for
[1] whereas the rate effect coming from the
material micro level should be covered by the
constitutive law. It is important to note that
principally the rate sensitive constitutive law
should not directly be compared with the
results of dynamic test. Namely, to filter out
different effects of inertia the test results must
be compared with the results of simulations,
i.e. the objective rate sensitive constitutive law
can be obtained only by fitting the test results
with the results of numerical simulation.
The 3D meso-scale modeling of concrete
under dynamic compressive loading is rarely
reported in the literature [19]. Thus, in the
present paper, the dynamic compressive
behavior of normal strength concrete, with
strain rate up to 200 s-1
, is numerically
investigated through 3D macro and meso-scale
analysis of a concrete cylinder (L/D = 2). To
investigate the influence of IZ on the concrete
response, e.g. failure mode and contribution to
CDIF, the meso-scale simulations are
performed with and without IZ. The aim of the
study is to clarify whether a meso-scale
modeling approach can provide more insights
into the dynamic compressive behavior of
concrete through explicit modeling of multiple
phases (mortar matrix, aggregate and IZ). The
paper is organized as follows. Section 2
describes the procedure to generate the meso-
scale model, the computational background
and the material parameters. In section 3 the
obtained results, in terms of stress-strain
curves (both load and reaction) and crack
patterns, are presented for static and dynamic
loading at different strain rates. The results
from the meso-analysis (without IZ) are
compared with those achieved by using macro-
scale model. The influence of IZ (meso-scale
analysis) is investigated in section 4. Finally,
in section 5 are given the main conclusions.
2 GENERATION OF MESO-SCALE FE
MODEL
2.1 Random aggregate structure in
concrete
To generate the meso-scale structure of
concrete, the coarse aggregate with a specific
size distribution, is randomly distributed inside
the concrete cylinder, by using a simple
generation procedure implemented in Matlab
R2013b. The procedure is based on two
distance criteria: the first one prevents any
contact between the generated particles and the

S. Gambarelli and J. Ožbolt
3
external boundaries of the cylinder and the
second one avoids the intersection between
adjacent particles (assumed spherical). As
mentioned in the introduction, the meso-scale
model is generated with and without interface
zone (IZ) between aggregate and mortar. To
guarantee the same aggregate distribution in
both, bi- and three-phase meso-scale models,
the thickness of IZ is accounted for in the
above mentioned criteria.
The size distribution of the coarse aggregate
is determined by using the Fuller curve (Eq.
1):
( ) (
)
(1)
where is the diameter of each granulometric
class, ( ) is the corresponding passing
amount (%), is the maximum aggregate
diameter and is the exponent of the chosen
granulometric curve. The number of particles
of each granulometric class is determined as
follows: (1) based on the given values of
and , the passing amount ( ) is evaluated
using Eq. 1; (2) The retained amount (%) is
then calculated as the difference between the
adjacent classes’ passing; (3) Knowing the
retained percent of every class, the total
volume of the class and the corresponding
number of aggregates are evaluated and (4)
Spherical particles are randomly placed in the
domain, guaranteeing no intersection between
any of them.
Figure 1: Insertion of particles in the cylinder (three
different granulometric sizes)
Based on three different granulometric classes
( = 5, 7.5, 10 mm), spheres are inserted from
largest to smallest (Fig. 1).
The generated meso-scale models are
shown in Fig. 2, where the volume fraction of
28% of the coarse aggregate
(5 mm ≤ d ≤ 10 mm) is reproduced. The
geometry of the created meso-models was
finally imported into the 3D FE code MASA
[20] used for the simulations and meshed with
approximately 106 solid four-node constant
strain finite elements. The same as for the
mortar, macro-scale finite element
discretization was performed using constant
strain four-node finite elements.
a)
b)
Figure 2: Concrete meso-structure: a) bi-phase material;
b) three-phase material
2.2 Material properties
In the meso-scale 3D FE analysis the
constitutive laws for mortar and IZ are based
on the rate-dependent microplane model
proposed by Ožbolt et al. [21], while the
aggregate is considered as linear elastic with
Young’s modulus of 60 GPa and Poisson’s
number 0.18 (limestone). The ratio of the
elastic moduli of the aggregate and matrix
phases is set at 3:1, with E = 20 GPa. The
strength and fracture energy of the IZ are
chosen to be approximately 50% of that of
mortar. As shown in [22] the Young´s
modulus of IZ is comparable to that of mortar.
The material properties used for the macro and
the meso-scale analysis are summarized in
Table 1. It is worth mentioning that in both
S. Gambarelli and J. Ožbolt
4
modeling approaches the model parameters
have been calibrated to correctly reproduce the
uniaxial compressive behavior of normal
strength concrete (see section 3).
Table 1: Material properties (macro- vs. meso-model)
Mechanical
properties
Macro-model Meso-model
Concrete Aggr. Mortar IZ
E [GPa] 37.0 60.0 20.0 20.0
ν 0.18 0.18 0.18 0.18
fc [MPa] 23.0 / 26.0 13.0
ft [MPa] 2.3 / 2.6 1.3
GF [J/m2] 60 / 20 10
[T/ m3] 2.3 2.7 2.1 2.1
2.3 Rate-dependent microplane model and
3D FE analysis
In the numerical simulations as a
constitutive law the rate sensitive microplane
model [21] is employed. In the model the
influence of strain rate is accounted for
through two effects: (1) the rate dependency
due to viscosity of the bulk material and (2)
the rate dependent growth of micro-cracks.
The influence of structural inertia effects on
the rate dependency is not a part of the
constitutive law, however, it is automatically
accounted for in the dynamic analysis. In the
microplane model macroscopic response is
obtained by integrating normal and shear
microplane stresses overall microplanes. The
rate independent microplane stress
components ( ) ( stands for
microplane volumetric, deviatoric and shear
components, respectively) are calculated from
the known microplane strains using pre-
defined microplane uniaxial stress-strain
constitutive relations [23]. The strain rate
independent model parameters are: Young´s
modulus, Poisson´s ratio, uniaxial compressive
and tensile strengths and fracture energy. The
rate effect on each microplane component is of
the same type as proposed by Bažant et al.
[24,25].
Static analysis is performed based on the
implicit solution scheme whereas in transient
3D dynamic FE analysis the direct integration
scheme of explicit type is performed. To get
mesh objective results regularization scheme
based on the crack band approach is used [26].
3 INFLUENCE OF STRAIN RATE ON
THE CONCRETE COMPRESSIVE
FAILURE: MACRO- VS. MESO-
ANALYSIS
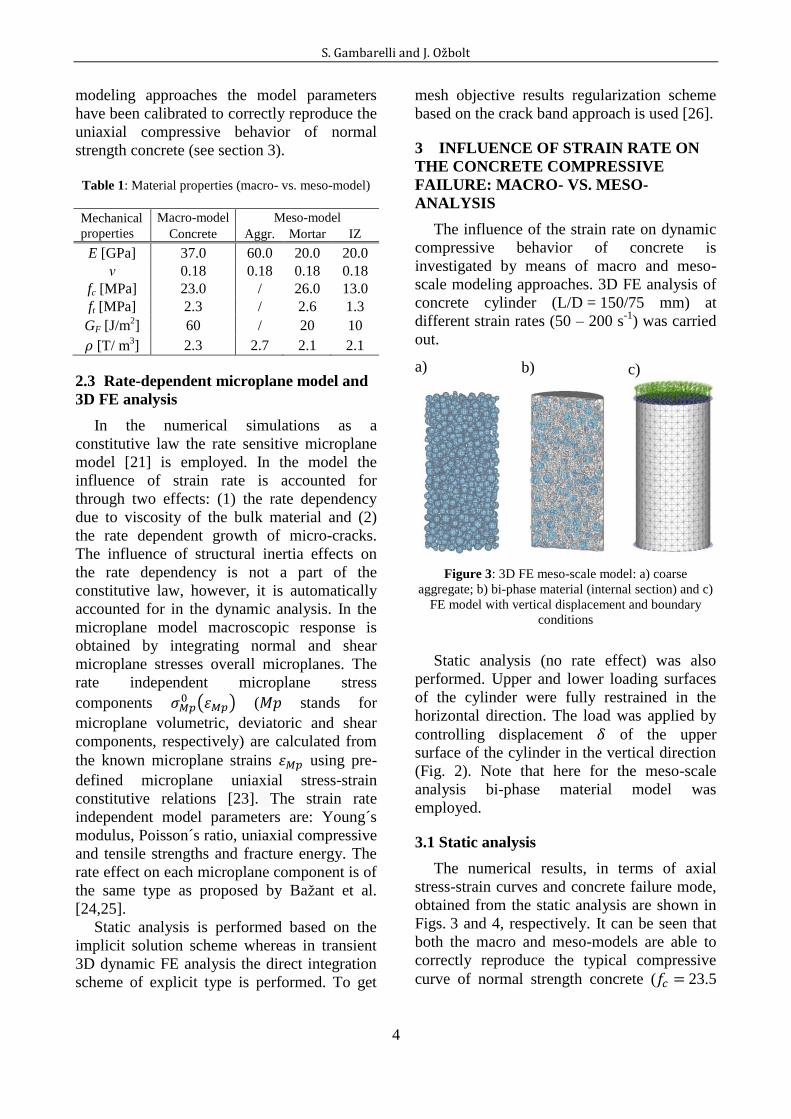
The influence of the strain rate on dynamic
compressive behavior of concrete is
investigated by means of macro and meso-
scale modeling approaches. 3D FE analysis of
concrete cylinder (L/D = 150/75 mm) at
different strain rates (50 – 200 s-1
) was carried
out.
a)
b)
c)
Figure 3: 3D FE meso-scale model: a) coarse
aggregate; b) bi-phase material (internal section) and c)
FE model with vertical displacement and boundary
conditions
Static analysis (no rate effect) was also
performed. Upper and lower loading surfaces
of the cylinder were fully restrained in the
horizontal direction. The load was applied by
controlling displacement of the upper
surface of the cylinder in the vertical direction
(Fig. 2). Note that here for the meso-scale
analysis bi-phase material model was
employed.
3.1 Static analysis
The numerical results, in terms of axial
stress-strain curves and concrete failure mode,
obtained from the static analysis are shown in
Figs. 3 and 4, respectively. It can be seen that
both the macro and meso-models are able to
correctly reproduce the typical compressive
curve of normal strength concrete ( 23.5

S. Gambarelli and J. Ožbolt
5
MPa, 0.0025, E = 27 GPa) for pre and
post-peak responses (Fig. 4).
Figure 4: Static uniaxial compressive test: average
stress-strain curve
a) Meso-scale analysis
b) Macro-scale analysis
Figure 5: Typical failure mode obtained in the static FE
analysis: a) mesoscale and b) macroscale
Note that the internal microplane model
parameters where chosen such that static
meso- and macro-scale 3D FE analyses give
approximately the same response. The typical
failure mode obtained in the static analysis is
shown in Fig. 5. Damage in a) mortar and b)
concrete is represented in terms of maximum
principal strains, where the red zones
correspond to the crack width of 0.15 mm or
greater. Due to the fixed boundary conditions,
diagonal shear failure takes place at the mid of
the cylinder height. To show the internal
damage distribution the specimen has been cut
at mid-section. Similarly as in the experiments,
it is possible to recognize the typical hourglass
shape of concrete at a final stage of the loading
history.
3.2 Dynamic analysis
As mentioned before, the direct integration
scheme of explicit type was employed in the
dynamic analysis, with damping set to 1000 [N
s/mm]. The relatively high value appeared to
be necessary because of numerical reasons, i.e.
to get the explicit algorithm stable and to
prevent local oscillations. The analysis was
performed at high strain rate (50 200 s-1
).
The summary of the calculated compressive
resistances (loads and reactions) is reported in
Table 3. Due to the high loading rates the
compressive resistances at loaded top of the
cylinder (apparent strength) from the dynamic
analysis are significantly higher than the static
strength of concrete. However, it can be also
seen that the resistance on the reaction
(bottom) side of the specimen is only slightly
higher than the static strength of the specimen
and, as will be shown below, it approximately
follows the rate-dependent constitutive law.
Actually, the loading stress is much higher
than the reaction stress because it must be in
equilibrium with structural inertia that is
generated as a consequence of concrete
damage. This is the same effect as discussed in
[2] for the case of uniaxial tension.
From Table 2 can also be seen that the
resistance at the loaded side of the cylinder is
consistently higher in case of macro-scale
model than for the meso-scale model. The
reason is due to the fact that the aggregate is
linear elastic, i.e. no inertia and rate sensitivity
due to damage is generated. Actually, these
differences in the apparent strength between

S. Gambarelli and J. Ožbolt
6
two approaches can be attributed to the effect
of inertia induced through the inhomogeneity
of concrete, which is in the meso-scale model
automatically accounted and in the macro-
scale model should be explicitly covered by
the rate dependent constitutive law.
Consequently, one should here modify the rate
dependent model for microplane at macro-
scale (parameters c1 and c2 in Eq. 2) such that
the macro model gives the same result as the
meso-scale model. Note that this was not done
in the following computations using macro-
scale model since the aim here was only to
demonstrate that the macro-scale approach is
able to principally correctly account for the
phenomena related to dynamic fracture of
concrete in compression.
Table 2: dynamic analysis – summary of the calculated
apparent strength [MPa]
FE Analysis no
rate
50
[ s-1
]
100
[ s-1
]
150
[ s-1
]
200
[ s-1
]
Macro
scale
Load 23.3 66.8 120.9 170.4 218.5
Reac. 23.3 45.2 39.4 42.2 67.6
Meso
scale
Load 23.8 56.2 100.3 137.1 173.1
Reac. 23.8 46.8 54.9 58.1 60.0
The typical stress-strain curves for the
analyzed strain rates are plotted in Fig. 6. In
each graph, both loading and reaction stresses
are plotted against the average axial strain. The
results from the macro analysis (black curves)
are compared with those obtained at meso-
scale (red curves). In both cases there is a
progressive increase of the loading
compressive stress with the increase of loading
rate. However, as mentioned above, the
reaction stresses are increasing only slightly
with the loading rate. Moreover, it can be seen
(Fig. 6) that the reaction stress is even not
activated at the time when the loading stress
reaches its maximum. When increasing the
loading rate, the observed delay in the
activation of the reaction stress, expressed in
terms of average strains, also increases. Note
that in terms of time the activation of reaction
stress is approximately the same in all cases
and it is in the range of 3.2x10⁻⁵
s.
a)
b)
c)
d)
Figure 6: Calculated average stress-average strain
curves at different loading rates: a) 50 s-1
; b) 100 s-1
; c)
150 s-1
and d) 200 s-1
S. Gambarelli and J. Ožbolt
7
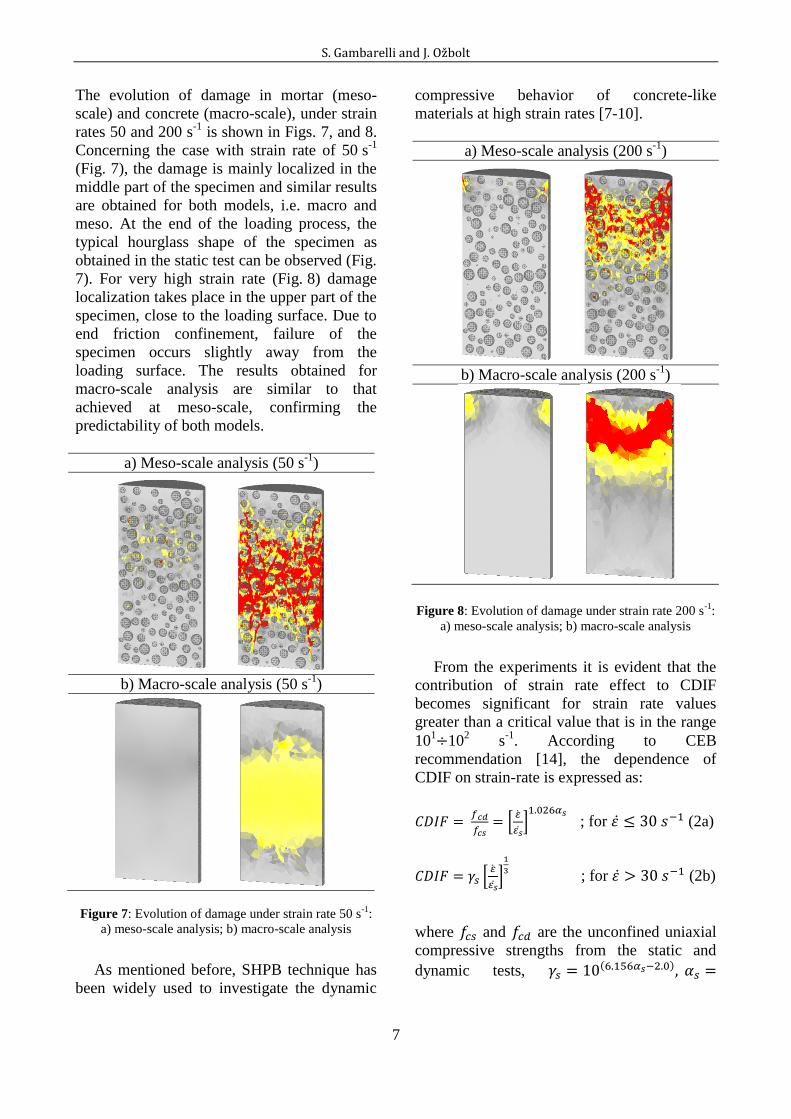
The evolution of damage in mortar (meso-
scale) and concrete (macro-scale), under strain
rates 50 and 200 s-1
is shown in Figs. 7, and 8.
Concerning the case with strain rate of 50 s-1
(Fig. 7), the damage is mainly localized in the
middle part of the specimen and similar results
are obtained for both models, i.e. macro and
meso. At the end of the loading process, the
typical hourglass shape of the specimen as
obtained in the static test can be observed (Fig.
7). For very high strain rate (Fig. 8) damage
localization takes place in the upper part of the
specimen, close to the loading surface. Due to
end friction confinement, failure of the
specimen occurs slightly away from the
loading surface. The results obtained for
macro-scale analysis are similar to that
achieved at meso-scale, confirming the
predictability of both models.
a) Meso-scale analysis (50 s-1
)
b) Macro-scale analysis (50 s
-1)
Figure 7: Evolution of damage under strain rate 50 s-1
:
a) meso-scale analysis; b) macro-scale analysis
As mentioned before, SHPB technique has
been widely used to investigate the dynamic
compressive behavior of concrete-like
materials at high strain rates [7-10].
a) Meso-scale analysis (200 s-1
)
b) Macro-scale analysis (200 s
-1)
Figure 8: Evolution of damage under strain rate 200 s-1
:
a) meso-scale analysis; b) macro-scale analysis
From the experiments it is evident that the
contribution of strain rate effect to CDIF
becomes significant for strain rate values
greater than a critical value that is in the range
101 10
2 s
-1. According to CEB
recommendation [14], the dependence of
CDIF on strain-rate is expressed as:
[
]
; for (2a)
[
]
; for (2b)
where and are the unconfined uniaxial
compressive strengths from the static and
dynamic tests, ( )
S. Gambarelli and J. Ožbolt
8
( ⁄ )⁄ and
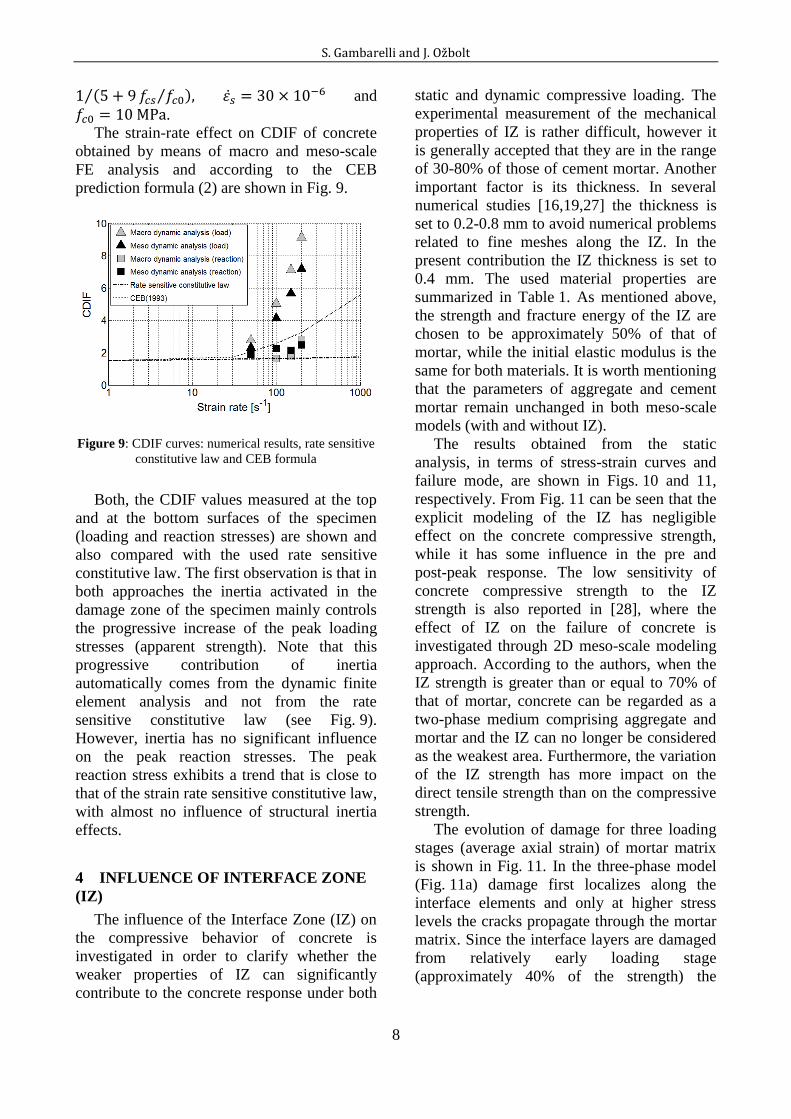
. The strain-rate effect on CDIF of concrete
obtained by means of macro and meso-scale
FE analysis and according to the CEB
prediction formula (2) are shown in Fig. 9.
Figure 9: CDIF curves: numerical results, rate sensitive
constitutive law and CEB formula
Both, the CDIF values measured at the top
and at the bottom surfaces of the specimen
(loading and reaction stresses) are shown and
also compared with the used rate sensitive
constitutive law. The first observation is that in
both approaches the inertia activated in the
damage zone of the specimen mainly controls
the progressive increase of the peak loading
stresses (apparent strength). Note that this
progressive contribution of inertia
automatically comes from the dynamic finite
element analysis and not from the rate
sensitive constitutive law (see Fig. 9).
However, inertia has no significant influence
on the peak reaction stresses. The peak
reaction stress exhibits a trend that is close to
that of the strain rate sensitive constitutive law,
with almost no influence of structural inertia
effects.
4 INFLUENCE OF INTERFACE ZONE
(IZ)
The influence of the Interface Zone (IZ) on
the compressive behavior of concrete is
investigated in order to clarify whether the
weaker properties of IZ can significantly
contribute to the concrete response under both
static and dynamic compressive loading. The
experimental measurement of the mechanical
properties of IZ is rather difficult, however it
is generally accepted that they are in the range
of 30-80% of those of cement mortar. Another
important factor is its thickness. In several
numerical studies [16,19,27] the thickness is
set to 0.2-0.8 mm to avoid numerical problems
related to fine meshes along the IZ. In the
present contribution the IZ thickness is set to
0.4 mm. The used material properties are
summarized in Table 1. As mentioned above,
the strength and fracture energy of the IZ are
chosen to be approximately 50% of that of
mortar, while the initial elastic modulus is the
same for both materials. It is worth mentioning
that the parameters of aggregate and cement
mortar remain unchanged in both meso-scale
models (with and without IZ).
The results obtained from the static
analysis, in terms of stress-strain curves and
failure mode, are shown in Figs. 10 and 11,
respectively. From Fig. 11 can be seen that the
explicit modeling of the IZ has negligible
effect on the concrete compressive strength,
while it has some influence in the pre and
post-peak response. The low sensitivity of
concrete compressive strength to the IZ
strength is also reported in [28], where the
effect of IZ on the failure of concrete is
investigated through 2D meso-scale modeling
approach. According to the authors, when the
IZ strength is greater than or equal to 70% of
that of mortar, concrete can be regarded as a
two-phase medium comprising aggregate and
mortar and the IZ can no longer be considered
as the weakest area. Furthermore, the variation
of the IZ strength has more impact on the
direct tensile strength than on the compressive
strength.
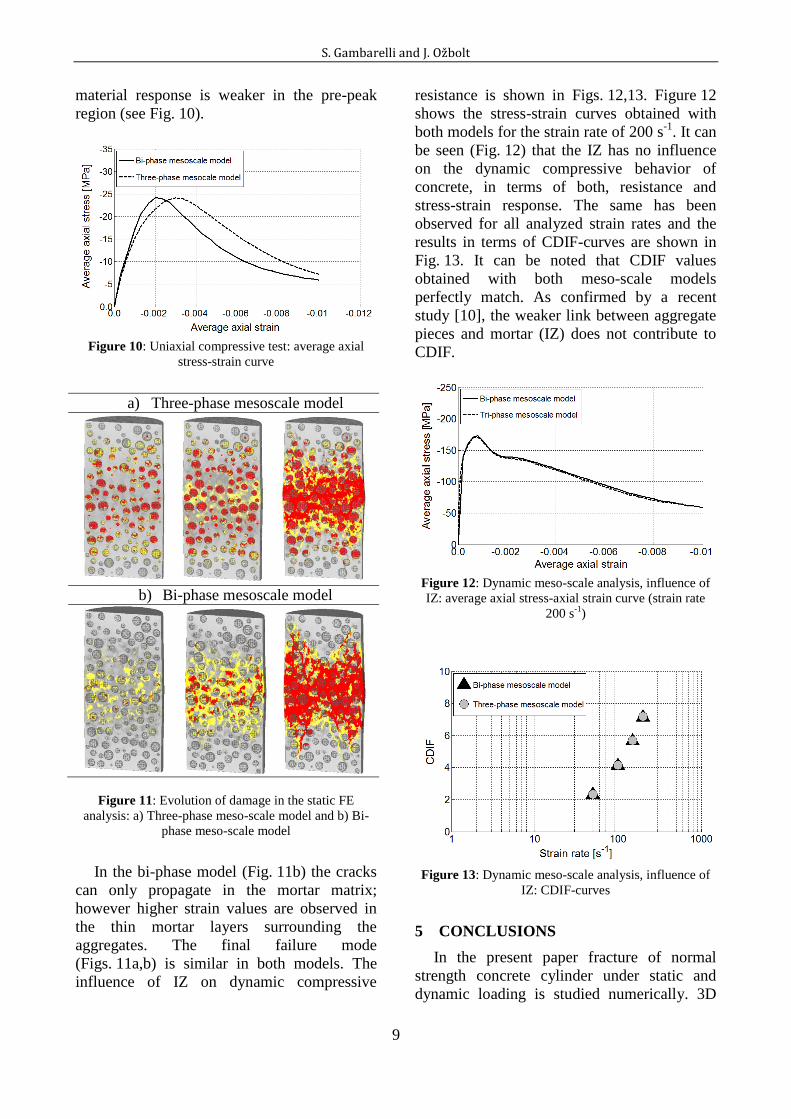
The evolution of damage for three loading
stages (average axial strain) of mortar matrix
is shown in Fig. 11. In the three-phase model
(Fig. 11a) damage first localizes along the
interface elements and only at higher stress
levels the cracks propagate through the mortar
matrix. Since the interface layers are damaged
from relatively early loading stage
(approximately 40% of the strength) the
S. Gambarelli and J. Ožbolt
9
material response is weaker in the pre-peak
region (see Fig. 10).
Figure 10: Uniaxial compressive test: average axial
stress-strain curve
a) Three-phase mesoscale model
b) Bi-phase mesoscale model
Figure 11: Evolution of damage in the static FE
analysis: a) Three-phase meso-scale model and b) Bi-
phase meso-scale model
In the bi-phase model (Fig. 11b) the cracks
can only propagate in the mortar matrix;
however higher strain values are observed in
the thin mortar layers surrounding the
aggregates. The final failure mode
(Figs. 11a,b) is similar in both models. The
influence of IZ on dynamic compressive
resistance is shown in Figs. 12,13. Figure 12
shows the stress-strain curves obtained with
both models for the strain rate of 200 s-1
. It can
be seen (Fig. 12) that the IZ has no influence
on the dynamic compressive behavior of
concrete, in terms of both, resistance and
stress-strain response. The same has been
observed for all analyzed strain rates and the
results in terms of CDIF-curves are shown in
Fig. 13. It can be noted that CDIF values
obtained with both meso-scale models
perfectly match. As confirmed by a recent
study [10], the weaker link between aggregate
pieces and mortar (IZ) does not contribute to
CDIF.
Figure 12: Dynamic meso-scale analysis, influence of
IZ: average axial stress-axial strain curve (strain rate
200 s-1
)
Figure 13: Dynamic meso-scale analysis, influence of
IZ: CDIF-curves
5 CONCLUSIONS
In the present paper fracture of normal
strength concrete cylinder under static and
dynamic loading is studied numerically. 3D
S. Gambarelli and J. Ožbolt
10
finite element analysis was performed at meso
and macro scale. Based on the results of the
simulations the following can be concluded: (i)
It is shown that for higher strain rates there is a
progressive increase of resistance. However,
this is the case only for the loading part of the
cylinder. In contrary to this, the resistance on
the reaction side of the specimen
approximately follows the rate sensitive
constitutive law. The main reason for
progressive increase of resistance is damage-
induced inertia which is automatically
accounted for in dynamic finite element
analysis; (ii) It is demonstrated that macro-
scale approach is able to correctly predict
dynamic compressive fracture of concrete. The
failure mode in meso- and macro-scale
approach is principally the same, however, the
resistance of the macro model is slightly
higher. The reason is due to the fact that in the
meso-scale analysis the aggregates exhibit no
damage and no rate sensitivity (linear elastic);
(iii) The interface zone (IZ) has relatively
small influence on the compressive response
of concrete. This was observed for static and
dynamic loading conditions.
REFERENCES
[1] Ožbolt J., Bošniak J. and Sola E., 2013.
Dynamic fracture of concrete compact
tension specimen: experimental and
numerical study. Int. J. Solids Struct.
50:4270-4278.
[2] Ožbolt J., Sharma A., Irhan B. And Sola
E., 2014. Tensile behavior of concrete
under high loading rates. Int. J. Impact
Engng. 69:55-68.
[3] Pająk M., 2001. The influence of the
strain rate on the strength of concrete
taking into account the experimental
techniques. Architecture civil engineering
environment. 3:77-86.
[4] Abrams D.A., 1917. Effect of rate of
application of load on the compressive
strength of concrete. ASTM J. 17:364-377.
[5] Evans R.H., 1942. Effect of rate of
loading on the mechanical properties of
some materials. J. Inst. Civil. Engrs.
[6] Hughes B.P. and Watson A.J., 1978.
Compressive strength and ultimate strain
of concrete under impact loading. Ibid.
30(105):189-199.
[7] Malvern L.E. and Ross C.A., 1985.
Dynamic response of concrete and
concrete structures. Second Annual
Technical Report. AFOSR contr. No.
F49620-83-K007.
[8] Ross C.A., Thompson P.Y. and Tedesco
JW., 1989. Split-Hopkinson pressure-bar
tests on concrete and mortar in tension
and compression. ACI Mater. J. 86:475-
481.
[9] Tedesco J.W. and Ross C.A., 1998.
Strain-dependent constitutive equations
for concrete. ASME. 120:398-405.
[10] Grote D.L., Park S.W. and Zhou M.,
2001. Dynamic behavior of concrete at
high strain-rates and pressures: I.
Experimental characterization. Int. J.
Impact Engng. 25:869-886.
[11] Hao Y., Hao H., Jiang G.P. and Zhou Y.,
2013. Experimental confirmation of some
factors influencing dynamic concrete
compressive strengths in high-speed
impact tests. Cement and Concrete
Research. 52:63-70.
[12] Salloum Y.A., Almusallam T., Ibrahim
S.M., Abbas H. and Alsayed S., 2015.
Rate dependent behavior and modeling of
concrete based on SHPB. Cement &
Concrete Composites. 55:34-44.
[13] Chen X.W., Lv T. and Chen G., 2018.
Experimental and Numerical Studies on
the Dynamic Behaviors of Concrete
Materials Based on the Waveform
Features in SHPB Tests. EPJ Web of
Conferences (DYMAT) 2018.

S. Gambarelli and J. Ožbolt
11
[14] Comite Euro-International du Beton 1993.
CEB-FIP model code 1990. Redwood
Books, Trowbridge, Wiltshire, UK.
[15] Li Q.M. and Meng H., 2003. About the
dynamic strength enhancement of
concrete-like materials in a split
Hopkinson pressure bar test. Int. J. Solids
Struct. 40:343-360.
[16] Hao Y., Hao H. and Li Z.X., 2013.
Influence of end friction confinement on
impact tests of concrete material at high
strain rate. In. J. Impact. Engng. 60:82-
106.
[17] Bishoff P.H. and Perry S.H., 1991.
Compressive behavior of concrete at high
strain rates. Materials and Structures.
24:425-450.
[18] Sharma A. And Ožbolt J., 2014. Influence
of high loading rates on behavior of
reinforced concrete beams with different
aspect ratios–A numerical study.
Engineering Structures. 79:297-308.
[19] Huang Y., Zhenjun Y. and Guohua L.,
2016. X-ray computed tomography
image-based meso-scale dynamic fracture
of concrete under compression: monte
carlo simulations. Proc. of the 9th Inter.
Conf. on Fract. Mech. of Conc. & Conc.
Struct (FraMCoS-9),
[20] Ožbolt J., 1998. MASA – Macroscopic
Space Analysis. Internal Report, Institute
für Werkstoffe im Bauwesen, Universität
Stuttgart, Germany.
[21] Ožbolt J., Sharma A. and Reinhardt H.W.,
2011. Dynamic fracture of concrete -
compact tension specimen. Int. Jr. Solids
Struct. 48:1534-1543.
[22] Mondal P., Shah S.P. and Marks L.D.,
2009. Nanomechanical properties of
interfacial transition zone in concrete.
Proc. of Nanotechnology in Construction
3, Springer:315–320.
[23] Ožbolt J., Li Y. and Kožar I., 2001.
Microplane model for concrete with
relaxed kinematic constraint. Int. J. Solids
Struct. 38:2683-2711.
[24] Bažant Z.P., Adley M.D., Carol I., Jirasek
M., Akers S.A., Rohani B. et al. 2000a.
Large-strain generalization of microplane
model for concrete and application. J.
Engg. Mech. (ASCE). 126(9):971-980.
[25] Bažant Z.P., Caner F.C., Adley M.D. and
Akers S.A. 2000b. Fracturing rate effect
anmd creep in microplane model for
dynamics. J. Engg. Mech. (ASCE).
126(9):962-970.
[26] Bažant Z.P. and Oh B.H., 1983. Crack
band theory for fracture of concrete.
Materials and Structures, RILEM.
16(93):155-177.
[27] Song Z and Lu Y., 2012. Mesoscopic
analysis of concrete under excessively
high strain rate compression and
implications on interpretation of test data.
Int. J. Impact Engng. 46:41-55.
[28] Zhang S., Zhang C., Liao L. and Wang C.,
2018. Numerical study of the effect of ITZ
on the failure behavior of concrete by
using particle element modelling.
Construction and Building Materials
170:776-789.