dynamic biogeochemistry of mercury in the near bank soil zone file• collected and analyzed 6 soil...
TRANSCRIPT
Dynamic Biogeochemistry of Mercury in the Near Bank Soil Zone
Olesya Lazareva and Donald L. Sparks(University of Delaware)
South River Science Team Expert Panel Meeting October 9, 2013

• Collected and analyzed 6 soil cores including duplicates (57 soil samples total)
• Installed redox, soil moisture/temperature probes and pressure transducers (water level, temperature and conductivity)
• Downloaded and analyzed continuous data set for about 5 months
• Installed, developed and sampled piezometers and stream water
Program Update at RRM 3.5, South River, VA
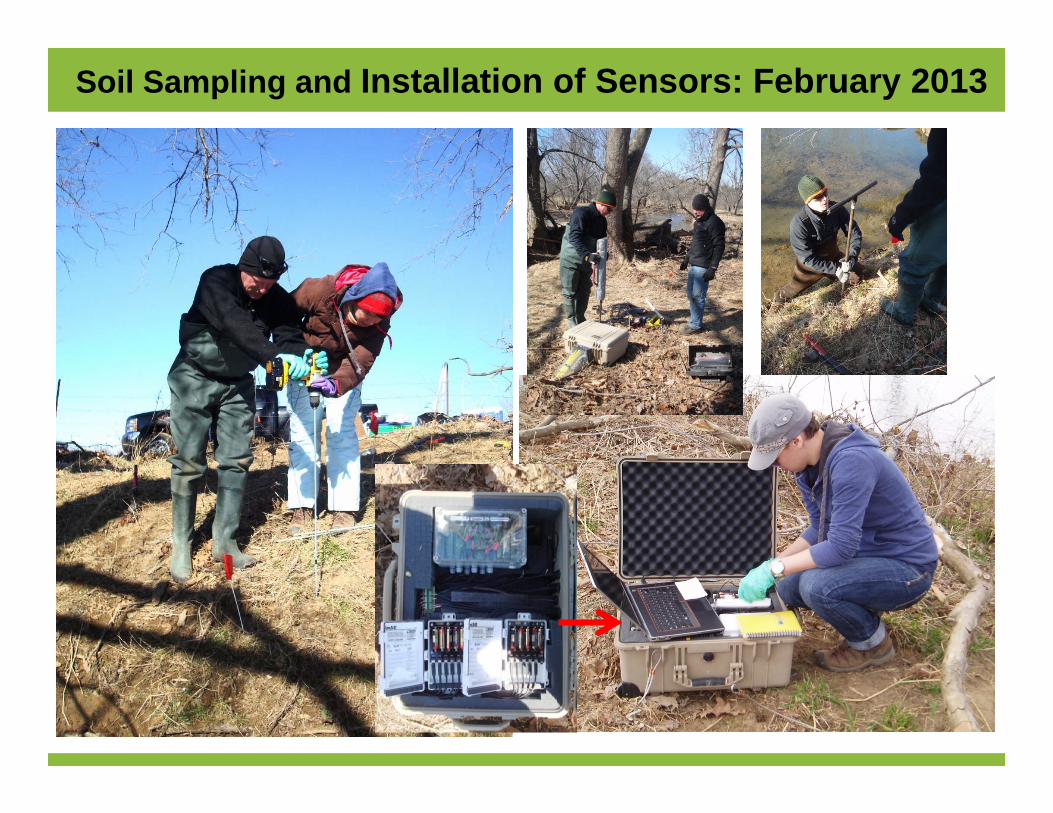
Soil Sampling and Installation of Sensors: February 2013

Installation of Sensors and Piezometers: April-May 2013
P2B
P1AP1B
R2 (C, D)
R1 (A, B, E)
P5 (A, B)
Stilling Well
Reference ProbeDatalogger
Barologger

Water Sampling: July 2 and October 1, 2013Collected and field filtered (0.45 um) water samples from piezometers and stream for:• MeHg• THg• DOC• Fe, Mn, Na• Alkalinity• Ammonia-N• Total P• δ18O and δD• Anions (SO4, Cl, NO3, NO2, PO4)
CHEMetrics V-2000 Multi-AnalytePhotometer
* Majority of shallow wells were dry
Samples Date Time pH Temp Cond ORP DO S2- Fe2+ Mn
°C mS/cm mV
Stream 7/2/2013 7:10 PM 7.8 20.5 0.2 -69.6 7.3 0.1 0.0Stream 10/1/2013 5:10 PM 8.1 18.9 0.3 -67.6 11.9 0.1 0.1 0.1P2-B 7/2/2013 5:26 PM 6.9 17.6 0.4 -62.0 2.4 0.1 4.3P2-B 10/1/2013 no waterP1-B 7/2/2013 5:56 PM 7.1 15.9 0.3 -56.0 2.0 0.1 3.6P1-B 10/1/2013 1:30 PM 6.9 19.0 0.4 -113.1 2.9 0.3 7.1 6.0P3-A 7/2/2013 4:05 PM 6.9 18.0 0.9 -111.7 3.2 0.1 28.4P3-A 10/1/2013 no waterP3-B 7/2/2013 3:00 PM 7.0 16.8 0.5 -68.9 1.5 0.1 7.1P3-B 10/1/2013 11:00 AM 6.9 18.2 0.5 -118.2 4.9 0.1 11.7 3.3P4-B 7/2/2013 4:41 PM 7.3 16.8 0.5 -110.3 2.0 0.1 0.9P4-B 10/1/2013 4:00 PM 6.9 18.9 0.5 -106.1 6.2 0.1 4.0 4.9P5-B 7/2/2013 6:27 PM 7.1 15.4 0.5 -108.9 0.5 0.4 6.4P5-B 10/1/2013 5:10 PM 7.0 19.2 0.4 28.3 -110.1 0.2 12.3 4.0
mg/L


Total Hg Concentration in Soils at 3.5 RRM

Soil Chemistry
THg = 957 ug/g, wet weight!

Redox and Soil Moisture: Location 2 at 3.5 RRM; 2 ft from River Bank

USGS 01626850 SOUTH RIVER NEAR DOOMS, VA
Redox and Soil Moisture: Location 2 at 3.5 RRM; 2 ft from River Bank
• Arrows indicate a substantial change in soil moisture followed by a drastic redox response due to heavy rainfall and overbank flooding (1, 2 and 3).
• Strong precipitation on May 8 caused sharp and short redox gradient for several days; Less severe precipitation starting June 11 facilitated more sustained response of the redox change, although the redox dropped to the comparative levels.
• There is a defined lag in redox response depending on soil depth.• Steady rainfall and slow soil saturation causing the prolonged redox response
in June could be more effective in Hg mobilization/MeHg production but this have to be verified with the additional water sampling.

Preliminary Water Chemistry Including Hg and MeHg in Piezometers and Stream: Sampling on July 2, 2013 at 3.5 RRM
Sample ID Cl- Total P SO4
2- NO3--N NO2
--N Fe Na Mn NH3 T AlkmgCaCO3/L
Stream 8.1 0.1 9.1 0.8 0.4 0.0 5.8 0.0 0.1 94PZ 2B 10.0 0.1 8.5 0.3 0.4 4.8 9.0 2.6 0.4 185PZ 1B 9.1 0.1 5.8 0.3 0.4 3.7 5.5 1.4 0.4 174PZ 3A 53.4 0.1 29.7 0.3 0.4 24.1 23.0 5.0 2.7 423PZ 3B 12.0 0.1 4.4 0.3 0.4 7.7 9.9 2.6 265PZ 4B 9.5 0.1 9.3 0.3 0.4 0.5 7.4 1.2 0.1 185PZ 5B 19.4 0.1 6.2 0.3 0.4 9.6 13.8 5.0 0.4 303
mg/L

Thank you!