dynamic and reliable information accessing and management...
TRANSCRIPT

Aalborg Universitet
Dynamic and reliable Information Accessing and Management in HeterogeneousWireless NetworksTobgay, Sonam
Publication date:2013
Document VersionAccepted author manuscript, peer reviewed version
Link to publication from Aalborg University
Citation for published version (APA):Tobgay, S. (2013). Dynamic and reliable Information Accessing and Management in Heterogeneous WirelessNetworks. Center for TeleInFrastruktur (CTIF), Aalborg Universitet.
General rightsCopyright and moral rights for the publications made accessible in the public portal are retained by the authors and/or other copyright ownersand it is a condition of accessing publications that users recognise and abide by the legal requirements associated with these rights.
? Users may download and print one copy of any publication from the public portal for the purpose of private study or research. ? You may not further distribute the material or use it for any profit-making activity or commercial gain ? You may freely distribute the URL identifying the publication in the public portal ?
Take down policyIf you believe that this document breaches copyright please contact us at [email protected] providing details, and we will remove access tothe work immediately and investigate your claim.
Downloaded from vbn.aau.dk on: maj 24, 2018

Dynamic and Reliable Information Accessing andManagement in Heterogeneous Wireless Networks
a dissertationsubmitted to the department
of electronic systemsof
Aalborg Universityin partial fulfillment of the requirements
for the degree ofDoctor of Philosophy
Sonam Tobgay
Center for TeleInFrastrutur
30th September, 2013

ii
Supervisor:Professor Ramjee Prasad, Aalborg University, Denmark
Co-Supervisor:Associate Professor Rasmus L. Olsen, Aalborg University, Denmark
Examination Committee:Associate Professor Jens Myrup Pedersen (Chairman), AalborgUniversity, DenmarkProfessor Luis Munoz Gutierrez, Universidad De Cantabria, SpainProfessor Zary Segall, University of Maryland, Baltimore County, USA
Moderator:Associate Professor Albena D. Mihovska, Aalborg University, Denmark
Date of Defence:30th September, 2013

Abstract
Due to rapid growth and advancement in the field of wireless technol-ogy, many portable devices which are capable of connecting each other, form-ing ad-hoc wireless networks; have been evolved in the recent past. Whenthese different devices are forming different ad-hoc networks, a heterogeneouswireless network is created. This shows that, there are different sources ofinformation that one can select from, provided one has access rights to allthese available sources. One such ad-hoc network is wireless sensor network,which is applied to almost all the fields in order to collect information forvarious purposes. Wireless sensor network, by itself is a heterogeneous, inthe sense that it can be composed of sensor nodes which have different prop-erties and characteristics. There are also different types of sensor nodeswhich can measure same physical phenomenon, but exhibits different charac-teristics in sensing events. Due to the information dynamics at the source(which changes over time), which wireless sensor nodes are made to collect,the degree of information reliability will be determined by the type of sourcebeing chosen. In order to select the most reliable information source, it isnecessary to know the network parameters like, at what rate information isbeing generated at the source, at what rate the sensor node sample informa-tion and how much time the information will take to reach at the destination,where information is being processed or used. In addition, it is also impor-tant that accessing information from a particular source node does not causehuge power consumption (in case if there is no access to power source or noany energy recovery mechanism). Since information access from a particularsource can be done in various ways; 1) Reactive Access 2) Periodic Accessand 3) Hybrid Access, it is also important to study the merits and demeritsof each access strategy in relation to the information reliability and powerconsumption.
Various protocols for information dissemination and collection havebeen proposed for wireless sensor networks. Each protocol is typically de-signed to optimize a certain set of parameters in making routing decisions,and likewise tested for chosen network traffic as per the designed parameters.
iii

iv
Which means a deployment of any application needs to build its entire de-ployment logic based on the type of traffic for which the protocol was designed.To make information accessing from wireless networks more viable, a genericframework is required to support any application to be built on top of any ar-bitrary communication protocols being used. Therefore, this thesis presentsinformation accessing and management framework and studies the behaviourof dynamic information elements in relation to information reliability andpower consumption.
First, in order to study the dynamic behaviour of network parametersand to estimate the information reliability in accessing particular informationsource, it is crucial to know how information is being generated and detected.So, this dissertation starts by presenting a brief study on Event Process andEvent Detection process based on wireless sensor node.
Secondly, a dynamic information accessing and management frame-work is developed to monitor the network dynamics. The framework is mainlycomposed of two parts, one the information source which is located at remotesite and the other which monitors the information sources. Based on thecaptured event rate, the estimated delay rate, and frequency of sampling, theprobability of mismatch of information that will occur from accessing par-ticular information source is estimated. The framework is also capable ofswitching dynamically from one access strategy to another based on networkparameters in order to minimize the overall power consumption of the system.
The third part of this thesis provides analytical models for informa-tion mismatch probability and power consumption under each access strate-gies mentioned earlier. A detailed comparative study on these three accessstrategies are provided with performance evaluation and analysis based onthe dynamic network parameters like event rate, rate of delay and samplingrate. The validations of analytical results are done by using the developedframework.
Considering, these two requirement parameters, information reliabilityand power consumption, the fourth part of this thesis presents an adaptiveinformation access mechanism thereby suggesting a trade-off point betweentwo requirement parameters, so that energy is not extensively utilized for aminimal gain in information reliability or compromising information relia-bility by trying to save minimal energy. Such a mechanism will be useful asdifferent applications have different requirements as per their purpose.
Lastly, the thesis presents a dynamic algorithm which selects the mostreliable information source based on information mismatch probability andpower consumption; both are relevant metrics for sensor networks. Withthe help of the algorithm, an analysis on how dynamic information elementsand stochastic network delay influence information mismatch probability is

v
provided.In summary, the thesis provides in-depth study on the impact of access-
ing dynamic information on information reliability and power consumption;both are relevant metrics for wireless networks. The study found out thatthe information mismatch probability not only depends on the informationdynamics like at what rate the information is being generated at source andthe delay in accessing the information, but it is also impacted by the rateat which the information is being sampled and which type of access strategybeing used.

vi

Dansk Resume
Pa grundlag af den hastigt voksende og udviklende markedet indenfortradløs teknologier, er mange mobile enheder i stand til at forbinde hinandenog danne ad-hoc tradløse netværk. Nar disse forskellige typer enheder dannerdisse ad-hoc netværks, tales der om heterogene netværk. I den forbindelse vilder være forskellige informationskilder at vælge fra nar applikationer skalhave fat i informationer i dets omkringliggende miljø. Dette er dog givetat der er givet tilladelse til at anvende disse informationskilder. En specieltype af sadanne ad-hoc netværk er tradløse sensor netværk, som anvendes tilnæsten alle omrader indenfor informations- og dataopsamling med forskelligeformal. Tradløse sensor netværk alene er heterogene i den forstand at de kanbesta af sensor noder med forskellige egenskaber og karakteristika. Der findesforskellige typer af sensorer som kan male samme fysiske parametre, menudviser forskellige egenskaber i at male hndelser i omgivelserne. Pa grundaf informationsdynamikken hos informationskilden (som ændres over tid) vilpalideligheden af den information der bliver tilgaet blive influeret af informa-tionskildens type. For at vælge den mest palidelige informationskilde, er detnødvendigt at kende til netvrksparametre sasom med hvilken hastighed infor-mationer ændres ved kilden, hvor hurtig informationer samples, hvor lang tiddet tager for informationer at blive transporteret over et netværk fra kilde tilmodtager og hvor lang tid der bliver brugt pa at processere data. Yderligere erdet ogsa vigtigt at det tilgaede information fra en bestemt kilde ikke anvenderfor meget strøm (i det tilfælde en node f.eks. er batteridrevet og/eller ikke haradgang til at fa fornyet sit energilager). Siden der findes forskellige maderat tilga information pa fra en bestemt kilde; 1) reaktiv tilgang, 2) periodiskopdateringer og 3) hybride metoder, er det ogsa vigtigt at studere fordele ogulemper ved de enkelte strategier i forhold til informationspalideligheden ogderes energiforbrug.
Forskellige protokoller til tradløse netværk har været foreslaet for atkunne sprede og samle informationer til rette. Individuelle protokoller ertypisk designet til at optimiere et bestem set af parametre til at bestemmedatapakkeruter gennem netværket, og er ligeledes testet for udvalgte typer af
vii

viii
netværkstraffik jvnf. valgte optimeringsparametre. Dette betyder at udspre-delsen af forskellige applikationer er nød til at basere sin indre logik baseret patypen af traffik de anvendte protokoller oprindelig var designet til. For at gøreadgang til information mere dynamisk, er der behov for et framework der kanunderstøtte forskellige applikationer ovenpa en række protokoller anvendt isensor netværks.Derfor studeres der i denne afhandling eksisterende metoderog management frameworks til adgang for distribuerede informationer, ogder studeres ogsa palidelighed for adgang til dynamiske, distribuerede infor-mationer i relation til energiforbrug for at opna denne tilgang. Dette gøres iflere trin:
Først, for at studere den dynamiske opførsel af netværksparametre ogestimere informations palideligheden ved tilgang af informationer fra bestemtekilder, er det vigtigt at vide noget om hvorledes informationer skabes og hn-delser detekteres. Sa afhandlingen starter med et overblik over hvorledes hn-delser processeres og detekteres. Denæst bliver der udviklet et dynamisk infor-mations tilgangs og management framework til at monitorere netværks og in-formationsdynamikken. Frameworket bestar hovedsagligt af to dele; informa-tionskilden og en monitoreringsenhed der interagere med informationskilden.Baseret pa estimat af hændelseshastigheder, estimerede delays i netværket ogsamplingsfrekvens, bliver sandsynligheden for mismatches mellem den virke-lige værdi og den værdi monitoreringsenheden beregnet. Frameworket vilefterfølgende bruges til dynamisk at vælge mellem forskellige adgangsstrate-gier og samtidig minimere det overordnede energiforbrug for at fa adgang tilinformationen. Som trejde del, skabes de analytiske modeller nødvendig forat beregne sandsynligheden for mismatches og effektforbrug for de forskel-lige typer strategier for informations adgang. En detaljeret sammenligningaf de forskellige strategier bliver udført og der bliver udført en ydelsesanalysebaseret pa de respektive parametre, hændelseshastigheder, delay og samplings-frekvens. Til valideringen af modellerne anvendes det udviklede frameworkog emulering af data. Betragtes de to parameter; informations palidelighedog energiforbrug, vil den fjerde del af afhandlingen præsentere den dynamisktilpassende informationsmekanisme, som vil given anledning til at lokalis-ere fornuftige kompromiser mellem palidelighed og energiforbrug set i forholdtil applikationskrav omkring de to parametre, der i høj grad er forskelligefra applikation til applikation. Til sidst, præsenterer afhandlingen en dy-namisk algoritme der udvælger den mest palidelige informationskilde baseretpa sandsynligheden for mismatches og effektforbrug betragtenede at forskel-lige typer sensorer kan vidergive samme information men under forskelligenetværksforhold. Algoritmen anvendes ogsta til at analyserere hvorledes dy-namiske informationselementer og stochastiske netværksdelay influere mis-match sandynlighed. Samlet set betragter afhandlingen en, i dybden, studie

ix
for indflydelsen af adgang til dynamiske informationers palidelighed og en-ergiforbrug, der begge er relevante parameter for tradløse netværk. Studietleder op til at informations mismatches ikke blot er et spørgsmal omkring in-formationsdynamikken, sasom med hvilken hastighed informationer ændresog delayet mellem kilde og modtager, men ogsa i høj grad med hvilken sam-plingsfrekvens informationen samples og hvilken type strategi der anvendestil at sende data.

x

Acknowledgement
I would like to express the deepest appreciation and heartfelt gratitudeto my Supervisor Professor Ramjee Prasad. He continually and convincinglymotivated me to take up this PhD study. Without his guidance and unfailingadvice this dissertation would not have been possible.
I would like to thank my Co-Supervisor Dr. Rasmus L. Olsen, whotaught me not only how to do research but how to be strong and thinkpositive always. Irrespective of what situation he is, the smile on his facewas enough to convince me that he has lots of concern towards me. His hardwork and dedication towards work highly inspired me. He is not only a goodsupervisor but is a kind hearted and great person. I have no words to expressmy gratitude to him.
I also would like to thank Dr. Nuno Pratas for helping me in tacklingprogramming error. I learnt a lot from him while sharing office with him fora year.
I also would like to extend my sincere gratitude to Ms. Dorthe Spare,who helped me in many ways during my PhD study. My sincere gratitudealso goes to Ms. Susanne and Ms. Inga for their support.
Lastly, I extend my appreciations to all my colleagues in CTIF sec-tion for making me comfortable during my entire study period in AalborgUniversity.
Thank you one and all.
xi

xii

Dedication
A special feeling of gratitude to my loving wife Kencho Wangmo,daughter Kuenga Lhaki Pelzom and son Garab Chogyal Tobgay for theirunderstanding and encouragement. I also dedicate this work to my fatherKuenzang Wangchuk and late mother Chudu Lhamo.
xiii

xiv

Table of Contents
List of Figures xix
List of Tables xxv
List of Algorithms xxv
1 Introduction and Problem Definition 1
1.1 Background and Motivation . . . . . . . . . . . . . . . . . . . 2
1.2 Information Access and its Challenges . . . . . . . . . . . . . 3
1.3 Thesis Objectives . . . . . . . . . . . . . . . . . . . . . . . . . 5
1.4 Contributions of the Thesis . . . . . . . . . . . . . . . . . . . 6
1.5 Structure of the Thesis . . . . . . . . . . . . . . . . . . . . . 6
2 State of the Art: Information Accessing in Wireless SensorNetwork 9
2.1 Introduction . . . . . . . . . . . . . . . . . . . . . . . . . . . . 10
2.2 Sensor Network Applications . . . . . . . . . . . . . . . . . . 10
2.2.1 Environmental Data Collection Application . . . . . . 11
2.2.2 Safety Monitoring Application . . . . . . . . . . . . . . 11
2.2.3 Mobility Support Application . . . . . . . . . . . . . . 12
2.2.4 Hybrid Application Networks . . . . . . . . . . . . . . 12
2.3 Design Issues and Characteristics . . . . . . . . . . . . . . . . 12
2.3.1 Dynamicity . . . . . . . . . . . . . . . . . . . . . . . . 13
2.3.2 Node Deployment . . . . . . . . . . . . . . . . . . . . . 13
2.3.3 Power Consumption . . . . . . . . . . . . . . . . . . . 14
2.3.4 Information Access Approach . . . . . . . . . . . . . . 14
2.3.5 Node Capabilities . . . . . . . . . . . . . . . . . . . . . 15
2.4 Information Collection and Dissemination . . . . . . . . . . . 16
2.4.1 Classifications of Routing Protocols in WSN . . . . . . 17
2.5 Related Information Management Frameworks . . . . . . . . . 20
xv

xvi Table of Contents
2.6 Requirements in Relation to Accessing Dynamic InformationSource . . . . . . . . . . . . . . . . . . . . . . . . . . . . . . . 212.6.1 Information Reliability . . . . . . . . . . . . . . . . . . 222.6.2 Timeliness . . . . . . . . . . . . . . . . . . . . . . . . . 222.6.3 Power Consumption . . . . . . . . . . . . . . . . . . . 23
2.7 Conclusions . . . . . . . . . . . . . . . . . . . . . . . . . . . . 24
3 Preliminaries and Basic Models 273.1 Information Access Process . . . . . . . . . . . . . . . . . . . 283.2 Event Process and Event Detection . . . . . . . . . . . . . . . 293.3 Information Reliability Model . . . . . . . . . . . . . . . . . . 403.4 Information Access Strategies . . . . . . . . . . . . . . . . . . 413.5 End-to-End Delay Distribution . . . . . . . . . . . . . . . . . 423.6 Power Consumption Model . . . . . . . . . . . . . . . . . . . . 443.7 Conclusions . . . . . . . . . . . . . . . . . . . . . . . . . . . . 44
4 Proposed Framework 474.1 Motivation . . . . . . . . . . . . . . . . . . . . . . . . . . . . . 484.2 Proposed Framework Architecture . . . . . . . . . . . . . . . . 49
4.2.1 Event Monitoring Unit (EMU) . . . . . . . . . . . . . . 514.2.2 Access Management Unit (AMU) . . . . . . . . . . . . 524.2.3 Information Source Unit . . . . . . . . . . . . . . . . . 52
4.3 Framework Implementation . . . . . . . . . . . . . . . . . . . 534.3.1 Information Source . . . . . . . . . . . . . . . . . . . . 544.3.2 Information Manager . . . . . . . . . . . . . . . . . . . 56
4.4 Performance Evaluation . . . . . . . . . . . . . . . . . . . . . 574.5 Limitations of the Framework . . . . . . . . . . . . . . . . . . 594.6 Conclusions . . . . . . . . . . . . . . . . . . . . . . . . . . . . 59
5 Power Consumption and Mismatch Probability in Relationto Information Access Strategy 615.1 Motivation . . . . . . . . . . . . . . . . . . . . . . . . . . . . . 625.2 Related Works: Power Consumption and Reliability . . . . . . 635.3 System Model Description . . . . . . . . . . . . . . . . . . . . 64
5.3.1 Abstract Scenario . . . . . . . . . . . . . . . . . . . . . 645.4 Analytical Model . . . . . . . . . . . . . . . . . . . . . . . . . 65
5.4.1 Information Sampling Step . . . . . . . . . . . . . . . . 655.4.2 Information Access Step . . . . . . . . . . . . . . . . . 67
5.5 Validation of the Models . . . . . . . . . . . . . . . . . . . . . 745.6 Performance Evaluation and Result Analysis . . . . . . . . . . 80
5.6.1 Mismatch Probability . . . . . . . . . . . . . . . . . . . 80

xvii
5.6.2 Power Consumption . . . . . . . . . . . . . . . . . . . 875.7 Time Shifted Delay Distribution . . . . . . . . . . . . . . . . . 885.8 Conclusions . . . . . . . . . . . . . . . . . . . . . . . . . . . . 94
6 An Adaptive Information Access Mechanism 976.1 Motivation . . . . . . . . . . . . . . . . . . . . . . . . . . . . . 986.2 Related Works: Adapting Sampling . . . . . . . . . . . . . . . 996.3 Adaptive Access Mechanisms . . . . . . . . . . . . . . . . . . 100
6.3.1 Adapting Information Sampling Rate . . . . . . . . . . 1006.3.2 Trade-off between Reliability and Power Consumption 104
6.4 Adaptive Information Access Mechanism Algorithms . . . . . 1086.5 Conclusions . . . . . . . . . . . . . . . . . . . . . . . . . . . . 109
7 Dynamic Information Source Selection Algorithm 1117.1 Motivation . . . . . . . . . . . . . . . . . . . . . . . . . . . . . 1127.2 Proposed Algorithm . . . . . . . . . . . . . . . . . . . . . . . 1137.3 Algorithm Implementation . . . . . . . . . . . . . . . . . . . . 1157.4 Evaluation and Analysis . . . . . . . . . . . . . . . . . . . . . 1197.5 Conclusions . . . . . . . . . . . . . . . . . . . . . . . . . . . . 129
8 Conclusions and Outlook 1318.1 Reflections . . . . . . . . . . . . . . . . . . . . . . . . . . . . . 1328.2 Concluding Remarks . . . . . . . . . . . . . . . . . . . . . . . 1338.3 Outlook and Future Directions . . . . . . . . . . . . . . . . . . 135
Bibliography 137
List of Publications 144
Mapping of Published Papers with Chapters 146

xviii Table of Contents

List of Figures
1.1 A typical scenario of information accessing and managementframework. . . . . . . . . . . . . . . . . . . . . . . . . . . . . . 3
1.2 Block diagram showing inter-relations among different chapters. 7
2.1 Pictorial definition of information reliability and timelinesswith respect to dynamic information elements. . . . . . . . . . 23
3.1 Abstract view of information access model. . . . . . . . . . . . 28
3.2 Architecture of typical sensor node and how information isgenerated in response to sensed events. . . . . . . . . . . . . . 30
3.3 Process of an event detection. . . . . . . . . . . . . . . . . . . 30
3.4 (a) True signal and filtered signal with noise (σ = 0.5◦C), withfrequencies of [1/100 1/50 1 3] Hz and corresponding ampli-tude components of [5 3 2 1], using a threshold of 1 and sam-pling frequency = 10 Hz (filter cut-off frequency = 2.5 Hz).(b)Corresponding CDF of events based on the filtered signal andthe approximated CDF using an exponential distribution. . . . 32
3.5 (a) True signal and filtered signal with noise (σ = 0.5◦C),(b)CDF of events based on the filtered signal and the approx-imated CDF using an exponential distribution. A frequen-cies of [1/100 1/50 1/10 1/2] Hz and corresponding amplitudecomponents of [5 3 2 1], using a threshold of 1 and samplingfrequency = 10 Hz (filter cut-off frequency = 2.5 Hz). . . . . . 32
3.6 (a) True signal and filtered signal with noise (σ = 0.5◦C), withfrequencies of [1/800 1/500 1/300 1/100] Hz and correspondingamplitude components of [5 3 2 1], using a threshold of 1 andsampling frequency = 10 Hz (filter cut-off frequency = 2.5 Hz).(b) Corresponding CDF of events based on the filtered signaland the approximated CDF using an exponential distribution. 33
xix

xx List of Figures
3.7 (a) True signal and filtered signal with noise (σ = 1.0◦C), withfrequencies of [1/800 1/500 1/300 1/100] Hz and correspond-ing amplitude components of [5 3 2 1], using a threshold of1 and sampling frequency = 10 Hz (filter cut-off frequency= 2.5 Hz).(b) Corresponding CDF of events based on the fil-tered signal and the approximated CDF using an exponentialdistribution. . . . . . . . . . . . . . . . . . . . . . . . . . . . . 34
3.8 (a) True signal and filtered signal with noise (σ = 0.5◦C), withfrequencies of [1/800 1/500 1/300 1/100] Hz and correspond-ing amplitude components of [5 3 2 1], using a threshold of1 and sampling frequency = 10 Hz (filter cut-off frequency= 2.5 Hz).(b) Corresponding CDF of events based on the fil-tered signal and the approximated CDF using an exponentialdistribution. . . . . . . . . . . . . . . . . . . . . . . . . . . . . 34
3.9 (a) True signal and filtered signal with noise (σ = 0.1◦C), withfrequencies of [1/800 1/500 1/300 1/100] Hz and correspond-ing amplitude components of [5 3 2 1], using a threshold of1 and sampling frequency = 10 Hz (filter cut-off frequency= 2.5 Hz).(b) Corresponding CDF of events based on the fil-tered signal and the approximated CDF using an exponentialdistribution. . . . . . . . . . . . . . . . . . . . . . . . . . . . 35
3.10 CDF of events based on the filtered signal and the approxi-mated CDF using an exponential distribution. Frequencies of[1/800 1/500 1/300 1/100] Hz and corresponding amplitudecomponents of [5 3 2 1], using a signal with noise (σ = 0.5◦C)and sampling frequency = 10 Hz (filter cut-off frequency = 2.5Hz). a) Threshold = 0.1, b) Threshold = 1.0 and c) Threshold= 3.0 and d) Threshold = 10.0 . . . . . . . . . . . . . . . . . 36
3.11 Probability plot for exponential distribution, with frequenciesof [1/800 1/500 1/300 1/100] Hz and corresponding amplitudecomponents of [5 3 2 1], using a signal with noise (σ = 0.5◦C)and threshold of 1.5 and sampling frequency = 10 Hz (filtercut-off frequency = 2.5 Hz). . . . . . . . . . . . . . . . . . . . 37
3.12 (a) True signal and filtered signal with noise (σ = 0.5◦C), withfrequencies of [1/800 1/500 1/300 1/100] and correspondingamplitude components of [5 3 2 1], with threshold of 1.5.(b)Corresponding CDF of events based on the filtered signal andthe approximated CDF using an exponential distribution. . . . 37

xxi
3.13 Mean values of approximated exponential distribution of interevent times for frequencies [1:2:20] Hz of signal frequency, andamplitudes [1:2:20] of signal amplitude, using a threshold of 1.5and sampling frequency of 10 Hz (and filter cut-off frequencyat 2.5Hz). . . . . . . . . . . . . . . . . . . . . . . . . . . . . . 38
3.14 Mean values of approximated exponential distribution of interevent times for threshold level [0.1:0.1:1] degree, and samplingfrequency [1:1:10] Hz of a signal of amplitude [5 3 2 1] andfrequency [1/800 1/500 1/300 1/100] Hz (16 minute) and σ =0.5◦C. . . . . . . . . . . . . . . . . . . . . . . . . . . . . . . . 39
3.15 Message chart diagram of information access process. . . . . . 40
3.16 Considered Network scenario. . . . . . . . . . . . . . . . . . . 43
3.17 Markov Model, Transition diagram. . . . . . . . . . . . . . . . 43
4.1 Proposed Framework Architecture (S1, S2...Sn are informationsources). . . . . . . . . . . . . . . . . . . . . . . . . . . . . . . 49
4.2 Building blocks of the proposed framework. . . . . . . . . . . . 54
4.3 Interaction block diagram of information generation and sam-pling. . . . . . . . . . . . . . . . . . . . . . . . . . . . . . . . . 56
4.4 Interaction among the unit within information manager. . . . 57
4.5 Shows computation delay with network delay. . . . . . . . . . 58
4.6 Computation delay verses number of nodes. . . . . . . . . . . 58
5.1 An abstract view of remote dynamic information access withdifferent access strategies. . . . . . . . . . . . . . . . . . . . . 64
5.2 Sampling process model; Sampling time intervals (ts = t1−t0)are exponentially distributed with rate τ . . . . . . . . . . . . 65
5.3 Reactive Access Model with Periodic Sampling . . . . . . . . . 68
5.4 Periodic Access with Periodic Sampling . . . . . . . . . . . . . 70
5.5 Periodic Access with Periodic Sampling . . . . . . . . . . . . . 72
5.6 Comparisons of mismatch probability values obtained by an-alytical models and using framework at λ = 2.0 and ν = 10(a) Reactive, (b) Periodic and (c) Hybrid Access. . . . . . . . 76
5.7 Information mismatch probability for different access strate-gies at λ = 2.0 and ν = 10. . . . . . . . . . . . . . . . . . . . . 77
5.8 Information mismatch probability comparison between expo-nential sampling rate and constant sampling rate at λ = 2.0and ν = 10. a) Reactive Access b) Periodic Access . . . . . . . 77
5.9 Markov Model, Transition diagram. . . . . . . . . . . . . . . . 78

xxii List of Figures
5.10 Mismatch probability comparison between Erlang distributeddelay and exponential distributed delay at λ = 2.0 and ν = 10.a) Reactive Access, b) Periodic Access, c) Hybrid Access at d0
= 0.1sec . . . . . . . . . . . . . . . . . . . . . . . . . . . . . . 795.11 Mismatch probability verses sampling rate with varying rate of
delay (ν) at λ = 1.5 (a) Reactive Access, (b) Periodic Accessand (c) Hybrid Access at d0 = 0.1sec. . . . . . . . . . . . . . . 81
5.12 Mismatch probability verses sampling rate with varying eventrate (λ) at ν = 10 (a) Reactive Access, (b) Periodic Accessand (c) Hybrid Access at d0 = 0.1sec. . . . . . . . . . . . . . . 82
5.13 Mismatch probability verses event rate with varying samplingrate (τ) at ν = 10 (a) Reactive Access, (b) Periodic Accessand (c) Hybrid Access at d0 = 0.1sec. . . . . . . . . . . . . . . 84
5.14 Derivatives of mismatch probability with respect to mean eventrate (λ) at ν = 10 and τ = 5 . . . . . . . . . . . . . . . . . . . 85
5.15 Derivatives of mismatch probability with respect to mean de-lay rate (ν) at λ = 1.5 and τ = 5 . . . . . . . . . . . . . . . . 85
5.16 Derivatives of mismatch probability with respect to samplingrate(λ) at ν = 10 and λ = 1.5 . . . . . . . . . . . . . . . . . . 85
5.17 Comparisons of mismatch probability at ν = 10 and λ = 5.0 . 865.18 Derivatives of mismatch probability (Hybrid) with respect to
constant additional delay (d0) at ν = 10 and λ = 1.5 . . . . . 875.19 Comparisons of Power Dissipation in different access strategies. 875.20 Information access with time shifted delay (d0). . . . . . . . . 895.21 Impact of η on mismatch probability at λ = τ = 1 and mean
delay (E[D]) of 1 second (a) Reactive access and (b) HybridAccess. . . . . . . . . . . . . . . . . . . . . . . . . . . . . . . . 90
5.22 Impact of η on mean delay at λ = τ = 1 and mean delay(E[D]) of 1 second (a) Reactive access and (b) Hybrid Access. 91
5.23 Impact of η on mismatch probability at mean delay (E[D])of 1 second for Reactive Access (a) at λ = 1, τ = 3 (b) atλ = 3, τ = 1 (c) at λ = τ = 3. . . . . . . . . . . . . . . . . . . 92
6.1 Reactive Access (a). Adaptation of sampling rate to maintainmismatch probability of 0.20, (b).Mismatch probability andpower dissipation variation with sampling rate at λ = 0.5 andν = 10 and µ = 1 (c). Mismatch probability variation keepingτ constant and λ = 0.5. . . . . . . . . . . . . . . . . . . . . . . 101
6.2 Sensitivity plot: Showing how sensitive is power consumptionand mismatch probability to the change in sampling rate(τ)with Y-axis plotted with log scale. . . . . . . . . . . . . . . . . 102

xxiii
6.3 Comparison between the three access strategies in adaptiveinformation access by varying sampling rate at λ = 0.5. . . . . 103
6.4 Maintaining constant power consumption by varying mismatchprobability (a) Reactive Access, (b) Periodic Access and (c)Hybrid Access. . . . . . . . . . . . . . . . . . . . . . . . . . . 105
6.5 Maintaining the required reliability by varying power con-sumption (a) Reactive Access, (b) Periodic Access and (c)Hybrid Access. . . . . . . . . . . . . . . . . . . . . . . . . . . 107
7.1 An abstract view of information accessing with source selec-tion possibility. . . . . . . . . . . . . . . . . . . . . . . . . . . 112
7.2 Proposed Framework Architecture (reproduced from Chapter4). . . . . . . . . . . . . . . . . . . . . . . . . . . . . . . . . . 116
7.3 Event rate (λ) variation against threshold values with differentvalues of sensitivity (ρ). . . . . . . . . . . . . . . . . . . . . . 118
7.4 Mismatch probability variation with different values of meandelay rates (refer Table 7.3) with constant sampling rate (τ =3.0) and temperature change rate (φ = 0.03◦C/sec). . . . . . . 118
7.5 Source selection scenario at λ1 from Table 7.2 with uniformdelay rate of ν = 0.5. . . . . . . . . . . . . . . . . . . . . . . . 120
7.6 Source selection with different average delay rates (ν4) fromTable 7.3 and with λ1 from Table 7.2. . . . . . . . . . . . . . . 121
7.7 Information source selection scenario with combination of dif-ferent delay rates from Table 7.3 with λ1 as shown in Table7.2. . . . . . . . . . . . . . . . . . . . . . . . . . . . . . . . . . 121
7.8 Mismatch probability variation with combination of differentdelay rates from Table 7.3 with λ1 as shown in Table 7.2. . . . 122
7.9 Information source selection variation based on average mis-match probability (w.r.t. Figure 7.8) with different averagedelays rates shown in Table 7.3. . . . . . . . . . . . . . . . . . 122
7.10 Information source selection scenario with combination of dif-ferent delay rates from Table 7.3 with λ2 as shown in Table7.2. . . . . . . . . . . . . . . . . . . . . . . . . . . . . . . . . . 123
7.11 Mismatch probability variation with combination of differentdelay rates from Table 7.3 with λ2 as shown in Table 7.2. . . . 123
7.12 Information source selection scenario with combination of dif-ferent delay rates from Table 7.3 with λ3 as shown in Table7.2. . . . . . . . . . . . . . . . . . . . . . . . . . . . . . . . . . 124
7.13 Mismatch probability variation with combination of differentdelay rates from Table 7.3 with λ3 as shown in Table 7.2. . . . 125

xxiv List of Figures
7.14 Information source selection scenario with combination of dif-ferent delay rates from Table 7.3 with λ4 as shown in Table7.2. . . . . . . . . . . . . . . . . . . . . . . . . . . . . . . . . . 125
7.15 Mismatch probability variation with combination of differentdelay rates from Table 7.3 with λ4 as shown in Table 7.2. . . . 126
7.16 Performance comparisons for different selection methods fordifferent cases as shown in Table 7.4, a) Case I b) Case II . . 127
7.17 Performance comparison for different selection methods fordifferent cases as shown in Table 7.4, a) Case III b) Case IV . 128

List of Tables
2.1 Shows trade-off metrics of each routing protocol category . . . 19
5.1 Shows how d0 values are computed for different cases, at k =10 and η = d0/E[Dν ]. . . . . . . . . . . . . . . . . . . . . . . . 93
7.1 Comparisons of common temperature sensors specifications. . 1147.2 Event Rates for different values of φ and thresholds. . . . . . . 1177.3 Mean Delay Rates values used for evaluation purposes . . . . . 1197.4 Parameters used for performance comparisons of selections
methods. . . . . . . . . . . . . . . . . . . . . . . . . . . . . . . 126
List of Algorithms
5.1 Steps for estimating information mismatch probability . . . . 756.1 Adaptive Information Access Mechanism to Maintain Required
Power Consumption Limit . . . . . . . . . . . . . . . . . . . . 1086.2 Adaptive Information Access Mechanism to Maintain Infor-
mation Reliability . . . . . . . . . . . . . . . . . . . . . . . . . 1097.1 Pseudocode for Information Source Selection based on Mis-
match Probability and Power Consumption . . . . . . . . . . . 115
xxv

xxvi List of Algorithms

Chapter 1
Introduction and ProblemDefinition
This chapter provides an overview of the thesis and contains fol-lowing sections:Background and Motivation: This section briefly describes thetopic which the study is going to explore. It provides the back-ground on why and what motivates to study this particular topic“Dynamic and Reliable Information Accessing and Managementin Heterogeneous Wireless Network.”Problem Definitions : This section brings out what challenges aninformation user faces while accessing to dynamic informationelements. It also briefly highlights few issues that have impact oninformation reliability and power consumption.Objectives of the Study: Knowing the challenges in accessing dy-namic information elements, this section presents the goals whichstudy aims to achieve at the end of the study.Contributions of the Study: This section presents a summary ofwhat significant study is carried out in this thesis.Structure of the Thesis: Lastly, this section presents a brief sum-mary on each chapter, describing how one chapter is linked toanother. A block diagram, showing interactions among chaptersis also provided.
1

2 Chapter 1
1.1 Background and Motivation
Although, the benefits of wired networking technology cannot be ne-glected but wireless networking technology provides greater flexibility athome, work place and in the community to connect to the information sourcewithout being tied to a specific location. The flexibility in accessing infor-mation from anywhere, irrespective of location where you stay, business seeit as having great impact on their operational efficiency [1]. The popular-ity of wireless networking over the recent years cannot be denied. With theadvancement in the field of wireless technology, different types of wireless net-works have evolved over the years. One of the most prominent and widely ap-plicable wireless technologies is the Wireless Sensor Network (WSN). WSNsfacilitate monitoring and collecting information from hostile physical environ-ment both from local and remote location. As technology advances furtherand hardware prices drop, wireless sensor network will find its application inareas where traditional networks are inadequate [2]. Although, with increas-ing computing and communication capabilities, will change the role of thesensors from being mere information dissemination to more demanding tasklike sensor fusion, classifications, collaborative target tracking, but its roleof information dissemination and collection are found to be widely used asit can be deployed even in a hostile environment where human access is im-possible [3]. WSN has wide range of application domains starting from largescale global deployment like environmental monitoring to the smart home de-ployment. The benefits of wireless sensor network are that it has capabilityof large scale deployment, low maintenance, scalability and adaptability fordifferent scenarios for different applications to mention a few. Moreover, withthe evolution of WSNs, multiple applications are supported to run concur-rently [4]. This type of system will reduce the deployment and administrativecosts, thereby increasing the usability and efficiency of the network.
Generally, a WSN is a collection of few nodes to several hundreds ofnodes deployed randomly or deterministically [5] over a region of interest,depending up on the situation and applicability. Most of the WSN appli-cations are data centric, therefore WSNs are deployed to interact with thephysical environment and report the phenomenon of interest to the user.The data generated in response to the sensed events in the environment canbe accessed by user or applications in several ways, depending upon appli-cation types and their requirements. Due to the dynamic (which changesover time) nature of information, which sensor are made to collect, the in-formation being processed and used for making decision at user end doesnot match with the information at the (physical) source. In addition, the

1.2 Information Access and its Challenges 3
Figure 1.1: A typical scenario of information accessing and management framework.
sensor nodes which act as an information source itself is dynamic, meaningthat it becomes unreachable or becomes unavailable due to several reasonslike change in location of the user, power failure and change in location ofthe source (in case the nodes support mobility). Further, there are variouschallenges in accessing information from information source which are brieflydescribed in the following section.
1.2 Information Access and its Challenges
When accessing information from WSN, there are several issues thatneed to be taken care. This section highlights some of the challenges andissues in WSN in relation to information accessing, power consumption andinformation reliability. Figure 1.1 shows a typical information accessing sce-nario.
Information Reliability: Sensor readings must be sent to the sinkas per the transportation methods being used. Reliability depends on sev-eral factors, like how fast the information is being generated, how often theinformation is being sampled, the transmission delay between source and thedestination and what types of access methods are being used. As an example,the information reliability would be increased by increasing the frequency ofsampling information; however, this would drain out more energy from thenodes. Therefore, there should be an information access mechanism whichconsiders trade-off between information reliability and energy consumption.
Delay: Generally, information collected by WSNs are dynamic in na-ture that changes over time. This means that information needs to reach at

4 Chapter 1
users place where information is being processed and used for making decisionat certain minimum lapse of time in order to avoid use of wrong information.For applications like real time control applications, the outdated informationwould be of not much use. Hence, accessing information mechanism shouldbe flexible to tune as per the applications so that it adapts in line with theapplication requirement.
Energy Consumption: Although, the energy consumption may notbe of much concern if there are energy recovery mechanisms put in place dur-ing deployment of WSN, but the lack of battery replacement, which usuallyare, need energy efficient information access mechanisms. Since improvingdelay and information reliability will have impact on energy consumption,the access of information should be such that there is no excessive energyutilization to have little or minimal gain in information reliability and mini-mal delay reduction.
Adaptation: As WSNs can be applied to various application areas,the requirements of different application are different. In addition, a set ofrequirements of a particular applications also change depending on time andsituation. As an example, take a fire monitoring WSN. When there is no fire,the information access can be slower than the one during the occurrence ofthe fire. Therefore, it is important to have an information access mechanismwhich adapts as per the time and situation.
Source of Information: Some of the above mentioned parameters areaffected by the choice of information source. The transmission delay mightdepend on how many number of intermediate hops are there between sourceand the destination, and what delay rates between each intermediate hops.Information reliability will have an impact on which rate a particular infor-mation source generates information and how frequent information is beingsampled from particular source. Further, if a particular source is selectedtoo frequently, there will be over utilization of its resources, especially theenergy, thereby reducing the life time of the node. So, the design of infor-mation access mechanism should take these into account so that some nodesare not over utilized whereas others are just lying idle. In addition, if thereare several information sources which provide same type of information, itis desirable to switch from one information source to another whenever theuser wants to change or when the current source has become unavailable,without interrupting the connection.
Type of Access Strategy: When to access and how often accessshould be made to an information source also depends on the applications.Some applications need frequent access whereas others do not. The accessfrequency has impact both on information reliability and power consump-tion. Different access strategies in accessing information from the WSN are

1.3 Thesis Objectives 5
possible. The access strategy should be designed as per the application re-quirement and should be flexible in order to choose the best access strategyat the given time and the situation.
Therefore, observing the above challenges in relation to accessing thedynamic information from a dynamic information sources, this thesis aimsto address the following research objectives mentioned in Section 1.3.
1.3 Thesis Objectives
Observing the challenges mentioned in Section 1.2, with regard to ac-cessing dynamic information from dynamic information sources, this the-sis presents a dynamic and reliable information accessing and managementframework, which enable application user to dynamically switch from oneinformation source to another as per the situation (may be the informationsource becomes unavailable) and their requirement (users requirements mightchange). The framework is used to study the behaviour of the informationdynamic in order to design dynamic information source selection algorithmand dynamic access strategy management. In particular, the thesis makes acomprehensive study on two important challenges mentioned above; namelypower consumption and information mismatch probability [6]: the prob-ability that at the time instant of using certain information for processing inthe application, this information does not match the value at the (physical)source. The main objectives of the thesis are summarized as follows:
• To develop a dynamic and reliable information accessing and manage-ment framework in order to study the behaviour of information dynam-ics in relation to sensor networks, with capability of flexible and easyreconfigurable nodes.
• To provide a comprehensive study on the impact of information ac-cess strategies on power consumption and information mismatch prob-ability, thereby providing analytical models for information mismatchprobability and power consumption.
• To provide an adaptive information access mechanism as per the ap-plications requirement, suggesting trade-off point between informationreliability and power consumption.
• To develop a dynamic information source selection algorithm basedon dynamic network parameters in order to select the source whichgives better performance in terms of information reliability and powerconsumption.

6 Chapter 1
1.4 Contributions of the Thesis
The contributions of the thesis are summarized as below:
• A dynamic and reliable information accessing and management frame-work is developed in order to show the concept of dynamic informationelements and to study the behaviour of information dynamics.
• A comprehensive study on power consumption and information reli-ability (in terms of mismatch probability) in relation to different in-formation access strategies is done. Based on this study, extendedmodels for mismatch probability to the one defined in [6] are devel-oped for different access strategy; reactive, periodic and hybrid. Thenew model captures both information sampling part and informationaccessing part in computing mismatch probability. The thesis alsoincorporates power consumption models which were never consideredpreviously with different access strategy.
• In this study, a better way of accessing to dynamic information elementsis proposed, where the power consumption is minimized in comparisonto periodic and reactive information access strategy.
• Based on analytical models developed, an adaptive information accessmechanism is proposed, which is useful for efficient resource manage-ment, especially energy consumption of an information source.
• An algorithm, which can dynamically choose information source basedon dynamic information elements at source, is developed. This algo-rithm is developed by using information reliability and power consump-tion as the selection parameters.
1.5 Structure of the Thesis
The rest of the thesis is structured as follows:Chapter 2 first gives brief introduction of Wireless Sensor Networks
followed by classifications of wireless sensor network applications exploringtheir requirements and specific characteristic features. Next, it explores thedesign issues and characteristics features of wireless sensor network. Thechapter also briefly introduces on information dissemination and routing pro-tocols and their classifications. Lastly, the chapter brings out some of the

1.5 Structure of the Thesis 7
Figure 1.2: Block diagram showing inter-relations among different chapters.
parameters which the wireless sensor network applications users may like toconsider during information transport over the network.
Chapter 3 provides an introduction to the basic models which areuseful to get fundamentals for the models aim to develop in the later chapters.It gives a basic information access model in general, followed by the processof how events are generated and detected by sensor nodes, which act as aninformation source in the models considered in this thesis. The chapter alsointroduces the information reliability models and power consumption modelsfor different types of information access strategies which are extensively usedin this study.
Chapter 4 describes information accessing and management frame-work. The framework is aim at showing the concept of dynamic informationsource to study the behaviour of information dynamics. The framework is de-veloped using Java based framework called Open Service Gateway initiatives(OSGi) [7].
Chapter 5 gives a comprehensive study on how the applications usersrequirement parameters are affected by the way how the information is beingaccessed over the network environment. In particular, the chapter examinesthree types of information access strategies; reactive, periodic and hybridaccess. It explores how the power consumption and information reliability

8 Chapter 1
depend on the access strategies being used. This chapter provides analyticalmodels for information reliability (in terms of mismatch probability) andpower consumption for each access strategy and makes a comparative studyamong these three access strategies.
Chapter 6 continues from the previous chapter and explores on adap-tive information access mechanism. An adaptive information access mecha-nism is aimed at efficient utilization of resources like energy.
Chapter 7 proposes an algorithm based on Chapter 5, which choosesinformation source that gives the best information reliability and minimumpower consumption. The algorithm is implemented with the help of theinformation accessing and management framework developed in Chapter 4.
Chapter 8 concludes the thesis by revisiting the objectives of the studyand summarizing the main points. The chapter also highlights the scope offuture extension in relation to this study.

Chapter 2
State of the Art: InformationAccessing in Wireless SensorNetwork
This chapter provides the state of the art on wireless sensor net-work focusing on information collection and dissemination meth-ods with respect to various applications it supports. In particular,firstly the chapter classifies the wireless sensor network applica-tions into four broad categories; Environmental data collection,Safety monitoring, Mobility support and Hybrid and finds outtheir characteristics features and requirements. Next, it exploressome of the design issues with respect to deployment followed bya short review of some information collections and disseminationmethods that are available in the literature. Then the chapterbrings out some of the existing frameworks which are developedwith similar objectives to study dynamic information elements.Lastly, the chapter lists some important requirement parametersin relation to information accessing from dynamic informationsource and argues that a reliable and dynamic information ac-cessing and management framework is required to study the be-haviour of dynamic information elements with different networkconditions.
9

10 Chapter 2
2.1 Introduction
A wireless sensor network (WSN) is composed of few or many au-tonomous and integrated/compact device called sensor nodes. These sensorsare generally equipped with sensing, communication and data processing orcomputation capabilities [8]. Recent advancement in the field of wirelesscommunication technology and the availability of integrated low-power sens-ing devices, embedded processors, wireless communication kits, and powerequipment, gives an enabling opportunity for the design of sensor nodes [9].WSN is a special kind of ad hoc network where many sensor nodes are madeto form a network whose sole purpose is to collect information from the re-gion of interest. However, it differs from traditional wireless ad hoc networkin many ways [10]. In terms of number of nodes, in WSN network, the num-ber of sensor nodes can be of several magnitudes higher than the nodes intraditional wireless ad hoc network, the sensor nodes are densely deployedand prone to failures due to several reasons; WSN topology is dynamic andchanges frequently and the sensor nodes have limited power, computationcapabilities and memory. Besides these many shortcomings as compared totraditional wireless network, WSN has found wider application areas in vari-ous fields. The increasing usage of WSN in various application [11, 12, 13, 14]starting from wireless body sensor network [15] to highly unpredictable earth-quake monitoring and alert system [16], show that few years down the line,its applicability will further grow in various fields. Its usefulness comparedto traditional wireless network becomes more visible since it can be used ina hostile environment where human accessible is impossible [3].
These sensor nodes communicate over a short range via a wirelessmedium and collaborate to accomplish a common task, like environmentalmonitoring, military surveillance, and industrial process control. Wirelesssensor networks have open up for new opportunities to observe and interactwith the physical environment around us. They enable us now to collect andgather data that was difficult or impossible before [3]. The wireless sensornetwork is used for different applications with specific purpose. A differentclassification of wireless sensor network is described in the following section.
2.2 Sensor Network Applications
Inspired by [17], this section classifies wireless sensor network applica-tions into four broad categories and brings out the different characteristicsfeatures in each category. Effort is made to include all the applications sup-ported by wireless sensor network into these four broad classifications.

2.2 Sensor Network Applications 11
2.2.1 Environmental Data Collection Application
An environmental data collection application is one where wireless sen-sors are used to monitor a region of interest for the purpose of study likechange in temperature pattern in order to monitor global warming [18]. Thistype of application of wireless sensor network is mostly used by researchersand scientists who want to collect several sensor readings from a set of pointsin a region of interest over a period of time and to study the pattern of changeand variations over different seasons of the year or time in the day. Theywould collect data over period of time from multiple points in the region andanalyze the data off-line. To be able to collect meaningful data, it has to col-lect at regular interval and in general the nodes are kept at the same knownlocation. The data collection can be done spreading over a month or someeven a year. Some of the characteristics features of this class of applicationare:
• Long lifetime of the network .
• Precision of measurement.
• Precise synchronization of time with respect to other nodes.
• Relatively static topology and low data rates.
• Data transmission can be delayed to increase or improve efficiency with-out much loss of performance.
2.2.2 Safety Monitoring Application
In this class of application, sensor nodes can be placed at fixed loca-tions throughout the environment to continually monitor one or more sensorto detect an anomaly. The sensors are not collecting any data instead theysend an alarm or message when there is certain safety violations in the sur-roundings. It is very essential that the sensor nodes are functioning. If theinformation being sent is over multi-hops then it is very important to checkthat the intermediate nodes are active and alive. For this reason, the sensornetwork which is deployed for this type of application must be configuredsuch that the nodes are responsible for confirming the status of each other.An example of this type of application is forest fire detection wireless sensornetwork [14]. Some of the features of this class of application are:
• Immediate response low latency is critical.
• Reliable communication of alarm or message.

12 Chapter 2
• Bursty nature of messages when safety violations are detected, therewill be huge amount of data which will be sent by the sensors.
2.2.3 Mobility Support Application
This group of wireless sensor network is composed of tagged objectswhich are monitored by wireless sensor networks. Wildlife habitat monitor-ing wireless sensor networks described in [13] is an example of this class ofapplication. Instead of sensing the environment data, the sensor nodes de-ployed for this type of applications need to sense the RF messages of thenodes attached to various objects like on the body of animal [17]. Some ofthe characteristics features of this type of applications are:
• Dynamic topology nodes move through the network.
• Mobile nodes connectivity will be continually changing.
• Flexibility (Scalable and dynamically adapt to changes).
• Tracking of mobile nodes - Reconfiguration of network after and joiningof mobile node.
2.2.4 Hybrid Application Networks
In some scenarios, it is possible to have all the above three applicationsrunning in a single wireless sensor network architecture, provided the singlearchitecture supports multiple applications. Take a scenario where wirelesssensor network is deployed for forest fire detection as a safety monitoringpurposes. The alarm message will be generated only when the nodes sensetemperature exceeding a threshold value. But this same deployment could beused as an environment data collection to monitor the temperature in thatregion. So, when the temperature is below the threshold, the WSN can act asan environment data collection application by sending temperature readingsperiodically or when it is demanded. This type of sensor network architecturewhich supports multiple applications [19] to run on single architecture hasadvantages in terms of usefulness of the system.
2.3 Design Issues and Characteristics
In general, the design goals of the wireless sensor network deploymentare set as per its purpose and they are application specific. As observed in

2.3 Design Issues and Characteristics 13
Section 2.3, the features and requirements for each application are different.In this section we bring out some of the design issues of sensor network,inspired from [8], and argue that with different characteristics features andrequirement of each application, what would be the scenario when a singlearchitecture needs to support hybrid applications.
2.3.1 Dynamicity
The dynamicity in wireless sensor network can be classified into threedifferent levels as topology dynamics, information dynamics and network con-ditions. A sensor network is composed of sensor nodes, sink(s) and events.The dynamics in topology is caused either by mobility of certain nodes asin mobility support application or by certain nodes being removed (batterydrained out, and becoming dead). Although, most of the sensor networksare considered to be static but some applications demands dynamic topol-ogy where the nodes are required to reconfigure after the topology changes.The information dynamics is due to change in information/events which thesensor network is made to monitor. One basic example of information dy-namic is target detection or tracking application where the phenomenon orevents change with time. The information dynamic is even relevant to theenvironment monitoring application. Take an example of a fire. The temper-ature may rise rapidly, even by a thousand degree Celsius within a minute forindoor housing [12] is not uncommon or even faster for dry, outdoor lands.This change of information value over a period of time couple by networkdelay in reaching the destination would have impact on the information re-liability. The dynamicity is also caused by network conditions. The linkconditions may change over time resulting different end-to-end delay.
2.3.2 Node Deployment
Depending upon the nature of application and the situation, sensornodes can be deployed in two different ways: random and deterministic de-ployment. In random deployment, the nodes are scattered in the region ofinterest randomly without any specific location or in some cases with someknown distributions like Poison point process [20] and [21]. These sensornodes are generally self-organizing creating an ad hoc infrastructure. Thistype of deployment comes handy in getting access to information sourceswhere human access is impossible. In some cases the sensor nodes are airdropped [3]. In this type of deployment, the location of the sink will playcrucial role in terms of energy efficiency and performance [8]. There is nopre-defined path which data can be routed in this type of deployment. So,

14 Chapter 2
the routing protocol used in this type of infrastructure also plays greaterrole for performance of the system. In a network with deterministic deploy-ment, each node has a deterministic location and data is routed throughpre-determined paths.
2.3.3 Power Consumption
Generally, sensor nodes are equipped with limited power supply. Insome cases, such as in [3], where sensors are air-dropped to monitor volcanoeruption, replenishment of power supply would be impossible. The lifetime ofthe node, therefore is depended on the battery lifetime. So, if the informationis collected over a multi-hop, then the network lifetime is also determined bythe battery lifetime of a single node at times. Hence, effective usage andmanagement of power consumption in sensor network take on additionalimportance. For this reason, we find most of the researchers are giving muchattention in designing energy efficient data collection algorithms and routingprotocols. It is also important to know how power is consumed in a sensornetwork. The power consumption can be divided into three domains: sensing,communication and pre-processing. The power consumption on sensing canvary from application to application and it depends on how sensor nodes aremade to sample the data, sporadic or regular interval. The maximum powerconsumption takes place in data communication. This includes both datatransmission and reception. The power consumption in data pre-processingis much lesser than the data communication [22].
2.3.4 Information Access Approach
Depending on the application type and their requirements, informationfrom the information source can be accessed in different ways. Applicationslike safety monitoring, in general want a system of sensor or sensor to au-tonomously report the sensed values and raise alerts whereas applications likeenvironment data collection may want the data to be accessed at every aftercertain interval. But, information can be retrieved in response to a requestmessage from the information user whenever the information is required.
In general, there are three types of communications or access strategies:reactive access, periodic access and event-driven [6]. In reactive access thesource node only sends information as and when the user demands. It is alsocalled on-demand access or query-driven access [23]. Periodic access takesplace where the source node collects the information and distributes to theuser at a constant periodic interval. It is also called clock-driven. This typeof access can be destined for certain subscribers or receivers. Event-driven is

2.3 Design Issues and Characteristics 15
similar to the periodic access, in a sense that both are proactive, but in thiscase, the information is not distributed at periodic time interval rather thesource sends when some events occur. The data access models being usedwill influence what type of routing protocols one need to use, especially tominimize the energy consumption and route stability [8].
2.3.5 Node Capabilities
A sensor network can be composed of sensor nodes with different ca-pabilities, although some deployments are found to be using same nodes interms of functionalities: computation, communication and power. But it isalways preferred to deploy with different types of nodes in terms of function-ality as all the nodes in a network do not have to have same capability. Suchdeployment makes the network more robust by supporting different require-ments. Depending on the application, node can be dedicated to a particulartask. As an example, the node which acts as a cluster head needs to beequipped with more power than the other nodes as it has more functionsthan the one which deployed as non-cluster head nodes. It depends on whattype of protocol it uses; some hierarchical protocols treat cluster heads dif-ferent from normal sensors, whereas some pick up cluster head among thenormal sensors with random or pre-defined selection algorithm.
As seen in the literature, most of the wireless sensor network deploy-ment supports one single application throughout the network. This type ofapplication specific or dedicated network is simple and do not pose muchtechnical issues related to data routing but has been seen not commerciallyviable where a network is shared several department with individual require-ments [24]. In this situation, minimizing investment and administrative costis vital aspect for the organization. This leads to an introduction of hetero-geneous sensor networks which compose of different kinds of sensor nodesfor each type of application. This raises multiple technical issues in relationto data routing and information dissemination. This is because different ap-plication has different set of requirement which leads to different data rates,which needs to handle with different data access models. Such heterogeneousenvironment makes data routing more challenging and would require heavierrouting algorithm. Although, wireless sensor networks have given new waysto provide information from variety of applications, irrespective of the natureof physical environment, but gathering and collecting information from sen-sor nodes is seen as a challenge. Data dissemination and gathering are twoterms used in sensor networks to describe two categories of data handlingmethods. Data dissemination is a process by which data and queries fordata are routed in the sensor networks whereas data gathering is to transmit

16 Chapter 2
data that has been collected by the sensor nodes to the base stations. Datagathering protocols aim to minimize the energy consumption and delay ofdata gathering process [25].
2.4 Information Collection and
Dissemination
Although, wireless sensor networks have given new ways to provide in-formation from variety of applications, irrespective of the nature of physicalenvironment, but gathering and collecting information from sensor nodes isseen as a challenge. Data dissemination and gathering are two terms used insensor networks to describe two categories of data handling methods. Datadissemination is a process by which data and queries for data are routed inthe sensor networks whereas data gathering is to transmit data that has beencollected by the sensor nodes to the base stations. Data gathering protocolsaim to minimize the energy consumption and delay of data gathering pro-cess [25]. Although there are differences between these two but almost allthe literature described them as routing protocols. Unlike traditional wirelesscommunications networks such as mobile ad hoc and cellular systems, wire-less sensor networks have the following unique characteristics and constraints[26]; high density sensor node deployment, battery power sensor nodes, lowmemory and processor capacity, self-configurable, unreliable sensor nodes,data redundancy, application specific and dynamic topology. Due to abovecharacteristics and constraints of wireless sensor networks, the extraction ofdata from the network is always a challenge. The main design challenges ofrouting protocols for wireless sensor network are: Energy, Processing powerand Memory. Some of the design challenges as reflected in [26] and [27] arehighlighted below but not limited to:
Large number of sensor nodes: Since most of the wireless sensornetworks composed of large sensor nodes, it is very difficult to have an ef-ficient addressing scheme like other wireless networks. The traditional IPscheme is not feasible to apply for wireless sensor networks. Moreover, thesensor nodes are deployed at random in hostile environment.
Limited energy capacity: Wireless sensor node, being a micro-electronic device, cannot be equipped with unlimited power supply. In somedeployment scenarios, replenishment of power might be impossible. So, thelife time of a node has strong dependence on the battery lifetime [10]. This isthe main challenge in designing wireless sensor networks. In practice, sensornetwork deployment makes sense only if they can run unattended for months

2.4 Information Collection and Dissemination 17
and years without running short of energy [28].
Flow of Data: Almost all the applications of sensor network requirethe sensory data from multiple sources to flow towards a single destinationnode called sink in contrast to the traditional networks.
Sensor node locations: Most of the proposed routing protocols as-sume that the sensors nodes are either equipped receivers with global posi-tioning system (GPS) [26] or use some localization techniques to estimatelocation [29]. But equipping every sensor node with GPS however, makessensor node expensive and the objective of making sensor affordable wouldbe defeated [30].
Data redundancy: Data collected by various sensor nodes are typ-ically based on common phenomenon; hence the probability of data redun-dancy is very high. The routing protocol needs to incorporate data ag-gregation techniques, where data from different source nodes are combinedaccording to a certain aggregation function, e.g. average, max, or min, todecrease the number of transmission, thereby achieving energy efficiency.
Application Specific: The sensor networks are application specific.The requirement of routing protocol changes as per the specific application.It is very challenging to design routing protocols which can meet the require-ments of all applications due to diverse applications.
Scalability: The size of the network grows, so the routing protocolsneed to be scalable to support the addition of sensor nodes. All sensor nodesmay not necessarily have same capabilities of energy, processing, sensing andcommunications. Therefore, the protocol needs to be scalable to supportsensor nodes with different capability features.
2.4.1 Classifications of Routing Protocols in WSN
Routing protocols play an important role in sensor networks becauseof its unique characteristics. It is different from the traditional networkrouting since it does not have fixed infrastructure, communicate via wirelesslink which is unreliable, and energy constrained nodes deployed in hostileenvironment etc. Many routing algorithms for wireless sensor network havebeen developed since the inception of wireless sensor networks, all aimingtowards challenges posed by its unique features as oppose to the traditionalnetworks. Different authors have classified into different group depending ontheir usage, functionality and applications [8, 26, 31]. We have classified intofour board categories based on the network structure inspired by [17, 32].

18 Chapter 2
Data Centric Routing
The protocols are differentiated into two categories called data-centricand address-centric. The address-centric routing protocols find the shortestpath between source and the destination with addressing scheme like IPwhereas in data-centric routing protocols focus is made to search routes frommultiple source nodes to a single destination node. In the sensor networks,data-centric routing is preferred where data consolidation and aggregation isdone by the intermediate nodes on the data coming from multiple sourcesbefore sending to the sink node. This way, number of data transmission canbe optimized, thereby achieving energy efficiency.
Hierarchical Routing
The hierarchical-based routing tries to build layers so that each layerdoes some specific job. It mainly aims in clustering the nodes where thecluster head does data aggregation and filtering of redundant data in orderto conserve energy. This forms two-layer routing, where one layer is used toselect cluster head while other is used for routing [16]. All nodes forwarda message for a node that is in higher hierarchy than the sender. The setof nodes which send message to the same aggregator is called cluster, whilethe aggregator is also referred as cluster head [32]. The node which acts as acluster head is considered to have more resources than other cluster membersas in [33] but however, some protocols like LEACH [34] change their clusterhead with some scheduling policies within the cluster members in order toevenly distribute the energy load among the sensors in the network.
QoS- based Routing
The Quality of Service (QoS) required by applications will influencethe selection of routing protocols. In terms of requirements, the qualityof service can be lifetime of a node, reliable information, energy efficiency,mobility support and so on. These requirements are different for differentapplications type. For instance, in some critical applications, the informationshould be delivered within certain period after it is being sensed. Further,applications like safety monitoring would be demanding information to bedelivered as soon as it is being sensed. On the other hand, applications likeusual environment data collection over the period to study the melting ofice in the Himalayan region [18] can effort to delay but its one of the mainquality of service could be accuracy with accurate time stamps so that auseful information is drawn.

2.4 Information Collection and Dissemination 19
Location-based Routing
Since sensor nodes have limited energy capacity, most of the routingprotocols aim to reduce the consumption of energy in routing processes. Inmost of the protocols location of the sensor nodes are used to find the distancebetween two communicating pairs in order to find the best possible path withlow energy usage. If location of a particular sensor node is known, query canbe sent to that particular location only without sending to other regionswhich will reduce the number of transmission significantly [9]. Location-based protocol makes use of the position information to relay data to certainregion of the network rather than the whole network.
Table 2.1: Shows trade-off metrics of each routing protocol category
Category of Proto-col
Trade-off Metric
Data-Centric RoutingProtocol
Power dissipation is adapted with the trafficpattern. A trade-off between power consump-tion and reliability. E.g. a family of data centricprotocol like SPIN [35], if the nodes interestedin data (destination) are far away from sourcenode, then the intermediate nodes will not relaysuch data.
Hierarchical RoutingProtocol
Efficient energy management, but scalabilityis restricted as nodes directly communicate tocluster head. An example of hierarchical rout-ing protocol is LEACH [34]
Location-based Rout-ing Protocol
Number of transmission is reduced as the infor-mation is sent to particular location only. Butusage of GPS makes expensive and the contri-tion of cheap sensors nodes are not suitable [30]
Quality of Servicebased Routing Proto-col
A trade-off between energy consumption anddata quality. But some protocols in this cate-gory like SAR [36] suffer from overhead of main-taining tables and states of each node, wherethere are huge numbers of nodes.

20 Chapter 2
2.5 Related Information Management
Frameworks
In the recent past, an increasing number of research works towardscontext aware information management framework have been found in theresearch community. This is due to availability of number of devices whichare capable of supplying information. Many of these devices are able tocommunicate and interact with global networks like Internet or any othernetwork environment. In this section, few such information managementframeworks are reviewed. Based on this review, this section describes howthe study in this thesis is different and which requirement parameters areaddressed in the study.
A high level description of a context management framework aimingto make components and applications in Personal Networks (PNs) contextaware is provided in [37]. It has also provided with a list of requirementsto context management framework. Although, a high level description andnumber requirements to context management framework are provided but inorder really implement, it is necessary to investigate how these requirementscan be achieved. However, the article has provided high level descriptionwhich really motivates in designing context management framework. In par-ticular, this work serves as a basic fundamental in finding out requirementparameters with regards to information accessing from remote dynamic in-formation sources.
Another high level description of a generic context management frame-work is provided in [38], providing how interactions among context informa-tion sources and context aware services, components and applications can besupported. Although, this work has provided an insight to initial design andspecifications of a generic context management framework, but it lacks theanalytical investigations. Investigations on how information dynamics andnetwork dynamics affect the context values would help in designing goodcontext management framework.
In [39] a mobile device oriented framework for context informationmanagement to solve the problems on context storage and communicationinefficiency is provided. The framework composed of four main components,data collector, data processor, context manager and local context consumer.The framework uses ontology based context model where each component isdefined by using Resource Description Framework (RDF) [40] language. Theauthors have claimed that the framework deals with real time applicationswith quick data access, power efficiency with privacy protection. However,the framework is restricted mobile phones and it is not applicable to other

2.6 Requirements in Relation to Accessing Dynamic Information Source 21
devices like PCs. Moreover, detail studies on how information reliability andend to end delay in accessing context information are not explored.
Architecture for distributed context management framework is pro-posed in [41]. Its aim is to establish an open framework to support develop-ment of ubiquitous services which can seamlessly interoperate with differentdevices. It is based on the standard protocol like Universal Plug and Play[42] so that all kinds of devices could connect to the ubiquitous network andall services can be dynamically deployed by any vendors into the network.However, the communication model which affects the information reliabilityand power consumption are not investigated in the proposed framework.
Although number of information management framework are seen inthe literature all aiming to providing context aware management system butmost of the framework proposed needs to be supported by investigating howdifferent parameters like the way how information is being accessed, the na-ture of information element at the source and the delay in accessing dynamicinformation do impact the system performance.
2.6 Requirements in Relation to Accessing
Dynamic Information Source
Knowing the classifications of wireless sensor network applications andits characteristic features from the design issues to application requirementspoint of view, this section identifies the requirements of application withrespect to information access to dynamic information sources. It is also ob-served that various routing protocols are developed for dissemination andcollection of information from wireless sensor networks. However, most ofthese routing protocols are typically designed based on a certain set of cho-sen parameters, depending on the application, in making routing decisions.Due to different features and requirement of each application, a single rout-ing protocol which can be used with any application in general is hard todesign. Therefore, in order to make sensor networks more feasible, thereshould be a system whereby any applications can be built on top of any ar-bitrary communication protocol stack [43]. To design such an informationmanagement framework, it is important to know the information attributesin relation to information access from dynamic information sources. Fromthe short literature review done on existing information management frame-works in Section 2.5, it is observed that there are number of requirementparameters that need to study while designing information access manage-ment framework with regard to dynamic information elements. Motivated

22 Chapter 2
from the requirement parameters listed in [37], this section brings out thefollowing requirement parameters with respect to accessing dynamic informa-tion sources. How these parameters are affected by the dynamic informationelements, changing network conditions (different delays) and the way howinformation is being accessed are investigated in later chapters.
2.6.1 Information Reliability
All applications the best possible information reliability, although thelevel of information reliability requirement would be different for differentapplication. In the literature [44], reliability is defined as the characteris-tic of information, in which information has not change its value when it istransported from the source to the destination. This definition of informationreliability does not take into account the freshness of information. The delayin getting information coupled by the information dynamic at source, thereis a probability that information being used by the information user does notmatch the current true value at the remote source. Therefore, this thesis in-vestigates information reliability in terms of mismatch of information in orderto quantitatively support in designing and developing information accessingand management framework in relation to dynamic information at source.Although, the particular information reliability metric, mismatch probabilityis relatively new in the research community but off late its usage and studyhas gain some attention as seen from [26, 45, 46, 47]. Out of these exist-ing works, probabilistic models for access strategies to dynamic informationelements are developed in [6]. Three different access strategies namely; reac-tive approach, periodic and triggered by changes of the information elementsare investigated. The study has investigated three performance parameters;network overhead, access delay and mismatch probability. In doing so, amathematical model for mismatch probability under each access strategy isprovided. Based on this work, in this thesis, an extension of mismatch prob-ability models developed in [6] is provided. This thesis also investigates andstudies the power consumption model under each information access strategywhich is not explored in the existing works.
2.6.2 Timeliness
Timeliness with respect to information accessing from a source canbe defined as the time required reach the information from the source todestination. In terms of information source like sensor node it can be definedas the time needed to reach the information at the information user afterbeing generated in response to sensed event from information area. This

2.6 Requirements to Information Accessing 23
Figure 2.1: Pictorial definition of information reliability and timeliness with respect todynamic information elements.
basically is same as the end-to-end delay and relates to the freshness ofinformation. In order to reduce the mismatch of information, less end-to-end delay is desirable by all applications or information users. Owing todifferent network conditions due to various reasons like different routes anddifferent delay rates at different instant of time, the end-to-end delay doesnot remain constant. Depending on applications, the end-to-end delay willhave greater impact for some applications while some can bear the longerdelay. Therefore, depending on applications accessing of information can betuned so that the application satisfies with their requirement. Such adaptiveinformation access mechanism based on network conditions and dynamicinformation elements are investigated in this thesis.
Figure 2.1, show how these two parameters can be explained in the formof diagram in relation to dynamic information elements. ti denotes time andthe letters denote information value. So, t1, x means, at time t1, the valueof information is x. The figure shows that the probability of using wronginformation not only depends on the end-to-end delay but also depends onthe rate at which the event is generated. This is depicted in the figure wherealthough, the delay between t3 and t5 is less than the delay between t4 andt6 but mismatch of information occurred in the former case. This is becausethe rate of change of event is faster in case of the former.
2.6.3 Power Consumption
As highlighted in Section 2.3.3, study on power consumption is es-sential in wireless sensor network as sensor nodes are (usually) powered bybattery and are deployed in a hostile terrain for some applications. For someapplication scenarios, recharging of battery is impossible; therefore, the life-

24 Chapter 2
time of sensor node has strong dependence on battery lifetime. The powerconsumption in WSN can be divided into three domains; sensing, communi-cation and data processing [9]. Among these three, communication consumesmaximum power, which accounts for information transmission and reception.It is therefore, there is strong correlation between power consumption andthe way how information is being accessed from the source. As differentapplications have different level of requirement, depending up on the appli-cation, the system can either increase or decrease the power consumption.In particular, in this thesis investigation of how information access can beadapted as per the application requirement is provided in order to supportin designing the information accessing and management framework.
2.7 Conclusions
This chapter explored the state of the art in wireless sensor networkswith regards to various applications and the information collection and dis-semination protocols. Special focus was made on the impact of informationdynamics on information reliability and power consumption and to designdynamic and reliable information accessing and management framework tostudy the behaviour of information dynamics. The chapter also exploredsome of the existing information management frameworks, from which manyuseful points in terms of requirement parameters in relation to accessing dy-namic information elements were acquired. As a conclusion of this chapter,the observations are revisited here:
• There are various types of wireless sensor network applications withdifferent characteristics and requirements.
• Several number of routing protocols are available. However, each pro-tocol is designed for a specific application.
• No single routing protocol can satisfy all the applications because ofdifferent characteristics and requirements.
• There are some information management frameworks which aim to pro-vide interoperability within different applications irrespective of whatrouting protocols or requirement they have.
• The dynamic information element, which changes over time at source,is seen as a challenge in designing information management framework.

2.7 Conclusions 25
• Lastly, the chapter lists three main requirement parameters in relationto accessing to dynamic information elements; information reliability,timeliness (delay) and power consumption.
Therefore, in order to support in designing information managementframework that manages dynamic information elements, it is necessary tostudy how the dynamic information elements coupled by changing networkconditions do impact the above mentioned requirement parameter. So, thisthesis aims at designing information accessing and management frameworkand makes an extensive study on the impact of information dynamics andnetwork conditions on information reliability and power consumption, bothare relevant performance metrics in wireless networks.

26 Chapter 2

Chapter 3
Preliminaries and Basic Models
This chapter starts by describing generalized information accessmodel being considered in the study. It also briefly introduces theprocess of event generation and detection in wireless sensor nodes.This helps in knowing the behaviour of information dynamics withregards to how it is generated, at what rate it is likely to changeand so on, which are basic requirements to modeling informationreliability. The chapter also briefly describes the power consump-tion model and different types of information access strategies thatare considered in the study. The main objective of this chapter isto introduce the basic models, based on which further models canbe developed depending on application and its purpose.
27

28 Chapter 3
3.1 Information Access Process
Figure 3.1: Abstract view of information access model.
Figure 3.1 shows an abstract view of how information accessing fromwireless sensor network is modeled in order to study the information dynamicin this thesis. The model consists of wireless sensor nodes deployed in a regionof interest called information area. The sensor nodes can be of same type ordifferent types depending up on the purpose and applications. Throughoutthe thesis, these sensor nodes are referred as information sources, whichgenerate information in response to sensed events in an information area.As information dynamics is more applicable to wireless sensor network, themodel here describes information sources as wireless sensor nodes, but itshould be noted that the model can be applied to any device which providesinformation. The model assumes that the generated information is accessedby the information user via network environment. This network environmentcould be any; internet or wireless local area network or wireless wide areanetwork, etc. The only requirement is that the information user should haveconnection to access remote information sources.
Generally, a typical multi-hop wireless sensor network generates twotypes of information [5] 1)locally generated packets and 2) relay packets.The locally generated packet consists of information which is locally sam-pled by sensors, whereas relay packets are the ones which are received fromneighbouring nodes. The local packets mainly depend upon the physicalphenomenon of the region of interest and application type, while the relaypackets depend on the network parameters. Further, the information gener-ated in response to sensed events can be classified into two categories [48] as

3.2 Event Process and Event Detection 29
atomic (information entity is realized through a single message) and compos-ite (which considers aggregation or composition of information from differentnodes) information. The study in this thesis considers atomic informationand mainly focuses on locally generated packets.
Information accessing in wireless sensor networks is the process of send-ing individual reports from sensors to the sink node. One way of sendingindividual report is with data aggregation, where each sensor on the waycombines (fuses) reports from other sensors with its own reports and for-wards a single report, whereas in some cases, the individual reports are justrelayed by the intermediate nodes without any data aggregation. However,there is also a middle way, where collecting correlated data with partial aggre-gation. In this thesis, the model considers the later one; where an individualsensor sends its report and the intermediate nodes only relay the reportswithout any data aggregation. This means that the nodes or devices on theroute in between the information source and information user are not consid-ered for the analysis. The study assumes that the intermediate nodes relayinformation without altering the value; however the delay due to relayinginformation is the key performance factor the study will focus on at laterchapters. This means, that any routing or retransmissions will be assumedbeing a part of the resulting end-to-end delay distribution that study focuseson. Further description on how the information sources are modeled can befound in Chapter 4, however, in the next section, a brief study on the eventprocess and event detection is given. This is because the event process playsa crucial role, as it can be seen later, on information reliability.
3.2 Event Process and Event Detection
Definition of an Event:An event is said to occur when a changein information value exceeds some preset threshold values
In order to analyze information reliability in the later chapters, it isnecessary to investigate how events are detected and processed by the sensornode. However, it is important to realize that this subsection is not meant tobe rigorous mathematical analysis, but rather as a motivation for the param-eters of the event process that will be used later in Chapter 4. The basic wayof obtaining data from sensors is that some electronic component changes thephysical attribute of interest into an electrical signal which is lead throughsome analog filters to the A/D converter of the sensors microprocessor partas shown in Figure 3.2. In this process several sources of noise exist, as well

30 Chapter 3
Figure 3.2: Architecture of typical sensor node and how information is generated in re-sponse to sensed events.
Figure 3.3: Process of an event detection.
as in the A/D conversion procedure. Therefore, often signals are filtered dig-itally afterwards; to cut-off undesired higher frequencies of the signal causedby the added noise (which usually can be considered white noise). The natureof the process being sampled is very different from among different physicalattributes, e.g. temperature or lighting behaves very differently. However,since the focus of the study is in the rate of change of a discretized signal,consider a sinusoidal function with some white noise added to it, in orderto evaluate when an exponential distributed inter event rate a good assump-tion, that is used in later chapters of this study. Consider a sum of numberof sinusoidal signals as
f(t) =N∑i=1
Aisin(ωit+ φi) +N(0, σ2) (3.1)
with Ai as the amplitude, ωi as the frequency, φi, a random phase indicatinga random moment of the process which the sampling procedure starts, σ2,the variance of the white noise being added due to the various noise sourcesand N is the number of sinusoidal signals used. A graphical representationof the process of an event detection is shown in Figure 3.3.
In order to get different signal scenarios, using different frequency and

3.2 Event Process and Event Detection 31
amplitude components, a different signal is created from the base sinusoidalwave and the variance of the white noise of σ being added. For example, con-sider an area under temperature surveillance by which the temperature canbe expected to deviate by 10◦C over time from some average temperature.Weather change may be one reason for such change, and may happen overtens of minutes. Such temperature deviation scenarios are created in thissection where the temperature goes between +10◦C and -10◦C over a certaintime interval in in a different shapes, and sampled different time intervals.Some noise is added in the sampling process and then digitally filtered with a5th order Butterworth filter with a cut-off frequency of 2.5 Hz. These differ-ent scenarios give a better picture to realize real signal rather than assuminga simple sinusoidal signal, thereby closely representing the real applicationscenarios where different applications generate events with different distribu-tions. Therefore, the study is interested in the following: In any given timeof the signal, take a sample, and then investigate how long it takes for thisvalue to change significantly. By a significant change, it means that an eventhas occurred. Then basically, it is to solve for each t for dt in the followingequation:
|f(t)− f(t+ dt)| > threshold (3.2)
If f(t) is the noisy signal, then the resulting cumulative density functionof the dt’s can be obtained by using particular threshold values with a certainnoise level σ. The resulting cumulative density function of the dt’s canbe influenced by the different parameters like threshold values being set,sampling and cut-off frequencies being chosen and the level of noise in thesignal.
From (3.1) and (3.2) several parameters can be identified that influencethe output CDF which are needed at later stage of the study. Those are:the amplitude (A), the frequency (ω), the noise level (σ2) and the thresholdlevel. This section provides some simple analysis of modeling process of eventdetection and find out at what parameters influences event inter arrival time.
In particular, the section explores the following three parameters : 1)Sampling and cut-off frequencies with respect to signal frequency 2) Noiselevel and 3) Threshold values.
1) Sampling and cut-off frequency
In order to show how different frequencies value chosen do affect thedistribution of inter event arrival rate, a different frequency and amplitudecomponents are used, thereby getting a signal which is a sum of number ofsinusoidal signals. The approximated CDF with fitted exponential distribu-tion is compared with the measured (constructed) CDF, thereby showing the

32 Chapter 3
(a) (b)
Figure 3.4: (a) True signal and filtered signal with noise (σ = 0.5◦C), with frequenciesof [1/100 1/50 1 3] Hz and corresponding amplitude components of [5 3 2 1], using athreshold of 1 and sampling frequency = 10 Hz (filter cut-off frequency = 2.5 Hz).(b)Corresponding CDF of events based on the filtered signal and the approximated CDFusing an exponential distribution.
(a) (b)
Figure 3.5: (a) True signal and filtered signal with noise (σ = 0.5◦C),(b) CDF of eventsbased on the filtered signal and the approximated CDF using an exponential distribution.A frequencies of [1/100 1/50 1/10 1/2] Hz and corresponding amplitude components of [53 2 1], using a threshold of 1 and sampling frequency = 10 Hz (filter cut-off frequency =2.5 Hz).

3.2 Event Process and Event Detection 33
deviation from exponential distribution.
(a) (b)
Figure 3.6: (a) True signal and filtered signal with noise (σ = 0.5◦C), with frequenciesof [1/800 1/500 1/300 1/100] Hz and corresponding amplitude components of [5 3 2 1],using a threshold of 1 and sampling frequency = 10 Hz (filter cut-off frequency = 2.5 Hz).(b) Corresponding CDF of events based on the filtered signal and the approximated CDFusing an exponential distribution.
In Figure 3.4(a), the cutt-off frequency which is greater greater thanthe highest frequency component of the signal is set. The comparison be-tween the measured CDF and approximated exponential CDF is shown inFigure 3.4(b). In Figure 3.5(a), the frequency of the signal component isreduced so that the cut-off frequency is greater than the highest frequencycomponent of the signal and the corresponding CDFs comparison is shown inFigure 3.5(b). The frequency of the signal component is further reduced soas to see how the the CDF of the inter event arrival time is affected as shownin Figures 3.6(a) and 3.6(b). Observing the CDF plots in Figures 3.4(b),3.5(b) and 3.6(b), it is clear that the sampling frequency and the cut-offfrequency have to carefully be selected for an inter event arrival time to be-have as an exponential distribution. Further, assume memoryless property,although it may not hold completely due to representativeness of the signal.It is therefore, important to investigate on the limits for the approximationfor an exponential distribution, at which parameter setting, does the interevent arrival time can be assumed as exponentially distributed.
2) Noise level of the signal
Assuming that the signal is sampled with desired frequency values,whatis the impact of noise level in the signal? In order to study this, various val-

34 Chapter 3
(a) (b)
Figure 3.7: (a) True signal and filtered signal with noise (σ = 1.0◦C), with frequenciesof [1/800 1/500 1/300 1/100] Hz and corresponding amplitude components of [5 3 2 1],using a threshold of 1 and sampling frequency = 10 Hz (filter cut-off frequency = 2.5Hz).(b) Corresponding CDF of events based on the filtered signal and the approximatedCDF using an exponential distribution.
(a) (b)
Figure 3.8: (a) True signal and filtered signal with noise (σ = 0.5◦C), with frequenciesof [1/800 1/500 1/300 1/100] Hz and corresponding amplitude components of [5 3 2 1],using a threshold of 1 and sampling frequency = 10 Hz (filter cut-off frequency = 2.5Hz).(b) Corresponding CDF of events based on the filtered signal and the approximatedCDF using an exponential distribution.

3.2 Event Process and Event Detection 35
ues of σ are used and analyzed how the measured CDF of inter event arrivaltime deviates from the approximated CDF to exponential distribution. It isobserved that the exponential assumption is appropriate with low frequencysignal with low noise level. The observation is shown in Figures 3.7(b),3.8(b)and 3.9(b).
(a) (b)
Figure 3.9: (a) True signal and filtered signal with noise (σ = 0.1◦C), with frequenciesof [1/800 1/500 1/300 1/100] Hz and corresponding amplitude components of [5 3 2 1],using a threshold of 1 and sampling frequency = 10 Hz (filter cut-off frequency = 2.5Hz).(b) Corresponding CDF of events based on the filtered signal and the approximatedCDF using an exponential distribution.
3) ThresholdAssuming that the signal has permissible noise level and sampled with
desired sampling frequency (with correct cut-off frequency), analysis is donehere to show how the threshold value affects the distribution of the interevent arrival time. The results are plotted in Figures 3.10(a), 3.10(b), 3.10(c)and 3.10(d). It is observed that a threshold value of 1 and above but be-low 3 results measured CDF as comparable with the approximated CDFof exponential distribution, assuming the rest of the parameters are chosenappropriately.
It can also be shown using probability plot that the distribution of interevent arrival rate more or less follows exponential distribution, provided theparameters mentioned above (frequency, threshold and noise level) are chosenappropriately. Figure 3.11 shows probability plot showing that the measuredCDF of event is not far from the approximated CDF considering exponentialdistribution.
To summarize, in order to assume inter event arrival time as expo-

36 Chapter 3
(a) (b)
(c) (d)
Figure 3.10: CDF of events based on the filtered signal and the approximated CDF using anexponential distribution. Frequencies of [1/800 1/500 1/300 1/100] Hz and correspondingamplitude components of [5 3 2 1], using a signal with noise (σ = 0.5◦C) and samplingfrequency = 10 Hz (filter cut-off frequency = 2.5 Hz). a) Threshold = 0.1, b) Threshold= 1.0 and c) Threshold = 3.0 and d) Threshold = 10.0
nential distribution, there is a need to appropriately choose the parameterswhich influences the cumulative density function of inter event arrival rate.The following points are observed from the analysis carried out above inorder to assume exponential distributed inter event arrival rate:
• Low frequency and/or low amplitudes types of signal, with appropriatenoise (say, σ = 0.5) component
• An appropriate threshold value (Threshold value of above 1 and below3, observed to be appropriate as shown in above analysis)
• Proper digital filtering, i.e. cut-off frequencies do not impact the eventrate (or at least is fixed and same for all subsequent evaluations).

3.2 Event Process and Event Detection 37
Figure 3.11: Probability plot for exponential distribution, with frequencies of [1/800 1/5001/300 1/100] Hz and corresponding amplitude components of [5 3 2 1], using a signal withnoise (σ = 0.5◦C) and threshold of 1.5 and sampling frequency = 10 Hz (filter cut-offfrequency = 2.5 Hz).
(a) (b)
Figure 3.12: (a) True signal and filtered signal with noise (σ = 0.5◦C), with frequenciesof [1/800 1/500 1/300 1/100] and corresponding amplitude components of [5 3 2 1], withthreshold of 1.5.(b) Corresponding CDF of events based on the filtered signal and theapproximated CDF using an exponential distribution.
After choosing appropriate parameters with the help of analysis done above,in the following, a further analysis is carried out by using Two- sampleKolmogorov-Smirnov Statistic to find out the difference between measuredCDF and approximated CDF (exp.) in order to show the deviation from theassumed distribution. The KolmogorovSmirnov to test whether two under-

38 Chapter 3
(a)
(b)
Figure 3.13: Mean values of approximated exponential distribution of inter event timesfor frequencies [1:2:20] Hz of signal frequency, and amplitudes [1:2:20] of signal amplitude,using a threshold of 1.5 and sampling frequency of 10 Hz (and filter cut-off frequency at2.5Hz).
lying one-dimensional probability distributions difference is given by
Dn,n′ = supx|F1,n(x)− F2,n′(x)|,
where F1,n and F2,n′ are the empirical distribution functions of the first andthe second sample respectively.
If f(t) is the noisy signal in Figure 3.12(a), the Figure 3.12(b) containsthe resulting cumulative density function of the dt’s found for particularexample with parameters reflected in the caption. One can approximate thedistributions of dt’s with the smooth curve which in this case has a meaninter event time of 2.4 sec (or the rate of 0.4 events/sec). The noise levelis fixed to 0.5 and the threshold is set at 1.5. The signal is sampled at 10

3.2 Event Process and Event Detection 39
Hz and the data is run through a digital 5th order Butterworth filter with acut-off frequency of 2.5Hz.
Figure 3.13(a), shows the approximated rate value for an exponentialdistribution for different frequencies and amplitudes (i.e. demonstrating dif-ferent types of information dynamics) for the signal shown in Figure 3.12(a).Figure 3.13(b) shows the Kolmogorov-Smirnov Statistic Test plot, showingthe difference between measured (constructed) CDF and approximated CDFwith exponential distribution. The plot reveals that the difference is lesssignificant at low frequencies and low amplitude area, which are also thescenarios with low event rate distributions.
(a)
(b)
Figure 3.14: Mean values of approximated exponential distribution of inter event timesfor threshold level [0.1:0.1:1] degree, and sampling frequency [1:1:10] Hz of a signal ofamplitude [5 3 2 1] and frequency [1/800 1/500 1/300 1/100] Hz (16 minute) and σ = 0.5◦C.
Figure 3.14(a) and Figure 3.14(b) show the relation of the signal shownin Figure 3.12(a) with varying threshold level and sampling frequency (witha cut-off frequency of the digital filter of 1/4th of the sampling frequency).

40 Chapter 3
These plots reveal that although the sampling frequency does have an impacton the event rate, but then if the threshold level is chosen appropriately(from the analysis done before), e.g. at 1.5, the impact is relatively low.Therefore, choosing an appropriate threshold value is emphasized so thatthe approximations error is kept low.
As a conclusion on this analysis, in later chapters, the study focuseson event processes which have the following properties:
• Low frequency and/or low amplitudes types of signal, with relativelylow noise component
• A threshold value chosen appropriately using the described thresholddetection mechanisms for indicating events
• Proper digital filtering, i.e. cut-off frequencies do not impact the eventrate (or at least is fixed and same for all subsequent evaluations).
• No (or insignificant) influence of sampling frequency to the approxi-mated event rate
• The resulting discrete event process is assumed Poison process.
3.3 Information Reliability Model
Figure 3.15: Message chart diagram of information access process.
The information accuracy or reliability is measured in terms of differentparameters in different ways. In [49] and [50], the information accuracy ismeasured in terms of mean square error which calculates the error betweenthe expected value at the receiver and the real value at the source. The

3.4 Information Access Strategies 41
information which is generated in response to the sensed events at sourcehas to be transported to the destination, where it is processed or used. Mostof the existing routing protocols assume that the information coming fromthe source is reliable and trustworthy [44]. But, the routing protocols are notable to estimate what is the probability that the received information valueis the same as the value at the source at the time when the information isbeing used. Therefore, in this thesis, a parameter called mismatch probabilitydefined from [6], which is an event based reliability measurement metric isused. In the context of this study, the mismatch probability is defined asthe probability that information value used and processed by the client attime t3 is not same as the one which is available at (physical) source at timet3, (see Figure 3.15). This reliability parameter is based on the freshness ofinformation rather than the difference between the information value sentfrom the source and the information value received at the destination. Therecan be several parameters that needs to be estimated and investigated inrelation to information reliability but only an event rate (λ) is consideredhere. Although, estimating more parameters may lead to more accurate insome sense but requires potentially much more parameters to be estimated,thereby making the model very complex to implement. Therefore, dealingwith single parameter leads to the low model complexity, however requiressome appropriate signal tuning prior to the usage. At the later stages inthe study, it shows that things are more simplified considering exponentialdistribution for event rate. This also simplifies computations that may needto be executed in near real time. Therefore, whenever nothing is specified,the study assumes all exponential distributions and focuses on the followingparameters in extending reliability models described in [6] in later chapters.
• λ, event rate assumed as exponentially distributed
• T, a sampling time interval
• τ , a sampling rate, assuming exponential distributed time intervals
• ν, stochastic network delay rate
3.4 Information Access Strategies
Communications between information source and the information usercan occur in different ways depending on the quality of service requirementsof the application or the purpose of the network as a whole. In general,

42 Chapter 3
there are three types of communications or access strategies: reactive access,periodic access and event-driven [6].
1. Reactive Access Strategy : In reactive access the source device only sendsinformation as and when the user demands. It is also called on-demandaccess or query-driven access [23].
2. Periodic Access Strategy : Periodic access takes place where the infor-mation source collects the information and sends or distributes to theuser at a constant periodic interval. It is also called clock-driven. Thistype of access can be destined for certain subscribers or receivers.
3. Event Driven Access : Event-driven is similar to the periodic accessstrategy, in a sense that both are proactive, but in this, the informationis not distributed at periodic time interval rather the source sends whensome events occur. However, this study explores an access methodwhich is not purely an event driven. The information is retrieved only ifthe information value has changed from the previously retrieved value.This is called as Hybrid Access Strategy in this study. For checkingwhether the information has change in value, a small constant delayis introduced in the analysis at later stage in the study. This is anew model of access strategy discussed in this study which was notconsidered in [6].
Referring to Figure 3.15, information user can use any of these accessstrategies to access information source. An investigation of how the wayinformation is being accessed does impact the information mismatch proba-bility is done at later chapters in this study.
3.5 End-to-End Delay Distribution
The information reliability in terms of mismatch probability can be af-fected by the time the information takes to reach the destination. Therefore,in order to analyze an impact of information access strategy on informationreliability, it is necessary to study how the end-to-end delay affects informa-tion reliability. For simplicity, the end-to-end delay distribution is assumedto be exponentially distributed in our analysis later. This is reasonable as theobjective of this study is not to develop the delay models and do the deeperanalysis, rather to show the proof-of-concept on how dynamic informationelements do impact information reliability and power consumption. Nev-ertheless, compares the assumed exponential delay distributions with more

3.5 End-to-End Delay Distribution 43
complex delay distribution model in order to show how much deviation doesexponential distribution has. Consider the network as shown in Figure 3.16.The source node(S) and the destination node(D) has several intermediatenodes. If the route chosen is S-2-6-D, then for such scenario, inspired from[5], the delay can be modeled by discrete time Markov chain as shown inFigure 3.17. Assuming, the delay rate from each node is exponentially dis-tributed [51, 52] the overall mean delay is computed using matrix exponentialdistribution as described. Considering same delay rate(a1 = a2 = a3 = ν)from each node and retransmission delay rate of ν ′ as shown in Figure 3.17.The progress rate matrix as per Figure 3.17 given by β, starting vector by P
Figure 3.16: Considered Network sce-nario.
Figure 3.17: Markov Model, Transitiondiagram.
and vector e′ to denote transpose.
β =
a1 −a1 0ν ′ a2 −a2
0 ν ′ a3
, P =(1 0 0
), e′ =
111
The cumulative distribution function of delay rates can be computed
asF (t) = 1− Pexp(−βt)e′ (3.3)
The delay distribution in case of without retransmission can be modeled bysetting ν ′ = 0. As per Figure 3.17 the retransmission delay rate ν ′, withprobability of retransmission p can be computed as
ν ′ = (ν − ν(1− p))/(1− p)
There are possibilities of developing complex end-to-end delay modelsusing complex Markov Chain Model as provided in [5]. In [5], end-to-enddelay distribution is modeled by considering entire network as a queueingnetwork and the communication system at each node modeled by a discretetime Markov chain. However, in this study, such complex delay distributionsare not considered, so as to keep the system more simple and to stick to theobjective of the study.

44 Chapter 3
3.6 Power Consumption Model
Inspired from [53], in wireless sensor network applications, the powerused by a node consists of the power consumed by receiving, transmitting,listening for events on the radio channel, sampling data and sleeping. There-fore, the total power consumption can be modeled as
Pt = Psamp + Ptx + Plisten + Psleep + Precv (3.4)
where, Psamp, Ptx are the amount of power dissipated for sampling and trans-mitting respectively, Plisten for listening to radio channel, Psleep for sleep modeand Precv for receiving. This power consumption model is used in later chap-ters for investigating the impact of information access strategies on powerconsumption and information reliability. Psamp and Ptx are two parameterswhich this study explores in relation to information accessing from a remotedynamic information source. In relation to Figure 3.15, Psamp is power ex-pend when an information element is sampled. This happens at a rate givenby the sampling rate τ , which is stochastic and assumed to be exponentiallydistributed. The information is sample at an average rate of τ and storedin cache. Ptx is the power expend on sending/accessing information fromcache to information user. This is affected by the end-to-end delay betweeninformation source and the information user. This delay will be given byt3 − t2 as per the Figure 3.15.
At later stages in this study, the impacts of these access strategies onpower consumption and information reliability are explored both analyticallyand with the help of simulation.
3.7 Conclusions
The preliminaries models which are fundamental and basic requirementfor the further investigations of information dynamics are described here. Insummary,
• the chapter described the main information access process being con-sidered
• a brief analysis of the event process and event detection were also pro-vided in order to understand the behaviour of dynamic informationelements.
• different strategies in accessing information from information sourcewere introduced.

3.7 Conclusions 45
• an introduction to end-to-end delay distribution is provided. This intro-duction provides an insight on how delay distributions can be modeledas per the level of complexity and scope of the study.
• a general power consumption model, which is used for further develop-ment of power consumption models under different information accessstrategy was described.
As mentioned in Section 3.2, the chapter is not meant for rigorous math-ematical analysis on event process and detection, but rather a motivationfor the following chapters. Therefore, there are possibilities to explore fur-ther analysis with rigorous mathematical analysis. With the simple analysiscarried out on the event process and detection, in later chapters the studyassumes exponential distributed event inter arrival rate with low frequencyand low amplitude signals with appropriate noise component. The chapteralso provided some comparative study by considering different distributionsfor inter arrival time and investigating how far is the exponential distributionconsidered in this study from other distributions.

46 Chapter 3

Chapter 4
Proposed Framework
This chapter describes the proposed framework architecture fordynamic and reliable information accessing and management inheterogeneous wireless network. The chapter consists of severalcomponents which correspond to particular function and purpose.The key components are: information source model - which dealswith event generation and sampling of events, event monitoringmodel - which monitors information sources and network param-eters, and access management unit - which manages how infor-mation is being accessed from the source. To evaluate the per-formance of the framework, a computation delay with respect tonumber of components running within the framework is provided.
47

48 Chapter 4
4.1 Motivation
Generally, the information which wireless sensors are made to collectis dynamic and it changes over time. This dynamic behaviour of informationleads to using wrong value of information at the user end. In order to studythis information dynamics, it is necessary to have a framework which mon-itors these dynamic parameters like event rate, rate of change of delay etc.Although the existing simulation packages like Network Simulator-2, Matlabetc. are widely used and largely accepted, however, it is found that it is nottrivial to model which can monitor these information dynamics in order toinvestigate their impacts; particularly, on information mismatch probability.But designing robust and dynamic simulation package is not an objectiveof this study; rather its aim is to facilitate in investigating the informationdynamics with different network conditions. In particular, the frameworkis being developed in order to accomplishing following tasks, which are de-scribed as real life scenarios.Scenario A
As technology in wireless networks advances, there is growing numberof service providers. For example, Personal Area Network (PAN), WirelessHotspots, Wireless Local Area Network (WLAN), etc. Look at below sce-narios:
• The security department wants to set up wireless sensor network basedintrusion detection system using surveillance camera in the corporatepremises.
• The maintenance department wants to set up wireless sensor networkto monitor the temperature in the premises in order to prevent fire.
• The top level management wants to monitor the air quality (pollutionlevel) in the premises.
For the above three applications, the organization requires three differentwireless sensor networks to provide three different services. The total invest-ment cost will be reduced if all the information sources can be accessed usingthe same system.Scenario B
Contrary to Scenario A, sometimes, we face a situation where in themiddle of accessing particular information from a particular source, thesource of information either gets disconnected or not being reachable. Thismay be caused by several reasons like network signal might have problem, orthe user is moved to a region where source cannot be reached, or it can be

4.2 Proposed Framework Architecture 49
other way round, that the source might have moved, if the information sourceis mobile. In such situation, if there is another information source which canprovide the same information, it is desirable to dynamically switch to thelater without disrupting the continuity or getting disconnected.
Therefore, the reason behind developing this framework is to show theconcept of dynamic switching from one information source to another basedon the information dynamics and delay. To test the working of the frame-work, the information mismatch probability in accessing remote dynamic in-formation is estimated using this framework. Further to validate the results,these estimated mismatch probability values are verified using the analyticalmodels in Chapter 5. In addition, the framework is also used to implementreliable information source selection and management algorithm based on in-formation mismatch probability and power consumption in Chapter 7. Thedetailed description of the framework architecture is given in the followingsection.
4.2 Proposed Framework Architecture
Figure 4.1: Proposed Framework Architecture (S1, S2...Sn are information sources).
Before describing the framework, it is necessary to study what featuresdoes the framework should have. The main objective in developing thisframework is to study the dynamic behaviour of information elements by wayof managing the information sources and monitoring the network conditions.Based on this objective, the framework need to support the following features:

50 Chapter 4
• Modularity : In general, modularity is a desirable system property. Anindividual component of the framework should be examined, modifiedand maintained independently. The framework should able to controland monitor information source individually.
• Dynamic Updates : As the framework is aim to study the dynamic be-haviour of information elements, the framework should able to manageinformation sources dynamically at run time. It should able to remotelystart, stop or install any updates dynamically at run time.
• Generic: As the proposed framework is aim to develop on top of anarbitrary communication protocol as shown in Figure 4.1, it should begeneric; meaning that it should support any application irrespective ofwhat communication protocol it uses.
• Facilitate Interactions : The framework should be able to support inter-actions between information sources and information user. This is animportant requirement of the proposed framework. Multiple informa-tion sources providing same information are possible. In such situation,interactions between information sources and information user. Thisproperty of the proposed framework is used for selecting the best frommultiple information sources in Chapter 7.
Figure 4.1 illustrates the proposed conceptual framework architecture for in-formation accessing and management framework. However, it is to be notedthat it is a proof-of-concept and emulation tool for algorithm later proposedis in its place. Closely observing the features that the proposed frameworkshould support, a Java based framework called Open Services Gateway initia-tives (OSGi) [7]. OSGi works on the concept of bundles, meaning that eachand every software module describing different components in the frameworkis developed as OSGi bundle. Each bundle in OSGi can be controlled indi-vidually without affecting the rest of the system, thereby supporting modularapplication development. These bundles communicate through the servicesprovided by the OSGi framework at run time. The installation, starting,stooping, updating and reinstalling of OSGi bundles can be done dynamicallyat run time. OSGi is an open service platform for the management of multi-ple applications and services of all types like networked devices in buildings,at home, in vehicles, in industry, mobile telephony and other environments.However, the standard OSGi framework does not support communicationamong distributed bundles if the bundles are located in different machines[54]. R-OSGi (Remote-OSGi) is a middleware platform which implementsthe OSGi standard in distributed environment. Therefore, the R-OSGi is

4.2 Proposed Framework Architecture 51
used facilitate the communication among OSGi bundles and services whichare located in different remote locations. Each of the component shown in theframework architecture like information sources, or the components shown innetwork environment in Figure 4.1 is developed as an OSGi service bundle.The proposed framework takes advantage of the ServiceListener method ofOSGi in order to dynamically react to the change in state of services. For,example, if a service becomes unavailable; the system dynamically finds otherservice provider bundles and fetches the information without the knowledgeof the service consumer. This method facilitates in listening to the eventswhich are published by the service registry. Whenever, a service is registeredor unregistered, the OSGi framework publishes a ServiceEvent to all regis-tered ServiceListener. So, the OSGI framework facilitates in monitoring theservices dynamically. Each component does a specific function and is brieflydescribed below:
4.2.1 Event Monitoring Unit (EMU)
EMU is responsible for monitoring information dynamics and is themain block of the proposed framework. It consists of three different subunits;Registration Unit (R-Unit). Source Selection Unit (SS-Unit) and NetworkMonitoring Unit (NM-Unit).
Registration Unit(R-Unit)To be able to access information by the users, all the information
sources must be registered with the OSGi service registry. So, when theinformation sources are created, the information sources are made to registerwith the OSGi registry system. This unit keeps record of every registered in-formation source that can be consumed by the information user. The R-Unitlooks for published services (information sources) continuously and registerswith the service registry whenever it finds one. It is also responsible forremoving the service references from the service registry whenever they be-come unavailable due to various reasons like, network unreachable, or nodeis switched-off.
Source Selection Unit (SS-Unit)The framework monitors the registered information sources by mon-
itoring the status of the event called ServiceEvent. There are three typesof ServiceEvent: registered, unregistered and modified. This unit invokessource selection algorithms in two cases: 1) when more than one informa-tion sources are registered, 2) when the current information source beingused is unregistered and there are more than one information sources avail-

52 Chapter 4
able. The un-registration happens when the particular information sourcebecomes unavailable due to several reasons. The selection and switching ofinformation source takes place based on requirement parameter. One suchrequirement parameter is information mismatch probability. Further detailson this selection algorithm are provided in Chapter 7. The framework isalso does dynamic re-registration and un-registration of information sourceas and when the information sources reappear and disappear.
Network Monitoring Unit (NM-Unit)
NM-Unit is responsible for monitoring the network parameters likeevent rate, rate of change of network delay and information sampling rate.Based on the network parameters collected by this unit, the computation isdone as per the requirement criteria for specific purposes like informationsource selection, estimating mismatch probability or access strategy selec-tion. Besides the dynamic network parameters, this unit also makes use ofsome static parameters like maximum power consumption limit in order tomake selection decision.
4.2.2 Access Management Unit (AMU)
The function of AMU is to select a suitable information access strategybased on applications requirement. As per the applications requirement, oneof the access strategy is selected among the three access strategies namely;reactive, periodic and hybrid access strategies. It is assumed that the infor-mation are sampled and stored in the cache memory from where the infor-mation user gets access as per the selected access strategy. In later chapters,these three access strategies are explored in relation to information mismatchprobability and power consumption. In particular, an analytical model forinformation mismatch probability and power consumption under each accessstrategy is developed in Chapter 5. The analysis of how different accessstrategy do affect information mismatch probability and power consumptionis carried out both analytically (using models developed) and simulation (us-ing proposed framework).
4.2.3 Information Source Unit
The information sources which are supposed to be sensor nodes aredepicted as S1, S2 and so on. The function of this source is to generate infor-mation in response to the sensed data from environment. Each informationsource is modeled as an OSGi service bundle and made to register with the

4.3 Framework Implementation 53
EMU with the help of RR-Unit. In particular, both the information inter-arrival rate and the service delay rates are pick up from random numbers.This can be modeled as any distribution depending on the application. Eachinformation source model has four sub modules which are used to accomplishspecific task to mimic dynamic behaviour of the source.
Inter-arrival TimeAs mentioned in Chapter 3 in Section 3.1, a node in a typical wireless
sensor network generates two types of traffic; locally generated and relaytraffic. The inter-arrival time of locally generated traffic depends on applica-tions. In [55], it is mentioned that the WSN applications can be categorizedas event-driven and periodic data generation. For applications like environ-mental data collection, where sensors nodes repeatedly poll their sensed data,the data generation is periodic while for applications like safety monitoring,the data generation is not periodic, but rather sporadic. For such applicationsthe sensor nodes send data whenever certain things occur only. So model-ing information source depends on what type of applications one is interested.
End-to-End DelayAs mentioned in Section 3.1, this study focuses on locally generated
atomic information. Although, the study considers a single delay distribu-tion from source to destination and the intermediate nodes relay withoutaltering information value, the resulting delay due to relaying, routing andretransmissions are assumed to be the part of end-to-end delay distributionthat the study focuses on.
Sampling time intervalThe sampling time interval is one of the main parameter that is focused
on this study. This is because, how fast or how slow the information is beingsampled from the information source has greater impact on the informationreliability and power consumption.
4.3 Framework Implementation
Figure 4.2 shows the building blocks of the framework. For simplic-ity, a detailed composition of an information source is shown only with asingle information source labelled as Information Source 2. However, all in-formation sources are composed of all the components shown in the samplemodule. This section provides the implementation details regarding how eachcomponent is modeled to facilitate in investigating the information dynamics

54 Chapter 4
Figure 4.2: Building blocks of the proposed framework.
affecting information reliability and power consumption.
4.3.1 Information Source
Each information source model is composed of five modules which doesspecific task towards emulation of dynamic information source. Each moduledescription is given below:
EventEmulator
As mentioned in Section 4.2, the proposed framework is developed us-ing Java based OSGi framework. The EventEmulator is a method that actsas a physical environment where events are occurring, such as temperaturemonitoring in a region. Let us say that an event is generated whenever tem-perature value exceeds certain threshold. Considering such an event does notoccur frequently, the probability that the event occurs at any time is assumedto be governed by Poison process. However, to make event process generic,the method here picks up any random value from a probability distributionfunction (PDF) whenever the method is invoked. This method is invokedaccording to the event inter-arrival time generated by the EventTimeEmu-lator method. In particular, it has a timer function that triggers as per theinter-arrival time generated by the EventTimeEmulator.
EventTimeEmulator
This method is responsible for generating inter-arrival time of an event.It continuously generates an independent identical exponentially distributed

4.3 Framework Implementation 55
random numbers with parameter λ. These exponentially distributed randomvalues are fed as an input to the timer function within the EventEmulatormethod, which then picks up a value from a PDF. Both the information valueand the time at which the information is generated are stored in a separatelinked list, called sourceeventlist and¡emphsourcetimelist respectively. Thesampling of information is done from this linked list. In order to sample withfresh and up-to-date information, the last item in the list is extracted everytime the information is sampled. The information extraction is accomplishedwith the help of a timer function which accepts the sampling time intervalas an input.
Sampling Time EmulatorThe sampling of information is done with the help of this method. The
method generates random numbers which are independent identical expo-nentially distributed with parameter τ . These random numbers are fed asinput to the timer function within an EventTimeEmulator which when thetimer expires, picks up an information value (the last item) from the linkedlist of information (sourceeventlist). The sampled information is assumed tobe stored in a cache memory also in a form of linked list as eventatcache,from where the user can access depending on the access strategy selected.Corresponding to the sampled information from sourceeventlist, time valueis also extracted from sourcetimelist and stored in a timeatcache linked list.
A block diagram representation of interaction among above three mod-ules is depicted in Figure 4.3.
SourceActivatorEach and every information source has to be published in order to get
access by the information user. SourceActivator is a Java class which regis-ters the particular information source with the OSGi service registry system.It is accomplished with the help of registerService method by providing itsproperties. An interface block shown in Figure 4.3 is used to specify the chan-nel to the monitoring system where EMU is hosted. If the sources (emulatedone) have to be replaced with real sensors, then it is possible by changingthis interface.
TimeDelayEmulatorThis is a method whose task is to generate a random numbers which
is also assumed to be independent identical exponential distributed with pa-rameter . Every time the information is accessed, the method picks up avalue from this exponential distribution and supply to the network monitor-ing unit (NM-Unit). This value is used as an end-to-end network delay for

56 Chapter 4
computation of information mismatch probability.
Figure 4.3: Interaction block diagram of information generation and sampling.
4.3.2 Information Manager
Information manager mainly consists of two major units; EMU andAMU. The function of EMU is to monitor the events and manage informationsources depending up on the information dynamics while AMU is responsiblefor managing access strategy as per the user preference.
EMU is modeled with three subunits and how they are modeled ispresented here:
R-Unit listens for registered information sources with the help of addSer-viceListener method. When information sources are found, this unit gets thereferences to all the information sources by using the interfaces though whichthey are published and constructs a list of sources identified by their prop-erties. This is accomplished by using the getRemoteServiceReferences andgetRemoteService methods.
SS-Unit monitors the status of registered information sources by us-ing serviceChanged method. This method takes three types of arguments;registered, unregistered and modified. Whenever the information source isregistered or unregistered the list in the R-Unit is updated. However, themodified status is not utilized in this framework. SS-Unit has an algorithmwhich selects the best available information source based on the set criteria.One such criterion is information mismatch probability, based on which thisalgorithm is implemented in Chapter 1.
NM-Unit uses the list of information sources constructed in the R-Unitto get access to each and every information sources available. It extracts theparameters like inter-arrival time, sampling rate, the delay in accessing infor-mation from each source. Basically, this unit gathers the required parametersand compute information mismatch probability in accessing each informationsource based on which the SS-Unit can choose the information source. A

4.4 Performance Evaluation 57
block diagram showing the interactions among these units is shown in Fig-ure 4.4 and the steps of how interactions are accomplished are summarizedbelow:
Figure 4.4: Interaction among the unit within information manager.
1. R-Unit prepares a list of information sources, identified by their prop-erties.
2. NM-Unit gets the references for all the information sources in the listprepared by R-Unit.
3. NM-Unit accesses network parameters and compute required metric,e.g. information mismatch probability
4. SS-Unit uses the above computed metric, based on which an informa-tion source is selected in step 5.
Similarly, AMU has also three thread of control, which is responsible for im-plementing the particular access strategy. As per the access strategy selectedby the application user, corresponding thread of control is triggered.
4.4 Performance Evaluation
The information manager unit within EMU needs to execute lines ofcode to accomplish the task event monitoring like registration of informationsource, monitoring the network conditions, switching the information sources,etc. In doing this it takes some time (computation delay) which is assumedto be negligible when the estimation of mismatch probability was carried out.This computation delay will increase when the number of information sourcesincreases. In this study, the number of information sources is equivalent tothe number of OSGi components included in the framework. In Figure 4.5,

58 Chapter 4
Figure 4.5: Shows computation delay with network delay.
the computation delay (δ)= (t2-t1)+ (t4-t3) and the network delay (Dν) isshown as t3-t2. So total delay is given by
DTotal = δ +Dν
Assuming Dν >> δ, but δ depends on number of nodes (OSGi components)added to the framework.
Figure 4.6: Computation delay verses number of nodes.
Figure 4.6 shows how this computation delay (δ) increases with in-crease in number of nodes. This is to investigate what is the best number ofnodes the framework can support without affecting the performance of thesystem. Otherwise, if the number of nodes is such that it results a significantcomputation delay, then it should be added to the network delay to get thecorrect total delay.
As an example, if the system has to support 800 number of nodes, ittakes a computation delay of 0.6 sec (refer Figure 4.6). In case if the networkdelay is also about 0.6 sec, then the computation delay has equal significant tomismatch probability. Therefore, in order to estimate information mismatchprobability correctly, it is necessary to consider this computation delay.

4.5 Limitations of the Framework 59
4.5 Limitations of the Framework
In this section, some limitations of the proposed framework are high-lighted. The main limitation of this framework is that the real deployment ofphysical sensors is implemented. But using OSGi, which provides modular-ity and catches the dynamic updates in different modules, the study showedthe concept of dynamic information source in order to study the behaviourof dynamic information elements. Although, the performance evaluation oncomputation time is tested but there is also requirement to see how muchmemory is being used, CPU time in running the framework. Therefore, it de-serves further study on these issues, which will be explored as a future work.Although, making interactive, a graphical user interface (GUI) is desirable,however, at present stage the proposed framework does not have GUI.
4.6 Conclusions
To conclude, the main points are summarized below:
• The system architecture of the proposed framework and its implemen-tation details were presented.
• The information source modeling details were also presented, which isnot a trivial to emulate as to show the dynamic behaviour of informa-tion.
• As computation delay was assumed to be negligible compared to net-work delay, computation delay was estimated to show how many num-ber of nodes can be supported before the computation delay reaches apoint where it cannot be neglected.
This chapter showed the concept of dynamic information sources withthe help of dynamic information accessing and management framework. Thedeveloped framework is further used for studying the behaviour of dynamicinformation elements throughout the later chapters.

60 Chapter 4

Chapter 5
Power Consumption andMismatch Probability inRelation to Information AccessStrategy
The framework for dynamic information accessing and manage-ment was proposed in Chapter 4. In order to back up the pro-posed framework and to further analyze how information accessstrategy do impact information reliability and power consumption,this chapter presents an extended analytical model for mismatchprobability and power consumption under three information ac-cess strategies; reactive, periodic and hybrid from the one definedin [6]. In particular, an extended model presented here capturesa combined probability of information mismatching that will oc-cur during sampling of information and information accessing, incontrary to the one defined in [6], where it was considered sepa-rately. Furthermore, this chapter also introduces power consump-tion models for each access strategies. A comparison between themismatch probability values estimated with the help of the pro-posed framework in Chapter 4 and the values obtained using an-alytical models are made in order to validate the results. Lastly,this chapter also investigates the impact of shifted delay on infor-mation reliability. In particular, a trade-off between deterministicpreprocessing delay and stochastic network delay is investigated.
61

62 Chapter 5
5.1 Motivation
Accessing information from a remote dynamic information source isalways a challenge as mention in Section 2.6. There are several reasons whyit is always a challenge starting from design issues to the routing techniquesused to gather information as described in Chapter 2. Although, there areseveral issues that are of important with respect to accessing remote dynamicinformation elements, this chapter focuses on three requirement parametersin relation to information access strategy. These three requirement parame-ters are briefly revisited here, but more description can be found in Section2.6.Information Reliability : As most of the wireless sensor networks aremade to collect the information, which is dynamic in nature, it is importantthat the information being received and used by the application user is freshenough so that the decision made based on the information received is reli-able.Timeliness : Receiving information on time is the desire of all the applica-tions irrespective of types of network. But the severity and impact of usingoutdated information varies depending on the types of application. There-fore, it is important to investigate how different applications requirement canbe fulfilled by using different types of information access strategy.Power Consumption : Generally, wireless sensor nodes are powered bybattery. When such nodes are deployed without any energy recovery mecha-nism, the lifetime of the node is determined by how many hours the batterycan last before it becomes dead. Therefore, efficient management of powerusage while accessing information from the sensor node will help to extendthe lifetime of the node.
In Chapter4, the information reliability in terms of mismatch probabil-ity is found to be affected by the way how information is being sampled andremotely accessed. Inspired by this observation, in this chapter, a compre-hensive study on power consumption and information reliability in relationto information access strategy is provided. In summary, this chapter aimsat providing the following in relation to power consumption and informationmismatch probability:
• To develop an analytical models for mismatch probability and powerconsumption under each information access strategy.
• To investigate the impact of information access strategy on power con-sumption and mismatch probability under varying network conditionsand dynamic information elements.

5.2 Related Works: Power Consumption and Reliability 63
• Lastly, to investigate the impact of time shifted delay distribution oninformation mismatch probability to find a trade-off between determin-istic preprocessing delay and stochastic network delay.
Based on the above studies, the chapter makes some recommendations whenand where, which access strategy is suitable depending up on the types ofapplication.
5.2 Related Works: Power Consumption
and Reliability
Much of the works in the literature is either concentrated on energyconsumption or on reliability and not much work on how information ac-cess strategies have an impact on these two parameters are found. However,both these parameters are somehow influenced by how information is be-ing accessed [53]. A theoretical and simulation based power consumptionon WSN has been explored in [56]. They have mainly focused on how dataaggregation can reduce the energy consumption. However, it is mainly con-centrated on the computation of power consumption and the reliability issuesof information are neglected. Similar work is done in [53], where they alsouse the same approach as in [56] in calculating the energy consumption inWSN. In both the works, no study is carried out on how the way one accessthe information does impact the reliability and power consumption. In [23],attempt is made on analysis of lifetime and energy consumption based onaccess strategies but it failed to discuss about all the three access strategiesand concentrated only on periodic access strategy. Data collection in wirelesssensor network with mobile sink with respect to energy consumption is stud-ied in [57] and [58]. In [57], a two tier distributed hash table-based schemedata collection for event-driven wireless network is proposed. The data iscollected via a single hop routing between a node and the mobile sink. Itis said that when an event is occurred in the region, the nodes which arein the region will announce the event which will trigger the mobile sink tomove towards the region where event has occurred. In [58], the movement ofthe mobile sink is made arbitrary with assumption that sink has no resourcelimitation. This assumption is not really practical when wireless sensor net-works are deployed in harsh terrain and hostile environment conditions. Thestudy have not considered any particular access strategy and investigatedonly energy consumption during transmission. An event-driven wireless sen-sor networks using energy-saving data collection is proposed in [59]. Theyhave considered wireless sensor networks with high density of nodes. They

64 Chapter 5
divide data collection method into four phases: extracting edge-nodes, set-ting freeze nodes, collecting data and making branch tables. The data iscollected to the stationary sink from the edges nodes via the relays nodes.
The concept of mismatch probability and access strategies is exten-sively explored in [6, 45, 46, 47]. However, none of the works considered theeffect of access strategies on power consumption. Therefore, this chapter in-vestigates more on mismatch probability considering both sampling of eventpart and the information transmission coupled with power consumption foreach access strategy.
5.3 System Model Description
5.3.1 Abstract Scenario
Figure 5.1: An abstract view of remote dynamic information access with different accessstrategies.
Figure 5.1 shows an abstract view of remote dynamic information ac-cess model considered in this study. This model is based on the basic in-formation access model described by Figure 3.1, but with incorporation ofdifferent access strategies. Further, all assumptions regarding the modeling ofinformation source in Chapter 4 are valid and will be applying for developinganalytical models in this chapter.
Consider some dynamic events occur within an information area whichis within the sensing range of sensor nodes (information source). These sensornodes generate information in response to the sensed events from the infor-mation area, which act as information sources for the information user. In allthe access strategies, we model information access as a two-step process: 1)information sampling step, where the information is collected by the sensor

5.4 Analytical Model 65
nodes from the information area and transferred to a cache at every samplingperiod, and 2) information access step, where the information collected bythe nodes is accessed by the remote information user using different accessstrategies over a network environment. The model is based on the locallygenerated information packet as mentioned in Section 3.1. Therefore, modeldoes not take into account the packets which generated within intermediatenodes between information source and the information user. However, thedelay due to relaying packets within intermediate nodes and retransmissionare assumed to be a part of resulted end-to-end delay.
As described in Chapter 4, the model assumes a sampling process ofsome dynamic information which changes only at discrete points in time,considered as a Poison process for simplicity. The inter-arrival time of infor-mation and the end-end delay are assumed to be exponentially distributed
5.4 Analytical Model
Out of various factors which impact the performance and life time ofwireless sensor node, the model focuses on information reliability and powerconsumption. In this section, analytical models for mismatch probability andpower consumption for the two steps; information sampling and access stepare presented.
5.4.1 Information Sampling Step
Since the sampling of information is done periodically and is commonfor all the access strategies, the mismatch probability and power consumptionmodel would be same for all the three access strategies during informationsampling step.
Figure 5.2: Sampling process model; Sampling time intervals (ts = t1 − t0) are exponen-tially distributed with rate τ
Mismatch Probability

66 Chapter 5
The information source samples information with exponential distributedtime intervals, but periodically and assumed to be stored in its cache to beaccessed and used by information user locally and later it is from this cache,remote access fetches data. But it can be argued that due to clock drift,scheduling effects etc., the sampling process is not perfect, but shows somestochastic behaviour. Simulation studies in [45] show that if the period isdeterministic, then the mismatch probability will be lower but follow samebehaviour as the exponentially distributed interval. Thus, the stochasticsampling assumption can be seen as a worst case scenario. The remote in-formation user accesses the information as per access strategy being used.This assumption allows the mismatch probability to expressed as given bymismatch probability of periodic access derived in [6] as
mmPrPer =
∫ ∞0
exp
(−∫ t
0
τFD(s)ds
)AE(dt) (5.1a)
with AE as the distribution of backward recurrence times of the eventprocess [6, sec.2, p.45]. For deterministic delays, and in particular delays oft = 0, and exponentially distributed event time process, (5.1a) simplifies to
mmPrSamp =λ
λ+ τ(5.1b)
where λ is the rate of information update and τ is the sampling rate.
Power ConsumptionAs described in Chapter 3 in Section 3.6, the power consumption model
for an information source can be expressed as
Pt = Psamp + Ptx + C (5.2a)
where, Psamp, Ptx are the amount of power dissipated for sampling and trans-mitting respectively. The term C (constant) is introduced for other powerterms like receiving power, idle power, etc. Since, we are interested in com-paring power consumption with different access strategies, we only considerPsamp and Ptx since the rest of the components remain same for all of our in-formation access strategies. The term C is neglected and is never used in ourfollowing analysis. The power consumption for the sampling process will besame for all the three access strategies but the power consumption in trans-mission would depend on how information is being accessed. If tsamp is thetime required for each sampling with rate τ , the average power consumptionfor sampling over time, T can be expressed as
Psamp =1
T
∫ T
0
τPsamp(t)dt (5.2b)

5.4 Analytical Model 67
With an assumption of sampling time interval as exponentially distributed,then (5.2b) simplifies to
Psamp = Psamptsampτ (5.2c)
To summarize, information mismatch probability during informationsampling step is decided by at what rate the information is changing atthe source and the how fast the information is being sampled, here withassumption that the event rate follows exponential distribution. The averagepower consumption during the sampling step is governed by sampling ratealone and not by the rate at which the information changes. The key pointhere is therefore, both the power consumption and information mismatchprobability can be controlled by varying sampling rate as per the requirement,i.e. how much information reliability an application needs to maintain orwhat amount of power an information source can manage to spend.
5.4.2 Information Access Step
As mentioned in Section 5.3.1, although, the models described in thischapter are applicable to both types of packets; our analysis generally as-sumes locally generated packets. Access to information that requires multihop or cases where data needs to be retransmitted due to e.g. bad link con-ditions can be modeled via the statistical description (cumulative densityfunctions) of the access delays. Once the sensor node gets the information, iteither waits for the remote information user to request for information (reac-tive access) or it proactively distributes the sampled information to its sub-scribers (proactive access). The following sections analyze how these differentaccess strategies do affect the mismatch probability and power consumption.
Reactive Access Strategy
Reactive access strategy is one, where the information is accessed on-demand. This access strategy is depicted in Figure 5.3
Mismatch ProbabilityThe mismatch probability for reactive access assumes that information
in the cache is correct at time t2 and measures the probability that theinformation changes in the time interval t2 to t0 (see also Figure 5.3). In [6],this definition of mismatch probability for reactive access strategy is derivedas given below.
mmPrRea =1
E(E)
∫ ∞0
FD(t)FE(t)dt (5.3a)

68 Chapter 5
Figure 5.3: Reactive Access Model with Periodic Sampling
With FD as the distribution of the time intervals (delays i.e. t3 − t2)and FE the event time interval distribution, and the over line indicating thereliability function, 1 − Fx, assuming request arrives equally likely in timeintervals.With an assumption of delay and event time interval are all independent andidentical exponentially distributed (with rates λ for event and ν for delay),then (5.3a) can be simplified as
mmPrRea =λ
λ+ ν(5.3b)
The combined mismatch probability with the sampling, cannot assumecorrect value at time t2 due to the sampling scheme. It can be calculated asa weighted average of two scenarios; 1) the information is already mismatch-ing when being accessed at time t2 (see Figure 5.3), which happens withprobability mmPrSamp. 2) information was correct at time t2 but informa-tion at source changed during time t2 to t3 , which happens with probabilitymmPrRea. By reshaping the existing mismatch probability model of [6] to asampling process by reducing otherwise included network delay into a deter-ministic zero delay, the overall mismatch probability for reactive access canbe expressed as
mmPrComRea = mmPrRea +mmPrSamp(1−mmPrRea) (5.4a)
Substituting (5.1b) and (5.3b) in (5.4a), we get the expression for combinedmismatch probability, under the given exponential assumption as
mmPrComRea =λ(λ+ τ + ν)
(λ+ τ)(λ+ ν)(5.4b)
When the delay rate approaches to infinity (meaning that the mean net-work delay (D) goes to zero) the overall mismatch probability mmPrComReaapproaches to the mismatch probability of the periodic access. This shows

5.4 Analytical Model 69
that the lower bound of mismatch probability is, as expected, given by thesampling process as shown in below equation:
mmPrSamp,D=0 = limν→∞
λ(λ+ τ + ν)
(λ+ τ)(λ+ ν)=
λ
λ+ τ(5.4c)
Similarly, it can be shown that as sampling rate (τ) approaches infinity(meaning that information is sampled at faster rate, or in other words sam-pling time approaches zero), the combined mismatch probability approachesto mismatch probability given by pure reactive (where information is correctat time t2 access.
mmPrRea,T=0 = limτ→∞
λ(λ+ τ + ν)
(λ+ τ)(λ+ ν)=
λ
λ+ ν(5.4d)
It is natural from (5.4b), when λ→∞, mmPrComRea = 1.
Power ConsumptionSince the transmission of information takes place only when user makes
a request, the reactive transmission power consumption depends on the infor-mation access rate and the transmission delay. If µ is the average informationaccess rate, and Ptx is the power consumption for each transmission, thenthe average power consumption over time, T can be expressed as
Ptx =1
T
∫ T
0
µPtx(t)dt (5.5a)
With same concept and exponential assumption as in (5.2c), (5.5a) reducesto
Ptx = Ptxttxµ (5.5b)
Using (5.2c) and (5.5a) in (5.2a), the total average power consumptionfor both information sampling and access steps can be written as
PRea = Psamptsampτ + Ptxttxµ (5.5c)
To summarize on reactive access strategy, the main points are listed here:
• The mismatch probability under pure reactive i.e. mmPrRea is in-fluenced by the rate at which information is changed and the rate ofdelay between information source and the information user. So, it isnot affected by the rate at which the information is sampled.

70 Chapter 5
• The combined information mismatch probability i.e. mmPrComRea isinfluenced by all the three parameters, event rate, rate of delay andsampling rate.
• The combined mismatch probability, mmPrComRea approaches mis-match probability at the information sampling step as the delay rategoes to infinity, i.e. when delay (D) goes to zero.
• The combined mismatch probability, mmPrComRea approaches mis-match probability given by pure reactive as the sampling rate goesto infinity, i.e. when sampling time (T) goes to zero.
• The average power consumption under reactive access strategy dependsboth on sampling rate and the information access rate.
• Therefore, the main take away point from this section is how to varysampling rate in order to keep mismatch probability same, given eventrate (λ) or delay rate (ν) changes.
Periodic Access Strategy
In this access strategy, instead of information user initiating with a re-quest message, the information source proactively distributes any updates tothe potential information users in periodic time interval. Under this proactiveperiodic access, the time interval at which the information source periodicallydistributes information to the potential information users is assumed to beequal to the sampling rate. This means that every time the information issampled, the information user gets updated information. In other words, theinformation sampling rate is equal to the information access rate as shownin Figure 5.4. So, the alternative access rates do not make sense as the in-formation is updated and stored in a cache at a rate given by sampling rate.
Figure 5.4: Periodic Access with Periodic Sampling

5.4 Analytical Model 71
Mismatch ProbabilityThe mismatch probability for proactive periodic access is derived in [6]
and given by (5.1a). With assumption of event being Poison process withintensity λ and downstream delays are i.i.d exponentially distributed withmean 1/ν , (5.1a) can be re-written as [6]
mmPrPer = λ
∫ ∞0
exp(τν
(1− e−νt))exp(−(τ + λ)t)dt (5.6)
The above expression (5.6) is alternatively expressed in [6] as (bychange of variable t and e−νt, and using notation φ = λ
ν;ψ = τ
ν).
mmPrComPer = φeψΓ(ψ + φ)
ψψ+φFΓ(ψ+φ,ψ)(1)
where FΓ(a,b) is the cdf of a gamma distribution with parameters a and b.
Power ConsumptionIn this access strategy, the power consumption for information access
step will not depend on information access rate; instead it will depend onsampling rate,τ . This is because the average information access rate is equalto the sampling rate. Using same concept as in reactive access strategy, theaverage power consumption for both the sampling and information accesssteps can be can be expressed as
PPer = (Psamptsamp + Ptxttx)τ
To summarize on periodic access strategy,
• The combined information mismatch probability under periodic accessstrategy is influenced by all three parameters, event rate, sampling rateand the delay rate.
• In contrary to reactive access strategy, the power consumption underperiodic access only depends on the sampling rate. This is due to thefact that, every time the information is sampled, the information sourcedistributes it to the information user.
Hybrid Access Strategy
As described briefly in Section 3.4, proactive access can be catego-rized into two sub access strategies; 1) proactive periodic and 2) proactiveevent-driven in general. In proactive periodic access (see Figure 5.4), the

72 Chapter 5
information is sent or accessed at each time the information is sampled irre-spective of whether there is any update or change of information value fromprevious access. Usually, in proactive event-driven the information is sentonly when some event has taken place (e.g. like temperature exceeds theset threshold value). But in this model, a slight modified form of proactiveevent-driven access is being considered, where the information is sent to theclient only when the information value to be sent is not the same as theprevious value which is already sent (see Figure 5.5). This access methodis called as proactive hybrid access. Therefore, this access will avoid theredundant information being sent consecutively, thereby reducing the powerconsumption of the information source.
Mismatch ProbabilityThe expression for mismatch probability for information sampling part
would be given by the same expression as in (5.1a) with mean sampling rateτ , as information is sampled at every τ time interval. The reason for this isthat the model that is being used here is from [6], which considers only usefulupdates (updates which have new information) through a thinned Poisonupdate process. Since this model sends updates only when they containuseful updates, the mismatch probability is exactly the same, however, trafficload is different. But, the delay distribution for the information access stepwill be affected by a small additional delay introduced for checking whetherthere is any update for every sampling period (in turn affecting the mismatchprobability). If d0, which is equal to t′ − t1 (see Figure 5.5) is an average
Figure 5.5: Periodic Access with Periodic Sampling
additional delay introduced by checking whether there is any update afterevery sampling period plus additional delay for preprocessing and D is thedownstream network delay, then the total delay introduced is
D = d0 +Dν
With FD(s− d0) as the distribution of the shifted delay, the mismatch prob-

5.4 Analytical Model 73
ability of hybrid access strategy will be given by (5.1a). Since it does noteasily simplify, numerical integration of (5.1a) with a time shifted delay dis-tribution is performed in order to compare mismatch probability with otheraccess strategies (see Figure 5.17).
Power ConsumptionThe power consumption for proactive hybrid access would be affected
by the rate at which events that exceed a threshold occurs. It is also impor-tant to consider the power required to check for an update and processing orfiltering as described in event process and detection in Section 3.2. If Ppro isthe power consumed for each checking, then average power consumption inchecking an update over a time, T can be expressed as
Ppro =1
T
∫ T
0
τPpro(t)dt
The total average power consumption in hybrid access strategy can be ex-pressed as
PHybrid = (Psamptsamp + Pprod0)τ + Ptxttxτ′ (5.7a)
The update rate (τ ′) can be computed as
τ ′ = 1− P (no−update)τ
The probability that no any update has occurred within a samplingperiod can be derived if the process is stationary and memory less. Considerfe the event arrival distribution and fs the sampling time interval distribu-tion (which previously assumed exponentially distributed), then under theseconditions, this probability can be expressed as
P (no−update) =
∫ ∞0
(1−
∫ t
0
fe(s)ds
)fs(t)dt (5.7b)
With assumption of all processes being exponentially distributed (with ratesτ for sampling and τ ′ for update) are all independent and identical exponen-tially distributed, then (5.7b) simplifies to
τ ′ =λτ
λ+ τ(5.7c)
When λ approaches to infinity (meaning that information arrival rateincreases), τ ′ approaches to τ . This means that the upper bound of updaterate is given by the sampling process as it is expected.
τ ′ = limλ→∞
λτ
λ+ τ= τ

74 Chapter 5
Using (5.7c) in (5.7a), the final expression for average power consumptionfor hybrid access can be written as
PHybrid = (Psamptsamp + Pprod0)τ + Ptxttx
(λτ
λ+ τ
)(5.7d)
To summarize, the main points are listed here:
• The combined mismatch probability under hybrid access is impactedby event rate, sampling rate, and delay rate.
• In addition, it is also impacted by the time spent for checking for anupdate (d0). Due to this additional delay, the information mismatchprobability under hybrid access strategy will be always greater than themismatch probability that would result under periodic access strategy.
• But, there is a positive impact on power consumption. Since, informa-tion is retrieved only when there is change in value, this update rate(τ ′) is always less than or equal to the sampling rate (τ).
• When update rate becomes equal to the sampling rate, the power con-sumption under hybrid access strategy would be same as under periodicaccess strategy. However, the information mismatch probability willstill be affected by the constant delay (d0) even under this condition(τ = τ ′).
5.5 Validation of the Models
In order to validate the working of the proposed framework described inChapter 4, an algorithm is designed to estimate information mismatch prob-ability for which the steps are provided in 5.1. A comparison between themismatch probability values estimated with the help of the proposed frame-work (implementation) and the one which is obtained using the analyticalmodels is provided here. The same parameters are used for both analyticaland implementation for comparison purposes. For testing purpose, the eventprocess is modeled as Poison process; however, it can be modeled with anydistribution depending on the application type.
The steps for estimating information mismatch probability is providedhere in Algorithm 5.1.
In all the three access strategies under study, the two values of mis-match probability are found to be more or less same, thereby validating the

5.5 Validation of the Models 75
Algorithm 5.1 Steps for estimating information mismatch probability
1: The information value and time at which the information is generatedare continuously recoded as a two separate linked lists, sourceeventlistand sourcetimelist
2: At every sampling time interval, the last item in the sourceeventlistis extracted and put into another linked list, called eventatcache andcorresponding time value is copied to another linked list, timeatcache
3: At every access (as per the selected access strategy), the last item fromthe eventatcache linked list is extracted and put into another linked listcalled receivereventlist. The receivertimelist is formed by adding delay(with specified distribution) with the last item in the timeatcache.
4: For every receivereventlist item (with the corresponding item in the re-ceivertimelist), we track back to the sourceeventlist. If receivereventlistitem equals the sourceeventlist item, then it is a match, otherwise it is amismatch.
5: Steps 3 and 4 are repeated for 1000 times and average value of numberof mismatch is computed to get the mismatch probability.
working of the proposed framework as well as showing that the analyticalmodels are also valid. These comparisons are shown in Figure 5.6(a) toFigure 5.6(c).
Figure 5.7 is provided to show comparison among all the three accessstrategies. In hybrid access strategy, a constant value of d0 = 0.1sec is addedto the end-to-end delay as mentioned in our hybrid access strategy definitionin Section 3.4. It is observed that the mismatch probability for hybrid ismore than the other two access strategies. This is because of the extra delayincurred in checking for an update.
The result which is shown in Figure 5.7, the mismatch probability val-ues were computed based on assumption that the information sampling rateis exponentially distributed. However, the sampling rate can also be keptconstant instead of assuming exponentially distributed. Therefore, in orderto see how mismatch probability behaves with constant sampling rate, Fig-ure 5.8(a) and Figure 5.8(b) show comparative results between exponentialsampling rate and constant sampling rate for reactive and periodic accessrespectively. The figures also show the difference between them. Looking atthe plot (Exp.− Const.), it is observed that the difference in mismatch prob-ability increases upto certain values and then starts decreasing. This showsthat when sampling rate decreases the mismatch probability approaches 1whereas when sampling rate increases the mismatch probability values ap-proaches 0 for both the rates (exponential and constant).

76 Chapter 5
(a)
(b)
(c)
Figure 5.6: Comparisons of mismatch probability values obtained by analytical modelsand using framework at λ = 2.0 and ν = 10 (a) Reactive, (b) Periodic and (c) HybridAccess.

5.5 Validation of the Models 77
Figure 5.7: Information mismatch probability for different access strategies at λ = 2.0 andν = 10.
(a)
(b)
Figure 5.8: Information mismatch probability comparison between exponential samplingrate and constant sampling rate at λ = 2.0 and ν = 10. a) Reactive Access b) PeriodicAccess

78 Chapter 5
The result in Figure 5.7 is under assumption that the delay from thesource to destination is exponentially distributed, irrespective of number ofintermediate nodes en route to destination. To be more realistic, a furtheranalysis with Erlang delay distribution is carried out, which was introduced inSection 3.5 in Chapter 3. Considering two intermediate nodes between source
Figure 5.9: Markov Model, Transition diagram.
and destination node, with transmission delay rate of ν and retransmissiondelay rate of ν ′ as shown in Figure 5.9. Inspired from [5], the delay can bemodeled by discrete time Markov chain as shown in Figure 5.9. Assuming,the delay rate from each node is exponentially distributed [51, 52] the overallmean delay is computed using matrix exponential distribution as in Section3.5 in Chapter 3.
The cumulative distribution function of delay rates are computed using(3.3) both for with and without retransmission. In addition, a constant linkdelay offset of 0.05 sec and node processing delay of 0.01 sec are also addedat each link and node to get the overall delay.
The delay obtained by considering Erlang distribution (both with andwithout retransmission) is fed as an input to the algorithm 5.1. The mismatchprobability values obtained by assuming exponential delay distribution andErlang distribution is compared. The results are shown in Figures 5.10(a),5.10(b) and 5.10(c). The mismatch probability value in case of retransmissionis greater than the one without retransmission.
Observing the difference between the Erlang and exponential delay dis-tribution plots, there is not much significant variation. For periodic accessstrategy, the difference in mismatch probability value is about 4%, in reactiveaccess and hybrid access strategies the difference is about 2%. The differ-ence is expected as Erlang distribution takes into account of delays causedby intermediate nodes as well as offsets (link offsets and node offsets). Thedifference between the mismatch probability values obtained assuming ex-ponential delay distribution and assuming Erlang delay distribution delay isnot much significant. Therefore, the analytical mismatch probability modeldeveloped (extending the one developed in [6]) in Section 5.4 considering ex-ponential delay distribution can be considered valid to show the concept ofdynamic information behaviour.

5.5 Validation of the Models 79
(a)
(b)
(c)
Figure 5.10: Mismatch probability comparison between Erlang distributed delay and ex-ponential distributed delay at λ = 2.0 and ν = 10. a) Reactive Access, b) Periodic Access,c) Hybrid Access at d0 = 0.1sec

80 Chapter 5
5.6 Performance Evaluation and Result
Analysis
In this section, the performance of each access strategy with respect tomismatch probability and power consumption are analyzed. The section alsoevaluates the models and investigates how the mismatch probability param-eter behaves with other network performance parameters; delay, samplingrate and event inter arrival time.
5.6.1 Mismatch Probability
The analysis of how mismatch probability behaves with varying eventrate and delay rate for all the three access strategies are provided here.
Figure 5.7 shows how mismatch probability varies with sampling rate atvarious mean delays (different network conditions) for three access strategies(a) Reactive, (b) Periodic and (c) Hybrid.
In all the three access strategies, as ν approaches infinity (meaning thatthe mean delay approaches to zero), the mismatch probability approaches tomismatch probability given by information sampling step (mmPrSamp). Butan interesting observation seen from Figures 5.11(a),5.11(b), and 5.11(c) isthat the mismatch probabilities do not decrease beyond mmPrSamp. Thisis due to the fact that the mismatch probability in information samplingstep is not influenced by network delay. Therefore, the combined mismatchprobability cannot be reduced beyond mmPrSamp irrespective of what thenetwork conditions are. This is also shown by (5.4c) for reactive access,however such equations could not be shown in case of periodic and hybrid asthe (5.1a) is not easily solvable.
Figures 5.12(a),5.12(b), and 5.12(c) show the variation of mismatchprobability with sampling rate with different values of event rate (λ). Asexpected, the value of mismatch probability increases as λ increases for allthe three access strategies. In all the three access strategies, it is observedthat as event rate (λ) approaches infinity, the combined mismatch probabilityapproaches 1. This is natural to observe as higher values of event rate (λ)means the events are changing very fast at the source.
Figures 5.13(a),5.13(b), and 5.13(c) show how mismatch probabilityvaries with event rate for different values of sampling rate (τ). In reac-tive access strategy, as sampling rate approaches infinity (meaning the sam-pling time interval approaches 0), the combined mismatch probability de-creases and approaches to mismatch probability given by the pure reactivei.e. mmPrRea. Referring back to Figure 5.3, mmPrRea is computed by as-

5.6 Performance Evaluation and Result Analysis 81
(a)
(b)
(c)
Figure 5.11: Mismatch probability verses sampling rate with varying rate of delay (ν) atλ = 1.5 (a) Reactive Access, (b) Periodic Access and (c) Hybrid Access at d0 = 0.1sec.

82 Chapter 5
(a)
(b)
(c)
Figure 5.12: Mismatch probability verses sampling rate with varying event rate (λ) atν = 10 (a) Reactive Access, (b) Periodic Access and (c) Hybrid Access at d0 = 0.1sec.

5.6 Performance Evaluation and Result Analysis 83
suming the information was correct at time t2, but the information at sourcehas changed during time interval t2 to t3. So, the pure reactive mismatchprobability (mmPrRea) is not affected by sampling rate. It is therefore, thecombined mismatch probability in case of reactive access does not drop be-yond mmPrRea. This is seen from Figure 5.13(a). The same is shown math-ematically in 5.4d by letting τ goes to infinity. In contrary, such behaviourwhere the lower limit of the combined mismatch probability is decided bymmPrRea is not observed in case of periodic and hybrid access strategy (inhybrid case, Figure 5.13(c) does not show this due to the constant delay d0 in-troduced, but it can be shown by reducing this delay or by further increasingthe value of sampling rate). From Figure 5.13(b), it is clearly seen that thecombined mismatch probability drops beyond mmPrRea. This is because,the under periodic and hybrid, the information update is assumed to be sentas per the sampling rate. Therefore, faster the information is sampled, theless information mismatch probability will occur, provided the mean delayremains constant.Figure 5.14 to Figure 5.16 show the derivative of mismatch probability with
respect to different parameters. These types of analysis show the level of sen-sitivity on information mismatch probability due to changes in informationelements or network conditions.
Figure 5.14 shows derivatives of mismatch probability with respect toevent rate (λ). It shows that variation of mismatch probability is moreat lower values of event rate (λ). In other words, information mismatchprobability is more sensitive to changes in event rate when the change rateis slower compare to faster change. This observation applies to all the threeaccess strategies. From the figure, it is observed that the Hybrid access ismore sensitive to change in event rate than the other two. This also showsthat if the scenario where event rate is like to change, then the hybrid willperform worst compare to other two access strategies in terms of informationmismatch probability.
Figure 5.15 shows derivatives of mismatch probability with respect tomean delay rate (ν). Here also, it shows that variation of mismatch proba-bility is more at lower values of mean delay rate (ν). Therefore, irrespectiveof what information access strategy being used, the information mismatchprobability is more sensitive to changing network delays at lower values ofdelay rates than at higher values of delay rates. Contrary to Figure 5.14, herethe reactive access strategy is more sensitive to the change on network delays.This means that if the scenarios is such that the network delay is likely tochange, hybrid gives better performance in terms of mismatch probability.
Similarly, a derivative of mismatch probability with respect to infor-mation sampling rate is shown in Figure 5.16. Here too, the variation of

84 Chapter 5
(a)
(b)
(c)
Figure 5.13: Mismatch probability verses event rate with varying sampling rate (τ) atν = 10 (a) Reactive Access, (b) Periodic Access and (c) Hybrid Access at d0 = 0.1sec.

5.6 Performance Evaluation and Result Analysis 85
Figure 5.14: Derivatives of mismatch probability with respect to mean event rate (λ) atν = 10 and τ = 5
Figure 5.15: Derivatives of mismatch probability with respect to mean delay rate (ν) atλ = 1.5 and τ = 5
Figure 5.16: Derivatives of mismatch probability with respect to sampling rate(λ) atν = 10 and λ = 1.5

86 Chapter 5
information mismatch probability is observed to be more when the samplingrate changes take place at lower values of sampling rate for all informationaccess strategies. From this figure, it shows that the change in sampling ratehas more impact on periodic access than other two. This is due to the factthat in periodic access the information is distributed periodically (at everysampling time) irrespective of whether there is demand or not.
Figure 5.17 shows the comparisons of mismatch probabilities. The com-parison also gives an idea how the delay, d0 (see Figure 5.5) introduced forchecking whether there is an information update and other processing delaylike filtering and detect events, does affect the mismatch probability. It islogical to see that smaller value of d0 gives more reliable information in termsof mismatch probability. In particular, as d0 approaches zero, the mismatchprobability of hybrid access approaches to mmPrComPer. Not much differ-ence is observed between mmPrComPer and mmPrComRea. A more detailedanalysis on time shifted delay is further provided in Section 5.7, where atrade-off between whether it is better to process information before sending(thereby not sending any information that are sampled) or just send infor-mation immediately without processing and checking is investigated. Figure
Figure 5.17: Comparisons of mismatch probability at ν = 10 and λ = 5.0
5.18 shows derivative of mismatch probability with respect to the constantdeterministic delay introduced for checking and processing information af-ter it is sampled with various values of information sampling rates. As seenfrom Figure 5.18, mismatch probability is more sensitive to value of d0 athigh sampling rate compare to lower values of sampling rate. This can beobserved by comparing with τ=1 and τ = 10 or 5. This is obvious becaused0 is added at every time the information sampled. Therefore, when the in-formation is sampled at faster rate that many number of times the checkingand processing take place.

5.6 Performance Evaluation and Result Analysis 87
Figure 5.18: Derivatives of mismatch probability (Hybrid) with respect to constant addi-tional delay (d0) at ν = 10 and λ = 1.5
5.6.2 Power Consumption
Figure 5.19: Comparisons of Power Dissipation in different access strategies.
Figure 5.19 shows the comparison of power dissipation for differentaccess strategies. It is observed that the power dissipation is smaller incase of hybrid access compare to periodic access, as expected. The powerdissipation characteristic of reactive and periodic strategy depends greatly ontwo parameters: namely µ, the information access rate andτ , the samplingrate. Assuming, information access rate is constant (µ = 1 ), as shown inthe Figure 5.19, it is seen that power dissipation in periodic is smaller thanreactive till the value of τ , the sampling rate reaches at value of µ.
In particular, it can be seen that the power dissipation depends on the

88 Chapter 5
ratio of µ/τ as summarized below:PPer = PRea for µ/τ = 1PPer > PRea for µ/τ < 1PPer < PRea for µ/τ > 1
(5.8a)
As expected, similar observation is made between power dissipation in reac-tive and hybrid access as shown in Figure 5.19 with the ratio between µ andτ ′. As sampling rate(τ) increases, the value of update rate (τ ′) (see (5.7c))also increases. When update rate(τ ′) becomes faster than the access rate(µ)(as per Figure 5.15, it happens at µ = 1.3), the hybrid power dissipationovertakes the reactive power dissipation.
PHybrid = PRea for µ/τ ′ = 1PHybrid > PRea for µ/τ ′ < 1PHybrid < PRea for µ/τ ′ > 1
(5.8b)
However, it should be noted that the value of τ ′ depends on the samplingrate(τ) and the information arrival time(λ) as seen from (5.7c). Since theupdate rate (τ ′) will never cross the value of sampling rate(τ), therefore, thepower consumption in case of hybrid access strategy (PHybrid) will be alwaysless than or equal to(PPer).{
PHybrid = Pper for τ ′/τ = 1PHybrid < PPer for τ ′/τ < 1
(5.8c)
5.7 Time Shifted Delay Distribution
In some scenarios, it is necessary to consider a time shifted delays. Thisis because it is inefficient for source nodes to transmit all the raw data to thesink, especially when sensed data has high redundancy or correlation. Toreduce the size of packet, thereby reducing the transmission delay, severalapproaches are proposed. The authors in [60] and [61] argue that commu-nication of data is one of the main energy consuming task that sensor nodeundertakes. They suggest conventional compression techniques to compressdata without sacrificing the salient information. In [62], a Secure Grid-SensorIntegration Architecture (SGSIA) is proposed aiming to reduce the overalldata transmitted to the grid system. To do so, SGSIA pre-processes data atthe source nodes to filter raw data streams, so that the total amount of datagenerated per unit time at the source is filtered. Similar approach is alsoproposed in [63], where preprocessing for data to check for error or missing

5.7 Time Shifted Delay Distribution 89
data in done before transmitting. In [64], compressive sensing for data gath-ering is investigated. This method tries to reduce sensor data traffic overthe network through collecting far fewer measurements than the number oforiginal sensor data. The compressive sensing technique enables to recon-struct a sparse signal from a small number of measurements. However, allthe above mentioned preprocessing approaches introduce some delays andalso need to expend energy for preprocessing. So, in order to reduce thetotal power consumption, the sum of power consumed for transmission andcomputation for preprocessing has to be less than the power consumed fortransmission without preprocessing [61]. Furthermore, there should be sig-nificant reduction in transmission delay by preprocessing the data. In otherwords, in order to see the advantage of preprocessing data, the end-to-enddelay reduction should be greater than the delay incurred in preprocessingthe data. This section investigates a trade-off between preprocessing andsending information immediately as soon as it is sampled.
Figure 5.20: Information access with time shifted delay (d0).
If d0 is the constant delay (time required for every information packetcompression, in case of compression scenario) then we can express total de-lay D as D = d0 + Dν , where Dν is the stochastic downstream delay; theprobability density function of D can be expressed as [6]
fD(t) =
{0 for 0 ≤ t < d0
fDν (t− d0) for t ≥ d0
Mismatch probability for reactive access is given by [6]
mmPrRea,sd = 1− 1
E(E)
∫ ∞0
(∫ ∞t+d0
FE(s)ds
)fDν (t)dt (5.9a)
With an assumption of delay and event interval are all independentand identical exponentially distributed with event arrival rate λ and rate of

90 Chapter 5
delay ν, then (5.9a) simplifies to
mmPrRea,sd = 1− νe−λd0
λ+ ν(5.9b)
Substituting (5.1b) and (5.9b) in (5.4a), we get the expression for com-bined mismatch probability with compressed information, under the givenassumption as
mmPrComRea,sd =λ(λ+ ν + τ) + τν[1− e−λd0 ]
(λ+ ν)(λ+ τ)(5.9c)
(a)
(b)
Figure 5.21: Impact of η on mismatch probability at λ = τ = 1 and mean delay (E[D]) of1 second (a) Reactive access and (b) Hybrid Access.
In the following the trade-off between a deterministic preprocessing de-lay and a stochastic network delay (caused by buffering, retransmissions etc.)that is influenced by the packet size of the data are considered. However, the
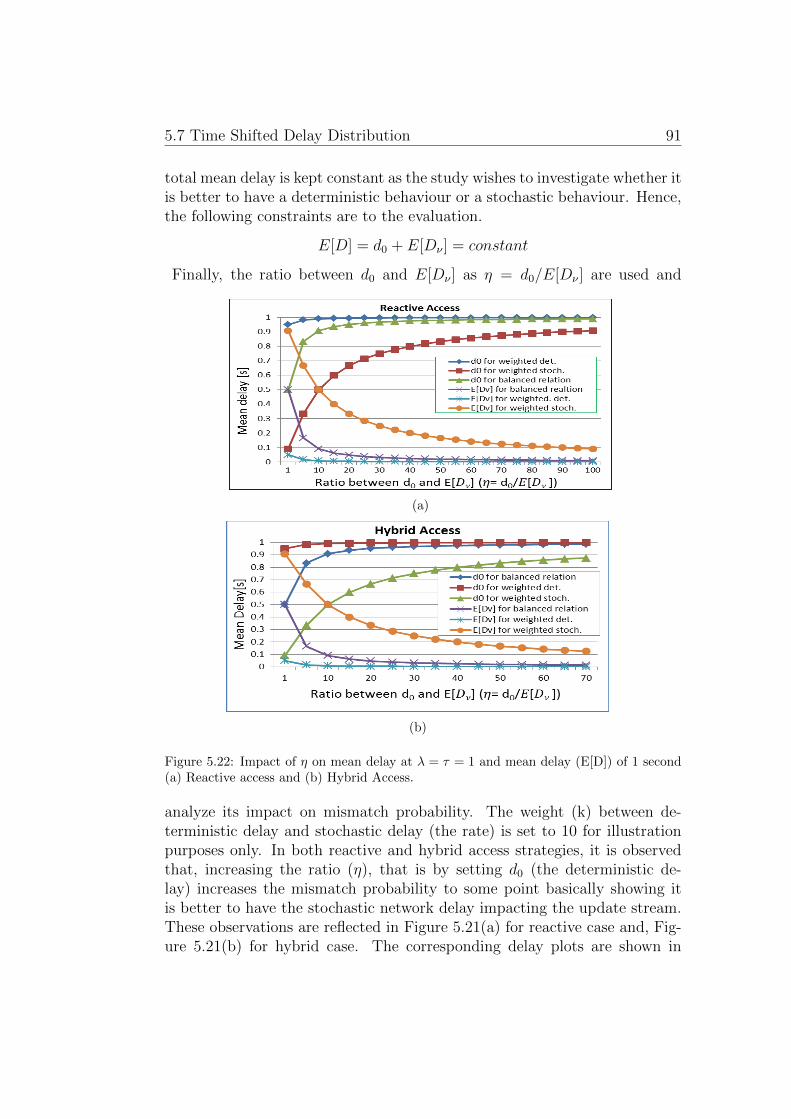
5.7 Time Shifted Delay Distribution 91
total mean delay is kept constant as the study wishes to investigate whether itis better to have a deterministic behaviour or a stochastic behaviour. Hence,the following constraints are to the evaluation.
E[D] = d0 + E[Dν ] = constant
Finally, the ratio between d0 and E[Dν ] as η = d0/E[Dν ] are used and
(a)
(b)
Figure 5.22: Impact of η on mean delay at λ = τ = 1 and mean delay (E[D]) of 1 second(a) Reactive access and (b) Hybrid Access.
analyze its impact on mismatch probability. The weight (k) between de-terministic delay and stochastic delay (the rate) is set to 10 for illustrationpurposes only. In both reactive and hybrid access strategies, it is observedthat, increasing the ratio (η), that is by setting d0 (the deterministic de-lay) increases the mismatch probability to some point basically showing itis better to have the stochastic network delay impacting the update stream.These observations are reflected in Figure 5.21(a) for reactive case and, Fig-ure 5.21(b) for hybrid case. The corresponding delay plots are shown in

92 Chapter 5
(a)
(b)
(c)
Figure 5.23: Impact of η on mismatch probability at mean delay (E[D]) of 1 second forReactive Access (a) at λ = 1, τ = 3 (b) at λ = 3, τ = 1 (c) at λ = τ = 3.

5.7 Time Shifted Delay Distribution 93
Figure 5.22(a) and Figure 5.22(b) for respective access strategies. Obviously,that also supports that it is then better to have algorithms running whichonly reduces traffic lightly and uses less time on preprocessing rather thanhaving a heavy preprocessing algorithm that drastically reduces a stochasticnetwork delay. In any case, the conclusions are also limited by the assump-tion that a preprocessing algorithm is producing the constant delay d0 andthe network is producing the stochastic exponential delay with rate ν.
For reactive access strategy further analysis have been done to see howdifferent values chosen for event rate (λ) and sampling rate (τ) changes theimpact on , thereby on mismatch probability. Comparing Figure 5.21(a) andFigure 5.23(a) when sampling rate (τ) increases the mismatch probabilityin the case of combined reactive (mmPrComRea,sd) decreases while there isno effect in case of pure reactive (mmPrRea,sd), irrespective of whether itis balanced relation or weighted. This is because the sampling rate has noinfluence on mismatch probability under pure reactive scenario. But, whenthe event rate (λ) is increased, its impact on mismatch probability (increase inmismatch probability) is observed in both pure reactive and sampled reactivecases. This can be observed by comparing Figure 5.23(b) and Figure 5.21(a).
Table 5.1: Shows how d0 values are computed for different cases, at k = 10 and η = d0/E[Dν ].
Cases d0
Mismatch proba-bility equation
Pure balanced relationE[D]
1+ 1η
Equation 5.9b
Sample balanced relationE[D]
1+ 1η
Equation 5.9c
Pure weighted deterministic E[D]− 1ν
Equation 5.9b
Pure weighted stochasticE[D]
1+ kη
Equation 5.9b
Sample weighted deterministic E[D]− 1ν
Equation 5.9c
Sample weighted stochasticE[D]
1+ kη
Equation 5.9c
Figure 5.23(c) is plotted to compare which parameter, event rate (λ) orsampling rate (τ) has greater influence on mismatch probability by changingboth the values by the same quantity. Although, λ and τ have opposite

94 Chapter 5
impact, meaning event rate (λ) has negative impact while sampling rate(τ)has positive impact on mismatch probability, the impact of event rate (λ)seems to have more than the impact of sampling rate (τ). It is therefore, anincrease in mismatch probability is observed. This can be easily noticed bycomparing the mismatch probability for sampled reactive case from Figure5.21(a) and Figure 5.23(c).
5.8 Conclusions
The chapter started by exploring information reliability model andpower consumption model in wireless sensor network with respect to ac-cessing information. Basically, three types of information access strategieswere explored. For each access strategies, mismatch probability models andpower consumption models were presented. With these analytical models,the investigation on how different information access strategies affect theinformation reliability in terms of mismatch probability and power consump-tion of information source were conducted. In particular, the following topicswere explored in this chapter:
The chapter presented a detailed study on the effect of informationaccess strategies namely: reactive, periodic and hybrid on power consumptionand reliability (mismatch probability) on wireless sensor network.
• As expected, the power consumption in hybrid access was observed tobe always less as compared to the periodic access. The power con-sumption between reactive and periodic access depends on the ratiobetween the access rate and the sampling rate. Similarly, the powerconsumption between reactive and hybrid access depends on the ratiobetween the access rate and the update rate.
• Information mismatch probability is more sensitive to all these threeparameters; sampling rate (τ), event rate (λ) and delay rate (ν) at lowervalues. Therefore, at lower rates, small change in these parameters willhave greater impact on mismatch probability.
• An event rate(λ) was observed to have more influence on mismatchprobability than the sampling rate(τ)
• The mismatch probability with hybrid access was observed always higherthan the other two access strategies because of an additional delay (d0)introduced for checking update and preprocessing. Information mis-match probability is more sensitive to d0 at higher sampling rates.

5.8 Conclusions 95
Both power consumption and information mismatch probability are in-fluenced by rate at which information is sampled. Sampling rate haspositive impact on mismatch probability whereas it has negative im-pact on power consumption. Therefore, it is possible to find a trade-offbetween these two parameters to adapt information access as per therequirement.
The information mismatch probability under different access strategy is es-timated using the framework proposed in Chapter 4 and the values are com-pared with the mismatch probability values obtained by using analyticalmodels.
• Information mismatch probability under three information access strate-gies; reactive, periodic and hybrid were estimated with the help of theproposed framework in Chapter 4. As expected it was observed thatthe information mismatch probability under hybrid access strategy weregreater than the other two.
• The information mismatch probability comparison between reactiveand periodic access strategies shows that the reactive access suffersmore in terms of information reliability.
• The information mismatch probability by keeping sampling rate at con-stant is also estimated and comparison with exponential sampling rateis made.
• A comparison of information mismatch probability estimation betweenexponential and Erlang delay distribution is provided. The differencein mismatch probability value between these two distributions is foundto be about 4% in periodic access strategy case and about 2% in caseof reactive and hybrid access strategies.
• A comparison of information mismatch probability estimation betweenexponential, Erlang delay distribution without and with retransmissionconsideration is provided for all the three access strategies.
The impact of adding deterministic processing delay on information relia-bility and trade-off between compression time and reduction in stochasticnetwork delay were presented.
• It was observed that, in order to have better information reliability, it isbetter to have compression algorithm which only reduces traffic lightlyand uses less time on compression rather than having heavy compres-sion algorithm which drastically reduces stochastic network delay

96 Chapter 5
To summarize, the information mismatch probability under all thethree access strategies under consideration is impacted by the rate at whichthe information is generated at source, the rate at which information is sam-pled and the rate of delay between information source and the informationuser. Therefore, it is understood that the information reliability in terms ofmismatch probability can be maintained at required level by varying sam-pling rate. In addition, it was observed that the power consumption of theinformation source is impacted by the information sampling rate. If we com-pare power consumption and mismatch probability and see how they areaffected by information sampling rate, it will be observed that sampling rateas positive impact on mismatch probability whereas it has negative impacton power consumption. This means that if we increase the sampling rate, theinformation reliability will be improved whereas with the increase in samplingrate, the information source will have to spend more power.
Therefore, an information access mechanism which can adapt as perthe application requirement can be possible, thereby finding a trade-off be-tween information reliability and power consumption. This adaptive infor-mation access mechanism by varying information sampling rate is presentedin Chapter 6.

Chapter 6
An Adaptive InformationAccess Mechanism
Wireless sensor network is being used for different types of appli-cations today. The requirements are not same for all the appli-cations. As an example, information reliability may be essentialfor one application but for another, power consumption may beof greater concern than information reliability. In Chapter 5, itwas observed that these two requirement parameters; informationreliability and power consumption can be varied by varying infor-mation sampling rate. If a single wireless sensor network is tosupport more than one application, there should be an accessingmanagement system that adapt as per the requirement of the ap-plication. The information access mechanism should be such thatthe resources are not either over utilized or underutilized. There-fore, this chapter proposes adaptive information access mecha-nism based on power consumption and information reliability.The framework proposed in Chapter 4 can be used to adapt infor-mation access as per these two parameters. Further, the chapteralso points out a trade-off point between power consumption andinformation reliability beyond which adaptation gains very min-imal in information reliability but has to spend huge amount ofpower.
97

98 Chapter 6
6.1 Motivation
Be it wireless network or any other traditional network, satisfying appli-cations requirement with minimum utilization of resources is utmost impor-tant to harvest better benefits both in terms of investment and performance.In particular, when wireless sensor network have the ability to supportingvarious applications, it would be cost effective and yields better overall per-formance if it could satisfy multiple applications requirements with singlenetwork deployment. Further, the requirements for applications are also in-fluence by the availability of resources. As an example, if the sensor nodeshave direct power supply instead of battery powered, then there is no needto worry about the lifetime of the nodes. Contrary to this, if the informa-tion area is such that, replacing or recharging of battery is not possible, itis important that the energy is not wasted by making unnecessary access tothe information source. This section brings out a scenario and argues whyadaptive information access mechanism is beneficial in such a scenario.
Consider that a wireless sensor network is set up in the Himalayanregion to monitor and study the temperature variation over the years. Forthis type of application, it is more crucial to have longer lifetime than themore reliable and up-to-date information. So, information access frequency tosuch type of application should be adapted such that the energy consumptionis always maintained at certain required level. But this will have an impacton the information reliability, meaning as frequency of accessing informationis controlled to maintain required power consumption level, the informationmay not be as fresh as in the case where there is no control over frequencyof accessing the information.
On the other hand, consider a scenario where wireless sensor networkis installed inside a building for safety monitoring purposes. This type ofapplication does not need to worry about the power consumption as thenodes can be directly connected to the power supply or the battery can bereplaced or recharged easily. But, for such an application, timeliness andreliable information is very much crucial. So, access to information can beadapted so that required level of information reliability is maintained at allthe time.
Looking at the above two situations, it is therefore, interested in inves-tigating how this type of adaptive access can be achieved. Furthermore, aninvestigation on trade-off between power consumption and information reli-ability will provide support in designing adaptive information access mecha-nism.

6.2 Related Works: Adapting Sampling 99
6.2 Related Works: Adapting Sampling
Since information quality and energy consumption are important per-formance parameters for sensor network, a number of research articles canbe found in the literature. We briefly review few of these articles which aremainly focused on improving information quality and low energy consump-tion with respect to sampling rate.
In [65], a reward and punishing based cooperative adaptive sampling isproposed. This method considers cooperation among nodes to find a balancebetween energy consumption and the information quality. It uses clusteredbased sensor network system, where a node which detects frequent phenom-enal change increases the sampling rate while the others decrease their sam-pling rates. In this way, the approach is able to keep the overall network dataquality high and minimize the energy consumption by reducing the samplingrate of other nodes.
A two-step approach of adapting sampling called backcasting is pro-posed in [66] aiming at maintaining high information quality with reducedenergy consumption. In the first step, called the preview step, an initialestimate of the environment is formed by using subset of nodes. This sub-set of sensor nodes communicate with the fusion center with this estimatedinformation which indicates that some sensor may not be required in orderto achieve a required level of accuracy. So the fusion center backcasts in-formation based on the estimate received and selectively activates additionalsensor nodes in the next step, called refinement step. Here, the term adaptivesampling is used how many sensor nodes are activated simultaneously ratherthan how fast or slow the information is transmitted. In this approach, adap-tive sampling helps in reducing energy consumption by activating fractionsof the available nodes.
An adaptive sampling scheme that responds to the characteristics of thestreaming data is developed in [67]. Their approach is based on predictionsof future values of a data stream based on Kalman filter. It is based oncentralized approach where the activities of the nodes are monitored. Thebandwidth allocation is done automatically as per the activity of the nodes.The nodes which show an increase in activity is allocated bandwidth whichgives shorter time interval (shorter sampling interval) between successivemeasurements whereas the nodes which do not show an increase in activityare made to have longer time interval (higher sampling interval).
However, most of the previous works were done based on applicationspecific sensor networks. When single sensor network has to support morethan one applications, the challenges arise as each individual application has

100 Chapter 6
its own set of requirements that needs to be given due importance. As wehave described in Chapter 2, the preference for requirements differ from oneapplication to another. In this chapter, an adaptive information access mech-anism which can satisfy different applications without much compromisingthe overall performance of the system is proposed and presented.
6.3 Adaptive Access Mechanisms
As highlighted in Section 6.1, an adaptive information access will beuseful when there are multiple applications with different requirements. Thischapter mainly investigates two requirement parameters, namely; informa-tion mismatch probability and power consumption. The proposed adaptiveinformation access mechanism based on the analytical models provided inChapter 5. The adaptation is basically done by varying information sam-pling rate.
6.3.1 Adapting Information Sampling Rate
Referring back to Figure 5.17 in Chapter 5, it is observed that theinformation reliability in terms of mismatch probability can be varied byvarying the rate of information sampling. Therefore, it is possible to maintainmismatch probability at certain required level by adapting sampling rate.Consider a situation, where an application (say safety monitoring) needs tomaintain an information reliability of 0.80 (mismatch probability = 0.20) atall time. Although, it is possible to make similar analysis with all the threeaccess strategies, we have mainly focused on reactive access as it is easierand simple to show the concept. However, we have made a comparativeanalysis of all the three access strategies, which equally show how adaptiveinformation access is possible with all the access strategies.
Reactive Access Strategy
Revisiting (5.4b) and solving it, sampling rate (τ) can be expressed as
τ =λ(λ+ ν)(1−mmPrComRea)mmPrComRea(λ+ ν)− λ
(6.1)
Also solving (5.5c) for sampling rate (τ), it can be expressed in terms ofpower consumption as
τ =PRea − PtxttxµPsamptsamp
(6.2)

6.3 Adaptive Access Mechanisms 101
(a)
(b)
(c)
Figure 6.1: Reactive Access (a). Adaptation of sampling rate to maintain mismatch prob-ability of 0.20, (b).Mismatch probability and power dissipation variation with samplingrate at λ = 0.5 and ν = 10 and µ = 1 (c). Mismatch probability variation keeping τconstant and λ = 0.5.

102 Chapter 6
This requirement of 0.80 (mismatch probability of 0.20) informationreliability can be satisfied by adapting the sampling rate assuming the eventrate is constant (although it is not always true) as shown in Figure 6.1(a).However, this comes at a cost of increase in power consumption, becausewhen information is sampled with faster rate, it draws more power. Thiscan be seen from Figure 6.1(b). Therefore, we need to find out a trade-offpoint between power consumption and mismatch probability. From Equa-tion 6.1, one can see that as the denominator term approaches zero, (atmmPrComRea = λ
(λ+ν)= mmPrRea) one would need to increase sampling
frequency to infinite and gain only little in terms of information reliability(confirmed by the asymptote in Figure 6.1(b). This is thereby the trade-offpoint where instead of trying to achieve required information reliability, it iseconomical to reduce power consumption.
Figure 6.1(c) shows how the mismatch probability behaves with net-work delay if the sampling rate is kept constant (at some more or less ar-bitrarily chosen value). This illustrates that the reliability will vary highlydepending on link conditions or end-to-end delay (network conditions) ifsampling frequency is not adapted.
Based on Figure 6.1(b), the derivatives of the power consumption andmismatch probability with respect to sampling rate (τ) can be computed inorder to find how sensitive is power consumption and information mismatchprobability(mmPr) with change in sampling rate.
Figure 6.2: Sensitivity plot: Showing how sensitive is power consumption and mismatchprobability to the change in sampling rate(τ) with Y-axis plotted with log scale.
α = dmmPrdτ and β = dPower
dτ
Then, f(α, β) = β/α will show how sensitive is the power consumption andmismatch probability to the change in sampling rate (τ). Figure 6.2 shows thef(α, β) plotted against sampling rate (τ). From Figure 6.2, it is observed that

6.3 Adaptive Access Mechanisms 103
the power consumption is more sensitive to the change in sampling rate athigher values of sampling rate, while mismatch probability is more sensitiveto change in sampling rate at lower values of sampling rate.Therefore athigher sampling rates, one should worry about power, and at lower samplingrates, one should worry about mismatch probability (as a rule of thumb, i.e.there are as seen no sharp line between the two parameters. At later section,an adaptive information access algorithms are provided where, switching fromone algorithm to another is suggested based on the result shown in Figure6.2.
Comparison between different Access Strategies
As adaptive information access by varying sampling rate is applicableto all the three access strategies, a comparative study is made here in orderto find out which access strategy is better among the three. Figure 6.3below shows the comparative study of three access strategies with respect toadaptive information access by varying sampling rate. The target mismatchprobability to be maintained is set at 0.20. If we compare between periodic
Figure 6.3: Comparison between the three access strategies in adaptive information accessby varying sampling rate at λ = 0.5.
and hybrid access strategies in Figure 6.3, we see that the sampling rate forhybrid should be always greater in order to maintain same level of informationreliability in terms of mismatch probability. This is due to the fact that, inhybrid access, there is an additional delay of d0. So, if the application needsto maintain high information reliability and does not care much about thepower consumption, it is better to use periodic access while applying thistype of adaptive information access. Among the three, it is observed thatthe periodic access out performs than the other two.

104 Chapter 6
The analysis in case of periodic access and hybrid access, are done nu-merically as the mismatch probability Equation (5.1a) and Equation (5.6),which give expressions for mismatch probability, are not easily solvable math-ematically, to get expressions for sampling rate (τ).
In Figure 6.3, in the case of Sampling Rate (Reactive), it is observedthat the plot ends at ν = 3.0 and does not go beyond unlike other two plots.The reason for this observation is, at this setting (λ = 0.5), the mismatchprobability does not depend on ν when ν is less than 3. This also shows thatat this point the mismatch probability is influenced by sampling process only.
6.3.2 Trade-off between Reliability and PowerConsumption
As we know from our state-of-the-art study in Chapter 2 the require-ments of wireless sensor network would be different as per the purpose andapplication type. As an example, sensor network application which mon-itors environment data collection over a time will not be concerned muchabout reliability rather it is important to extend lifetime of the sensor nodes,whereas sensor network which is used for safety monitoring purposes (e.g. firedetection in building) needs to have high reliability. Therefore, depending onthe applications and their purposes, we can have a trade-off between powerconsumption and information reliability. So, in this section, we analyze thetrade-off mechanism with the three access strategies and study the differ-ences on the amount of trade-off needs to be made (power consumption andmismatch probability). We try to keep our parameters same for all accessstrategies.
For reactive access strategy, Equations (6.1) and Equation (6.2) can beused to analyze how trade-off between power consumption and informationreliability can be made in order to fulfil applications requirement. In caseof periodic and hybrid access strategies, numerical integration is performedto get the values of sampling rate (τ), as done in Section 6.3.1 in order toanalyze the trade-off mechanisms.
Suppose, if an application has to maintain a power dissipation of 80mWfor all time, then we need to compromise on the information reliability (mis-match probability). This means that we need to increase the mismatch prob-ability by lowering the sampling rate. Figure 6.4(a), 6.4(b) and 6.4(c) showhow mismatch probability is varied in order to maintain power dissipationof 80mW, considering network delay ( 1
ν) is the sum of sampling time (tsamp)
and transmission time (ttx) (for hybrid constant d0 is also added). This

6.3 Adaptive Access Mechanisms 105
(a)
(b)
(c)
Figure 6.4: Maintaining constant power consumption by varying mismatch probability (a)Reactive Access, (b) Periodic Access and (c) Hybrid Access.

106 Chapter 6
type of adaptation could be used for WSN application like environment datacollection where reliability is not much critical.
Figure 6.5(a), 6.5(b) and 6.5(c) show how mismatch probability of 0.40is maintained at the cost of power consumption. The power dissipation isvaried by varying sampling rate in order to maintain the required mismatchprobability. This type of adaptation would be useful for an application (e.g.safety monitoring), where reliability cannot be compromised but the powerconsumption less an issue.
If we compare Figure 6.4(a), 6.4(b) and 6.4(c), it is observed thatamong the three access strategies, hybrid access shows that less trade-off ininformation reliability need to be made, followed by periodic access and thenreactive access in order to maintain same required power consumption level.Similar behaviours are observed in terms of trade-off on power consumption.
Similarly, how the required information reliability in terms of mismatchprobability is maintained by adapting power consumption are shown in Fig-ure 6.5(a), 6.5(b) and 6.5(c) for different access strategies. It shows thatmore energy needs to be spent with reactive access, followed by periodic andthen hybrid access. This analysis shows that hybrid access strategy out-performs in making trade-off between power consumption and informationreliability compare to periodic access strategy, as expected. But the powerconsumption of reactive access will depend on how fast the information isbeing accessed as explained in Chapter 5. When access rate (µ) increasesthe power consumption under reactive case will also increase.
In Figure 6.5(a), it is observed that when network delay reaches at 1.3seconds, the combined mismatch probability (mmPrComRea) becomes equalto mismatch probability of pure reactive (mmPrRea). Beyond this pointthe mismatch probability of pure reactive access, given by Equation 5.4c,becomes higher than the target required mismatch probability. This is thepoint where mismatch probability no more depends on sampling rate andpurely decided by the stochastic network delay and the rate at which in-formation changes at source. This shows that mismatch probability cannotbe adapted below mismatch probability (mmPrRea) given by pure reactiveaccess. This is due to the fact that (mmPrRea) does not depend on samplingrate (τ).

6.3 Adaptive Access Mechanisms 107
(a)
(b)
(c)
Figure 6.5: Maintaining the required reliability by varying power consumption (a) ReactiveAccess, (b) Periodic Access and (c) Hybrid Access.

108 Chapter 6
6.4 Adaptive Information Access
Mechanism Algorithms
In order to implement adaptive information access mechanism describedin Section 6.3, an algorithm can be designed and implemented using the pro-posed framework described in Chapter 4. The pseudo codes of the algorithmsare shown in Algorithm 6.1 (maintaining power consumption) and Algorithm6.2 (maintaining information reliability). Referring back to Figure 4.1, thealgorithm can be executed in the Event Monitoring Unit (EMU) and particu-larly within NM-Unit. As per the requirement level, e.g. level of informationreliability required maintaining or maximum power consumption limit per-missible, the sampling rate can be adapted.
The algorithms for adaptive information access are shown for reactiveinformation access only. With similar approach, the adaptive information ac-cess algorithms can be implemented for periodic and hybrid access strategies.Choosing of an appropriate information source mentioned in step 3 of Algo-rithm 6.1 and Algorithm 6.2 can be done as per the Algorithm 7.1 describedin Chapter 7. These two algorithms are based on trade-off between powerconsumption and information reliability. To maintain power consumption,the algorithm compromises on information reliability. Similarly, to maintaininformation reliability, the algorithm compromises on power consumption.The trade-off between these two parameters is achieved by varying samplingrate.
Algorithm 6.1 Adaptive Information Access Mechanism to Maintain Re-quired Power Consumption Limit
1: Initiate the request for information2: Check for the registered information sources3: Choose an appropriate information source4: Get the maximum power consumption limit (PRea)5: Get mean delay rate (ν)6: Compute sampling rate as per the power consumption level as
τ =PRea − PtxttxµPsamptsamp
7: Adapt sampling rate (τ) as computed above

6.5 Conclusions 109
Algorithm 6.2 Adaptive Information Access Mechanism to Maintain Infor-mation Reliability
1: Initiate the request for information2: Check for the registered information sources3: Choose an appropriate information source4: Get the level of information reliability required (mmPrComRea)5: Get the information arrival rate(λ)6: Get mean delay rate (ν)7: Compute sampling rate as per required mmPrComRea level
τ =λ(λ+ ν)(1−mmPrComRea)mmPrComRea(λ+ ν)− λ
8: Adapt sampling rate (τ) as computed above
6.5 Conclusions
This chapter mainly focused on an adaptive information access mech-anisms and the main points are summarized below:
• An adaptive information access mechanism by varying sampling rate.
– It is found that an application demanding a certain level of infor-mation reliability could be satisfied by adjusting the rate at whichthe information is sampled.
– It was learnt that sampling rate cannot keep on increasing, expect-ing improvement in information reliability. This is because aftercertain value, the gain in information reliability is so minimal ascompare to the increase in power consumption due to increase insampling rate, thereby giving a trade-off point where instead ofachieving information reliability, it is economical to reduce powerconsumption.
• A trade-off mechanism between power consumption and informationreliability.
– It is learned that an application which requires certain level ofinformation reliability could be satisfied by increasing samplingrate, which increases the power consumption.
– Similarly, certain applications like environmental data collectionover a period of time, which may not require very high reliable

110 Chapter 6
information, the lifetime of a sensor node could be extended byreducing the sampling rate, thereby reducing the power consump-tion.
– As expected, for reactive access strategy, it is observed that thecombined mismatch probability requirement level cannot be lowerthan the mismatch probability given by the pure reactive access.This is the point where mismatch probability no more depends onsampling rate and purely decided by the stochastic network delayand the rate at which information is changed.
• Algorithms for implementing adaptive information access mechanismsby using the proposed framework are described.

Chapter 7
Dynamic Information SourceSelection Algorithm
Given a situation, where a particular piece of information canbe obtained from multiple sources, provides information user achoice to use the information source that best suits his/her re-quirement like what level of information reliability or how muchinformation source node is ready to spend power. However, whenthese information sources have different characteristics features;like different event rates, different technologies, having possibil-ity of configuring with different sampling rate, located in differentlocations- which results in different access delays because of dif-ferent routes, there is a need for an algorithm which dynamicallyselects and configures access to information source based on in-formation dynamics. Therefore, this chapter presents a dynamicinformation source selection algorithm based on information mis-match probability metric. The algorithm is design to facilitatein selecting the information source which gives the best informa-tion reliability in terms of mismatch probability. The performanceanalysis of the algorithm is evaluated by creating different scenar-ios which represent different network conditions.
111

112 Chapter 7
7.1 Motivation
Due to high demand and high competition in electronics manufacturingcompanies, various types of sensors, which can measure same phenomenon,are manufactured by different companies. As an example, various types oftemperature sensors are manufactured by Microchip Technology Inc. [68],OMEGA Engineering Inc. [69] and Applied Sensor Technologies [70], toname a few. As temperature sensor is commonly used for various purposes,this group of sensors is considered as an example for the sack of easy un-derstanding in this chapter. There are different types of sensors which canmeasure same phenomenon, i.e. temperature. A few popular temperaturesensors commonly used are: Thermocouple, Platinum Resistive TemperatureDevice (RTD), Thermistor, and other integrated Silicon Based Sensors [71].Each of these sensors is designed for specific temperature ranges and environ-ment conditions with different costs, level of sensitivity, and response timeamong others (refer Table 7.1). Sensitivity of a sensor node is defined as arate of change in output as the input varies [71, 72]. As observed from Table7.1 the sensitivity of different types of temperature sensors is different. Sincesensitivity is the rate of change of output signal, depending on the inputsignal, it is directly related to the event arrival rate.
Figure 7.1: An abstract view of information accessing with source selection possibility.
Consider a scenario, where an organization wants to monitor the tem-perature of a certain locality and due to some reasons, like costs, robustnesstowards failure of one technology (not to rely on specific technology), ex-isting sensor nodes (already available) and different threshold values, theorganization has deployed four types of temperature sensors, which are men-tioned in the Table 7.1 [68, 72]. These temperature sensors have differentcharacteristics which lead to different behaviour in sensing temperature in-

7.2 Proposed Algorithm 113
formation from the surroundings. This means, although, they all measuresame temperature information but the rate at which they sense temperaturefrom surrounding is different, resulting a scenario where different sources sup-plying the same information. Or all information sources give equally usefulinformation but the reliability in terms of information mismatch probabilitydiffers as they are placed in different locations. In this type of scenario, whenthe same information (temperature, in this case) can be obtained from differ-ent information sources, the users are provided with choice to select the bestsuitable information source as per their preferences and requirement. More-over, having multiple information sources would provide information userwith continuous supply of information even if the current information sourcebecomes unavailable. However, in order to take advantage of having multipleinformation sources, there should be a system put in place where informationsource switching is dynamically done as and when it is required. Therefore,in this chapter, the framework which was proposed and described in Chapter4 is used to implement a dynamic information source switching and selection.An abstract view of information accessing from multiple information sourcesis shown in Figure 7.1.
From previous chapters, particularly from Chapter 5, it was learnedthat event arrival rate has an impact on the information mismatch proba-bility and it has direct relationship, meaning that higher the event arrivalrate, the more the information mismatch occurs. But, it is not necessarilytrue that the information source which has lowest event arrival rate alwaysgives lowest mismatch probability. This is because, mismatch probabilitydoes not only depend on event rate, but it also depends on other parame-ters like network delay, access configuration and sampling rate. Therefore,based on the algorithm, this chapter also explores and investigates how theseinformation dynamics which have impact on information mismatch proba-bility, do influence the information source selection decision. In particular,a dynamic and reliable information source selection algorithm based on in-formation mismatch probability and power consumption is presented in thischapter.
7.2 Proposed Algorithm
The proposed algorithm is based on the comprehensive study done inChapter 5 on the topic information mismatch probability and power con-sumption. This algorithm for dynamic information source selection choosesinformation source based on the information mismatch probability. The mis-match probability depends on dynamic information elements; event arrival

114 Chapter 7
Table 7.1: Comparisons of common temperature sensors specifications.
Characteris-tics
PlatinumRTD
Thermis-tor
Thermo-couple
IntegratedSilicon
TemperatureRange
-200◦C to500◦C
-40◦C to260◦C
-270◦C to1750◦C
-55◦C to150◦C
ChangingParameter
Resistance Resistance VoltageVoltage/Current
Accuracy ±0.5◦C ±0.1◦C ± 0.5◦C ± 1◦C
Sensitivity(ρ)
2mV/◦C 40mV/◦C 0.05mV/◦C -2mV/◦C
ResponseTime
2-5 sec 1-2 sec 2-5 sec 4-60 sec
Cost $ 60-215 $ 10-350 $ 20-235 $ 1-10
rate, sampling rate and end-to-end delay between information source and theinformation user. The algorithm computes mismatch probability based onthe dynamic information elements whenever the information user access in-formation. The sampling rate is tuned as per the maximum power consump-tion limit of the node. So, the algorithm takes into account both informationreliability in terms of information mismatch probability and power consump-tion of the node, both are relevant performance parameters for wireless sensornetworks.
Although, this algorithm is applicable to all the three information ac-cess strategies discussed in this thesis, but it is implemented for the reactiveaccess strategy only. The only reason for choosing reactive as a sample anal-ysis is that the mismatch probability equation in this case is easily solvablethereby keeping minimum time for selection of information source. Whereasfor subscription based access (hybrid and periodic), they incur more time forselection of information source (due to numerical integration) thereby addingto access delay (unless it is a matter of reconfiguration, in which selectioncan be done by reconfiguring according to the network delay). The mismatchprobability and sampling rate under reactive access strategy can is given by(5.4b) and (6.2) respectively. And they are reproduced in the pseudocodeof the algorithm provided in Algorithm 7.1 for easy understanding of thealgorithm.
The following values are used for testing and evaluation of the algorithmin Section 7.3, PRea = 80mW , Ptx = 5mW , Psamp = 3mW , tsamp = 2sec andµ = 3sec−1. Since,(ttx + tsamp) is the total delay, it is taken as 1
νin this

7.3 Algorithm Implementation 115
Algorithm 7.1 Pseudocode for Information Source Selection based on Mis-match Probability and Power Consumption
1: Initiate the request for information2: Check for the registered information sources3: procedure ArraySource(NoOfSource)4: for each source i in NoOfSources do5: Get reference ID of each source (RefID)6: Get information arrival rate (λ)7: Get the average rate of delay (ν)8: Compute sampling rate as per the required power9: consumption level as
τ =PRea − PtxttxµPsamptsamp
10: Compute mismatch probability(mmPrRea) as
mmPrComRea =λ(λ+ τ + ν)
(λ+ τ)(λ+ ν)
11: end for12: Sort the RefID by mmPrRea13: Choose the first element in the list14: end procedure
algorithm.
7.3 Algorithm Implementation
In order to implement the proposed algorithm, the framework whichwas proposed and described in Chapter 4 is used. In Figure 7.2, informa-tion sources S1, S2 and so on were assumed to be any sensor nodes whichcan provide different information or same information. In order to suite thisparticular algorithm implementation, the information sources are modeledas same type of sensor node (temperature sensors) but with different charac-teristics which behave as different information sources for the same type ofinformation (temperature information). The modified scenario is shown inFigure 7.1, with four temperature sensors shown as S1, S2, S3 and S4 actingas four different information sources which provide temperature information.It can be seen at later stage in this section, how these sources are modeled to

116 Chapter 7
Figure 7.2: Proposed Framework Architecture (reproduced from Chapter 4).
represent difficult cases for selection of information source by modeling withdifferent delay rates between each information source and information user.By assigning different delay rates, they represent different network traffics;different routes, congestion, retransmission, that a packet would encounterto reach the final destination.
As these four temperature sensors have different characteristic featuresas shown in Table 7.1, each source is modeled such that they generate infor-mation with different rates, assumed to be exponentially distributed withoutdiverting from the proposed framework and assumptions described in Chap-ter 3. By doing so, all the information sources represent temperature sensorsbut generating information at different rates. This modeling is based on thenotion that due to difference in sensitivity values for different sensors, theevent rate will differ, although further exploration and study is encouragedto find out how the different properties of the devices really affects eventrate. Nevertheless, in this chapter, the event rate (λ) is modeled based onthe sensitivity values of each sensor and is computed as below (for effectivelyfiltered signal):
As defined in Chapter 3, an occurrence of an event can be expressed as
|E(t)− E(t+ dt)| > threshold
Considering a temperature change of φ◦C at every t sec, and a sensor nodewhich has a sensitivity of ρ mV per degree Celcius, assumming effectivelyfiltered signal and constant change rate, the rate(θ) of change for temperatureT can be computed as
θ =dρ
dt=
(dρ
dφ
)(dT
dt
)(7.1)

7.3 Algorithm Implementation 117
Using (7.1), we can get the time interval and information arrival rate (λ) as
t = thresholdθ and λ = 1/t
If V is the generated voltage, then the sensitivity (ρ) can be expressedas
ρ =dV
dT
As an example, event rate (λ) for Platinum RTD temperature sensor as perthe values shown in Table 7.1 is computed here. The Platinum RTD sensorhas ρ = 2mV /◦C. Say that a temperature change of φ = 1◦C/sec, then usingEquation (7.1), rate of change (θ) will be equal to 2mV/sec. This would givean average time interval, t = 1sec, i.e λ = 1sec−1, considering a thresholdvalue of 2mV . The threshold value selected has influence on event rate asseen from Chapter 3. It was learnt that for inter event arrival time to followexponential distribution, the threshold value must be between 1 and 3. Thisis from the analysis carried out in Chapter 3. Similarly, event rate for othertemperature sensors are obtained and the values are tabulated in Table 7.2.In order to have better comparison, four values of event rates ( λ1 to λ4) aretabulated in the Table 7.2, with different values of thresholds and tempera-ture change rate (φ). Two different values of temperature change rates areused 1)φ = 1◦C/sec (faster change), 2) φ = 0.03◦C/sec (slower change). Adaily normal (fine weather) temperature may result slower change whereasabnormal weather with rain/clouds and wind may result faster change inweather condition.
Table 7.2: Event Rates for different values of φ and thresholds.
Thres-holdValue
Temp.ChangeRate(φ)
EventRate
Plati-numRTD
Ther-mistor
Thermo-couple
Inte-gratedSilicon
2mV1.0◦C/sec λ1 1.0 20.0 0.025 1.00.03◦C/sec λ2 0.03 0.6 0.00075 0.03
1mV1.0◦C/sec λ3 2.0 40.0 0.05 2.00.03◦C/sec λ4 0.06 1.2 0.0015 0.06
Figure 7.3 shows how event rate(λ) varies against threshold values withdifferent sensitivity values (ρ). It is clearly observed from the figure that asthe threshold values increases, the event rate decreases and the variation ismore at lower values of threshold. This means that if the chosen thresholdvalue is high, most of the events will not be detected which will affect the

118 Chapter 7
Figure 7.3: Event rate (λ) variation against threshold values with different values of sen-sitivity (ρ).
Figure 7.4: Mismatch probability variation with different values of mean delay rates (referTable 7.3) with constant sampling rate (τ = 3.0) and temperature change rate (φ =0.03◦C/sec).
accuracy of information. The figure also shows that higher the value ofsensitivity, more events can be detected.
As event rate (λ) is computed based on the sensitivity (ρ) of the sensor,the threshold value chosen will have impact on information mismatch prob-ability. An analysis on the impact of different threshold values on mismatchprobability is provided as shown in Figure 7.4. The variation of mismatchprobability is observed to be more at lower threshold values as compared tohigher threshold values. An interesting point that can be learnt from Figure7.4 is the trade-off between information accuracy and information reliability.As shown from Figure 7.3, the accuracy (in terms of detecting events) is highat lower threshold values. So, in order to have greater accuracy, lower val-ues of thresholds are desired but this will result high information mismatchprobability (high chances of using wrong information). This is observed from

7.4 Evaluation and Analysis 119
Figure 7.4. However, it is to be noted that this analysis is based on the as-sumption that the event rate is exponentially distributed. However, the shortanalysis carried out in Chapter 3 shows that inter event arrival time can beassumed as exponential distribution, provided appropriate parameters likethresholds and sampling frequencies are chosen. Nevertheless, this deservesfurther study to find out what types of distributions are more relevant andhow they affect the information mismatch probability.
Table 7.3 shows different mean delay rates (assumed exponentially dis-tributed) assigned in order to examine how different delay rates affect theselection of information sources. As mentioned earlier in this section, each de-lay rate represents a different network condition for each type of sensor, whichmeans different access delays due to several reasons like different routes, net-work congestion and so on.
Table 7.3: Mean Delay Rates values used for evaluation purposes
MeanDelayRates
PlatinumRTD
Ther-mistor
Thermo-couple
IntegratedSilicon
ν1 0.9 45 0.009 1.2ν2 0.8 40 0.008 0.8ν3 0.7 35 0.007 0.6ν4 0.6 30 0.006 0.4ν5 0.5 25 0.005 0.2ν6 0.4 20 0.004 0.1
7.4 Evaluation and Analysis
The impact of information dynamics on information source selectionis evaluated and analyzed under four cases 1) with uniform average delayrates, 2) with different average delay rates, 3) with combinations of differentaverage delay rates and 4) with different threshold values.
As expected, when the delay between information sources and informa-tion user is uniform, the information source (thermocouple,ρ = 0.05mV /◦C)which has lowest sensitivity is selected the most. This is because it has theleast λ associated to it. This is seen from Figure 7.5. But in reality, wheninformation sources are deployed in different locations and separated by dif-ferent number/kinds of intermediate networking devices, their delays will notbe uniform since they take different routes. Therefore, the scenario shown inFigure 7.5 represents a very specific case. So in order to get a clear picture on

120 Chapter 7
Figure 7.5: Source selection scenario at λ1 from Table 7.2 with uniform delay rate ofν = 0.5.
how the selection of information sources would be in real scenario, differentdelay rates are used for each information source and the resulted informationsource selection observation is shown in Figure 7.6
Contrary to Figure 7.5, where the selection of information sources aremainly decided by the event rate, Figure 7.6 shows that the selection of in-formation sources are greatly influenced by the network conditions betweeneach source and the information user. Consider a case where the informationmismatch probability is not known. Which information source can be cho-sen? To choose among many information sources would be very difficult andselection is not necessarily the one which has the lowest delay (Thermistorsensor- which actually gives worse information reliability, generally due toits higher value of sensitivity). Therefore, when the decision is affected bycombinations of different network parameters, mismatch probability playsan important role in deciding the selection of the most reliable informationsource and the requirement of an algorithm such as this is felt in such situa-tions.
The delay rates in a particular access route may not remain same allthe time. So, investigations on how different delay rates do impact on theselection of information sources are presented here. Figure 7.7 shows howinformation sources are selected with combinations of different average delayrates between each information source. The corresponding plot for averagemismatch probability variations with combinations of different average delayrates is shown in Figure 7.8
From Figure 7.7, it is observed that at ν1, thermistor sensor is selectedabout 420 out of 5000 samples. And integrated silicon sensor is selectedabout 2000 out of 5000 samples. Similarly, other two sensors are also se-

7.4 Evaluation and Analysis 121
Figure 7.6: Source selection with different average delay rates (ν4) from Table 7.3 andwith λ1 from Table 7.2.
Figure 7.7: Information source selection scenario with combination of different delay ratesfrom Table 7.3 with λ1 as shown in Table 7.2.
lected for some runs. Now look at the corresponding mismatch probabilityplot in Figure 7.8, it shows that at ν1, integrated silicon sensor has the lowestmismatch probability. Without this information dynamic source selection al-gorithm, one would never pick up alternative sensors for the best informationreliability. This would land up picking one particular sensor for all samplesas shown in Figure 7.9 where at ν1 integrated silicon is chosen for all 5000samples, and from ν2 onwards platinum RTD is chosen for all 5000 samples.
The scenario such as shown in Figure 7.9 is based on static setting,where selection is based on average mismatch probability. Such static set-ting algorithm, where event rates and delay rates are kept static (keepingsame for all 5000 samples) would land up using the resources of one sourceextensively while others are never being used at all. Therefore, by using theproposed dynamic information source selection algorithm, which is based

122 Chapter 7
Figure 7.8: Mismatch probability variation with combination of different delay rates fromTable 7.3 with λ1 as shown in Table 7.2.
Figure 7.9: Information source selection variation based on average mismatch probability(w.r.t. Figure 7.8) with different average delays rates shown in Table 7.3.
on the information dynamics and access delays (which change over time),it is possible to select information source which gives the best informationreliability.
Although, the mismatch probability plot shown in Figure 7.8 is basedon average, which means at some runs, the mismatch probability becomeslower than the average while at some runs it becomes higher than the aver-age. However, if one compares frequency of source selection plot in Figure7.7 and mismatch probability plot in Figure 7.8, one will observe that thesensor which has lowest average mismatch probability value is selected themost. In particular, at ν1 integrated silicon sensor is selected the most as ithas the lowest mismatch probability value, and so on and so forth with themost frequently selected ones. But one should remember at this point thatthose different values of ν represent different network conditions. Therefore,slightly after ν2 in Figure 7.7, it is observed that the frequency of selection of

7.4 Evaluation and Analysis 123
integrated silicon sensor drops unlike other sensors. This is because the de-lay for integrated silicon sensor degrades relatively faster than the others (seealso Table 7.3). At ν6, a different behaviour is observed, where the thermis-tor sensor is selected more frequently than the integrated silicon, althoughthe mean mismatch probability of thermistor is greater than the integratedsilicon. This clearly shows that the decision of selection of particular informa-tion source is not decided solely by the average mismatch probability valuesor any single network parameter for that matter, but by the combinations ofdifferent parameters. Therefore, it depends on individual scenario, which isoften decided by the information dynamics and network delays.In order to investigate whether the different values of temperature change
Figure 7.10: Information source selection scenario with combination of different delay ratesfrom Table 7.3 with λ2 as shown in Table 7.2.
Figure 7.11: Mismatch probability variation with combination of different delay rates fromTable 7.3 with λ2 as shown in Table 7.2.
rate (φ) has any impact on the frequency of selection, a similar study is done

124 Chapter 7
by taking different values of φ = 0.03◦C/sec. The corresponding values ofevent rate for each sensor are shown as λ2 in Table 7.2.
As expected, information source selection decision is not affected byusing different value of φ. This can be observed by comparing Figure 7.10with Figure 7.7. However, average information mismatch probabilities haveimproved. This is due to the decrease in event rate (λ) as a result of decreasein φ value. This observation can be seen from Figure 7.11.As shown in Figure 7.3, different threshold values impact information mis-
Figure 7.12: Information source selection scenario with combination of different delay ratesfrom Table 7.3 with λ3 as shown in Table 7.2.
match values as event rate depends on the value of threshold chosen. Inorder to investigate if the threshold value chosen has any impact on the in-formation source selection decision, a similar set of study is presented hereas above but using different threshold value (threshold = 1mV ) as reflectedin Table 7.2.Figure 7.12 shows the information source selection variation based on net-
work condition shown in Table 7.3. Figure 7.13 shows the correspondinginformation mismatch probability variation. Comparing Figure 7.7 and Fig-ure 7.12, it is observed that these two results are more or less same; therebyshowing that the information source selection decision is not affected byusing different threshold values. However, as expected the information mis-match probability values are affected. This can be seen by comparing Figure7.8 (threshold = 2mV ) and Figure 7.13 (threshold = 1mV ). Informationreliability in terms of mismatch probability decreases with lower values ofthresholds and this is also observed in Figure 7.4.
Similarly, investigation is done by using λ4 as event rate. The resultsare shown in Figure 7.14 and Figure 7.15. Comparing Figure 7.14 and Figure7.10, here also it is observed that the threshold value chosen does not have

7.4 Evaluation and Analysis 125
Figure 7.13: Mismatch probability variation with combination of different delay rates fromTable 7.3 with λ3 as shown in Table 7.2.
Figure 7.14: Information source selection scenario with combination of different delay ratesfrom Table 7.3 with λ4 as shown in Table 7.2.
any impact on information source selection decision. Same observation ismade on the impact on mismatch probability values. These can be seen bycomparing Figure 7.11 with Figure 7.15.
If you compare all the results, with respect to information source se-lection verses different average delay rates, the frequency of selection of par-ticular information source is same for all the cases, irrespective of differentevent rate and different threshold values being used. This shows that the pro-posed dynamic information source selection algorithm selects the informationsource with the best mismatch probability as per the network conditions andinformation dynamics.
The selection of information source can be done based on lowest eventrate (λ) or highest delay rate (ν) in addition to selection based on informationmismatch probability (which takes into account both λ and ν) describedSection 7.4. The Algorithm 7.1 can be modified to set the criteria of selection

126 Chapter 7
Figure 7.15: Mismatch probability variation with combination of different delay rates fromTable 7.3 with λ4 as shown in Table 7.2.
to lowest λ or highest ν. This section provides a comparative study on thefollowing three types of selection methods:
1. Selection based on lowest mean delay (highest delay rate (ν))
2. Selection based on lowest event rate(λ)
3. Selection based on lowest information mismatch probability (mmPr)
Table 7.4: Parameters used for performance comparisons of selections methods.
CasesPara-meter
SourceA
SourceB
SourceC
SourceD
Iλ 0.1 0.2 0.3 0.4ν 4.0 3.0 2.0 1.0
IIλ 0.4 0.3 0.2 0.1ν 1.0 2.0 3.0 4.0
IIIλ 0.1 0.2 0.3 0.4ν 1.0 2.0 3.0 4.0
IVλ 0.4 0.3 0.2 0.1ν 4.0 3.0 2.0 1.0
In order to show the performance comparison among different infor-mation source selection methods, three cases with different values of eventrate (λ) and delay rate (ν) are used as shown in Table 7.4. Figure 7.16(a)to Figure 7.17(a) show the performance (information mismatch probability)comparison of different selection methods for three different cases.

7.4 Evaluation and Analysis 127
(a)
(b)
Figure 7.16: Performance comparisons for different selection methods for different casesas shown in Table 7.4, a) Case I b) Case II
In Case I, as expected, the mismatch probability values increases mov-ing from source A to source D. This is because the values of λ increaseswhile value of ν decreases (refer Table 7.4, which results in increasing mis-match probability for all the three selection methods.This is shown in Figure7.16(a). When selection is made based on lowest value of λ, the mismatchprobability mainly influenced by value of ν. Similarly, when the selection isbased on highest value of ν, the mismatch probability is mainly influenced byλ. Since both the parameters are set such that they have negative (mismatchprobability increases) impact mismatch probability, the mismatch probabil-ity resulted due to selection based on mismatch probability also show anincrease in mismatch probability value as it moves from source A to sourceD.
In Case II, the values of λ is set so that it increases from source A tosource D, whereas values of ν are set such that it increases from source A to

128 Chapter 7
source D (refer Table 7.4). So this results in decrease in mismatch probabilityas it moves from source A to source D irrespective of selection methods beingused.This is shown in Figure 7.16(b). This is due to decrease in event rate(λ)and decrease in delay rate(ν) from source A to source D.
(a)
(b)
Figure 7.17: Performance comparison for different selection methods for different cases asshown in Table 7.4, a) Case III b) Case IV
In Case III, both the values of λ and ν are set such that they bothincrease from source A to source D. As explained in case I, the mismatchprobability value (where the selection is based on highest value of ν) increases,this is due to increase in λ, which has greater impact on mismatch probabilityas seen from Case IV. In case of selection based on lowest of λ, the mismatchprobability decreases. This is due to an increase in ν. However, this resultmay change as per the values chosen for λ and ν. Since these two parametersare such that, they influence the mismatch probability in different directions(meaning when λ increases, mismatch probability increases, whereas when νincreases, mismatch probability decreases), the mismatch probability value

7.5 Conclusions 129
for selection based on lowest mismatch probability will either increase ordecrease as per the values of λ and ν. This is shown in Figure 7.17(a).
In case IV, both the values of λ and ν are set such that they bothdecrease from source A to source D. As expected, mismatch probability de-creases in case of selection based on highest value of ν while it increases incase of selection based on lowest value of λ. This is shown in Figure 7.17(b).Comparing Figure 7.17(b) with Figure 7.17(a), it is learnt that λ has moreinfluence on mismatch probability than ν. That is why, the mismatch prob-ability in case of selection based on lowest mismatch probability decreases inCase IV.
For all cases, the selection method which is based on mismatch proba-bility gives better information reliability compared to other two methods.
7.5 Conclusions
In this chapter, a dynamic information source selection algorithm ispresented, which selects the information source which gives the best mis-match probability. To conclude this chapter, the main lessons learnt arelisted here:
• By using the information mismatch probability as information reliabil-ity parameter, the proposed algorithm was found to be useful in makingdecision which information source to use in an otherwise difficult deci-sion scenario. Without the mismatch probability metric, it would bedifficult to determine which information source to use, and for variousdelay and event rates (λ).
• The strength of the algorithm was tested by setting different mean net-work delay rates (making scenarios difficult for selection), and lettingthe algorithm decide which information source to use. This can beseen from Section 7.4, where algorithm chooses the information sourcewhich gives the best mismatch probability.
• This type of algorithm is required and essential, since static setting isnot useful (as shown from Figure 7.7 as it tends to extensively use par-ticular information source thereby using the resources of the particularsource heavily. Moreover, the selection decision is not considering theinformation dynamics which has impact on information reliability.
• The consistency and reliability of the algorithm is tested by using differ-ent parameters like different values of thresholds, event rates (λ). The

130 Chapter 7
results with regards to selection decision were found to be consistentwith different threshold and λ values.
• A comparative study of information source selection based on lowestevent rate (λ), highest delay rate (ν), and based in lowest mismatchprobability value was carried out. It is found out that the selectionbased on mismatch probability gives better information reliability interms of mismatch probability.
• It was observed that the event rate(λ) influences mismatch probabilitymore than the mean delay rate(ν). Therefore, the information dynam-ics at source has greater impact on information reliability in terms ofinformation mismatch probability.
• With the help of the proposed dynamic information selection algorithmit was possible to select alternative information source depending onthe information dynamic element at source and network delay betweensource and the destination.
Although, the proposed algorithm was found to be useful for making se-lection decision in an otherwise difficult decision scenario compare to staticsettings, however, it deserves further study to investigate the relationshipbetween average mismatch probability and the selection frequency. In thischapter, the proposed algorithm is implemented only with reactive informa-tion access strategy. Therefore, implementation under periodic and hybridinformation access strategies could be explored in order to investigate if theyshow any different result with regard to information source selection.

Chapter 8
Conclusions and Outlook
This chapter revisits some of the main points which were studiedin this thesis. In particular this chapter contains following threesections:Reflections- A brief recapture of the whole thesis is provided inthis section by revisiting the main points and reflecting on howthe study was carried out.Concluding Remarks- In this section, the main findings and con-tributions of the study are provided. The main purpose of thissection is to revisit the research objectives defined in the begin-ning of the thesis and to reflect back on the findings to see if theobjectives are fulfilled.Outlook and Future Directions- This section brings out some ofthe opinions of the author on the topic. It also gives some futuredirections, should there be any researcher inspired from this workand wishing to carry on further research on this topic.
131

132 Chapter 8
8.1 Reflections
One cannot avoid remotely accessing to dynamically changing informa-tion elements and it has become a required functionality with various networkservices. One common problem to remotely accessing such information ele-ment is the high probability of using incorrect information in making decisionat the user end. This problem becomes more challenging with some sensornetwork applications like safety monitoring, where using wrong informationhave severe impact on the action taken based on the decision. In order tosupport design decision, it is essential to know the characteristics featuresof dynamic information elements and how they affect the information reli-ability. Therefore, in order to study the behaviour of dynamic informationelement with regard to information reliability, it is essential that there is aninformation management framework which catches dynamic information pa-rameters. Generally, when the sensors are used to collect information from ahostile environment, an efficient usage of their battery power is utmost im-portant in order not to reduce the lifetime of the network. Therefore, in thisthesis, comprehensive studies on information accessing to remote dynamicinformation sources are made. A brief revisit of what each main chapter wasall about is provided here.
Chapter 3 provided basic models with respect to information accessto a dynamic information sources. It was a foundation chapter, which in-troduced the basic fundamentals with regard to information access model,which were investigated and used in later chapters. The chapter describeda general information access model bringing out three types of informationaccess strategies; reactive, periodic and hybrid. Following the description ofinformation access model, a brief study on an event process and detectionwas carried out as it was necessary to investigate how events are detected andprocessed by a sensor node. Lastly, the chapter presented a general powerconsumption model, which was one of the main focus areas in this study.
Chapter 4 presented a dynamic and reliable information accessing andmanagement framework. The framework was developed using Java-basedframework called OSGi, which has capability of providing an environmentfor modularization of applications and services. The developed frameworkfacilitated in studying the behaviour of dynamic information elements, whichwere useful for designing adaptive information access mechanism and infor-mation source selection algorithms in later chapters. The working of theframework was evaluated by estimating the information mismatch probabil-ity for three different access strategies discussed in Chapter5.
Chapter 5 presented a comprehensive study on information mismatch

8.2 Concluding Remarks 133
probability models and power consumption models under different informa-tion access strategies. The analytical mismatch probability models defined in[6] were extended by reshaping to a sampling process by reducing otherwiseincluded network delay into a deterministic zero delay. Analytical investiga-tions on how dynamic information elements affect the information mismatchprobability and power consumption were done with respect to all the threeinformation access strategies.
Chapter 6 presented an information access mechanism which managesinformation reliability and power consumption based on the requirement ofthe application. In particular, an adaptive information access mechanismby way of finding trade-off point between information reliability and powerconsumption was provided.
Chapter 7 presented a dynamic information source selection algorithm.The algorithm was implemented and evaluated using the framework devel-oped in Chapter 4. The algorithm was developed using mismatch probabilityas a metric to decide the selection decision. As this metric is a combination ofdifferent dynamic information elements, the algorithm was found to be usefulin selecting the information source that gives the best information reliabilitycompare to static setting selection method.
8.2 Concluding Remarks
An OSGi based dynamic and reliable information accessing and man-agement framework was developed. The framework was used to study the dy-namic behaviour of information, in relation to wireless sensor networks. Theflexible and easy reconfigurable property that OSGi provides made the frame-work to be dynamic which facilitated in studying the dynamic characteristicsand features of information collected by wireless sensors. By monitoring theinformation dynamics at source and the access delay between informationsource and the information user, the information mismatch probability, ametric that was used to measure information reliability was estimated. With-out this type of framework, an estimation of information mismatch proba-bility was not possible, unless one resort to compute mathematically. Theusefulness of information reliability metric (mismatch probability) was shownthroughout the thesis.
A comprehensive study on power consumption and information mis-match probability in relation to information access strategies; reactive, pe-riodic and hybrid was carried out. Based on this study, an extension to themismatch probability models defined in [6] were provided. For all the threeaccess strategies, it was observed that the information mismatch probabil-

134 Chapter 8
ity was affected by the rate at which the information is generated at thesource, rate at which the information is being sampled and the access delayor end-to-end delay between the information source and the information user.Furthermore, it was found out that the information mismatch probability wasalso impacted by the way how information is being accessed; meaning whichinformation access strategy is used. Using the same parameters settings, theinformation mismatch probability under hybrid access strategy was observedto be always greater than the other two. This observation was expected asthe processing delay introduced for checking for an update adds to the ac-cess delay. Comparing between reactive and periodic access strategy, reactivewas found to be suffering in terms of mismatch probability. Regarding onthe impact of information access strategy on power consumption, the hybridaccess showed advantages over the other two. Although, the advantages overreactive access depends on the ratio between the information access rate (µ)and the information update rate (τ ′), but the power consumption by usingthis access strategy was always less than that periodic access. As the highestupdate rate(τ ′) can go up to the sampling rate, the maximum power thathybrid access strategy has to spent will be always less than or equal to thepower that has to spent with periodic access.
As a result of the comprehensive study done on power consumption andmismatch probability, an adaptive information access mechanism to dynamicinformation sources was presented. It was interesting to learn that informa-tion access can be adapted as per the level of requirement and the availableresources. For instance, the information reliability requirements in terms ofinformation mismatch probability could be maintained by varying samplingrate. In addition, it was also found out that by increasing the informationsampling rate expecting gain in information reliability had huge impact onpower consumption. This study presented a trade-off point between informa-tion reliability and power consumption at which an increase in informationsampling rate did not have significant improvement on information reliabilitybut had huge increase in power consumption. Therefore, it was learnt thatit is important to find a trade-off between gains in one parameter at the costof other.
The usefulness of mismatch probability metric had shown when it cameto the design of a dynamic information source selection algorithm. As mis-match probability depends on the dynamic information elements like eventrate and access delays, the metric was used for making decision on infor-mation source selection. It was demonstrated that the presented algorithmcould select the information source which gives the best information mis-match probability in an otherwise difficult situation. Although, the obser-vation was restricted to the assumption that the delays are exponentially

8.3 Outlook and Future Directions 135
distributed, the algorithm’s ability to select which information source to useamong the different information sources having different network conditions,showed its strength.
8.3 Outlook and Future Directions
Dynamic and reliable information accessing and management frame-work presented in this thesis was developed with an objective to study thebehaviour of dynamic information elements. To develop such a frameworkand to evaluate it, it was found that, one needs to know how the character-istic features of dynamic information elements. Modeling information sourcethat mimics dynamic information elements was found to be not a trivial task.However, with the help of an OSGi framework, which supports modularitywith dynamic and flexible reconfigurable properties facilitated in modelingthe information source which emulates dynamic information elements. Whilestudying the dynamic information element’s behaviour, both analytical andwith the help of the framework, the end-to-end delay distribution consideredwas simple exponential distribution. This is a worst case scenario and furtherstudy considering different distributions would be one of the future directionsthat need to mention here.
The process of event generation and detection done in this study wasnot meant for vigorous mathematical analysis. However, there is a possi-bility of making in depth study so as to get the clear picture how dynamicinformation changes its behaviour in changing time and environment.
The information source selection algorithm presented in this thesis se-lects the source which gives the best information mismatch probability. Do-ing so, the framework needs to compute information mismatch probabilitymetric for each access made by the information user. The time required tocompute this metric will also add to the end-to-end delay. Although, it wasnot considered in this study, however, this will have impact on the resourceslike power usage. Therefore, a novel way to estimate mismatch probabilitywithout the need of computation would give better performance. One pos-sible future direction in this regard is to estimate the ratio between rate ofinformation generation and rate of delay for each source and study at whichpoint the dynamic switching of information source is taking place. However,it would not be trivial as it also depends on the rate at which information issampled, which in turn is decided by the power consumption limit.

136 Chapter 8

Bibliography
[1] C. Maple, G. Williams, and Y. Yue, “Reliability, availability and securityof wireless networks in the community,” Informatica, vol. 31, pp. 201–208, 2007.
[2] D. Geogoulas and K. Blow, “Wireless sensor network management andfunctionality: An overview,” Wireless Sensor Network, vol. 1, no. 4, pp.257–267, 2009.
[3] WZ Song, R. Huang, M. Xu, A. Ma, B. Shirazi, and R. LaHusen, “Air-dropped sensor network for real-time high-fidelity volcano monitoring,”in In Mobisys’09, 2009, pp. 305–318.
[4] Y. Yu, LJ Rittle, V. Bhandari, and JB LeBrun, “Supporting concur-rent applications in wireless sensor networks,” in Proceedings of the 4thinternational conference on Embedded networked sensor systems, 2006,pp. 139–152.
[5] Yunbo Wang, M. C. Vuran, and S. Goddard, “Cross-layer analysis of theend-to-end delay distribution in wireless sensor networks,” Networking,IEEE/ACM Transactions on, vol. 20, no. 1, pp. 305–318, 2012.
[6] M. Bogsted, RL Rasmus, and HP Schwelfel, “Probabilistic models foraccess strategies to dynamic information elements,” Performance Eval-uation, vol. 67, pp. 43–60, 2010.
[7] Open Service Gateway Initiative, “About the osgi alliance,” Available:http://www.osgi.org, accessed on 11-Dec-2010.
[8] Kemal Akkaya and Mohamed Younis, “A survey on routing protocols forwireless sensor networks,” Ad Hoc Networks, vol. 3, no. 3, pp. 325–349,5 2005.
137

138 Bibliography
[9] Marcos A. M. Vieira, Adriano B. da Cunha, and Diogenes C. da Silva,“Designing wireless sensor nodes,” in Proceedings of the 6th interna-tional conference on Embedded Computer Systems: architectures, Mod-eling, and Simulation, Berlin, Heidelberg, 2006, SAMOS’06, pp. 99–108,Springer-Verlag.
[10] I. F. Akyildiz, W. Su, Y. Sankarasubramaniam, and E. Cayirci, “Wire-less sensor networks: a survey,” Computer Networks, vol. 38, no. 4, pp.393–422, 3/15 2002.
[11] T. Ahonen, R. Virrankoski, and M. Elmusrati, “Greenhouse monitoringwith wireless sensor network,” in Mechtronic and Embedded Systems andApplications, 2008. MESA 2008. IEEE/ASME International Conferenceon, 2008, pp. 403–408.
[12] N. Artim, An Introduction to Fire Detection, Alarm, and AutomaticFire Sprinklers, 2007.
[13] AJ Garcia-Sanchez, F. Garcia-Sanchez, F. Losilla, P. Kulakowski,J. Garcia-Haro, A. Rodrguez, JV Lpez-Bao, and F. Palomares, “Wire-less sensor network deployment for monitoring wildlife passages,” Sen-sors, vol. 10, pp. 7236–7262, 2010.
[14] J. Lloret, M. Garcia, D. Bri, and S. Sendra, “A wireless sensor networkdeployment for rural and forest fire detection and verification,” Sensors,vol. 9, pp. 8722–8747, 2009.
[15] Y. Hao and R. Foster, “Wireless body sensor networks for health-monitoring applications,” Physiological Measurement, vol. 29, no. 11,pp. R27–56, 2008.
[16] Liang Cheng and S. N. Pakzad, “Agility of wireless sensor networksfor earthquake monitoring of bridges,” in Networked Sensing Systems(INSS), 2009 Sixth International Conference on, 2009, pp. 1–4, ID: 1.
[17] J. Lester Hill, “System architecture for wireless sensor networks,” Uni-versity of California, Berkeley, 2003.
[18] B. R. Shrestha and P. Manandhar, “Monitoring glacial lake inhimalayas through sensor and wireless technology,” Available:http://www.apan.net/meetings/kualalumpur2009/proposals/Agriculture/,2009.

139
[19] A. Majeed and T. A. Zia, “Multi-set architecture for multi-applicationsrunning on wireless sensor networks,” in Advanced Information Net-working and Applications Workshops (WAINA), 2010 IEEE 24th Inter-national Conference on, 2010, pp. 299–304.
[20] S. Bandyopadhyay and E. J. Coyle, “An energy efficient hierarchicalclustering algorithm for wireless sensor networks,” in INFOCOM 2003.Twenty-Second Annual Joint Conference of the IEEE Computer andCommunications. IEEE Societies, 2003, vol. 3, pp. 1713–1723 vol.3.
[21] V. P. Mhatre, C. Rosenberg, D. Kofman, R. Mazumdar, and N. Shroff,“A minimum cost heterogeneous sensor network with a lifetime con-straint,” Mobile Computing, IEEE Transactions on, vol. 4, no. 1, pp.4–15, 2005.
[22] I. F. Akyildiz, T. Melodia, and K. R. Chowdhury, “A survey on wirelessmultimedia sensor networks,” Computer Networks, vol. 51, pp. 921–960,2007.
[23] E. J. Duarte-Melo and Mingyan Liu, “Analysis of energy consump-tion and lifetime of heterogeneous wireless sensor networks,” in GlobalTelecommunications Conference, 2002. GLOBECOM ’02. IEEE, 2002,vol. 1, pp. 21–25 vol.1.
[24] Song Guo, Chunxia Fan, and T. D. C. Little, “Supporting concurrenttask deployment wireless sensor networks,” in Network Computing andApplications, 2008. NCA ’08. Seventh IEEE International Symposiumon, 2008, pp. 111–118.
[25] D. Lagutin, “Data dissemination and gathering in sensor net-works,” Available: http://www.tcs.hut.fi/Studies/T-79.7001/2007SPR,accessed on 11-Dec-2012.
[26] S. K. Singh, M. P. Singh, and D. K. Singh, “Routing protocols inwireless sensor networks- a survey,” International Journal of Scienceand Engineering Survey (IJCSES), vol. 1, no. 2, 2010.
[27] A. K. Dwivedi and O. P. Vyas, “Network layer protocols for wirelesssensor networks: Existing classifications and design challenges,” Inter-national Journal of Computer Applications., vol. 8, no. 12, pp. 30–34,2010.
[28] D. Chu, A. Deshpande, J. M. Hellerstein, and Wei Hong, “Approxi-mate data collection in sensor networks using probabilistic models,” in

140 Bibliography
Data Engineering, 2006. ICDE ’06. Proceedings of the 22nd Interna-tional Conference on, 2006, pp. 48–48.
[29] N. Bulusu, J. Heidemann, and D. Estrin, “Gps-less low-cost outdoorlocalization for very small devices,” Personal Communications, IEEE,vol. 7, no. 5, pp. 28–34, 2000.
[30] J. N. Al-Karaki and A. E. Kamal, “Routing techniques in wireless sensornetworks: a survey,” Wireless Communications, IEEE, vol. 11, no. 6,pp. 6–28, 2004.
[31] T. P. Lambrou and C. G. Panayiotou, “A survey on routing techniquessupporting mobility in sensor networks,” in Mobile Ad-hoc and SensorNetworks, 2009. MSN ’09. 5th International Conference on, 2009, pp.78–85.
[32] V. Biradar Rajashree, V. C. Patil, S. R. Sawant, and R. R. Mudholkar,“Classifications and comparisons of routing protocols in wireless sensornetworks,” Special Issue on Ubiquitous Computing Security Systems,pp. 704–711.
[33] M. Younis, M. Youssef, and K. Arisha, “Energy-aware routing in cluster-based sensor networks,” in Modeling, Analysis and Simulation of Com-puter and Telecommunications Systems, 2002. MASCOTS 2002. Pro-ceedings. 10th IEEE International Symposium on, 2002, pp. 129–136.
[34] W. Heinzelman, A. Chandrakasan, and H. Balakrishnan, “Energy-efficient communication protocol for wireless microsensor networks,” inProceedings of the 33rd Hawaii International Conference on System Sci-ences(HICSS’00), 2000.
[35] W. Heinzelman, J. Kulik, and H. Balakrishnan, “Adaptive protocolsfor information dissemination in wireless sensor networks,” in MobiCom’99 Proceedings of the 5th annual ACM/IEEE international conferenceon Mobile computing and networking, 1999, pp. 174–185.
[36] K. Sohrabi, J. Gao, V. Ailawadhi, and G. J. Pottie, “Protocols for self-organization of a wireless sensor network,” Personal Communications,IEEE, vol. 7, no. 5, pp. 16–27, 2000.
[37] M. Bauer, R. L. Olsen, M. Jacobsson, L. Sanchez, J. Lanza, M. Imine,and N. Prasad, “Context management framework for magnet and be-yond,” in In Workshop on ”Capturing Context and Context Aware Sys-tems and Platforms”, Proceedings of IST Mobile and Wireless Summit.,2006.

141
[38] L. Sanchez, J. Lanza, R. Olsen, M. Bauer, and M. Girod-Genet, “Ageneric context management framework for personal networking envi-ronments,” in Mobile and Ubiquitous Systems: Networking and Services,2006 Third Annual International Conference on, 2006, pp. 1–8.
[39] Yongkai Zhan, Shuangquan Wang, Zhuang Zhao, Canfeng Chen, andJian Ma, “A mobile device oriented framework for context informa-tion management,” in Information, Computing and Telecommunication,2009. YC-ICT ’09. IEEE Youth Conference on, 2009, pp. 150–153.
[40] W3C, “Resource description framework (rdf) schema specification,”Available: http://www.w3.org/TR/2000/CR-rdf-schema-20000327/,2000, accessed on 11-Feb-2013.
[41] Jun-Hong Lu, Chiung-Ying Wang, and Ren-Hung Hwang, “An openframework for distributed context management in ubiquitous environ-ment,” in Ubiquitous, Autonomic and Trusted Computing, 2009. UIC-ATC ’09. Symposia and Workshops on, 2009, pp. 88–93.
[42] UPnP, “Upnp forum,” http://www.upnp.org, accessed on 11-Feb-2013.
[43] M. Venkataraman, M. Chatterji, and M. Kwiat, Dynamic RoutingFramework for Wireless Sensor Networks, In Tech, yen kheng tan edi-tion, 2010.
[44] V. Sachidananda, A. Khelil, and N. Suri, “Quality of information inwireless sensor networks:a survey.,” in In 15th International Conferenceon Information Quality (ICIQ 2010), 2010, pp. 193–207.
[45] R. L. Olsen, H. P. Schwefel, and M. B. Hansen, “Qrp01-5: Quantita-tive analysis of access strategies to remote information in network ser-vices,” in Global Telecommunications Conference, 2006. GLOBECOM’06. IEEE, 2006, pp. 1–6.
[46] H. P. Schwefel, M. B. Hansen, and R. L. Olsen, “Adaptive cachingstrategies for context management systems,” in Personal, Indoor andMobile Radio Communications, 2007. PIMRC 2007. IEEE 18th Inter-national Symposium on, 2007, pp. 1–6.
[47] A. Shawky, R. L. Olsen, J. Pedersen, and H. P. Schwefel, “Optimiz-ing the quality of dynamic context subscriptions for scarce network re-sources,” in Proceedings of the 1st European Workshop on AppRoachesto MObiquiTous Resilience, ARMOR ’12, 2012, pp. 6.1–6.6.

142 Bibliography
[48] Shaikh F. Karim, “Tunable reliability of information trans-port in wireless sensor networks,” Available: http://tuprints.ulb.tu-darmstadt.de/2184/, 2010.
[49] Kang Cai, Gang Wei, and Huifang Li, “Information accuracy versusjointly sensing nodes in wireless sensor networks,” in Circuits and Sys-tems, 2008. APCCAS 2008. IEEE Asia Pacific Conference on, 2008,pp. 1050–1053.
[50] J. Karjee and H. S. Jamadagni, “Data accuracy model for distributedclustering algorithm based on spatial data correlation in wireless sensornetworks,” CoRR, 2011.
[51] L.Lipsky, Ed., Querying Theory: A Linear Algebric Approach, McMillanand Company, New York, 1992.
[52] M.F.Neuts, Ed., Matrix-Geometric Solutions in Stochastich models: AnAlgorithmic Approach, John Hopkins, University press, Baltimore, 1981.
[53] P. Joseph, H. Jason, and C. David, “Versatile low power media accessfor wireless sensor networks,” in Proceedings of the 2nd internationalconference on Embedded networked sensor systems, 2004, pp. 95–107.
[54] J. S. Rellermeyer, G. Alonso, and T. Roscoe, “R-osgi: distributedapplications through software modularization,” in Proceedings of theACM/IFIP/USENIX 2007 International Conference on Middleware,2007.
[55] Q. Wang, “Traffic analysis and modeling in wireless sensor networksand their applications on network on network optimization and anomalydetection,” Network Protocols and Algorithms, vol. 2, no. 1, pp. 74–92,2010.
[56] S. Croce, F. Marcelloni, and M. Vecchio, “Reducing power consumptionin wireless sensor networks using a novel approach to data aggregation,”The Computer Journal, vol. 51, no. 2, pp. 227–239, 2007.
[57] H. Sabbineni and K. Chakrabarty, “Data collection in event drivenwireless sensor networks with mobile sinks,” International Journal ofDistributed Sensor Networks, 2010.
[58] D. Puthal, B. Sahoo, and S. Sahrma, “Dynamic model for efficient datacollection in wireless sensor networks with mobile sink,” InternationalJournal of Computer Science and Technology, vol. 3, no. 1, pp. 623–628,2012.

143
[59] Sakiko Kawai and Takuya Asaka, “Event-driven wireless sensornetworks using energy-saving data collection,” in Communications(APCC), 2012 18th Asia-Pacific Conference on, 2012, pp. 300–305.
[60] M. Chen and M. Fowler, “Data compression trade-offs in sensor net-works,” Proceedings of SPIE, 2004.
[61] N. Kimura and S. Latifi, “A survey on data compression in wirelesssensor networks,” in Information Technology: Coding and Computing,2005. ITCC 2005. International Conference on, 2005, vol. 2, pp. 8–13Vol. 2.
[62] Z. A. Baig, M. Baqer, and A. I. Khan, “Sgsia-in-network data pre-processing for secure grid-sensor integration,” in e-Science and GridComputing, 2006. e-Science ’06. Second IEEE International Conferenceon, 2006, pp. 160–160.
[63] Ming Xu, “Research and design of data preprocessing of wireless sensornetworks based on multi-agents,” in Network Infrastructure and Digi-tal Content, 2009. IC-NIDC 2009. IEEE International Conference on,2009, pp. 50–53.
[64] Haifeng Zheng, Shilin Xiao, Xinbing Wang, Xiaohua Tian, andM. Guizani, “Capacity and delay analysis for data gathering with com-pressive sensing in wireless sensor networks,” Wireless Communications,IEEE Transactions on, vol. 12, no. 2, pp. 917–927, 2013.
[65] A. Masoum, N. Meratnia, Z. Taghikhaki, and P. J. M. Havinga, “Rewardand punishment based cooperative adaptive sampling in wireless sensornetworks,” in Intelligent Sensors, Sensor Networks and InformationProcessing (ISSNIP), 2010 Sixth International Conference on, 2010, pp.145–150.
[66] R. Willett, A. Martin, and R. Nowak, “Backcasting: adaptive samplingfor sensor networks,” in Information Processing in Sensor Networks,2004. IPSN 2004. Third International Symposium on, 2004, pp. 124–133, ID: 1.
[67] A. Jain and E. Y. Chang, “Adaptive sampling for sensor networks,” inProceedings of the 1st international workshop on Data management forsensor networks: in conjunction with VLDB 2004, 2004, pp. 10–16.
[68] Microchips Technology Inc., “Temperature sensor products,” Available:http://www.microchip.com, accessed on 11-Feb-2013.

144 Bibliography
[69] OMEGA Engineering Inc., “Temperature sensors,” Available:http://www.omega.com/cservice/omeganet.html, accessed on 11-Dec-2011.
[70] Applied Sensor Technologies, “Innovation in temperature measure-ment,” Available: http://www.appliedsensortech.com/contact.htm, ac-cessed on 11-Feb-2013.
[71] B. Bonnie, “Temperature sensing technologies,” Available:http://www.microchip.com/stellent/idcplg, accessed on 11-Feb-2013.
[72] A. Hollinger, “Temperature sensing devices and opti-mization of temperature acquisition systems,” Available:http://sesnorwiki.org/doku.php/sesnors/temperature, accessed on11-Feb-2013.

List of Publications
1. Sonam Tobgay, Rasmus L. Olsen, Ramjee Prasad. “Architecture forrunning multiple applications on a single wireless sensor network: aproposal.” First International Conference on Advances in Computingand Communication, Kochi, India, Springer Verlag, 2011, p. 37-45
2. Sonam Tobgay, Rasmus L. Olsen, Ramjee Prasad. “Adaptive Infor-mation Access in Multiple Applications Support Wireless Sensor Net-work.” 8th International Symposium on Communication Systems, Net-works and Digital Signal Processing (CSNDSP),, Poznan, Poland, IEEEXplore, 2012, p. 1-4.
3. Sonam Tobgay, Rasmus L. Olsen, Ramjee Prasad. “The Effect of In-formation Access Strategy on Power Consumption and Reliability inWireless Sensor Network.” The 2nd IEEE International Conferenceon Parallel, Distributed and Grid Computing (PDGC’12)., Shimla, In-dia, IEEE Xplore, 2012, p. 325-330.
4. Sonam Tobgay, Rasmus L. Olsen, Ramjee Prasad. “Information SourceSelection and Management Framework in Wireless Sensor Networks.”Wireless Personal Multimedia Communications Symposium (WPMC’13),Princeton, USA, IEEE Xplore, 2013 (presented).
5. Sonam Tobgay, Rasmus L. Olsen, Ramjee Prasad. “Adaptive Infor-mation Access to Remote Dynamic Information Source.” Submitted toMediternean Journal of Computer Networks, SoftMoter Ltd, 2013.
145

146 Bibliography

Mapping of Published Paperswith Chapters
Paper NumberChapter Numbers
1 2 3 4 5 6 7 8
Paper 1 � � � X� � � X� �
Paper 2 � � X� � X� X� � X�
Paper 3 � � � � X� X� � X�
Paper 4 � � � X� � � X� X�
Paper 5 � � X� X� X� X� � X�
Note: X� indicates that the contents of the papers are included in thecorrsponding chapters.
147