dundas/dupont/annette intersection redesignthewestbend.ca/wp-content/uploads/2017/09/ddaowi... ·...
TRANSCRIPT
Dundas/Dupont/Annette Intersection Redesign University of Toronto
Prepared by: Nikola Kostic, Amy Wang, Adrian Cheung, Susan Lu, Yanbo Wang
4/1/15 West Bend Community
Association
Faculty of Applied Science and Engineering
Engineering Strategies and Practices
1
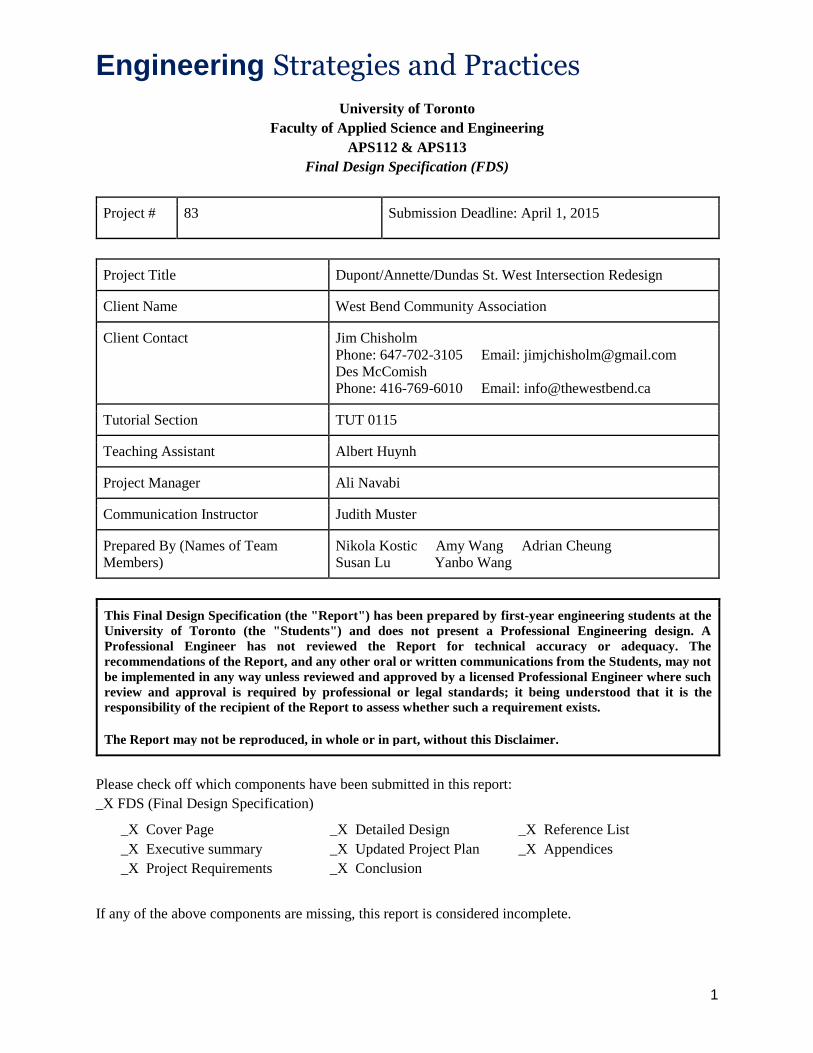
University of Toronto
Faculty of Applied Science and Engineering
APS112 & APS113
Final Design Specification (FDS)
Project # 83 Submission Deadline: April 1, 2015
Project Title Dupont/Annette/Dundas St. West Intersection Redesign
Client Name West Bend Community Association
Client Contact Jim Chisholm Phone: 647-702-3105 Email: [email protected] Des McComish Phone: 416-769-6010 Email: [email protected]
Tutorial Section TUT 0115
Teaching Assistant Albert Huynh
Project Manager Ali Navabi
Communication Instructor Judith Muster
Prepared By (Names of Team
Members) Nikola Kostic Amy Wang Adrian Cheung Susan Lu Yanbo Wang
This Final Design Specification (the "Report") has been prepared by first-year engineering students at the
University of Toronto (the "Students") and does not present a Professional Engineering design. A
Professional Engineer has not reviewed the Report for technical accuracy or adequacy. The
recommendations of the Report, and any other oral or written communications from the Students, may not
be implemented in any way unless reviewed and approved by a licensed Professional Engineer where such
review and approval is required by professional or legal standards; it being understood that it is the
responsibility of the recipient of the Report to assess whether such a requirement exists. The Report may not be reproduced, in whole or in part, without this Disclaimer.
Please check off which components have been submitted in this report:
_X FDS (Final Design Specification)
_X Cover Page
_X Executive summary
_X Project Requirements
_X Detailed Design
_X Updated Project Plan
_X Conclusion
_X Reference List
_X Appendices
If any of the above components are missing, this report is considered incomplete.

Engineering Strategies and Practices
2
Executive Summary
The current Dundas St. West/Dupont St./Annette St. intersection has failed to regulate modern traffic
flow safely and efficiently. Traffic is forced to make dangerous turns with no clear line of sight while
pedestrians and cyclists are made to compete with motorized vehicles for road space, producing a
dangerous, unwelcoming, stressful environment for users and local residents alike.
In order to succeed in moderate Canadian climatic conditions and amongst a large driving population
while addressing the charitable, economic, regulatory, and community concerns of NGOs, businesses,
municipal governments, and local residents, the design must perform the following main functions:
● separate and move mass
● control the safe passage of vehicles, cyclists, and pedestrians
● reroute traffic between 4 adjoining roads
Key design objectives include a low maintenance cost of $13,500/year and the causation of no more than
13.8 annual accidents while the strict limits the design must adhere to include:
➢ Cost less than $30 million
➢ Safely handle 29,392 vehicles and 1,962 pedestrians per day
➢ Abide to all relevant laws and bylaws imposed by governmental bodies
The engineering team has developed a proposed design which meets these requirements optimally:
Island Dugout Master Plan - digs a ramp through the central island, regularizes intersection
● gateway bridge constructed and park space expanded to attain aesthetic goals
● outstanding safety due to controlled separation of traffic but pedestrians, cyclists still
have to pass through underpass
The Island Dugout Design is a cost effective, safe, and accessible design. Total cost is estimated at
$608,000 with a total implementation time of just under 2 years. The intersection has been regularized to
a 64° intersect angle, with 4 lanes on all adjoining streets where they arrive at the central intersection.
Dupont progressively narrows to 2 lanes immediately before entering the underpass. Dedicated bike lanes
run East-West on Annette-Dupont and a sharrow exists Northbound on Dundas. Pedestrians and cyclists
are elevated above the road surface for the duration of the underpass. Traffic signal timing has been
optimized with a 154 second cycle length.
The design satisfies the vital regulations imposed by municipal zoning laws and the federal Highway
Traffic Act. Implementation is planned in accordance with the Environmental Protection Act. The
following tests are planned to ensure the design is safe and accessible for all users:
● Safety - water resistance test, bridge deck strength test, failure test of asphalt
● Accessibility - signal and marking in full ASTM D713-12 standard compliance, road surface
roughness test
● Durability - asphalt surface resistance test
Implementation of the design hinges on obtaining City of Toronto funding, performing a site survey,
excavating the island, filling the Dupont ramps, a detailed lane remarking and signal installation, gateway
bridge installation, and park expansion - all to ultimately increase community image and safety.
Engineering Strategies and Practices
3
TABLE OF CONTENTS
1.0 Project Requirements……………………………………………………4-9
1.1. Problem Statement…………………………………………………4
1.2. Stakeholders………………………………………………………..5
1.3. Functions…………………………………………………………...7
1.4. Objectives…………………………………………………………..7
1.5. Constraints………………………………………………………....7
1.6. Service Environment……………………………………………….8
1.7. Client Ethics and Values…………………………………………...9
2.0 Detailed Design…………………………………………………………....9-44
2.0.1. Introduction and Design Overview………………………...9
2.0.2. Lane Widths and Other Dimensions……………………….13
2.0.3. Satisfaction of Major Functions and Objectives…………..18
2.0.4. Objective Tradeoffs………………………………………..22
2.0.5. Traffic Signal Light System………………………………..23
2.0.6. Cost Estimate………………………………………………30
2.0.7. Conclusion…………………………………………………30
2.1. Regulations, Standards, and Intellectual Property………………...32
2.2. Testing……………………………………………………………...34
2.3. Implementation Requirements……………………………………...35
2.4. Life Cycle and Environmental Impact……………………………...37
2.5. Human Factors……………………………………………………..41
2.6. Social Impact……………………………………………………….41
2.7. Economics…………………………………………………………..42
3.0 Updated Project Management Plan……………………………………...44
4.0 Conclusion/Recommendation…………………………………………….45
5.0 Reference List……………………………………………………………...45
Appendices……………………………………………………………………55-76

Engineering Strategies and Practices
4
1.0 Project Requirements This project is intended to help the West Bend Community Association (WBCA) integrate the historically
industrial Dundas St. West/Dupont/Annette intersection into the modern West Bend community.
1.1. Problem Statement
The ability of Toronto’s Dundas St. West/Dupont/Annette (DDA) intersection to safely handle traffic is
compromised by irregular turns, steep inclines, and a lack of adequate lane separation [1][2].
Furthermore, narrow sidewalks and a stranded pedestrian island have made the intersection an obstacle to
foot traffic [3]. These unsafe conditions have resulted in 92 accidents over the last 4 years and decreased
residents’ confidence in neighbourhood safety [4][3].
The WBCA requires an intersection redesign that will regularize traffic flow and minimize accidents. The
design must process 2013.9 vehicles/hour and 134.8 pedestrians/hour and should accommodate users with
disabilities [5][6][7][8]. It must keep the number of collisions per year under 13.8 [4]. The design shall
preserve a maximal amount of green space and should incorporate existing infrastructure as much as
possible. The design must control traffic flow and optimize the passage of vehicles, pedestrians and
cyclists. The design must also channel this mass without impeding movement of pedestrians. Mass must
be moved without experiencing any plastic deformation.
Fundamentally, the design must separate and move mass, allowing for the free and safe movement of
people and their vehicles.
Engineering Strategies and Practices
5
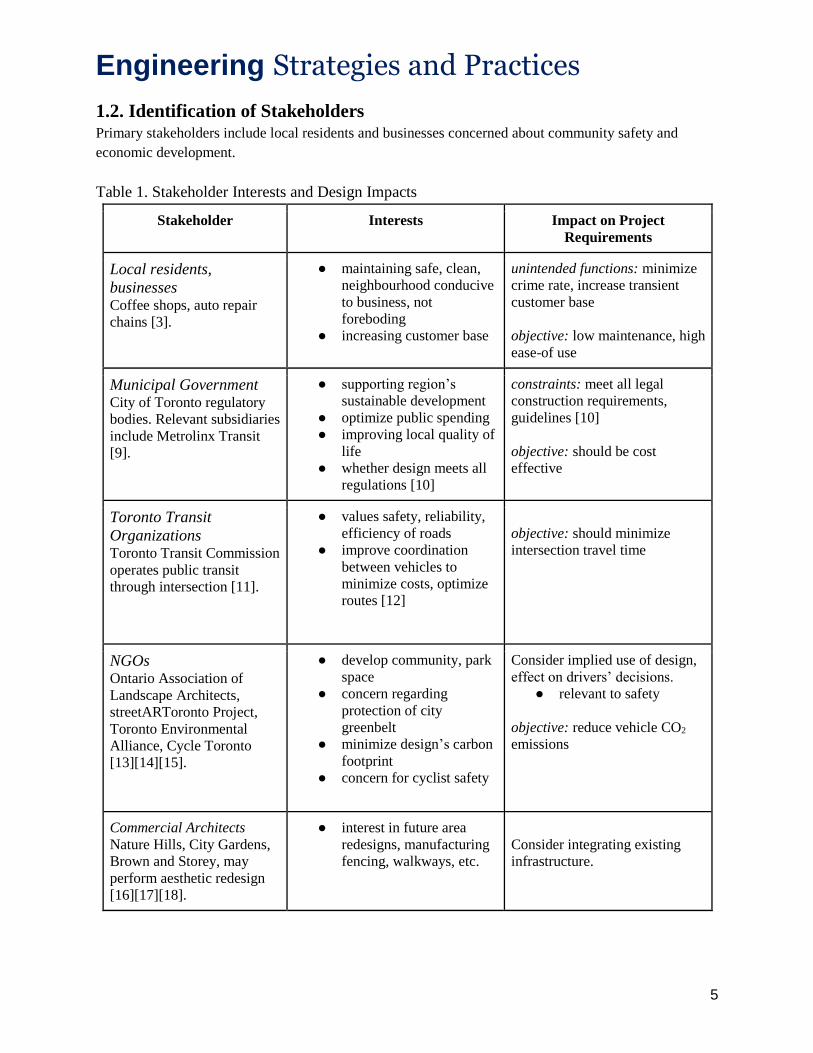
1.2. Identification of Stakeholders
Primary stakeholders include local residents and businesses concerned about community safety and
economic development.
Table 1. Stakeholder Interests and Design Impacts
Stakeholder Interests Impact on Project
Requirements
Local residents,
businesses
Coffee shops, auto repair
chains [3].
● maintaining safe, clean,
neighbourhood conducive
to business, not
foreboding
● increasing customer base
unintended functions: minimize
crime rate, increase transient
customer base objective: low maintenance, high
ease-of use
Municipal Government City of Toronto regulatory
bodies. Relevant subsidiaries
include Metrolinx Transit
[9].
● supporting region’s
sustainable development
● optimize public spending
● improving local quality of
life
● whether design meets all
regulations [10]
constraints: meet all legal
construction requirements,
guidelines [10] objective: should be cost
effective
Toronto Transit
Organizations
Toronto Transit Commission
operates public transit
through intersection [11].
● values safety, reliability,
efficiency of roads
● improve coordination
between vehicles to
minimize costs, optimize
routes [12]
objective: should minimize
intersection travel time
NGOs
Ontario Association of
Landscape Architects,
streetARToronto Project,
Toronto Environmental
Alliance, Cycle Toronto
[13][14][15].
● develop community, park
space
● concern regarding
protection of city
greenbelt
● minimize design’s carbon
footprint
● concern for cyclist safety
Consider implied use of design,
effect on drivers’ decisions. ● relevant to safety
objective: reduce vehicle CO2
emissions
Commercial Architects Nature Hills, City Gardens,
Brown and Storey, may
perform aesthetic redesign
[16][17][18].
● interest in future area
redesigns, manufacturing
fencing, walkways, etc.
Consider integrating existing
infrastructure.

Engineering Strategies and Practices
6
1.3. Functions
The main function is to move vehicles between adjoining roads. Listed below are functions the design
must perform (supporting functions included for clarity).
1.3.1. Functional Basis
The basic functionality is to separate mass (Appendix A).
1.3.2. Primary Functions
The design will perform the listed basic functions:
● channel movement of mass
○ connect adjoining roads
○ restrict movement to appropriate paths
● control safe passage of vehicles, pedestrians, cyclists
○ separate mass
○ regulate timing of movement of mass
● enable movement of pedestrians
○ receive input information on desired crossing time, location, destination
○ modify path
1.3.3. Secondary Functions
The design will have the following resultant functions:
● allow mass to enter and exit system
○ transport between adjoining roads
● deliver undamaged vehicles as an end product
○ personal vehicles, trucks, bicycles, persons
● channel accumulated rainwater and debris
1.3.4. Unintended Functions
The following functions exist unintentionally:
● lose energy to heat, sound, light
● increase area traffic density
○ improve area businesses’ customer base
■ increase number of passersby

Engineering Strategies and Practices
7
1.4. Objectives
The most important objective is safety, due to abnormally high accident rate, while ease-of-maintenance
ranks last (Appendix B).
Safe ● fewer than 13.8 accidents annually [4]
Should be accessible to pedestrians, cyclists, disabled
● should handle minimum of 72 cyclists/hour [2]
● handle at least 246 pedestrians/hour [22][5]
Cost-Effective
● should cost less than $19.7 million (Appendix C)[19]
○ minimal expropriation of private property [20]
○ reconstruction should last less than 1.3 years [21]
Durable
● should last minimum of 10 years without major repairs [23][24]
Easy to Maintain
● maintenance costs should not exceed $13,350/year (major repair costs exclusive)[4]
● spaces tidy, accessible: no debris, waste
Environmental Friendliness
● should minimize amount of waste produced
○ by pedestrians, motorized vehicles, nearby facilities
○ car exhaust generated should not exceed 612 kg/hr (Appendix D)[25]
● encourage growth of trees, greenery
○ minimum of 6 trees planted [26]
Harmony of Proportions
● open, welcoming design
● should encourage pedestrian use by optimizing space usage for safety
○ 26% of road space allotted to pedestrians [63]
1.5. Constraints
Key limits are a cost of $30 million and all Ontario Road Standards.
1. Total cost of implementation must be under $30 million [19].
2. Shall abide by city of Toronto by laws (Appendix E), including Pavement Structural Design
Guideline[27][28], Pavement Structural Design Matrix[30], Ontario Provincial Standards for
Roads and Public Works[31], Highway Traffic Act[32], Motor Vehicle Safety Act[33], and Motor
Vehicle Transport Act[34].
3. Must handle 29,392 vehicles and 1,962 pedestrians/day [22][7][8].
Engineering Strategies and Practices
8
1.6. Service Environment
Service environment is primarily characterized by a continental climate and a large local driving
population of 53,277.
Table 2. Virtual Environment
Virtual Environment Impact on Design
Traffic Flow ● Daily motorist, pedestrian volume:
29,392, 1962 respectively [22]
● 24 cyclists/hour [2]
-adjust directional
capacity for peak times
-separate vehicles
-accommodate parking
space
Traffic Signal Timing ● 110 second cycle length [34][35]
Accidents and Collisions ● 69 collisions over 4 year period from
June. 2010 to June. 2014 [34]
○ 2 collisions involved
pedestrians [34]
Number of local
businesses ● 6 in immediate proximity [2]
○ north and west side
Table 3. Physical Environment
Physical Environment Impact on Design
Climate ● Semi-continental climate
characterized by cold winters,
humid summers [36]
-protect road surface from
temperature changes
-channel rainwater runoff
-protect residential areas
from resultant pollution
Temperature ● Range -24.4 to 36.9℃ [37]
○ Average temperature
8.7℃ [37]
Precipitation ● Maximum 66.0mm/day [37]
● Snowfall maximum
30.6cm/day [37]
Humidity ● 47.9% maximum [37]
Air Quality ● 38 days moderate, 1 day poor
air quality per year [38]
Engineering Strategies and Practices
9
Table 4. Living Environment
Living Environment Impact on Design
Population Density ● 9.5k people/km2 [39]
-high median age -provisions for elderly
pedestrians
Demographics ● 0 - 14%: 12%
● 15 - 64%: 75%
● 65+: 13% [39]
Driving Population ● 1.4 drivers/household
○ 53,277 total
[5][6][40]
1.7. Client Ethics and Values
Ethical priorities focus on creating an open, friendly, safe neighbourhood.
The West Bend neighbourhood connects the east and west halves of old Toronto. As such, the WBCA
holds a fundamental interest in maintaining their neighbourhood’s status as gateway to the Junction-High
Park communities.
The design must include special considerations for local residents, including low emissions for local air
quality, maintaining a safe space for residents, and improving the area economy [41]. It should also be as
open and inviting to foot traffic as possible. This will ensure the WBCA’s image of an open, welcoming,
safe neighbourhood is preserved.
2.0 Detailed Design: Island Dugout Master Plan The Island Dugout Master Plan represents the optimal solution; it separates the flow of traffic while
maximizing accessibility and minimizing costs. This design regularizes the intersection, such that
different types of vehicles do not travel outside of their designated lane. It offers a high degree of safety
for pedestrians, cyclists, and drivers. By eliminating the need for bridges or roundabouts and integrating a
ramp into the very center of the intersection, the design also scores best in accessibility. Lastly, the design
does not require the construction of additional road surfaces other than a single dugout running through
the center of the island. This allows for a relatively low cost, easy to implement solution. Therefore, the
design delivers a balanced, optimized solution and satisfies all major functions and objectives.
2.0.1. Introduction and Design Overview
Design 1 focuses on updating old infrastructure into a simple, functional four-way intersection. Roads
split by the island are reconnected and a ramp is dug up through the center of the island to connect
Annette and Dupont.
● Reducing infrastructure into one central intersection simplifies routing for pedestrians,
bikers, and motorists
Engineering Strategies and Practices
10
● Ramp connecting Annette with Dupont enables regularization of intersection without
reducing it to a fully standard, unoriginal layout
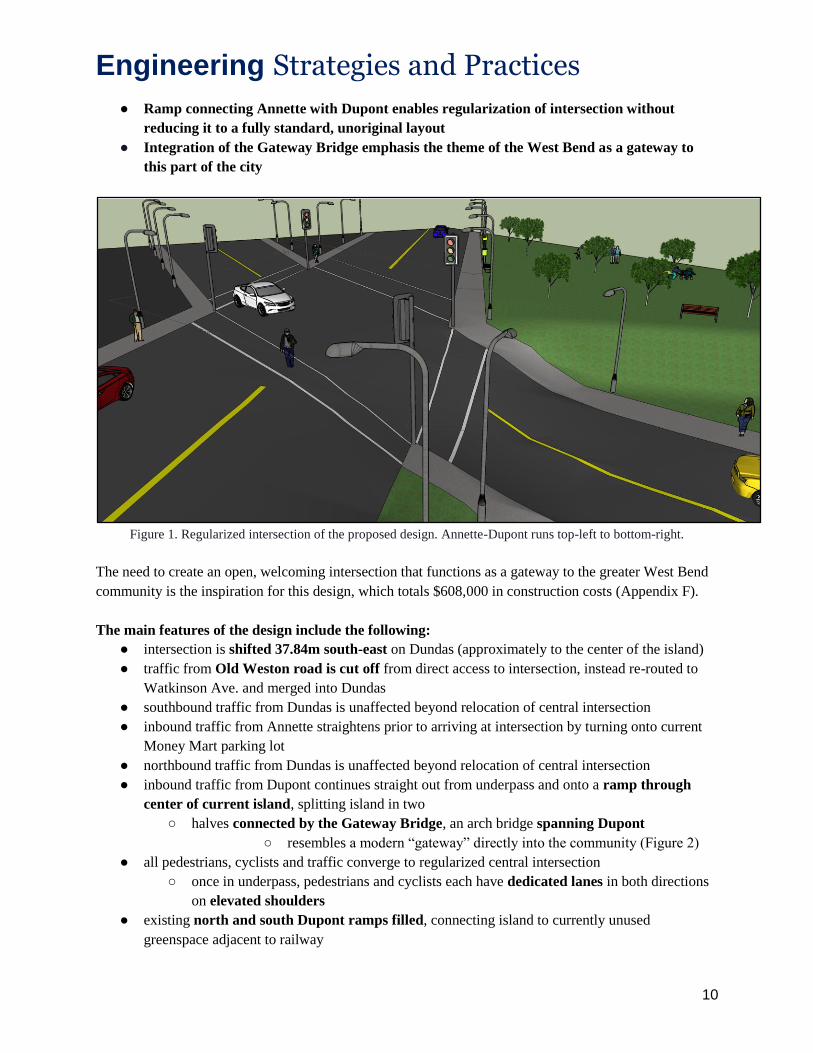
● Integration of the Gateway Bridge emphasis the theme of the West Bend as a gateway to
this part of the city
Figure 1. Regularized intersection of the proposed design. Annette-Dupont runs top-left to bottom-right.
The need to create an open, welcoming intersection that functions as a gateway to the greater West Bend
community is the inspiration for this design, which totals $608,000 in construction costs (Appendix F).
The main features of the design include the following:
● intersection is shifted 37.84m south-east on Dundas (approximately to the center of the island)
● traffic from Old Weston road is cut off from direct access to intersection, instead re-routed to
Watkinson Ave. and merged into Dundas
● southbound traffic from Dundas is unaffected beyond relocation of central intersection
● inbound traffic from Annette straightens prior to arriving at intersection by turning onto current
Money Mart parking lot
● northbound traffic from Dundas is unaffected beyond relocation of central intersection
● inbound traffic from Dupont continues straight out from underpass and onto a ramp through
center of current island, splitting island in two
○ halves connected by the Gateway Bridge, an arch bridge spanning Dupont
○ resembles a modern “gateway” directly into the community (Figure 2)
● all pedestrians, cyclists and traffic converge to regularized central intersection
○ once in underpass, pedestrians and cyclists each have dedicated lanes in both directions
on elevated shoulders
● existing north and south Dupont ramps filled, connecting island to currently unused
greenspace adjacent to railway
Engineering Strategies and Practices
11
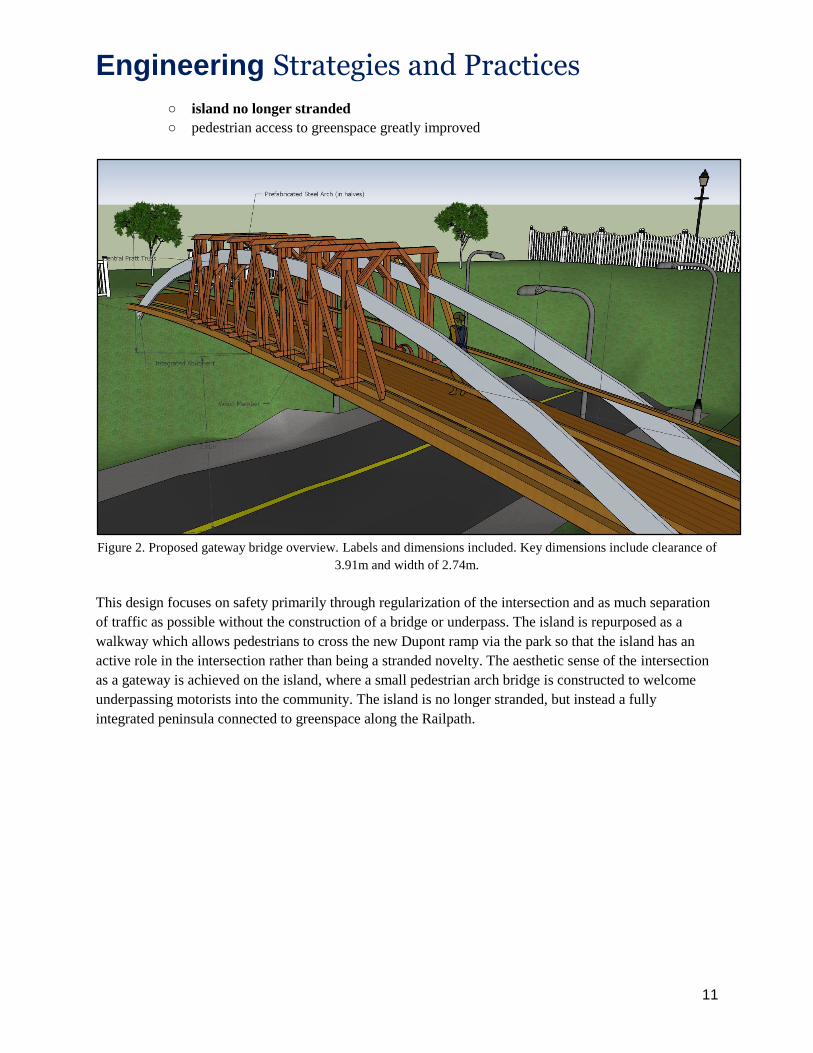
○ island no longer stranded
○ pedestrian access to greenspace greatly improved
Figure 2. Proposed gateway bridge overview. Labels and dimensions included. Key dimensions include clearance of
3.91m and width of 2.74m.
This design focuses on safety primarily through regularization of the intersection and as much separation
of traffic as possible without the construction of a bridge or underpass. The island is repurposed as a
walkway which allows pedestrians to cross the new Dupont ramp via the park so that the island has an
active role in the intersection rather than being a stranded novelty. The aesthetic sense of the intersection
as a gateway is achieved on the island, where a small pedestrian arch bridge is constructed to welcome
underpassing motorists into the community. The island is no longer stranded, but instead a fully
integrated peninsula connected to greenspace along the Railpath.

Engineering Strategies and Practices
12
Figure 3. Alternate angle of the central intersection. It has been shifted to the approximate center of the island.

Engineering Strategies and Practices
13
2.0.2. Lane Widths and Other Dimensions
Exact lane widths and street dimensions have been determined according to regulatory restrictions and
numerous optimization algorithms issued by the City [121]. The centerline position of the proposed
Annette modification and Dupont island ramp has been given in reference to its current position (Figure
12).
Figure 4. Colour-coded aerial presentation of relevant road surfaces (Appendix G). Legend corresponds with Figures
5 through 10.
Significant modifications include the expansion of Park Space (1) on both sides of the current island, the
straightening and shifting of Annette (4), and the introduction of a new 50.44m ramp through the center
of the island (2).
By filling the north and south Dupont ramps, the design facilitates the expansion and connection of
greenspace with newly created space on either side of the island. This means that the island is no longer
stranded between roads on all sides, greatly improving pedestrian access to greenspace.
Engineering Strategies and Practices
14
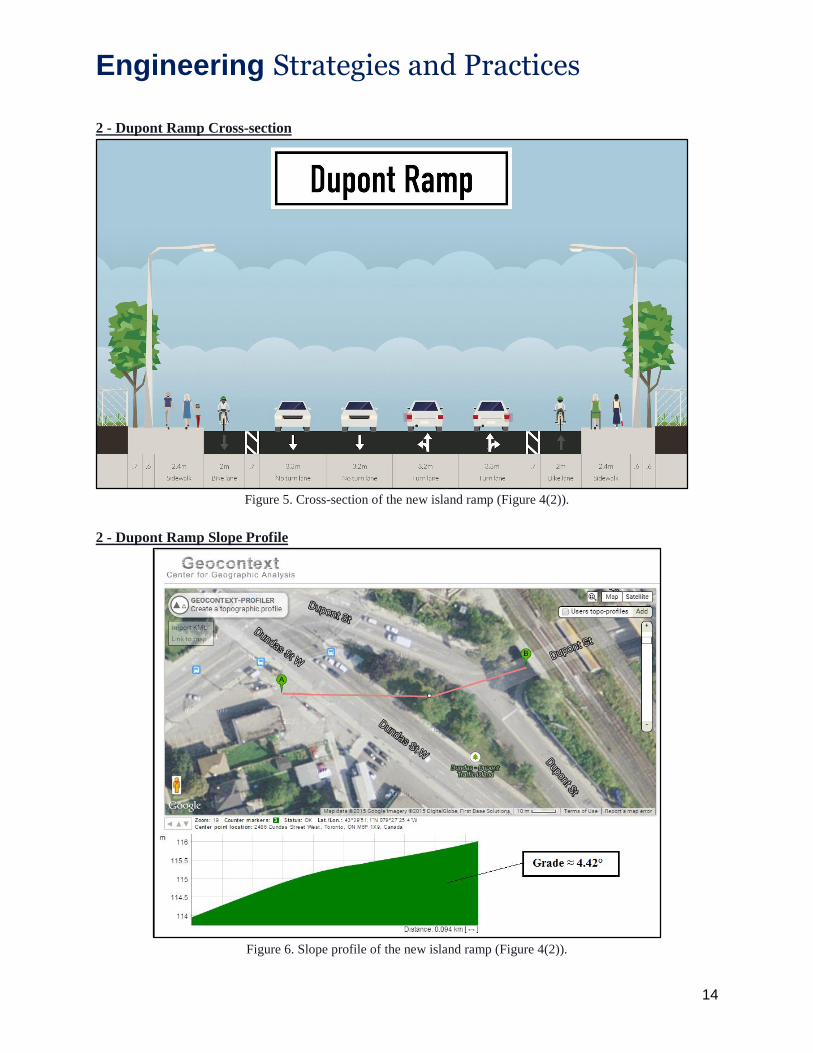
2 - Dupont Ramp Cross-section
Figure 5. Cross-section of the new island ramp (Figure 4(2)).
2 - Dupont Ramp Slope Profile
Figure 6. Slope profile of the new island ramp (Figure 4(2)).
Engineering Strategies and Practices
15
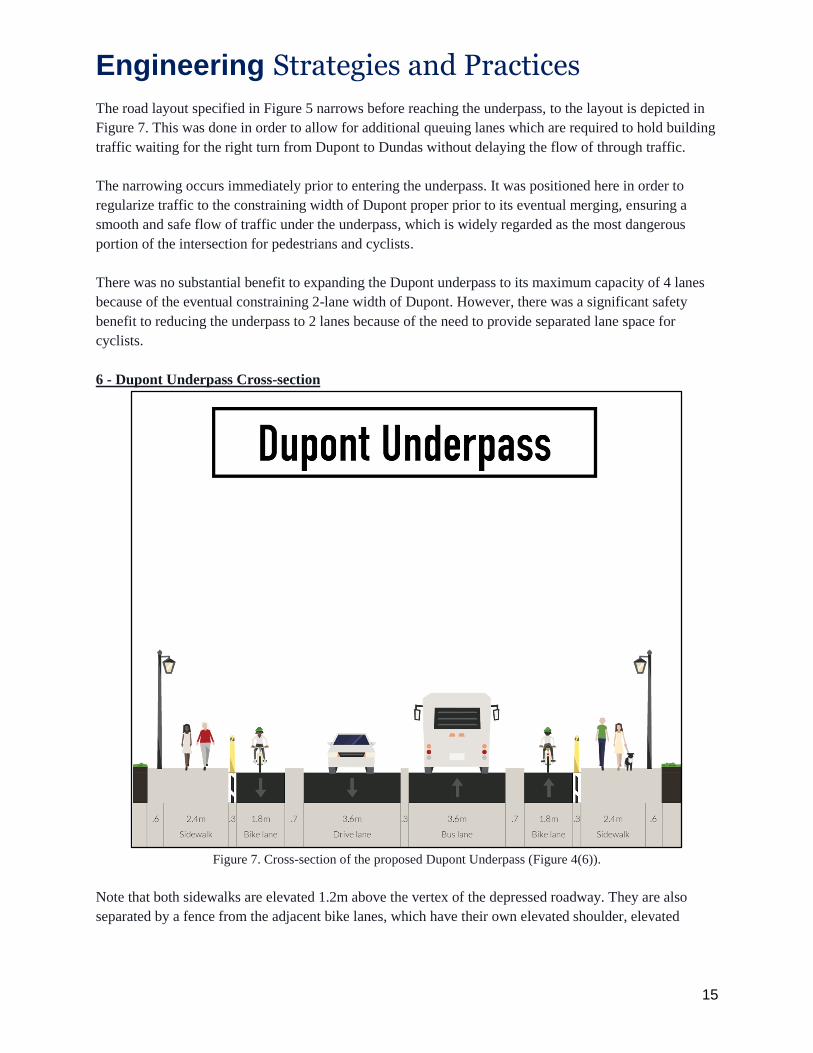
The road layout specified in Figure 5 narrows before reaching the underpass, to the layout is depicted in
Figure 7. This was done in order to allow for additional queuing lanes which are required to hold building
traffic waiting for the right turn from Dupont to Dundas without delaying the flow of through traffic.
The narrowing occurs immediately prior to entering the underpass. It was positioned here in order to
regularize traffic to the constraining width of Dupont proper prior to its eventual merging, ensuring a
smooth and safe flow of traffic under the underpass, which is widely regarded as the most dangerous
portion of the intersection for pedestrians and cyclists.
There was no substantial benefit to expanding the Dupont underpass to its maximum capacity of 4 lanes
because of the eventual constraining 2-lane width of Dupont. However, there was a significant safety
benefit to reducing the underpass to 2 lanes because of the need to provide separated lane space for
cyclists.
6 - Dupont Underpass Cross-section
Figure 7. Cross-section of the proposed Dupont Underpass (Figure 4(6)).
Note that both sidewalks are elevated 1.2m above the vertex of the depressed roadway. They are also
separated by a fence from the adjacent bike lanes, which have their own elevated shoulder, elevated
Engineering Strategies and Practices
16
0.17m above the aforementioned vertex. The bike lanes are separated by a 0.7 wide median from both
curb lanes.
There are two widened vehicle lanes measuring 3.6m in length, one in each direction, to accommodate
regular bus traffic safely. These lanes are separated by a 0.3m section of roadway rendered unusable due
to support columns positioned there to support the overhead railway.
13 streetlights are used in total (for the area immediately adjacent to the intersection), with 2m between
each light. This maximizes the radius of illumination of each light and ensures the greatest lighting
coverage. Lights in the underpass are retrofitted with an LED lighting system to fully illuminate the entire
tunnel.
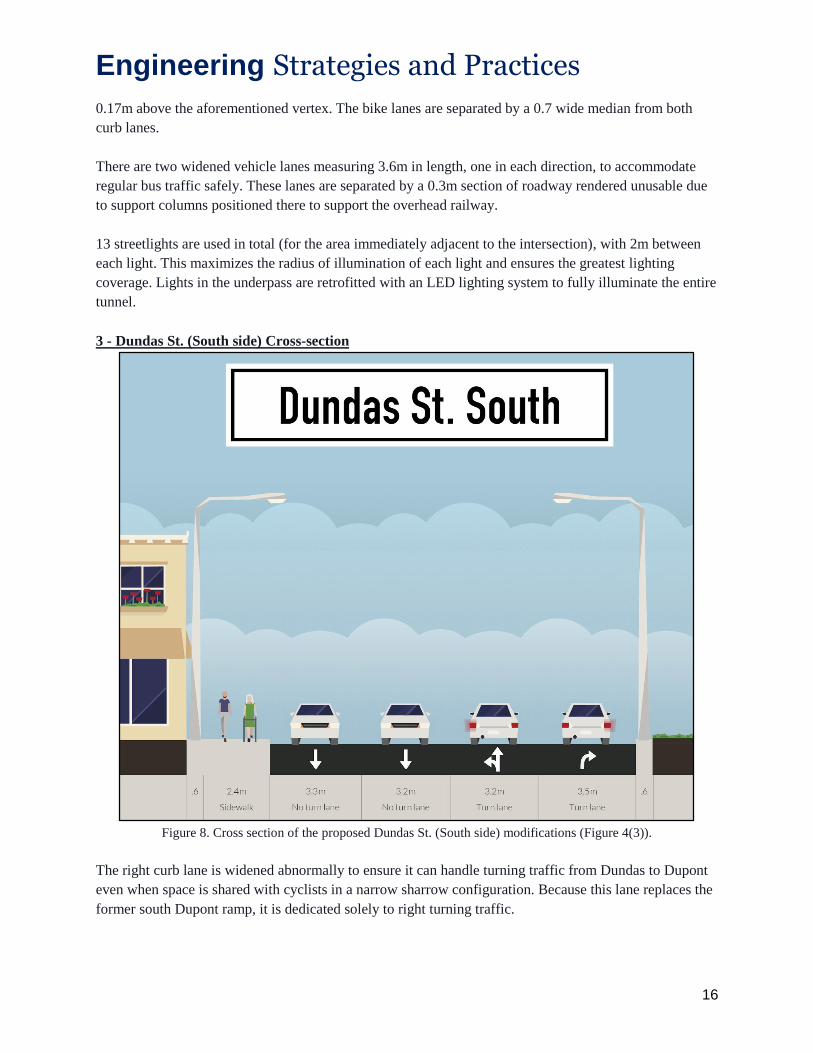
3 - Dundas St. (South side) Cross-section
Figure 8. Cross section of the proposed Dundas St. (South side) modifications (Figure 4(3)).
The right curb lane is widened abnormally to ensure it can handle turning traffic from Dundas to Dupont
even when space is shared with cyclists in a narrow sharrow configuration. Because this lane replaces the
former south Dupont ramp, it is dedicated solely to right turning traffic.
Engineering Strategies and Practices
17
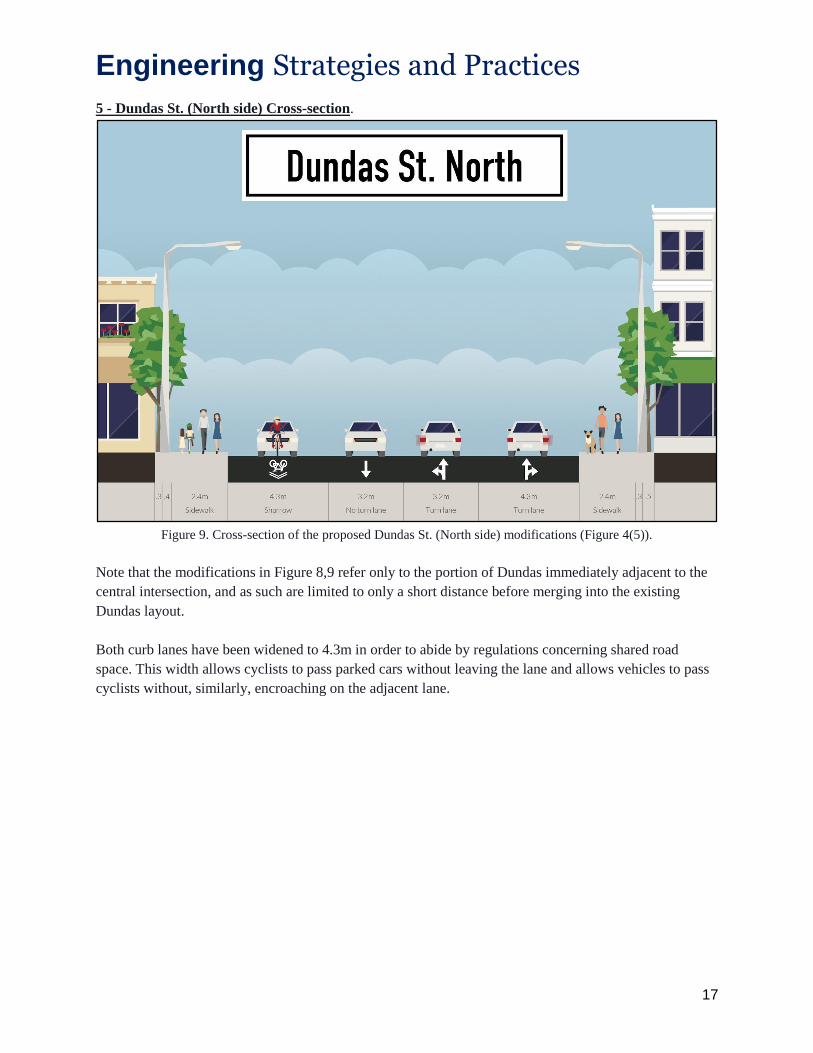
5 - Dundas St. (North side) Cross-section.
Figure 9. Cross-section of the proposed Dundas St. (North side) modifications (Figure 4(5)).
Note that the modifications in Figure 8,9 refer only to the portion of Dundas immediately adjacent to the
central intersection, and as such are limited to only a short distance before merging into the existing
Dundas layout.
Both curb lanes have been widened to 4.3m in order to abide by regulations concerning shared road
space. This width allows cyclists to pass parked cars without leaving the lane and allows vehicles to pass
cyclists without, similarly, encroaching on the adjacent lane.
Engineering Strategies and Practices
18
4 - Annette St. Cross-section
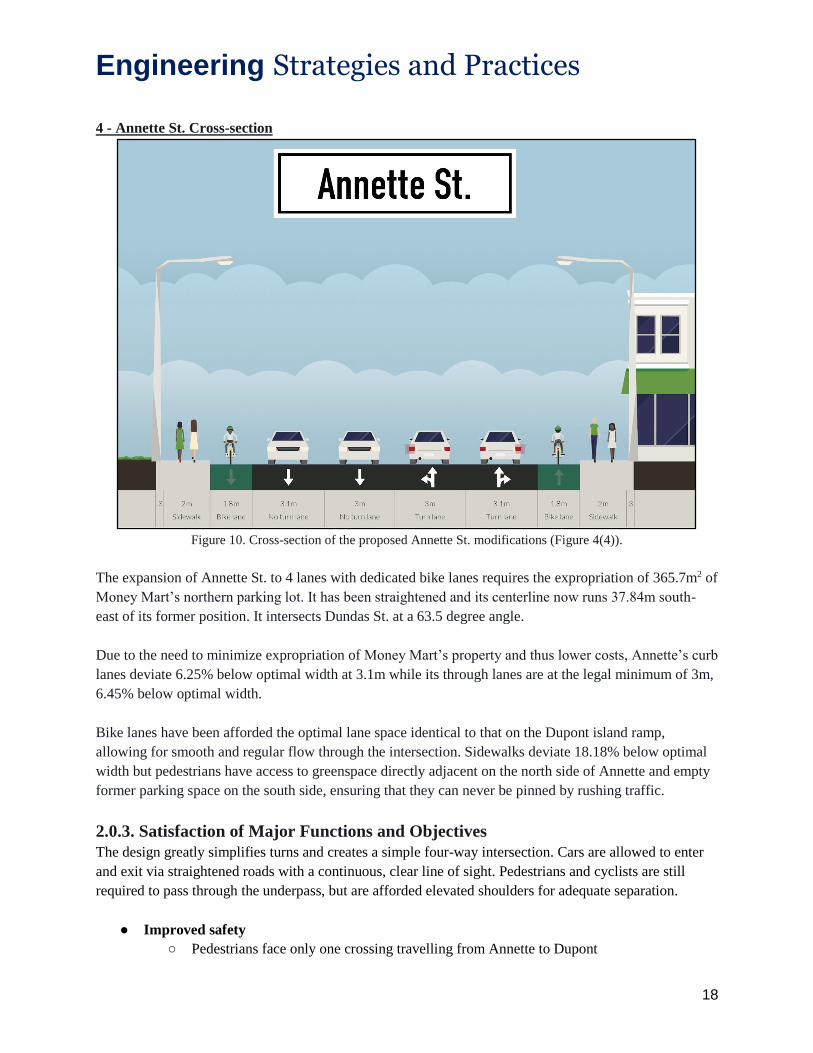
Figure 10. Cross-section of the proposed Annette St. modifications (Figure 4(4)).
The expansion of Annette St. to 4 lanes with dedicated bike lanes requires the expropriation of 365.7m2 of
Money Mart’s northern parking lot. It has been straightened and its centerline now runs 37.84m south-
east of its former position. It intersects Dundas St. at a 63.5 degree angle.
Due to the need to minimize expropriation of Money Mart’s property and thus lower costs, Annette’s curb
lanes deviate 6.25% below optimal width at 3.1m while its through lanes are at the legal minimum of 3m,
6.45% below optimal width.
Bike lanes have been afforded the optimal lane space identical to that on the Dupont island ramp,
allowing for smooth and regular flow through the intersection. Sidewalks deviate 18.18% below optimal
width but pedestrians have access to greenspace directly adjacent on the north side of Annette and empty
former parking space on the south side, ensuring that they can never be pinned by rushing traffic.
2.0.3. Satisfaction of Major Functions and Objectives
The design greatly simplifies turns and creates a simple four-way intersection. Cars are allowed to enter
and exit via straightened roads with a continuous, clear line of sight. Pedestrians and cyclists are still
required to pass through the underpass, but are afforded elevated shoulders for adequate separation.
● Improved safety
○ Pedestrians face only one crossing travelling from Annette to Dupont
Engineering Strategies and Practices
19
○ Minimizes distance pedestrians must walk while level with a busy road
○ Bike lanes do not swerve through car lanes and are consistently kept on the side
○ Turns around sharp corners of island are eliminated
■ Maximum 63.5 degree turn
■ approximately 90 degree turns maintained from Dundas to Dupont and Dundas to
Annette
○ All vehicles must adhere to traffic lights to cross intersection
○ Clear line of visibility, easy to predict path of vehicles and other users
● Greater accessibility
○ Central ramp at 4.42% average grade
■ Below 5% maximum universal access grade requirement [62]
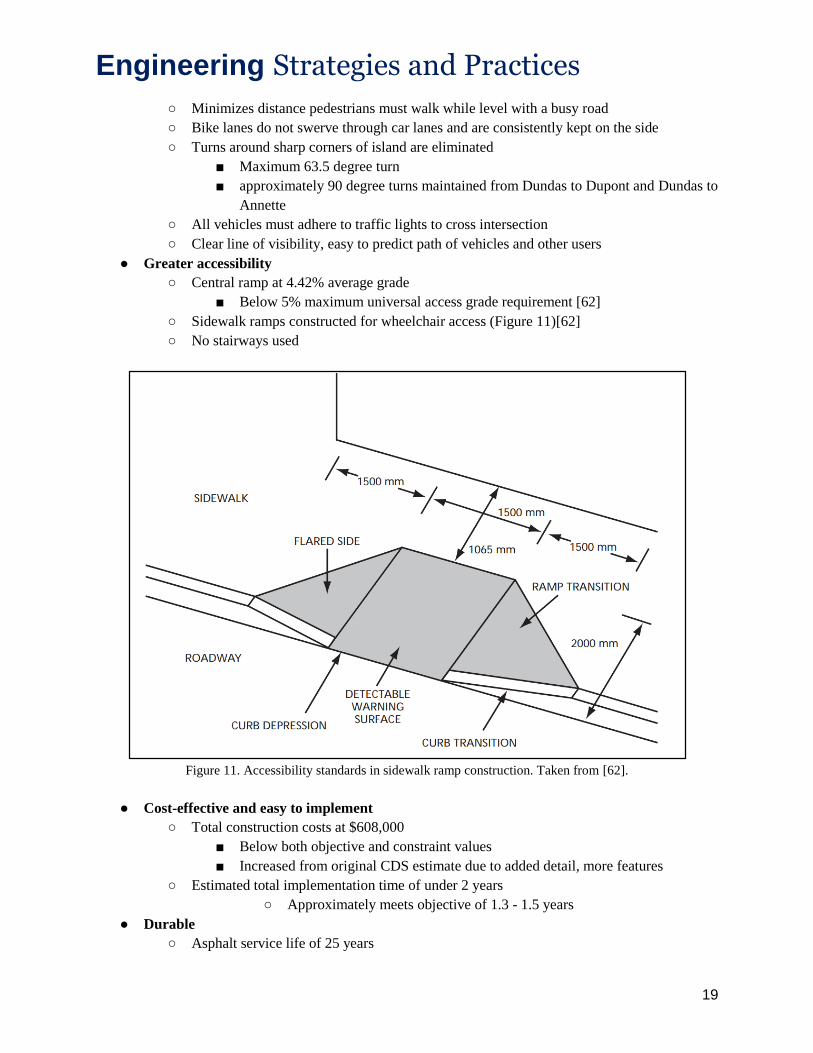
○ Sidewalk ramps constructed for wheelchair access (Figure 11)[62]
○ No stairways used
Figure 11. Accessibility standards in sidewalk ramp construction. Taken from [62].
● Cost-effective and easy to implement
○ Total construction costs at $608,000
■ Below both objective and constraint values
■ Increased from original CDS estimate due to added detail, more features
○ Estimated total implementation time of under 2 years
○ Approximately meets objective of 1.3 - 1.5 years
● Durable
○ Asphalt service life of 25 years
Engineering Strategies and Practices
20
○ Pedestrian bridge to last 90 years with regular maintenance
● Easier to maintain
○ Less road surface
○ Parallel park triangular layout optimized for ease-of-maintenance in cutting grass,
garbage collection, etc.
● Environmentally friendly
○ 4697.9m2 of new integrated park space
■ connected with Gateway Bridge (Figure 14)
○ More than 6 trees planted
● Road use proportions in correspondence with aesthetic and functional holistic goals
○ 35.64% pedestrian space (sidewalks and walkways)
■ Exceeds objective of 25%
○ Legal requirements met universally
○ Space usage optimized ideally on all adjoining roads (excluding Annette)
■ Optimized for safety, traffic flow
See Figure 12 for a detailed schematic of all relevant dimensions and specifications.

Engineering Strategies and Practices
21
Fig
ure
12. D
eta
iled s
chem
atic
of s
treet w
idth
s, in
ters
ect a
ngle
s, a
reas, a
nd o
ther d
imensio
ns
rela
ted to
the in
ters
ectio
n.
Engineering Strategies and Practices
22
2.0.4. Objective Tradeoffs
● Straightening of road connecting Annette and Dupont increases accessibility but also cost
○ must expropriate northern portion parking lot (365.7m2) from Money Mart
● Decreased accessibility in order to lower cost
○ pedestrians still required to travel through underpass
● Regularization of Dupont following underpass requires removal of dedicated Dupont north and
south ramps
○ increased safety at the cost of efficiency
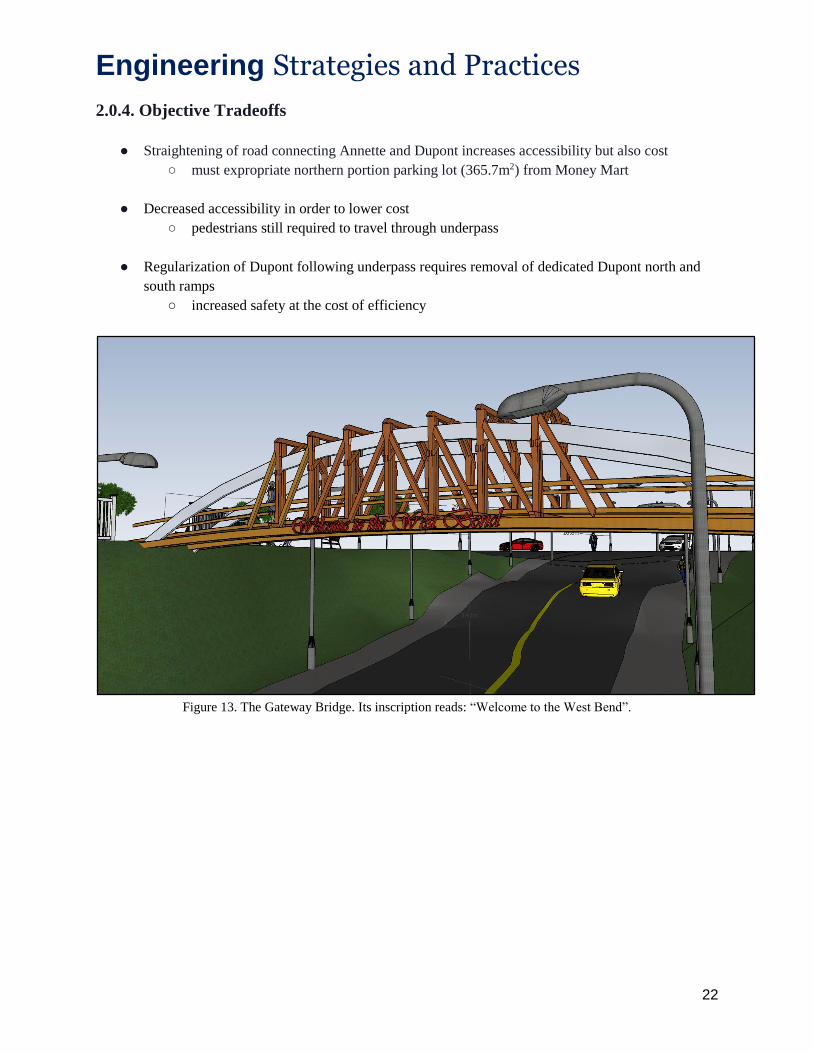
Figure 13. The Gateway Bridge. Its inscription reads: “Welcome to the West Bend”.
Engineering Strategies and Practices
23
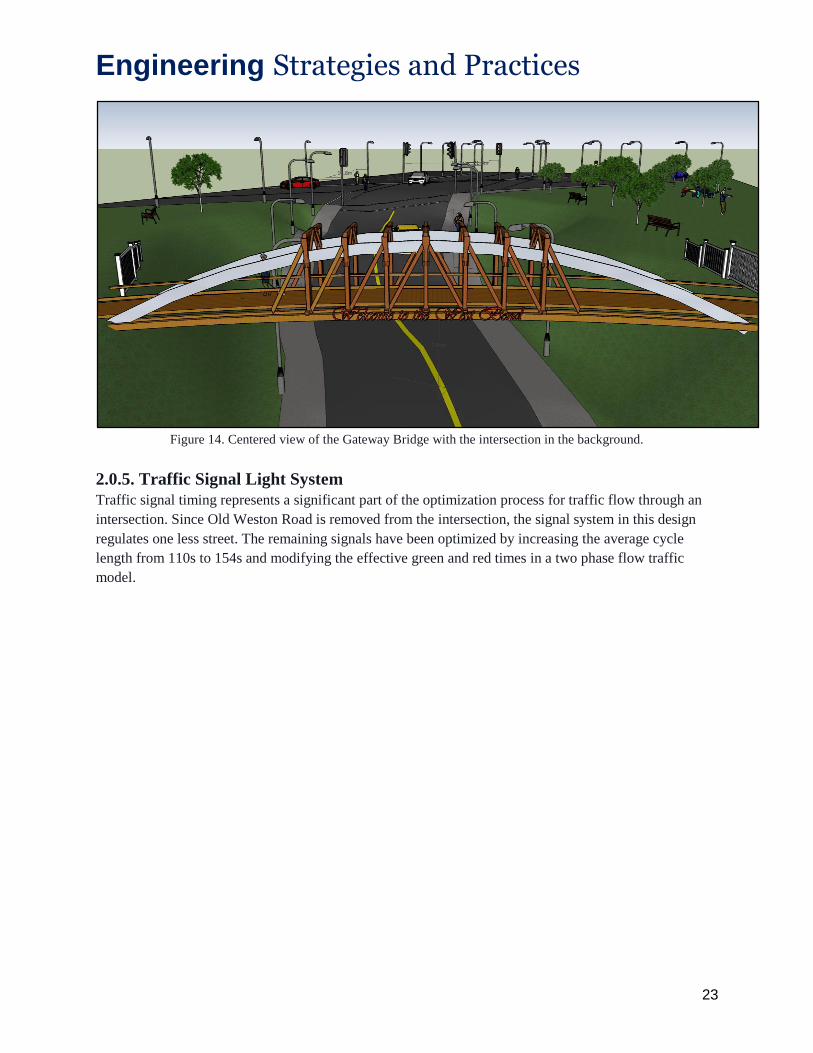
Figure 14. Centered view of the Gateway Bridge with the intersection in the background.
2.0.5. Traffic Signal Light System
Traffic signal timing represents a significant part of the optimization process for traffic flow through an
intersection. Since Old Weston Road is removed from the intersection, the signal system in this design
regulates one less street. The remaining signals have been optimized by increasing the average cycle
length from 110s to 154s and modifying the effective green and red times in a two phase flow traffic
model.

Engineering Strategies and Practices
24
2.0.5.1. Physical Layout and Positioning
For regularity, the new four-way intersection will employ four sets of identical signal lights. Figure 14
illustrates the general schematic of each set.
Figure 15. Schematic of the traffic light system controlling the Dupont and Annette intersection. Average lane
widths used.
The traffic light setup on Dundas is identical, aside from a slightly shorter overhead extension due to the
difference in road width. More precisely, due to the absence of bike lanes on Dundas, the length of the
overhead support will be only 6.7m. The spacing of the traffic lights themselves will also be adjusted such
that every traffic light will be set up in the middle of the lane it controls to optimize visibility for drivers
and cyclists.
Engineering Strategies and Practices
25
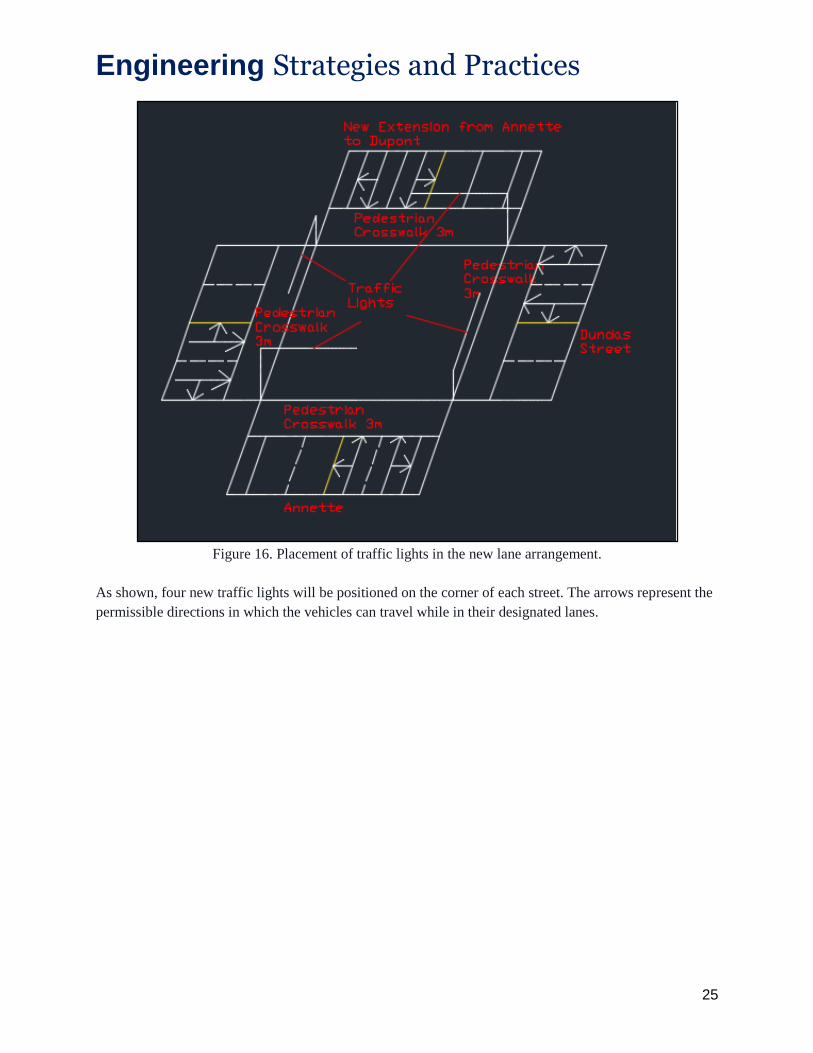
Figure 16. Placement of traffic lights in the new lane arrangement.
As shown, four new traffic lights will be positioned on the corner of each street. The arrows represent the
permissible directions in which the vehicles can travel while in their designated lanes.

Engineering Strategies and Practices
26
2.0.5.2. Phases and Timing of Traffic Signals
Traffic signal timing is essential to the effective transport of mass. Designing a traffic light system
requires the consideration of both safety and efficiency.
Figure 17. Current traffic signal timings for peak and off-peak hours for the DDA intersection.
The following baseline times were calculated using a strictly physics-based approach, using the
acceleration of the slowest vehicles crossing the intersection to maintain a suitable margin of safety.
Optimization was not considered.
Table 5. Baseline Signal Times (Appendix H)
Phase Green
Timing
Yellow
Timing
Red
Timing
Pedestrian
Green
Pedestrian
Red
Dundas
Northbound -
Southbound
Green
Light 72s
Yellow
Light 3s
Red
Light 82s
Pedestrian
Green: 75s
Pedestrian
Red: 85s

Engineering Strategies and Practices
27
Dupont
Eastbound -
Annette
Westbound
Green
Light 82s
Yellow
Light 3s
Red
Light 72s
Pedestrian
Green: 85s
Pedestrian
Red: 75s
Note that the amber timing, by legal standards, is universally 3s. A cycle length of 154s was calculated
using the total green light cycle time.
Figure 18. Phase 1 of the traffic light timing system. Note that the various sub-phases are broken down by colour.
Engineering Strategies and Practices
28
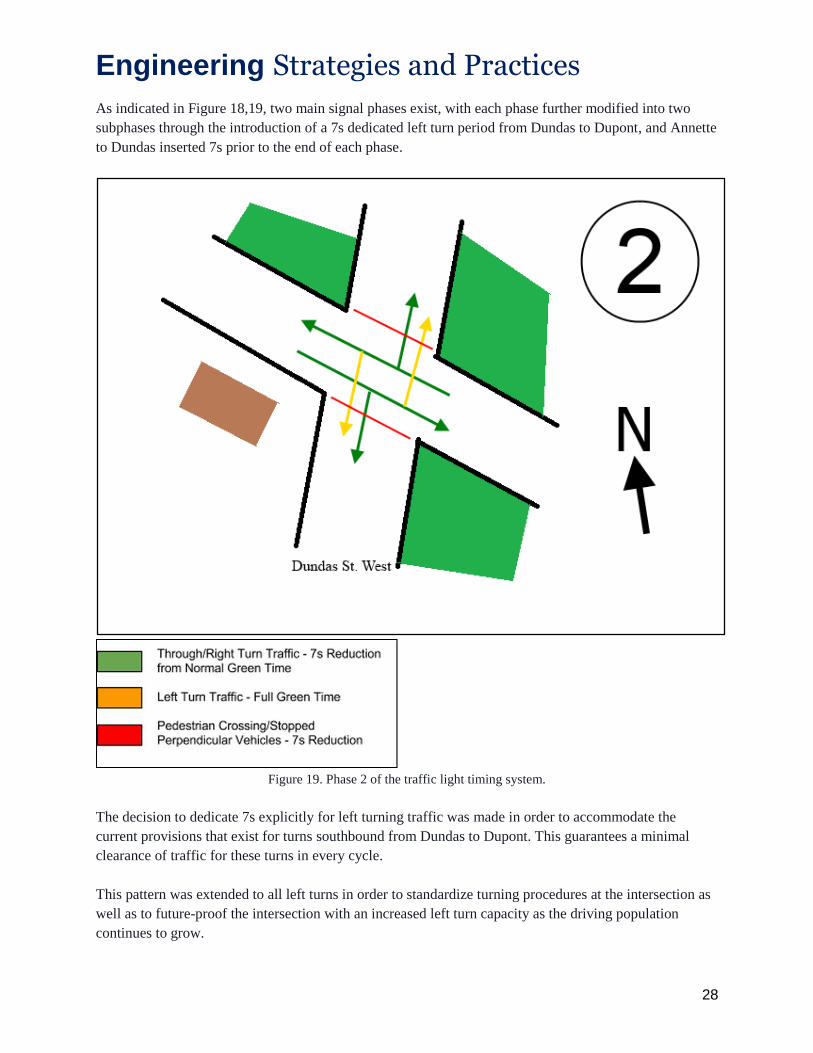
As indicated in Figure 18,19, two main signal phases exist, with each phase further modified into two
subphases through the introduction of a 7s dedicated left turn period from Dundas to Dupont, and Annette
to Dundas inserted 7s prior to the end of each phase.
Figure 19. Phase 2 of the traffic light timing system.
The decision to dedicate 7s explicitly for left turning traffic was made in order to accommodate the
current provisions that exist for turns southbound from Dundas to Dupont. This guarantees a minimal
clearance of traffic for these turns in every cycle.
This pattern was extended to all left turns in order to standardize turning procedures at the intersection as
well as to future-proof the intersection with an increased left turn capacity as the driving population
continues to grow.
Engineering Strategies and Practices
29
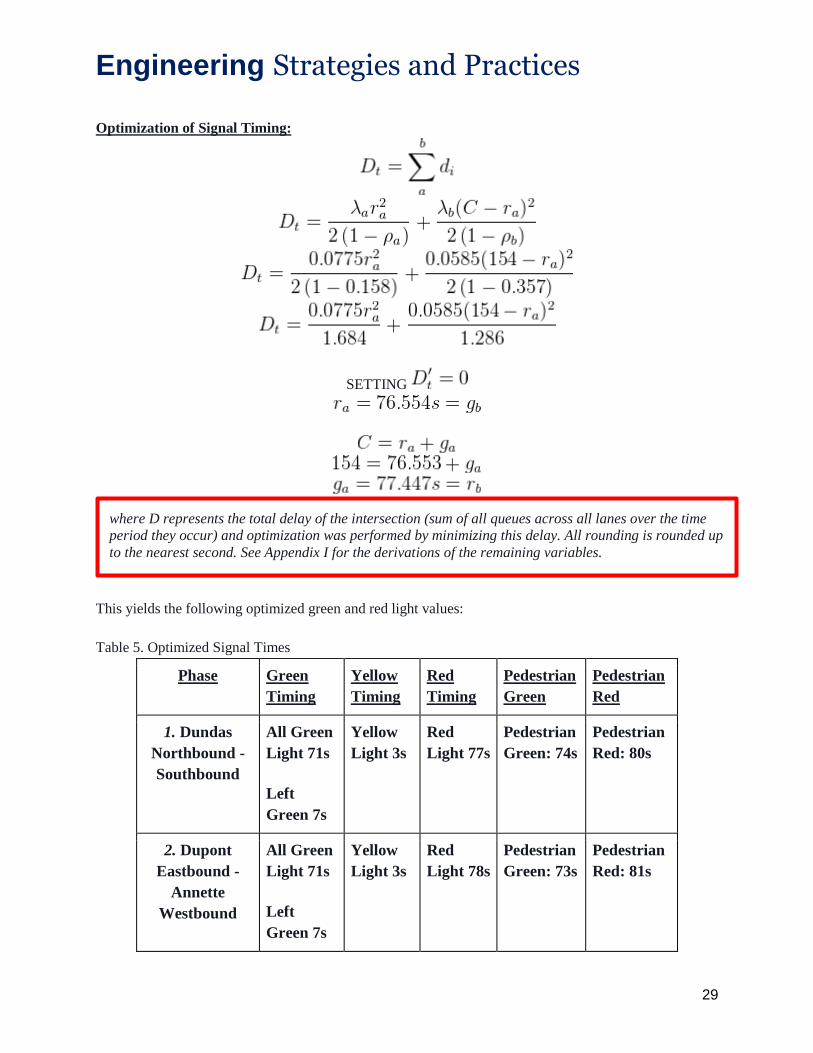
Optimization of Signal Timing:
SETTING
This yields the following optimized green and red light values:
Table 5. Optimized Signal Times
Phase Green
Timing
Yellow
Timing
Red
Timing
Pedestrian
Green
Pedestrian
Red
1. Dundas
Northbound -
Southbound
All Green
Light 71s
Left
Green 7s
Yellow
Light 3s
Red
Light 77s
Pedestrian
Green: 74s
Pedestrian
Red: 80s
2. Dupont
Eastbound -
Annette
Westbound
All Green
Light 71s
Left
Green 7s
Yellow
Light 3s
Red
Light 78s
Pedestrian
Green: 73s
Pedestrian
Red: 81s
where D represents the total delay of the intersection (sum of all queues across all lanes over the time
period they occur) and optimization was performed by minimizing this delay. All rounding is rounded up
to the nearest second. See Appendix I for the derivations of the remaining variables.
Engineering Strategies and Practices
30
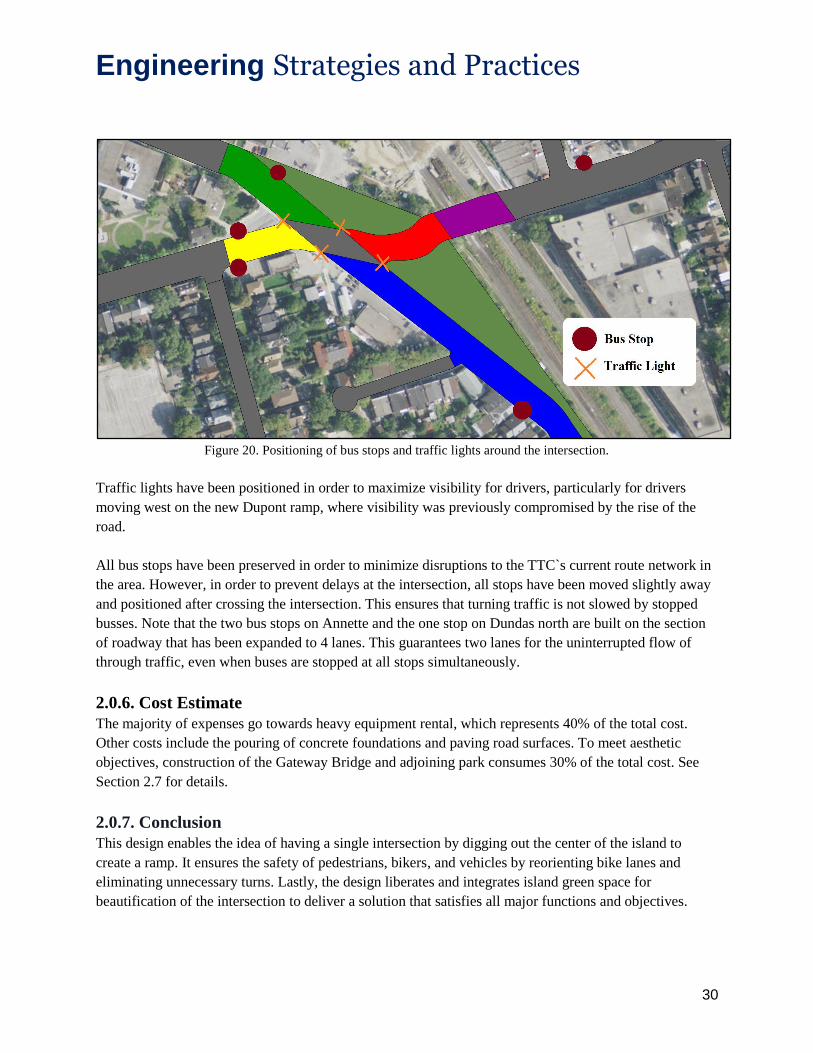
Figure 20. Positioning of bus stops and traffic lights around the intersection.
Traffic lights have been positioned in order to maximize visibility for drivers, particularly for drivers
moving west on the new Dupont ramp, where visibility was previously compromised by the rise of the
road.
All bus stops have been preserved in order to minimize disruptions to the TTC`s current route network in
the area. However, in order to prevent delays at the intersection, all stops have been moved slightly away
and positioned after crossing the intersection. This ensures that turning traffic is not slowed by stopped
busses. Note that the two bus stops on Annette and the one stop on Dundas north are built on the section
of roadway that has been expanded to 4 lanes. This guarantees two lanes for the uninterrupted flow of
through traffic, even when buses are stopped at all stops simultaneously.
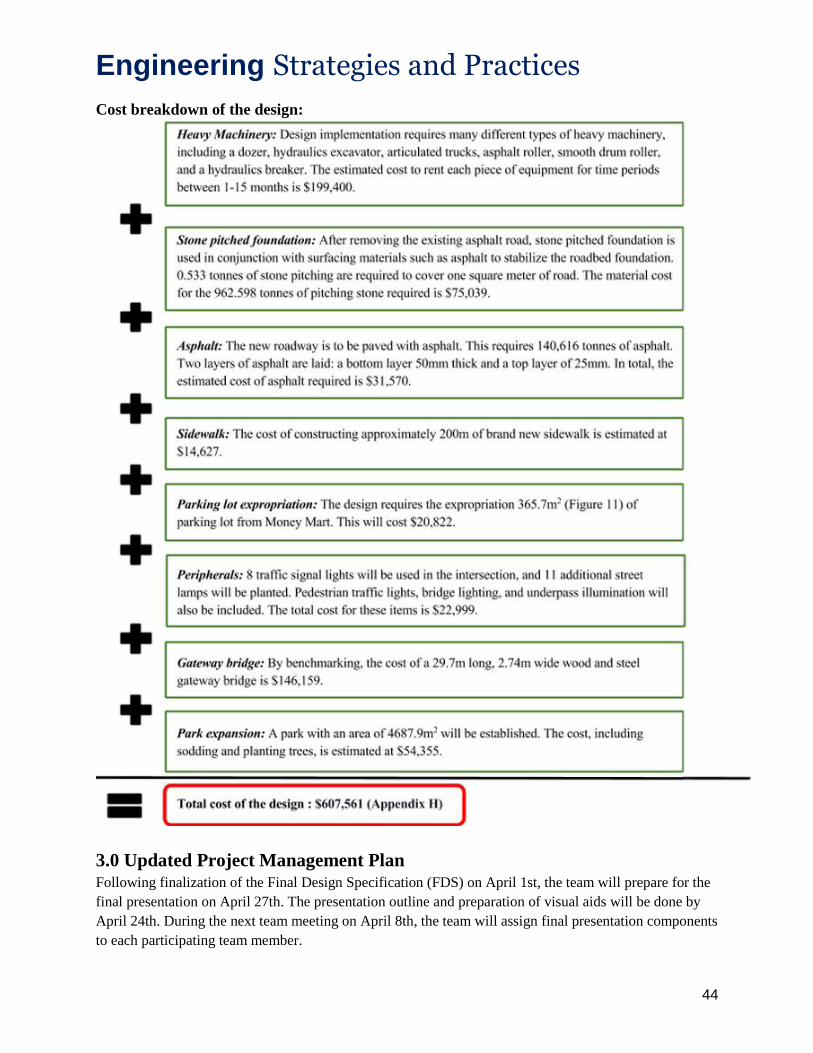
2.0.6. Cost Estimate
The majority of expenses go towards heavy equipment rental, which represents 40% of the total cost.
Other costs include the pouring of concrete foundations and paving road surfaces. To meet aesthetic
objectives, construction of the Gateway Bridge and adjoining park consumes 30% of the total cost. See
Section 2.7 for details.
2.0.7. Conclusion
This design enables the idea of having a single intersection by digging out the center of the island to
create a ramp. It ensures the safety of pedestrians, bikers, and vehicles by reorienting bike lanes and
eliminating unnecessary turns. Lastly, the design liberates and integrates island green space for
beautification of the intersection to deliver a solution that satisfies all major functions and objectives.
Engineering Strategies and Practices
31
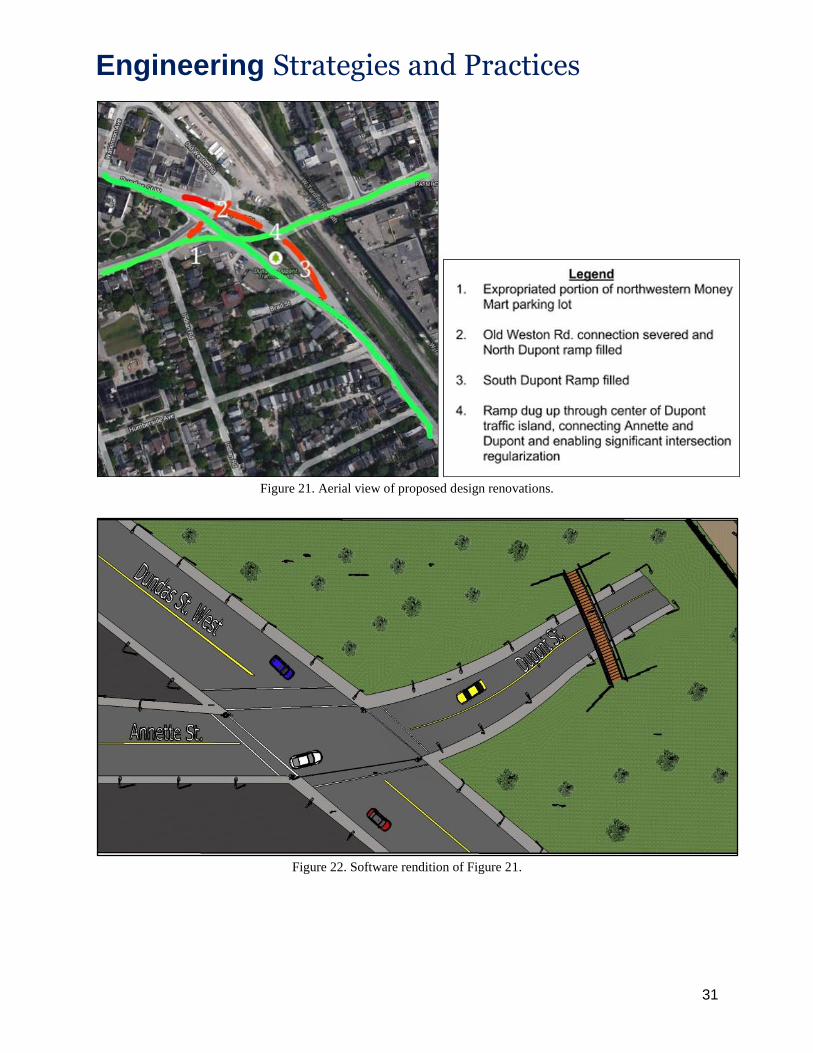
Figure 21. Aerial view of proposed design renovations.
Figure 22. Software rendition of Figure 21.
Engineering Strategies and Practices
32
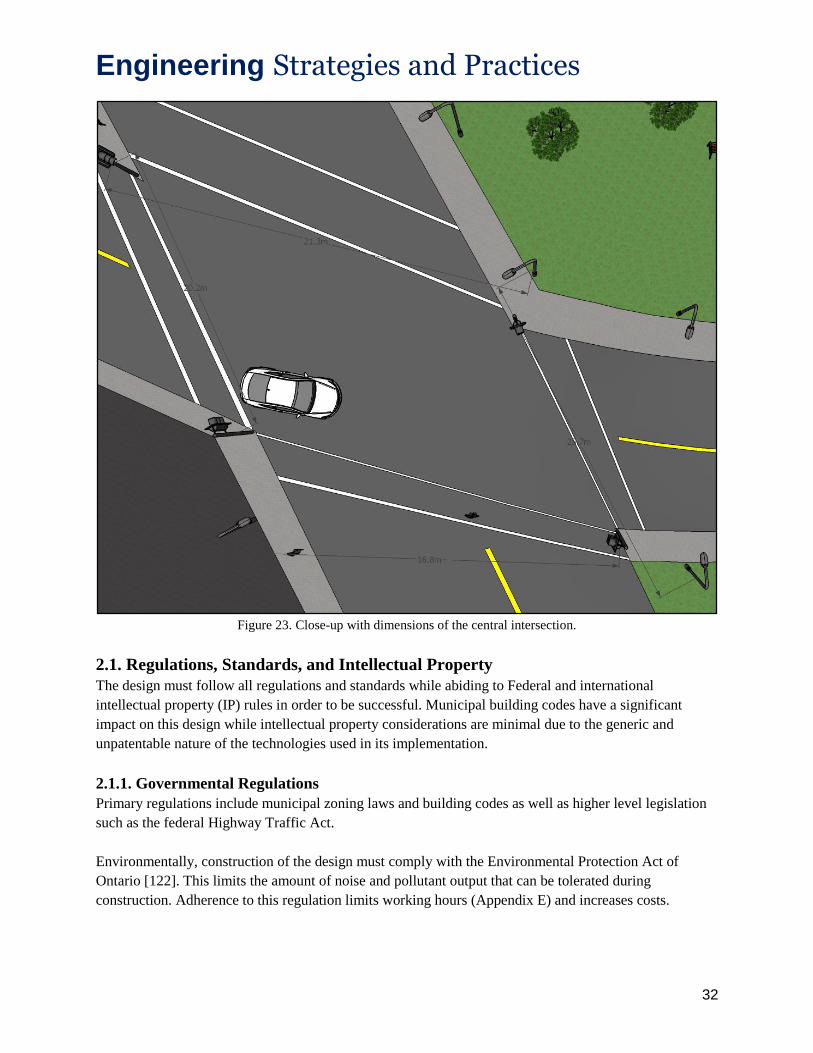
Figure 23. Close-up with dimensions of the central intersection.
2.1. Regulations, Standards, and Intellectual Property
The design must follow all regulations and standards while abiding to Federal and international
intellectual property (IP) rules in order to be successful. Municipal building codes have a significant
impact on this design while intellectual property considerations are minimal due to the generic and
unpatentable nature of the technologies used in its implementation.
2.1.1. Governmental Regulations
Primary regulations include municipal zoning laws and building codes as well as higher level legislation
such as the federal Highway Traffic Act.
Environmentally, construction of the design must comply with the Environmental Protection Act of
Ontario [122]. This limits the amount of noise and pollutant output that can be tolerated during
construction. Adherence to this regulation limits working hours (Appendix E) and increases costs.
Engineering Strategies and Practices
33
A listing of less important regulatory standards can be found in full in Appendix E.
2.1.2. Industry Standards
Road vehicles - Collision classification
This standard classifies the different types of vehicle collisions. The design mandates consideration of the
most common types in order to avoid them in a road environment [123].
Commercial road vehicles - Dimensional codes
This standard provides dimensions for commercial vehicles. These dimensions were used to verify all
vehicles will be able to operate safety within the design [124].
Road vehicles - Objective rating metric for non-ambiguous signals
This standard provides a set of metrics used to rank signal lighting and timing. The design team
considered these industry standards when choosing appropriate street lamps [125].
Road construction and maintenance equipment - Road milling machinery and asphalt pavers
(commercial specifications)
This standard shows the characteristics of industry standard road milling machinery. During the heavy
equipment selection process, it provided guidance on proper equipment choices [126][127].
It also contains the characteristics of industry standard asphalt paver. This mix must adhere to strict
testing procedures outlined in Section 2.2 [128].
2.1.3. Intellectual Property
The relevance of intellectual property in this design is extremely limited. Since traditional asphalt mixing
and road paving techniques have become common knowledge within the industry, they fail the novelty,
utility, and nonobviousness requirements and are thus no longer patentable [129][130][131]. Furthermore,
the large collection of prior art in the field means that the design does not require novel techniques for full
implementation, some of which have indeed been patented [132][133][134][135].
For the purposes and implementation procedures of this design, none of the referenced patents are
required (Section 2.3). Foreseeably, no patent or intellectual property concerns exist for the ultimate
implementation of this design.
However, noteworthy patents whose use can be explored following initial implementation of the design
have been listed in Appendix J.

Engineering Strategies and Practices
34
2.2. Testing
The following standardized tests can be used to test the design against objective metrics. The specifics of
these metrics have been documented in Appendix K. Preliminary testing will be done on the top 3
objectives for which standardized ASTM testing procedures exist.
Engineering Strategies and Practices
35
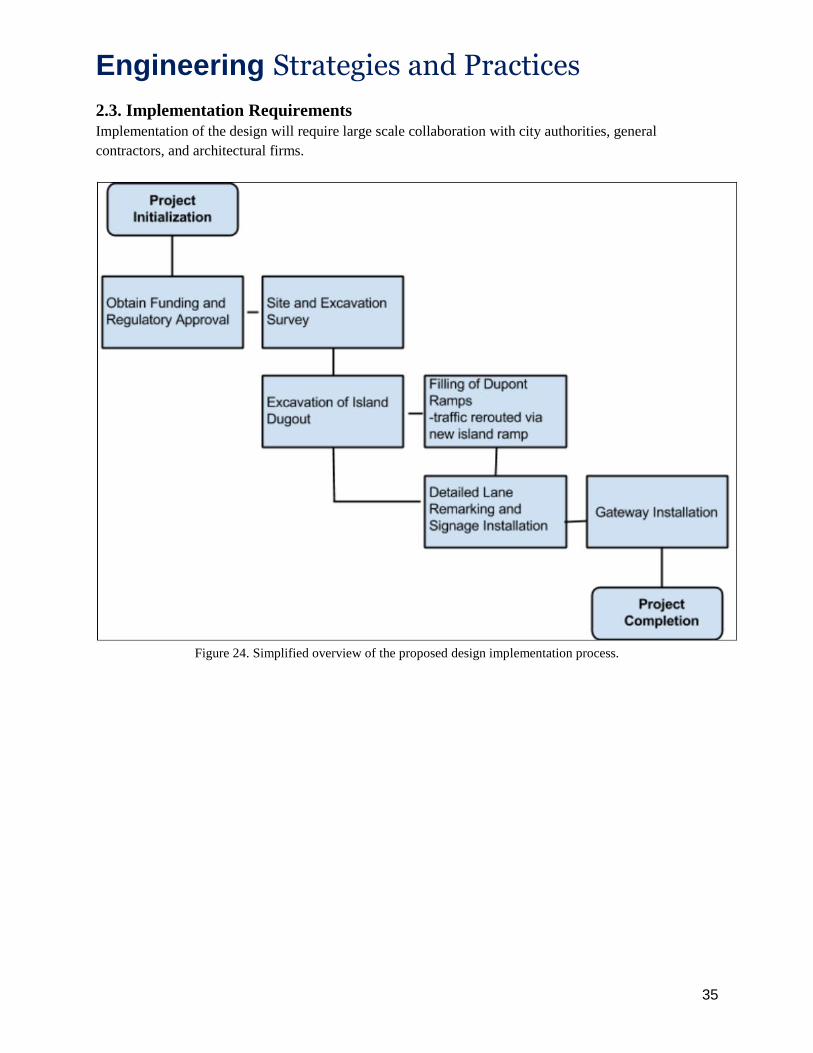
2.3. Implementation Requirements
Implementation of the design will require large scale collaboration with city authorities, general
contractors, and architectural firms.
Figure 24. Simplified overview of the proposed design implementation process.
Engineering Strategies and Practices
36
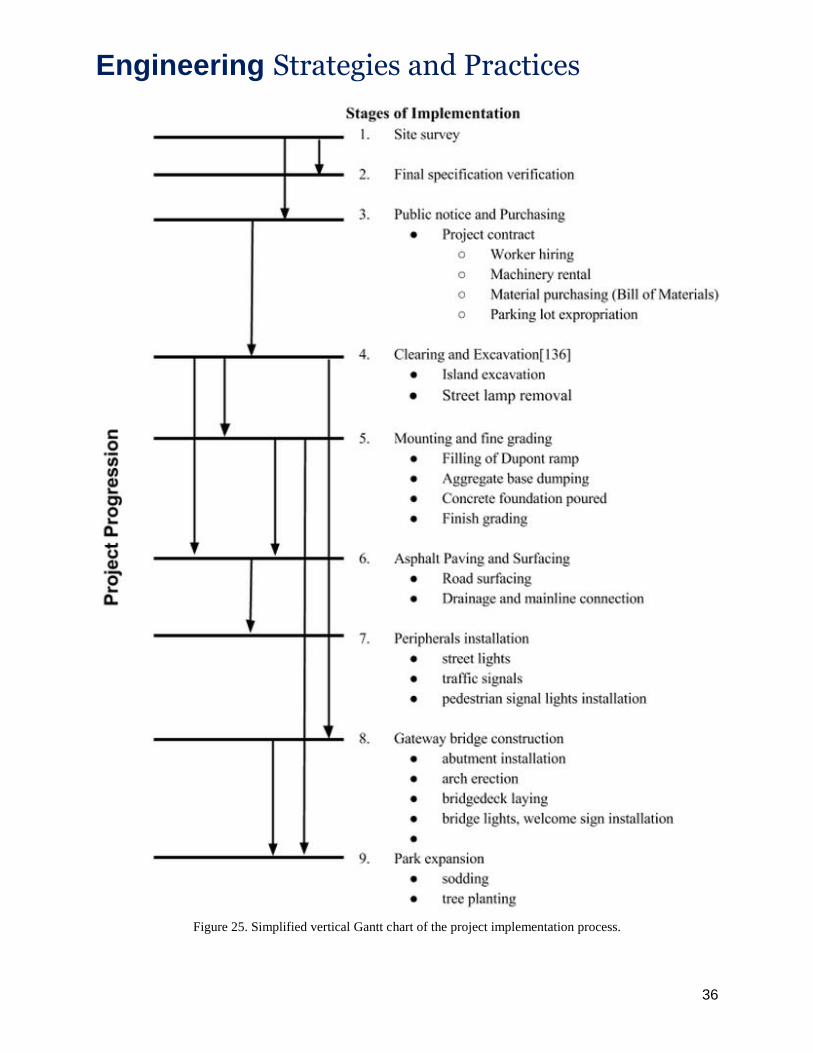
Figure 25. Simplified vertical Gantt chart of the project implementation process.
Engineering Strategies and Practices
37
Implementation will be managed in stages in order to minimize disruptions to traffic during construction.
Consequently, coordination in timing of the island ramp construction and Dupont ramp filling is
instrumental in preserving acceptably smooth traffic flow during implementation and represents the
greatest foreseeable challenge in this process.
As indicated in Figure 25, construction of the island ramp will occur first while the current Dupont ramps
are used to handle traffic. Once the island ramp has all its basic installations complete and is opened, the
current Dupont ramps will be filled (in layers) and park expansion can proceed. Other tasks, such as
gateway bridge construction, can occur simultaneously (represented in the figure by arrow heads from
different levels arriving at the same line).
2.4. Life Cycle and Environmental Impact
Goal Definition and Scoping
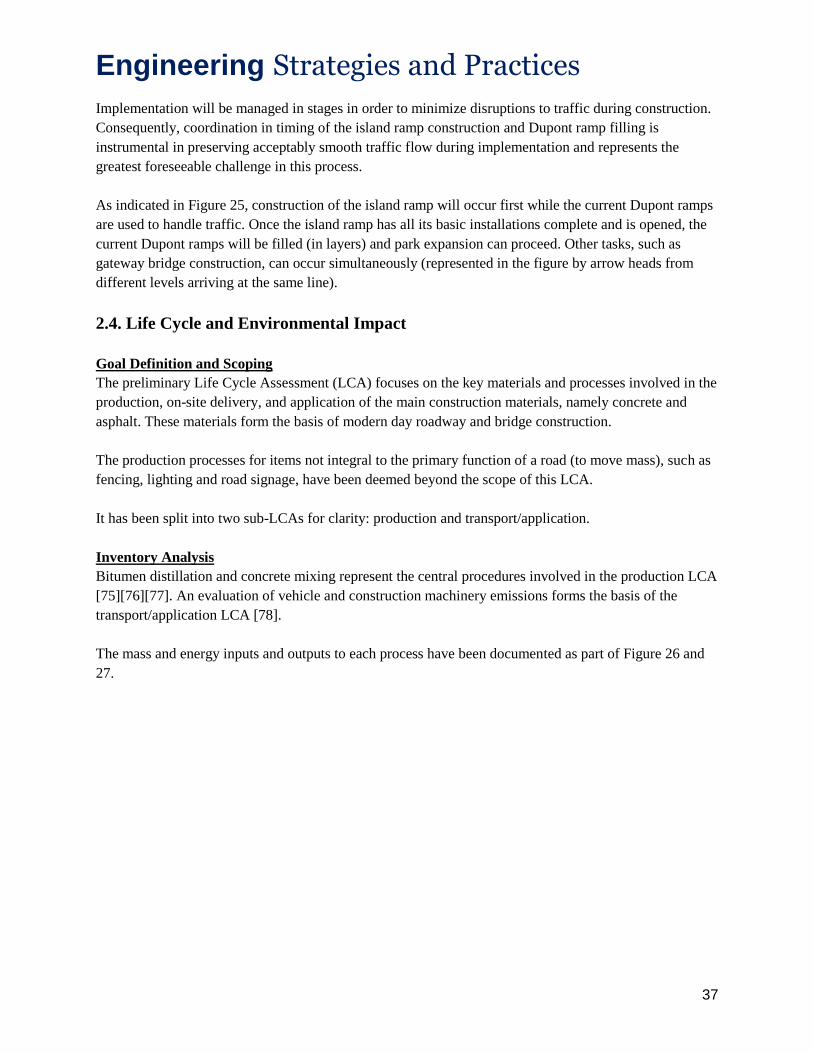
The preliminary Life Cycle Assessment (LCA) focuses on the key materials and processes involved in the
production, on-site delivery, and application of the main construction materials, namely concrete and
asphalt. These materials form the basis of modern day roadway and bridge construction.
The production processes for items not integral to the primary function of a road (to move mass), such as
fencing, lighting and road signage, have been deemed beyond the scope of this LCA.
It has been split into two sub-LCAs for clarity: production and transport/application.
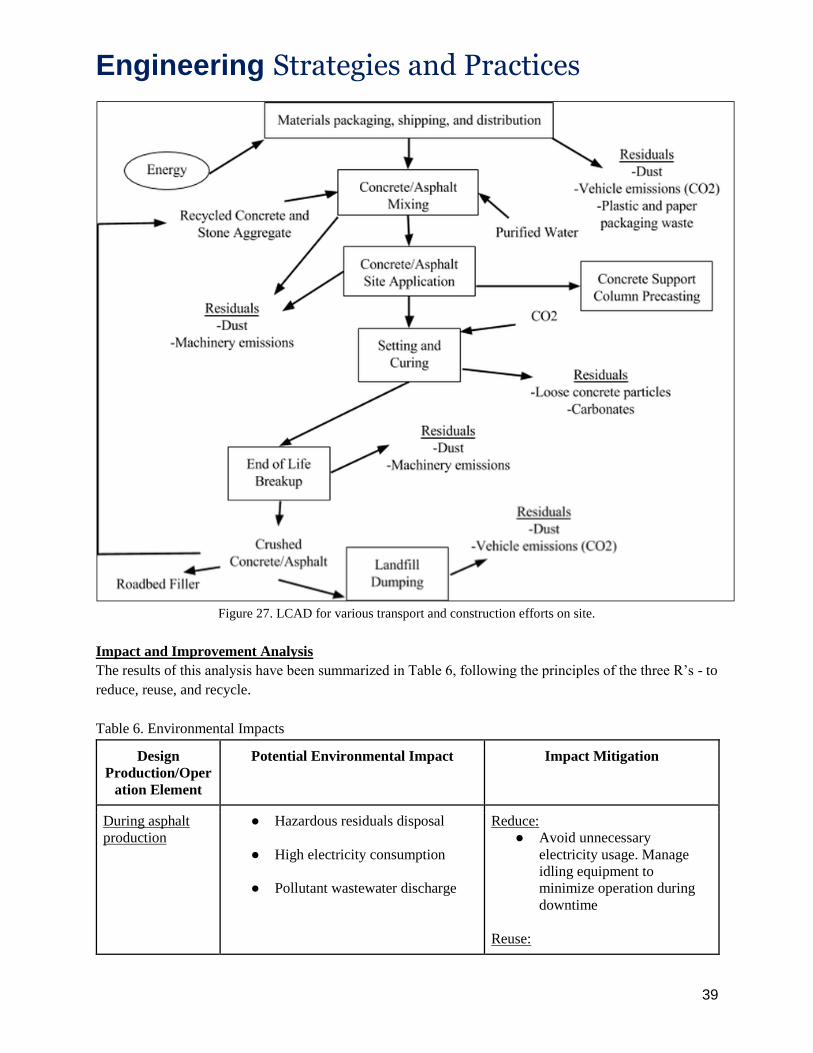
Inventory Analysis
Bitumen distillation and concrete mixing represent the central procedures involved in the production LCA
[75][76][77]. An evaluation of vehicle and construction machinery emissions forms the basis of the
transport/application LCA [78].
The mass and energy inputs and outputs to each process have been documented as part of Figure 26 and
27.
Engineering Strategies and Practices
38
Figure 26. Life cycle assessment diagram (LCAD) for the main roadway and bridge construction materials.
Engineering Strategies and Practices
39
Figure 27. LCAD for various transport and construction efforts on site.
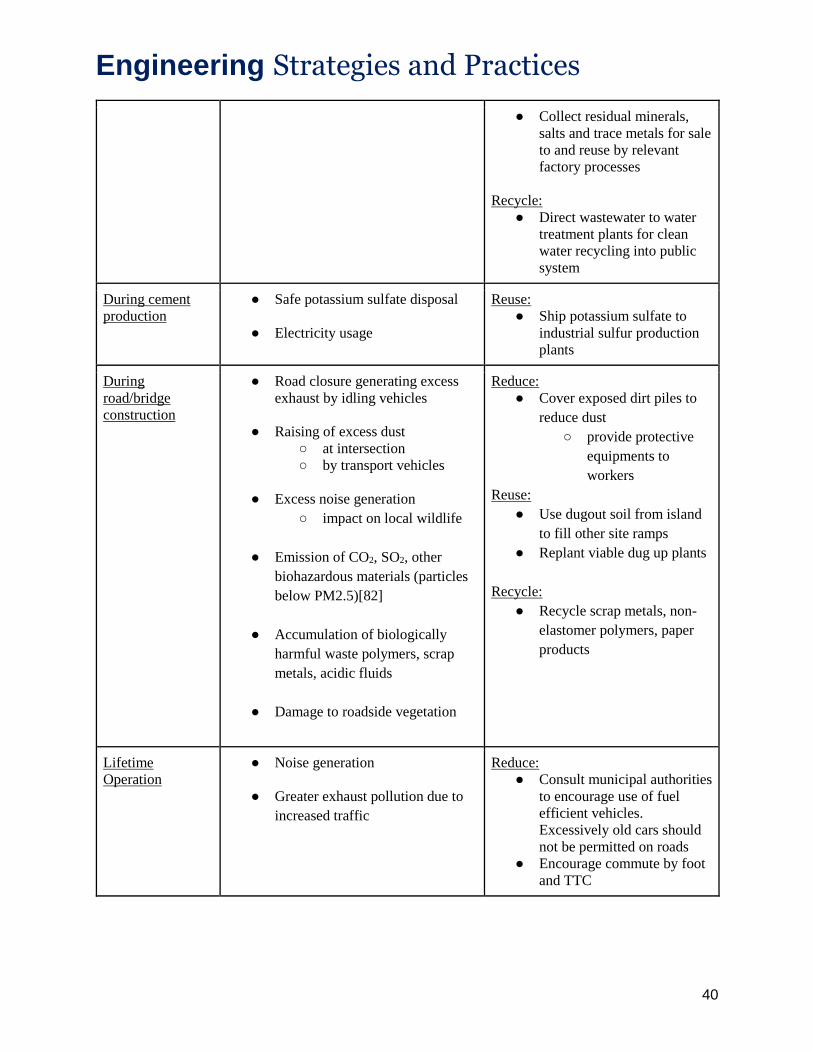
Impact and Improvement Analysis
The results of this analysis have been summarized in Table 6, following the principles of the three R’s - to
reduce, reuse, and recycle.
Table 6. Environmental Impacts
Design
Production/Oper
ation Element
Potential Environmental Impact Impact Mitigation
During asphalt
production ● Hazardous residuals disposal
● High electricity consumption
● Pollutant wastewater discharge
Reduce: ● Avoid unnecessary
electricity usage. Manage
idling equipment to
minimize operation during
downtime
Reuse:
Engineering Strategies and Practices
40
● Collect residual minerals,
salts and trace metals for sale
to and reuse by relevant
factory processes
Recycle: ● Direct wastewater to water
treatment plants for clean
water recycling into public
system
During cement
production ● Safe potassium sulfate disposal
● Electricity usage
Reuse: ● Ship potassium sulfate to
industrial sulfur production
plants
During
road/bridge
construction
● Road closure generating excess
exhaust by idling vehicles
● Raising of excess dust
○ at intersection
○ by transport vehicles
● Excess noise generation
○ impact on local wildlife
● Emission of CO2, SO2, other
biohazardous materials (particles
below PM2.5)[82]
● Accumulation of biologically
harmful waste polymers, scrap
metals, acidic fluids
● Damage to roadside vegetation
Reduce: ● Cover exposed dirt piles to
reduce dust
○ provide protective
equipments to
workers
Reuse:
● Use dugout soil from island
to fill other site ramps
● Replant viable dug up plants
Recycle:
● Recycle scrap metals, non-
elastomer polymers, paper
products
Lifetime
Operation ● Noise generation
● Greater exhaust pollution due to
increased traffic
Reduce: ● Consult municipal authorities
to encourage use of fuel
efficient vehicles.
Excessively old cars should
not be permitted on roads
● Encourage commute by foot
and TTC
Engineering Strategies and Practices
41
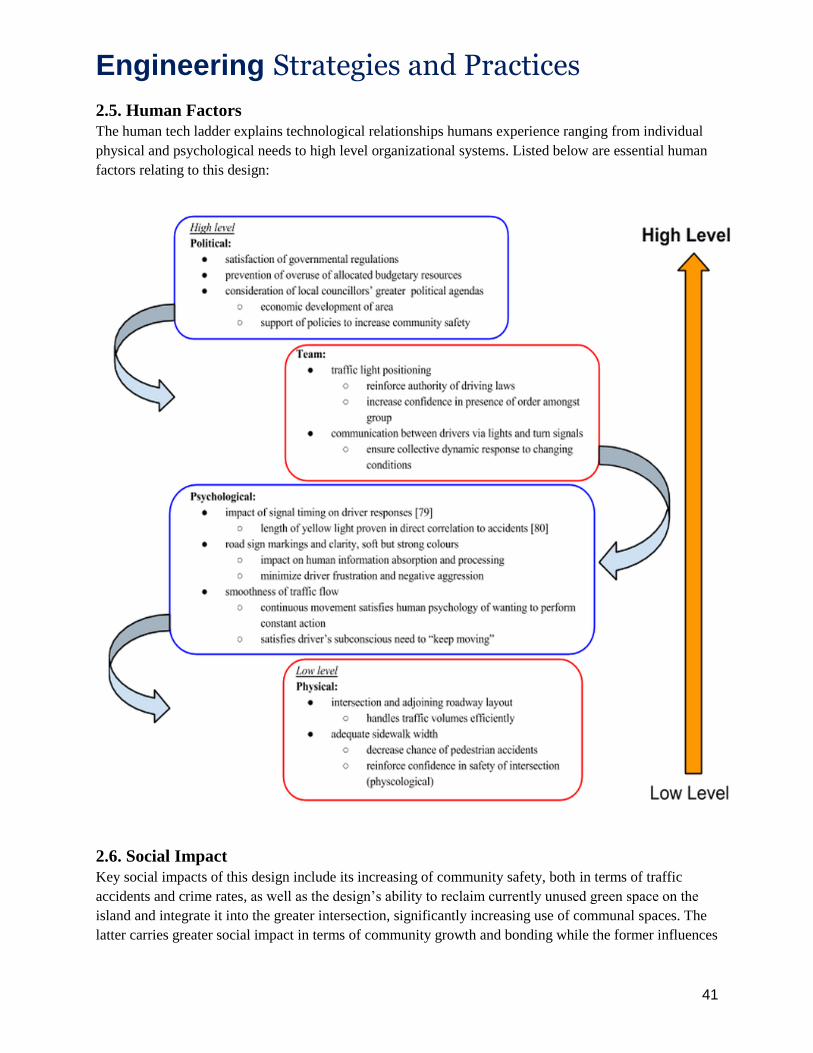
2.5. Human Factors
The human tech ladder explains technological relationships humans experience ranging from individual
physical and psychological needs to high level organizational systems. Listed below are essential human
factors relating to this design:
2.6. Social Impact
Key social impacts of this design include its increasing of community safety, both in terms of traffic
accidents and crime rates, as well as the design’s ability to reclaim currently unused green space on the
island and integrate it into the greater intersection, significantly increasing use of communal spaces. The
latter carries greater social impact in terms of community growth and bonding while the former influences

Engineering Strategies and Practices
42
primarily practical social concerns.
Significant efforts have been placed throughout the design process to maximize positive social impacts,
however, balancing them amongst stakeholders has led to several tradeoffs. Most significantly, the
design’s requirement to expropriate the north-eastern portion of the Money Mart parking lot in order to
regularize the intersection has led to large improvements in safety and accessibility for local residents and
commuters. However, this business will nonetheless experience a loss of parking space for customers and
thus experience a negative impact.
This impact has been balanced by increasing the overall number of passersby through the intersection,
and thus the number of potential customers, in order to offset the loss of revenue due to inconvenienced
customers who no longer have as much room to park.
Conversely, the design has a double positive social impact on the TTC and local NGOs. By increasing the
efficiency of the intersection and reducing idling times, CO2 emissions have been lowered while speeding
up transit through the crossroads. This works to satisfy both local environmental NGOs and the TTC.
Lastly, the design offers a boost to the community’s image and cultural significance within Toronto. By
increasing the intersection’s openness and reinforcing it as a gateway into the Western half of old Toronto
through the construction of the gateway bridge atop the island dugout, it bolsters community consensus to
create a less foreboding and more welcoming environment.
2.7. Economics
Table 7. Costs of Design Implementation
Capital Costs Operating Costs* (Fixed
and Variable)
Disposal Costs
● concrete application
costs[81]
● asphalt application
● sewer line modification
● integrating electrical
systems to main power
grid
● traffic signal lights and
roadway signage
procuration
● potted vegetation
● bus shelters, water
features, guardrails
● site survey
● construction workers’
wages
● equipment rental
○ excavator
○ road roller
○ crane
○ totalling station
○ bulldozer, dump
trucks
○ levelling
set/measuring
instruments
● maintenance of road
● waste management costs
(disposal of asphalt,
concrete) when
decommissioned
● grafting or eliminating
existing vegetation
● re-modifying
underground sewer lines
●
● filling island ramp

Engineering Strategies and Practices
43
● gateway bridge
construction
● park expansion
○ winter
maintenance
○ pothole filling
○ erosion
prevention
● maintenance of park
○ watering
○ grass cutting,
tree trimming
○ garbage
collection
*operation of the design will overlap with construction (primarily capital) costs, and some have therefore
been merged
External (Indirect) Costs and Benefits borne by society:
Costs
● economic losses in productivity due to increased commute time during construction
● cost dealing with pollutants (dust, noise, hazardous wastes) during construction
● treatment of wastewater runoff
Benefits
● increases jobs available for skilled workers
● economic benefits due to greater commuter flow
Engineering Strategies and Practices
44
Cost breakdown of the design:
3.0 Updated Project Management Plan
Following finalization of the Final Design Specification (FDS) on April 1st, the team will prepare for the
final presentation on April 27th. The presentation outline and preparation of visual aids will be done by
April 24th. During the next team meeting on April 8th, the team will assign final presentation components
to each participating team member.
Engineering Strategies and Practices
45
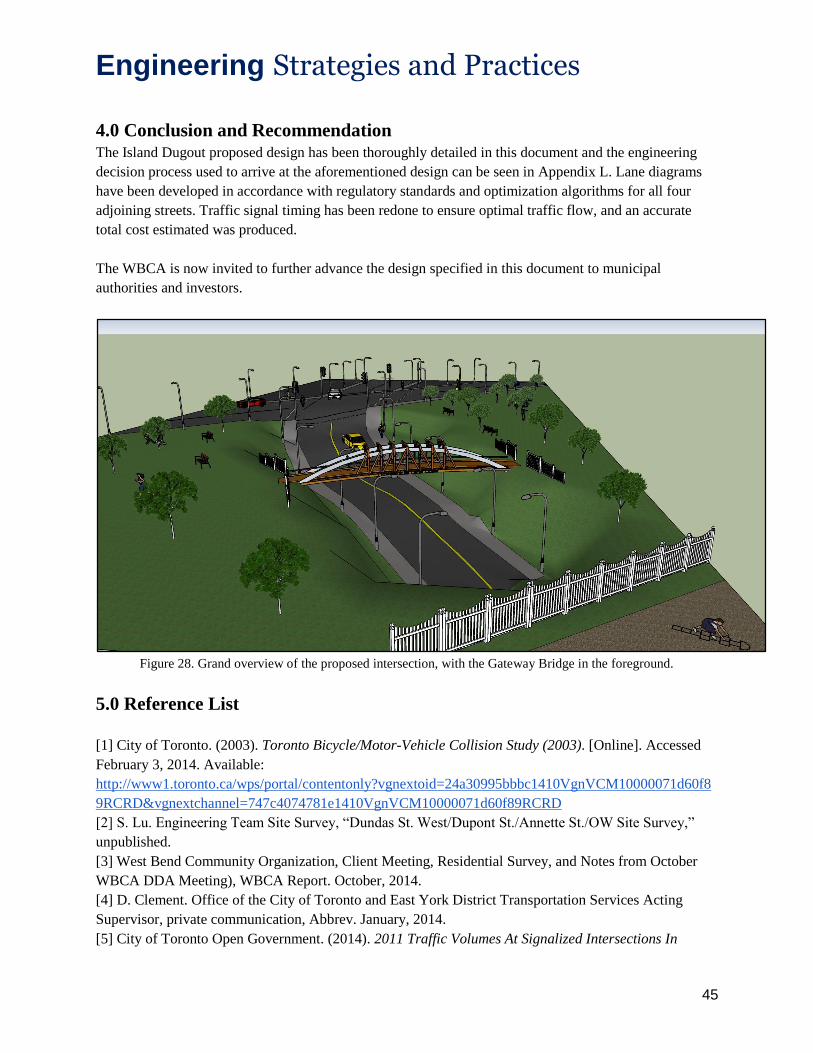
4.0 Conclusion and Recommendation
The Island Dugout proposed design has been thoroughly detailed in this document and the engineering
decision process used to arrive at the aforementioned design can be seen in Appendix L. Lane diagrams
have been developed in accordance with regulatory standards and optimization algorithms for all four
adjoining streets. Traffic signal timing has been redone to ensure optimal traffic flow, and an accurate
total cost estimated was produced.
The WBCA is now invited to further advance the design specified in this document to municipal
authorities and investors.
Figure 28. Grand overview of the proposed intersection, with the Gateway Bridge in the foreground.
5.0 Reference List
[1] City of Toronto. (2003). Toronto Bicycle/Motor-Vehicle Collision Study (2003). [Online]. Accessed
February 3, 2014. Available:
http://www1.toronto.ca/wps/portal/contentonly?vgnextoid=24a30995bbbc1410VgnVCM10000071d60f8
9RCRD&vgnextchannel=747c4074781e1410VgnVCM10000071d60f89RCRD
[2] S. Lu. Engineering Team Site Survey, “Dundas St. West/Dupont St./Annette St./OW Site Survey,”
unpublished.
[3] West Bend Community Organization, Client Meeting, Residential Survey, and Notes from October
WBCA DDA Meeting), WBCA Report. October, 2014.
[4] D. Clement. Office of the City of Toronto and East York District Transportation Services Acting
Supervisor, private communication, Abbrev. January, 2014.
[5] City of Toronto Open Government. (2014). 2011 Traffic Volumes At Signalized Intersections In

Engineering Strategies and Practices
46
Toronto. [Online]. Accessed February 3, 2014. Available:
https://www.google.com/fusiontables/DataSource?docid=1WK2kZZogEfdDd7SwXg4gfKlb-
eGChnJZpKpEfa7u#map:id=3
[6] City of Toronto, “Dovercourt-Wallace Emerson-Junction (93) Neighbourhood Profile,” Toronto
Administration on Social Policy Analysis & Research, Social Development and Finance., Toronto,
Ontario, Profile #1, May. 2012. Available:
http://www1.toronto.ca/City%20Of%20Toronto/Social%20Development,%20Finance%20&%20Adminis
tration/Neighbourhood%20Profiles/pdf/2011/pdf1/cpa93.pdf
[7] City of Toronto, “High Park North (88) Neighbourhood Profile,” Toronto Administration on Social
Policy Analysis & Research, Social Development and Finance., Toronto, Ontario, Profile #1, May. 2012.
Available:
http://www1.toronto.ca/City%20Of%20Toronto/Social%20Development,%20Finance%20&%20Adminis
tration/Neighbourhood%20Profiles/pdf/2011/pdf1/cpa88.pdf
[8] City of Toronto, “Junction Area (90) Neighbourhood Profile,” Toronto Administration on Social
Policy Analysis & Research, Social Development and Finance., Toronto, Ontario, Profile #1, May. 2012.
Available:
http://www1.toronto.ca/City%20Of%20Toronto/Social%20Development,%20Finance%20&%20Adminis
tration/Neighbourhood%20Profiles/pdf/2011/pdf1/cpa90.pdf
[9] Metrolinx. Metrolinx Overview. Online. Available: http://www.metrolinx.com/en/
[10] City of Toronto. Construction Requirements and Guidelines. Online. Available:
http://www1.toronto.ca/wps/portal/contentonly?vgnextoid=5b930187974f0410VgnVCM10000071d60f89
RCRD&vgnextchannel=75461ba53b450410VgnVCM10000071d60f89RCRD
[11] Toronto Transit Commission. Online. Available: http://www.ttc.ca/
[12]City of Toronto. StreetARToronto and Metrolinx: Dupont/Annette/Dundas Junction. Online.
Available:
http://www1.toronto.ca/City%20Of%20Toronto/Transportation%20Services/Beautiful%20Streets/Graffiti
/pdf/METROLINX%20-REOI%20DundasAnnetteDupont.pdf
[13] City of Toronto. Partnership Program: StreetRToronto. Online. Available:
http://www1.toronto.ca/wps/portal/contentonly?vgnextoid=b33498b613412410VgnVCM10000071d60f8
9RCRD
[14] Toronto Environmental Alliance. 2014. Greenbelting Toronto. Online. Available:
http://www.torontoenvironment.org/campaigns/greenbelt
[15] Cycle Toronto: Vic.Aug, 20, 2009. New Cycling Mural at Dupont and Dundas. Online. Available:
http://www.ibiketo.ca/blog/2009/08/20/new-cycling-mural-dupont-and-dundas
[16] Nature Hills Nursery. Online. Available: http://www.naturehills.com/trees
[17] City of Toronto. About MCIC [Online]. Available: http://www1.toronto.ca/wps/portal/contentonly?vgnextoid=40c2a58e82cc1410VgnVCM10000071d60f89
RCRD&vgnextchannel=fddd410becbc1410VgnVCM10000071d60f89RCRD [18] Brown and Storey. Exploring Development Alternatives. Online Available:
http://www.brownandstorey.com/exploring-rail-adjacent-development-alternatives/
[19] City of Toronto. (2013). Fort York Pedestrian and Cycle Bridge and Ordnance Master Plan (2013).
[Online]. Accessed Feb 3, 2014. Available:
http://www.toronto.ca/legdocs/mmis/2014/pw/bgrd/backgroundfile-65548.pdf [20] Manitoba. (2015). The Expropriation Act (2015). [Online]. Accessed Feb 3, 2014. Available:
http://web2.gov.mb.ca/laws/statutes/ccsm/e190e.php
Engineering Strategies and Practices
47
[21] City of Toronto. (2015). Danforth Avenue Improvements (2015). [Online]. Accessed Feb 3, 2014.
Available:
http://www1.toronto.ca/wps/portal/contentonly?vgnextoid=de32b9bd23805410VgnVCM10000071d60f8
9RCRD [22] Traffic volume over 24 hours [Online]. Available:
http://www.theglobeandmail.com/static/national/toronto/congestion/index.html?id=2 [23] Bright Hub Engineering. (2010). Concrete Roads Vs Asphalt Roads (2010). [Online]. Accessed Feb
3, 2014. Available: http://www.brighthubengineering.com/concrete-technology/45858-concrete [24] M. Corbett, D. Levinson, X. Zou., “Benefit-Cost Analysis for Intersection Decision Support,” in
Developing Intersection Decision Support Solutions, rep. 5. Minneapolis, Minnesota: Minnesota Department of Transportation, October 2007. Available: http://www.lrrb.org/media/reports/200732.pdf [25] ACE Library. (2013). Experimental Analysis of Single- Lane Roundabouts Slip Lanes: Fuel
Consumption and Emissions (2013). [Online]. Accessed Feb 3, 2014. Available:
http://ascelibrary.org/doi/pdf/10.1061/9780784413197.020 [26] West Bend Community Association. (2014). Noise Wall Installation Update (2014). [Online].
Accessed Feb 3, 2014. Available:
https://docs.google.com/file/d/0B5er_5T5NY7pYklablQ0eXRVa2c/edit [27] toronto.ca. Construction Requirements and Guidelines. Online. Available: http://www1.toronto.ca/wps/portal/contentonly?vgnextoid=5b930187974f0410VgnVCM10000071d60f89
RCRD&vgnextchannel=75461ba53b450410VgnVCM10000071d60f89RCRD
[28] Toronto Municipal Code. Chapter 591 Noise. Online. Available:
http://www.toronto.ca/legdocs/municode/1184_591.pdf
[29] city of Toronto. Pavement Structural Design Guideline summary. Online. Available:
http://www1.toronto.ca/city_of_toronto/engineering_and_construction_services/standards_policies__qual
ity/files/pdf/pavement_structural_design_summary.pdf [30] city of Toronto. Pavement Structural Design Matrix. Online. Available: http://www1.toronto.ca/city_of_toronto/engineering_and_construction_services/standards_policies__qual
ity/files/pdf/pavement_structural_design_matrix.pdf [31] Ontario. Ontario Provincial Standards for Roads and Public Works. Online. Available: http://www.raqsa.mto.gov.on.ca/techpubs/ops.nsf/OPSHomepage [32] Ontario. Highway Traffic Act. Online. Available http://www.e-laws.gov.on.ca/html/statutes/english/elaws_statutes_90h08_e.htm [33] Justice Laws Website. Motor Vehicle Safety Act. Online. Available:
http://laws-lois.justice.gc.ca/eng/acts/M-10.01/
[34] Justice Laws Website. Motor Vehicle Transport Act. Online. Available: http://laws-
lois.justice.gc.ca/eng/acts/m-12.01/
[35] D. Clement. Office of the City of Toronto and East York District Transportation Services Acting
Supervisor, private communication, Abbrev. January, 2014. [36]Transportation Services - Traffic Management Centre. Traffic Signals Tabular [Online].
Available:http://www1.toronto.ca/wps/portal/contentonly?vgnextoid=965b868b5535b210VgnVCM10000
03dd60f89RCRD&vgnextchannel=7807e03bb8d1e310VgnVCM10000071d60f89RCRD [37]The Climate and Weather of Toronto, Ontario [Online]. Available: http://www.livingin-
canada.com/climate-toronto.html [38] The City of Toronto.(2011, Dec). Toronto’s Future Weather and Climate Driver Study [Online].
Available:
http://www1.toronto.ca/city_of_toronto/environment_and_energy/key_priorities/files/pdf/tfwcds-full-
report.pdf [39]Ontario Ministry of the Environment and Climate Change. Toronto West: AQI for 2014 [Online].
Available:

Engineering Strategies and Practices
48
http://www.airqualityontario.com/reports/aqisearch.php?stationid=35125&show_day=0&start_year=2014
&submitter=Get+AQI+Readings [40]Statistics Canada.(2011). City of Toronto Ward Profiles [Online]. Available:
http://www1.toronto.ca/City%20Of%20Toronto/City%20Planning/Wards/Files/pdf/W/Ward%2018%20P
rofile%202011.pdf [41] West Bend Community Association. (2014). About the West Bend Community Association. [Online].
Accessed February 3, 2014. Available: http://www.thewestbend.ca/#!about/cjg9 [42] City of Toronto (2015).Highland Creek Village Transportation Master Plan [Online]. Available: https://wx.toronto.ca/inter/pmmd/callawards.nsf/8f833e980fde75cf85257a77004a025b/f8bdcbb7cde79ee
985257bd00067422d?OpenDocument&ExpandSection=1 [43] City of Toronto (2015). Highland Creek Village Area Study [Online]. Available: http://www1.toronto.ca/wps/portal/contentonly?vgnextoid=e73452cc66061410VgnVCM10000071d60f89
RCRD [44]Google Map(2015). Highland Creek Village TMP Study Area [Online]. Available: https://www.google.com/maps/d/viewer?mid=z52df8RNgxpU.k93abF7n_q7Y [45]City of Toronto (2015). City-Initiated Highland Creek Village Area Study - Final Report [Online].
Available: http://app.toronto.ca/tmmis/viewAgendaItemHistory.do?item=2012.SC20.35 [46]City of Toronto (2015). Danforth Avenue Improvements [Online]. Available:
http://www1.toronto.ca/wps/portal/contentonly?vgnextoid=de32b9bd23805410VgnVCM10000071d60f8
9RCRD [47]City of Toronto (2015). Traffic Regulations – Area Bounded by Danforth Avenue, Main Street, Lumsden Avenue, and Dawes Road [Online]. Available: http://www.toronto.ca/legdocs/mmis/2014/te/bgrd/backgroundfile-71859.pdf [48] City of Toronto (2015). Fort York Pedestrian and Cycle Bridge and Ordnance Triangle Master Plan - Status Update [Online]. Available: http://www.toronto.ca/legdocs/mmis/2014/pw/bgrd/backgroundfile-65548.pdf [49]City of Toronto. Privately Owned Trees [Online]. Available: http://www1.toronto.ca/wps/portal/contentonly?vgnextoid=c059bec88f561410VgnVCM10000071d60f89
RCRD [50]City of Toronto. Toronto Municipal Code Chapter 813 - Trees [Online]. Available: http://www.toronto.ca/legdocs/municode/1184_813.pdf [51] Michael Cook. Explored Sewerage, Toronto [Online]. Available:
http://www.vanishingpoint.ca/toronto-sewers [52]City of Toronto. Appendix B - Land Use - Official Plan and Zoning Bylaw Maps [Online]. Available: http://www1.toronto.ca/city_of_toronto/policy_planning_finance__administration/public_consultation_un
it/toronto_water/northsouth_watermain/files/pdf/appendix_b.pdf [53]City of Toronto. Toronto Zoning Bylaw 438-86 [Online]. Available: http://www1.toronto.ca/wps/portal/contentonly?vgnextoid=6dac3f8a7d6c1410VgnVCM10000071d60f89
RCRD&vgnextchannel=75461ba53b450410VgnVCM10000071d60f89RCRD [54]City of Toronto. Development Charges [Online]. Available: http://www1.toronto.ca/wps/portal/contentonly?vgnextoid=a90b285441f71410VgnVCM10000071d60f89
RCRD [55]City of Toronto. CITY OF TORONTO BY-LAW No. 1347-2013 [Online]. Available: http://www.toronto.ca/legdocs/bylaws/2013/law1347.pdf [56]City of Toronto. Traffic Conditions and Restrictions [Online]. Available: http://www1.toronto.ca/wps/portal/contentonly?vgnextoid=0c9c4074781e1410VgnVCM10000071d60f89
RCRD [57] Ontario Provincial Standards. About OPS [Online]. Available: http://www.ops.on.ca/ [58] Toronto Maps v2 [Online]. Available:http://map.toronto.ca/maps/map.jsp?app=TorontoMaps_v2
Engineering Strategies and Practices
49
[59]CBC. Toronto Live Traffic Map [Online]. Available: http://www.cbc.ca/toronto/features/traffic/ [60] Ontario Ministry of Transportation. A Guide to Oversize/overweight Vehicles and Loads in Ontario
[Online]. Available: http://www.mto.gov.on.ca/english/trucks/oversize/guide.shtml#weight [61] Ministry of Highways and Infrastructure. Vertical and Horizontal Clearance of Structures on the
Provincial Highway System [Online]. Available:
http://www.highways.gov.sk.ca/adx/aspx/adxGetMedia.aspx?DocID=735%2C140%2C1%2CDocuments
&MediaID=8666&Filename=Bridge+and+Structural+Clearance+Tables_Jan06_15.pdf
[62] City of Toronto. Accessibility Design Guidelines [Online]. Available:
<https://www1.toronto.ca/static_files/equity_diversity_and_human_rights_office/pdf/accessibility_design
_guidelines.pdf>
[63] S. Stofka (2013, September 3). Width, And the Perception of Width. [Online]. Available:
http://www.strongtowns.org/journal/2013/9/3/width-and-the-perception-of-width.html
[65]City of Brampton(2002). Brampton PathWays – Planning and Design Guidelines. [Online].
Available:https://www.brampton.ca/en/Business/planning-
development/Documents/CD/ParksPl/Pathways%20Master%20Plan,%20Vol.%202%20%28Design%20
Guidelines%29.pdf
[66] Transportation Services Division Traffic Data Centre and Safety Bureau (2007). City of Toronto
Pedestrian Collision Study. [Online]. Available:
http://www1.toronto.ca/City%20Of%20Toronto/Transportation%20Services/Walking/Files/pdf/ped_colli
sion_study-full_report.pdf
[67]Chief Administrator’s Office(2004). City of Toronto Accessibility Design Guidelines. [Online].
Available:
https://www1.toronto.ca/static_files/equity_diversity_and_human_rights_office/pdf/accessibility_design_
guidelines.pdf
[68]M. K. HURD. Short-span arch bridges. [Online]. Available:
http://concreteconstruction.net/Images/Short-Span%20Arch%20Bridges_tcm45-341968.pdf
[69]U.S. Department of Transportation(2010). roundabout. [online] Available:
http://safety.fhwa.dot.gov/intersection/roundabouts/fhwasa10006/
[70]U.S.POSTAGE(2000, May 13). Insurance Institute for Highway Safety State Report. [online]
Available: https://www.k-state.edu/roundabouts/news/sr3505.pdf
[71]U.S. Department of Transportation(2000). Roundabouts: An Informational Guide. [online] Available:
http://www.fhwa.dot.gov/publications/research/safety/00067/000672.pdf
[72]Washington State Department of Transportation (2015). Roundabout Benefits. [Online] Available:
http://www.wsdot.wa.gov/Safety/roundabouts/benefits.htm
[73] Federal Highway Administration(2000, June). Roundabouts: An Information Guide. FHWA-RD-00-
67 , Exhibit 5.2, pp 106, Washington, DC.[online] Available: www.tfhrc.gov/safety/00068.htm
[74]City of Toronto. Road Repairs. [online] Available:
http://www1.toronto.ca/wps/portal/contentonly?vgnextoid=b077a84c9f6e1410VgnVCM10000071d60f89
RCRD
[75]Franklin Associates(2001). A life cycle inventory for road and roofing asphalt. [Online]. Available:
http://calculatelca.com/wp-
content/themes/athena/images/LCA%20Reports/Road_And_Roofing_Asphalt.pdf
[76] University of California(2010). Pavement Life Cycle Assessment Workshop. [Online]. Available:
http://www.ucprc.ucdavis.edu/P-LCA/pdf/plca_document_draft_web.pdf

Engineering Strategies and Practices
50
[77]Sophia Lisbeth Hsu(2010). Life Cycle Assessment of Materials and Construction in Commercial
Structures: Variability and Limitations. [Online]. Available: http://web.mit.edu/cron/project/concrete-
sustainability-hub/Literature%20Review/Building%20Energy/Thesis/Libby%20Hsu%20Thesis.pdf
[78]Suvo(/2010, August 17). Concrete Roads vs Asphalt Roads. [Online]. Available:
http://www.brighthubengineering.com/concrete-technology/45858-concrete-roads-vs-asphalt-roads/
[79]S. Lawrence Paulson. Managing Traffic Flow Through Signal Timing. [Online]. Available:
http://www.fhwa.dot.gov/publications/publicroads/02janfeb/timing.cfm
[80]Virginia Tech(2012, Sep 11). Length of yellow caution traffic lights could prevent accidents: study.
[Online]. Available: http://phys.org/news/2012-09-length-yellow-caution-traffic-accidents.html
[81] Highway, railroad and roadbed construction.[Online]. Available: http://www.ibslhk.com/AS-web-
highway.htm
[82]The City of Barrie (2014). New Road.[Online]. Available:
http://www.barrie.ca/assets/engineering/nov2010/Appendix%20L%20-%20Costs%20per%20metre.pdf
[83]Federal Highway Administration(2014). Designing Sidewalks and Trails for Access.[Online].
Available:http://www.fhwa.dot.gov/environment/bicycle_pedestrian/publications/sidewalks/chap4a.cfm
[84]Invest Toronto(2014).Toronto-Cost-Advantages.
[Online]. Available: http://www.investtoronto.ca/Toronto-Cost-Advantages/Real-Estate.aspx
[85]Ministry of Transportation and Infrastructure(2012). Construction and Rehabilitation Cost Guide.
[Online]. Available: http://www.th.gov.bc.ca/publications/const_maint/Cost_Guide_July2012.pdf
[86]California department of Transportation(2011). Intersection Improvement Project. [Online].
Available:http://www.dot.ca.gov/dist6/environmental/projects/sr145jensen/
[87] Indiana University-Purdue University Fort Wayne (2009, December 11). Design of a
Pedestrian Bridge Crossing over Coliseum Boulevard. [Online]. Available:
https://www.ipfw.edu/dotAsset/239460.pdf
[88] Karin Derkley(2014, August 3). Why do roadworks cost so much. [Online]. Available:
http://www.theage.com.au/victoria/why-do-roadworks-cost-so-much-20140802-zzl87.html
[89] Mark Lenters(2003). Roundabout Planning and Design for Efficiency & Safety Case Study:
Wilson Street/Meadowbrook Drive/Hamilton Drive - City Of Hamilton. [Online].
Available:http://conf.tac-
atc.ca/english/resourcecentre/readingroom/conference/conf2003/pdfs/lenters1.pdf
[90]Stephen Glaister(2006). Investing in Roads: Pricing, Costs and New Capacity- Table 16. [Online].
Available: http://www.rudi.net/files/iir_main.pdf
[91]Transforming Ottawa(2010). Greenbank Road widening (Malvern to Strandherd). [Online].
Available:http://ottawa.ca/en/city-hall/planning-and-development/transforming-ottawa/greenbank-road-
widening-malvern-strandherd
[92] Brendan Wedley(2013, March 8). Chemong Rd. widening could cost $17.7 million, with city buying
up to 16 homes. [Online]. Available:
http://www.thepeterboroughexaminer.com/2013/03/08/chemong-rd-widening-could-cost-177-million-
with-city-buying-up-to-16-homes
[93]streetmix. [Online]. Available: http://streetmix.net/-/207082
[94]City of Toronto. Potholes. [Online]. Available:
http://www1.toronto.ca/wps/portal/contentonly?vgnextoid=db67a84c9f6e1410VgnVCM10000071d60f89
RCRD&vgnextchannel=9afb4074781e1410VgnVCM10000071d60f89RCRD

Engineering Strategies and Practices
51
[95]Wikipedia(2014). Toronto Transportation Services. [Online]. Available:
http://en.wikipedia.org/wiki/Toronto_Transportation_Services
[96]Don Peat(2014, March 11). Toronto plowing through snow removal budget. [Online]. Available:
http://www.torontosun.com/2014/03/11/toronto-plowing-through-snow-removal-budget
[97] Engineering Policy Guide. 234.2 Diamond Intersections [Online]. Available:
<http://epg.modot.org/index.php?title=234.2_Diamond_Interchanges>.
[98] Google Maps. 2665-2715 Dundas St W, Toronto, ON M6P 1Y2 [Online]. Available:
<https://www.google.ca/maps/dir/43.6649151,-79.460112/43.6637062,-79.4574935/@43.6645155,-
79.4594414,17z/data=!4m2!4m1!3e2>
[99] aqua-calc. Density in 285 Measurement Units [Online]. Available:
<http://www.aqua-calc.com/page/density-table/substance/concrete-coma-and-blank-asphalt>
[100] virginia.gov. Adjustment for Asphalt and Fuel Indices [Online]. Available:
<http://www.virginiadot.org/business/const/indices-asphalt.asp>.
[101] City of Toronto. Vehicle Travel Lane Width Guidelines [Online]. Available:
<http://www1.toronto.ca/City%20Of%20Toronto/Engineering%20and%20Construction%20Services/Sta
ndards%20and%20Specifications/Files/pdf/Road%20Design%20Guidelines/Vehicle_Travel_Lane_Width
_Guidelines_Jan2015.pdf>
[102] SteelConstruction.info. Bridges-initial design [Online]. Available:
<http://www.steelconstruction.info/Bridges_-_initial_design>.
[103] GSI Highway Products. Highway Guardrails [Online]. Available:
<http://gsihighway.com/guardrails.html>
[104] transportation.alberta.ca. Capital Costs for Roadside/Median Barrier Systems [Online]:
<http://www.transportation.alberta.ca/Content/docType233/Production/RDGmeridian.pdf>
[105] ConcreteNetwork.com. Concrete Price Considerations [Online]. Available:
<http://www.concretenetwork.com/concrete-prices.html>.
[106] Metric Conversions. Area Converter [Online]. Available:
<http://www.metric-conversions.org/area-conversion.htm/>.
[107] Colostate.edu Russian Hawthorne (Crataegus ambigua) [Online]. Available:
<http://www.colostate.edu/Dept/CoopExt/4DMG/Trees/russian.htm>.
[108] Tooley’s Trees. Ken’s Prices Delivery Draft [Online]. Available:
<http://tooleystrees.com/kens-prices-delivery-draft>.
[109] O’Brien Horticulture Common Hawthorne [Online]. Available:
<http://www.treeandlandscape.ie/Tree-A-Z/common-hawthorn-crataegus-monogyna.html>
[110] Dave’s Garden. Plantfiles: Russian Hawthorne [Online]. Available:
<http://davesgarden.com/guides/pf/go/79270/#b>.
[111] SFGATE. Hawthorne Tree Facts [Online]. Available:
<http://homeguides.sfgate.com/hawthorne-tree-56689.html>.
[112] TAKE THE HIGH ROAD. The Confederation Bridge [Online]. Available:
<http://www.confederationbridge.com/about/confederation-bridge.html>.
[113] The Lawn King. Lawn Mowing [Online]. Available:
<http://www.thelawnking.com/lawn-mowing.html>.
[114] houzz. How Much are you Spending in Water Bill for your Lawn/Garden? [Online]. Available:
<http://forums2.gardenweb.com/discussions/1513362/how-much-are-you-spending-in-water-bill-for-
your-lawn-garden>.
Engineering Strategies and Practices
52
[115] gov.bc.ca. Supplement to CHBDC S6-06 [Online]. Available:
<http://www.th.gov.bc.ca/publications/eng_publications/bridge/standards/BSM-Volume-
1_2007/BSM_Vol_1_Sec_01_Aug_2007.pdf>.
[116] Ontario Ministry of the Environment and Climate Change. Fine Particulate Matter [Online].
Available: <http://www.airqualityontario.com/science/pollutants/particulates.php>.
[117] ASTM International. Road Standards and Paving Standards [Online]. Available:
<http://www.astm.org/Standards/road-and-paving-standards.html>.
[118] Pavement Interactive. Durability and Soundness [Online]. Available:
<http://www.pavementinteractive.org/article/durability-and-soundness/>.
[119] Canada’s Road Safety Strategy 2015. Road Safety Measures [Online]. Available:
<http://ccmta.ca/crss-2015/search-initiatives.php?action=s&type%5B%5D=c&keyword=safety>
[120] British Columbia Construction and Rehabilitation Cost Guide [Online]. Available:
<http://www.th.gov.bc.ca/publications/const_maint/110121_Cost_Guide.pdf>.
[121]City of Toronto. Vehicle Travel Lane Width Guidelines. Online.
Available:https://dl.dropboxusercontent.com/u/10524076/Lane_width.html
[122]Serviceontario. Environmental Protection Act. Online. Available:http://www.e-
laws.gov.on.ca/html/regs/english/elaws_regs_040153_e.htm
[123] Road vehicles - Collision classification - Terminology, ISO 6813, 1998.
[124]Commercial road vehicles - Dimensional codes, ISO 7656, 1993.
[125]Road vehicles - Objective rating metric for non-ambiguous signals, ISO/TS 18571, 2014.
[126]Road construction and maintenance equipment - Road milling machinery - Terminology
and commercial specifications, ISO 15645, 2002.
[127]Road construction and maintenance equipment - Soil stabilizers - Terminology and
commercial specifications, ISO 15688, 2012.
[128]Road construction and maintenance equipment - Asphalt pavers - Terminology and commercial
specifications, ISO 15878, 2008.
[129]The United State Patent and Trademark Office.
Manual of Patent Examining Procedure: 2144. Online. Available:
http://www.uspto.gov/web/offices/pac/mpep/s2144.html
[130]European Patent Office. Guidelines for Examination.
Online. Available:http://www.epo.org/law-practice/legal-texts/html/guidelines/e/g_vii_3_1.htm
[131]Bitlaw. March 2014. 2144.03 Reliance on Common Knowledge
in the Art or “Well Known” Prior Art. Online.
Available:http://www.bitlaw.com/source/mpep/2144_03.html [132]LegalZoom. What can be patent. Online.
Available:https://www.legalzoom.com/knowledge/patent/topic/what-is-patentable
[133]Patent US8840717. Asphalt modifiers for “warm mix” applications including adhesion promoter.
Online. Available:http://www.google.com/patents/US8840717
[134]Patent US7981952. Warm mix asphalt binder compositions containing lubricating additives. Online.
Available http://www.google.com/patents/US7981952
[135]Patent US5296025. Process and device for preparing an asphalt mix. Online.
Available:http://www.google.ca/patents/US5296025
[136]Petra Turnbull. Stages in Road Construction. Online.
Available:http://www.ehow.com/info_8645892_stages-road-construction.html

Engineering Strategies and Practices
53
[137]Toronto. Vehicle Travel Lane Width Guidelines. Online.
Available:http://www1.toronto.ca/City%20Of%20Toronto/Engineering%20and%20Construction%20Ser
vices/Standards%20and%20Specifications/Files/pdf/Road%20Design%20Guidelines/Vehicle_Travel_La
ne_Width_Guidelines_Jan2015.pdf
[138]FHWA. Bicycle Lanes. Online.
Available:http://safety.fhwa.dot.gov/ped_bike/univcourse/pdf/swless19.pdf
[139]Gary Long. Jan.9th.2013. Acceleration Characteristics of Starting Vehicles. Online.
Available:http://www.dot.state.fl.us/rail/Publications/Studies/Safety/AccelerationResearch.pdf
[140]Frederik R. Steiner, Kent Butler. Planning and Urban Design Standards. Online.
Available:https://books.google.ca/books?id=NXpncFYj73QC&pg=PA147&lpg=PA147&dq=walking+sp
eed+for+people+on+wheelchairs&source=bl&ots=L3cVbXFNcM&sig=SDa1EiI5tdlAZN9MyW0va3Lsq
4c&hl=en&sa=X&ei=W3wTVb77NIecgwSauYPoBw&ved=0CDUQ6AEwBA#v=onepage&q=walking
%20speed%20for%20people%20on%20wheelchairs&f=false
[141]National Motorists Association Foundation. Yellow Light Time standard. Online.
Available:http://www.shortyellowlights.com/standards/
[142]Toronto. Accessible Pedestrian Signals(APS). Online.
Available:[http://www1.toronto.ca/wps/portal/contentonly?vgnextoid=4d18f5cf807e1410VgnVCM10000
071d60f89RCRD
[143]Toronto. Pedestrian Countdown Signals. Online.
Available:http://www1.toronto.ca/wps/portal/contentonly?vgnextoid=bcb7a84c9f6e1410VgnVCM10000
071d60f89RCRD&vgnextchannel=d90d4074781e1410VgnVCM10000071d60f89RCRD
[144]Patent US8104991. Method and composition for road construction and surfacing. Oline.
Available:https://www.google.ca/patents/US8104991?dq=road+construction&hl=en&sa=X&ei=SG4YVc
ChE6bnsASTvYK4DA&ved=0CBwQ6AEwAA
[145]Patent US7946788. Road construction machine, leveling device, as well as method for controlling
the milling depth or milling slope in a road construction machine. Online. Available:
https://www.google.ca/patents/US7946788?dq=road+construction&hl=en&sa=X&ei=SG4YVcChE6bns
ASTvYK4DA&ved=0CCMQ6AEwAQ
[146]Patent US3423859. Road construction methods and apparatus. Online. Available:
https://www.google.ca/patents/US3423859?dq=road+construction&ei=SG4YVcChE6bnsASTvYK4DA.
[147]Patent US8646167. Method of actuating a wireless sensor of road construction equipment. Online.
Available:
https://www.google.ca/patents/US8646167?dq=road+construction&hl=en&sa=X&ei=SG4YVcChE6bns
ASTvYK4DA&ved=0CDEQ6AEwAw.
[148]Patent US3437017. Reinforced concrete road construction. Online.
Available:https://www.google.ca/patents/US3437017?dq=road+construction&hl=en&sa=X&ei=SG4YVc
ChE6bnsASTvYK4DA&ved=0CDgQ6AEwBA]:
[149]Patent US2746365. Road Construction. Online.
Available:https://www.google.ca/patents/US2746365?dq=road+construction&hl=en&sa=X&ei=SG4YVc
ChE6bnsASTvYK4DA&ved=0CD8Q6AEwBQ]
[150]Patent US3784971. Digital system for controlling traffic signals. Online.
Available:https://www.google.ca/patents/US3784971?dq=traffic+signal&hl=en&sa=X&ei=OXkYVbDD
A7eBsQT6w4KIAw&ved=0CCMQ6AEwAQ]

Engineering Strategies and Practices
54
[151]Patent US4253083. Traffic signal system for blind people. Online.
Available:https://www.google.ca/patents/US4253083?dq=traffic+signal&hl=en&sa=X&ei=OXkYVbDD
A7eBsQT6w4KIAw&ved=0CE0Q6AEwBw]
[152] Road Machinery. Road Machinery Regional Rental Rates. Online. Available:
http://www.roadmachinery.com/media/docs/pdf/equipment/rental/Road_Machinery_Rental_Card.pdf
[153]NLPIP. Feb 2011. Streetlights for Local Roads. Online.
Available:http://www.lrc.rpi.edu/programs/NLPIP/PDF/VIEW/SR_StreetlightsLocal.pdf
[154]Project for Public Space. Lighting Use& Design. Online.
Available:http://www.pps.org/reference/streetlights/#How much lighting is
enough?
[155]Alibaba.Led Solar Street Light outdoor with Pole. Online.
Available:http://www.alibaba.com/product-detail/led-solar-street-light-outdoor-
with_472555180.html?s=p
[156]ATGStores. Progress Lighting P5257-20 Pathway Light. Online.
Available:http://www.atgstores.com/pathway-lighting/progress-lighting-p5257-20-pathway-
light_g18517.html?ProductSlot=7
[157]ExcelBridge. How Much Does A Bridge Cost? Online. Available:http://www.excelbridge.com/for-
engineers/cost
[158]Spring Man Canada. Sodding Installation. Online.
Available:http://www.springmancanada.ca/sodding.html
[159]The Tree Farm. Sale list. [Online]. Available: http://www.thetreefarm.com/sale-list/
[160]The Tree Farm. Delivery and Planting. [Online].
Available: http://www.thetreefarm.com/delivery-and-planting/
[161]United States Department of Transportation.(2008, June) Traffic Signal Timing Manual. [Online].
Available:http://ops.fhwa.dot.gov/publications/fhwahop08024/chapter6.htm
Note: All Google Sketchup scenery objects (trees, vehicles, people) used in the models contained
in this document were obtained from Google’s online public 3D Warehouse of Sketchup objects.
Available: https://3dwarehouse.sketchup.com/
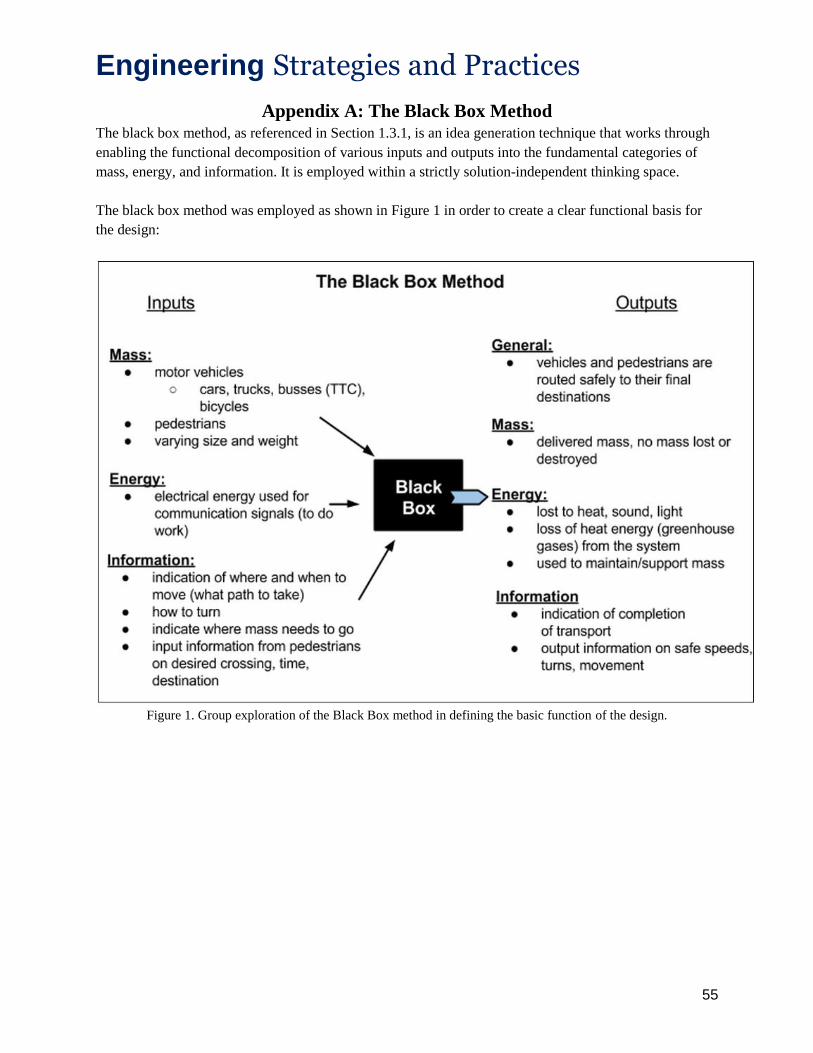
Engineering Strategies and Practices
55
Appendix A: The Black Box Method
The black box method, as referenced in Section 1.3.1, is an idea generation technique that works through
enabling the functional decomposition of various inputs and outputs into the fundamental categories of
mass, energy, and information. It is employed within a strictly solution-independent thinking space.
The black box method was employed as shown in Figure 1 in order to create a clear functional basis for
the design:
Figure 1. Group exploration of the Black Box method in defining the basic function of the design.
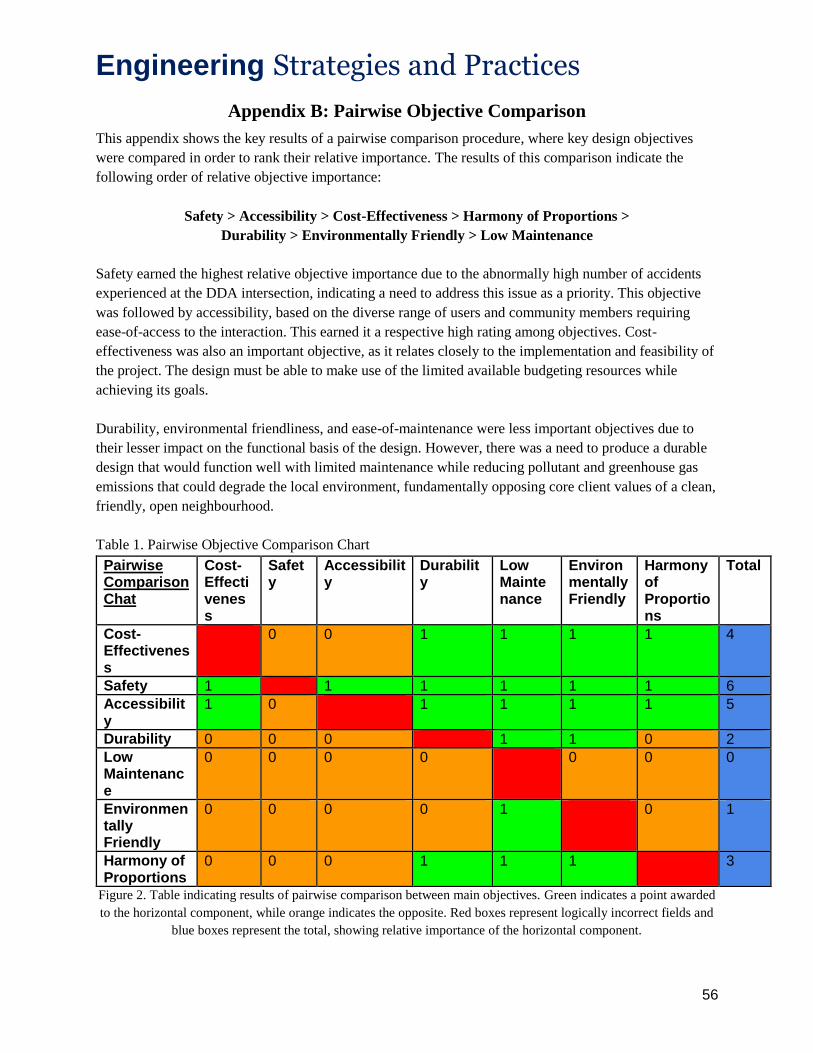
Engineering Strategies and Practices
56
Appendix B: Pairwise Objective Comparison
This appendix shows the key results of a pairwise comparison procedure, where key design objectives
were compared in order to rank their relative importance. The results of this comparison indicate the
following order of relative objective importance:
Safety > Accessibility > Cost-Effectiveness > Harmony of Proportions >
Durability > Environmentally Friendly > Low Maintenance
Safety earned the highest relative objective importance due to the abnormally high number of accidents
experienced at the DDA intersection, indicating a need to address this issue as a priority. This objective
was followed by accessibility, based on the diverse range of users and community members requiring
ease-of-access to the interaction. This earned it a respective high rating among objectives. Cost-
effectiveness was also an important objective, as it relates closely to the implementation and feasibility of
the project. The design must be able to make use of the limited available budgeting resources while
achieving its goals.
Durability, environmental friendliness, and ease-of-maintenance were less important objectives due to
their lesser impact on the functional basis of the design. However, there was a need to produce a durable
design that would function well with limited maintenance while reducing pollutant and greenhouse gas
emissions that could degrade the local environment, fundamentally opposing core client values of a clean,
friendly, open neighbourhood.
Table 1. Pairwise Objective Comparison Chart
Pairwise Comparison Chat
Cost-Effectiveness
Safety
Accessibility
Durability
Low Maintenance
Environmentally Friendly
Harmony of Proportions
Total
Cost-Effectiveness
0 0 1 1 1 1 4
Safety 1 1 1 1 1 1 6
Accessibility
1 0 1 1 1 1 5
Durability 0 0 0 1 1 0 2
Low Maintenance
0 0 0 0 0 0 0
Environmentally Friendly
0 0 0 0 1 0 1
Harmony of Proportions
0 0 0 1 1 1 3
Figure 2. Table indicating results of pairwise comparison between main objectives. Green indicates a point awarded
to the horizontal component, while orange indicates the opposite. Red boxes represent logically incorrect fields and
blue boxes represent the total, showing relative importance of the horizontal component.
Engineering Strategies and Practices
57
Appendix C: Estimated Budget and Related Projects
This appendix relates to cost estimates made by scaling similar existing City of Toronto infrastructure
projects. The following estimates provide a low to high-end budget range, capped by Section 1.5’s
monetary constraint (constraint 1).
Project 1 - Highland Creek Village Transportation Master Plan
Budget: between $200,000 to $250,000 [42][43][44]
A similarly sized, but less complex, intersection redesign provides a low-cost estimate (scale factor 2) for
the project [45]. The work done includes road surface renewal, merging ramp construction, and signal
redesign, offering a base template for the DDA interaction budget.
Project 3 - Danforth Avenue Improvements
This project involves a different infrastructure renewal, dealing primarily with a single road compared to
an intersection [46]. For this reason, its budget was not considered as an accurate base estimate for the
DDA redesign. However, the project is considered for its template on construction time, labour involved,
and local impact [47].
Project 4 - Fort York Pedestrian and Cycle Bridge and Ordnance Master Plan
Budget: $19.7 million [48]
A more extensive project of similar complexity, involving an intersection and bridge redesign (scale
factor 1.5) [48]. This provides the absolute limit for the budget of the design, indicating the maximal
feasible budget allocated to a project of the size and complexity of the DDA.
This recent infrastructure project will therefore be used for the high-end budget limit and corresponding
constraint.
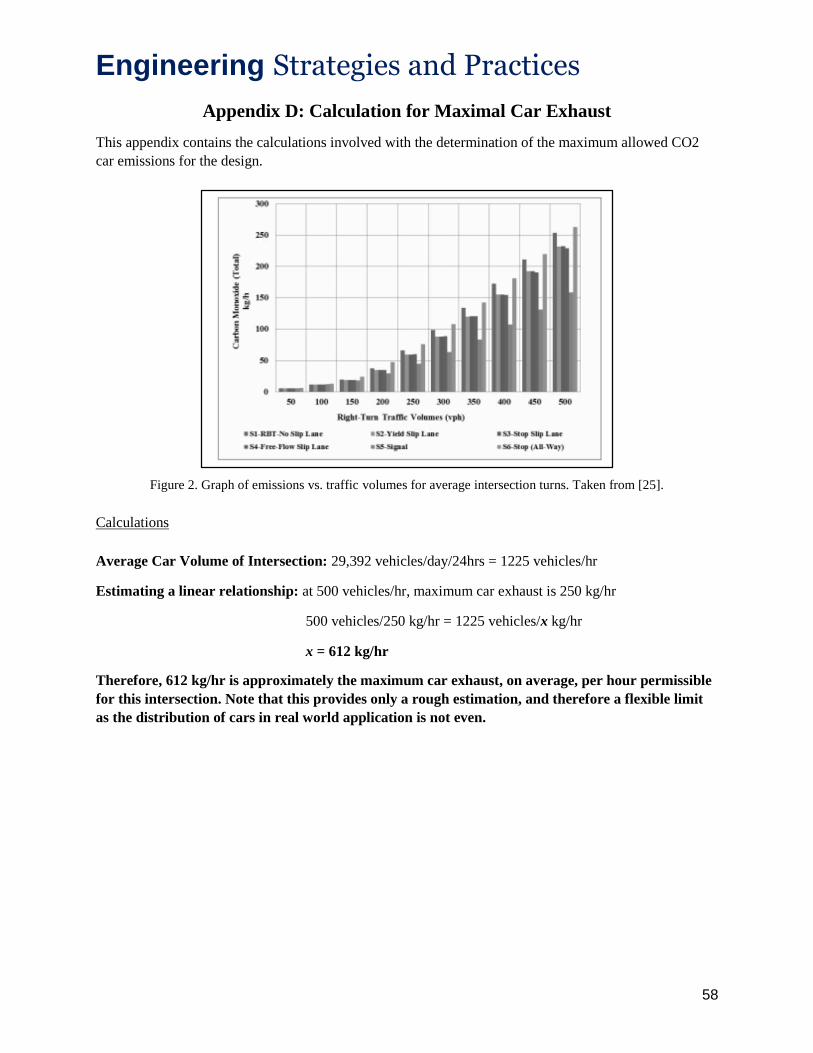
Engineering Strategies and Practices
58
Appendix D: Calculation for Maximal Car Exhaust
This appendix contains the calculations involved with the determination of the maximum allowed CO2
car emissions for the design.
Figure 2. Graph of emissions vs. traffic volumes for average intersection turns. Taken from [25].
Calculations
Average Car Volume of Intersection: 29,392 vehicles/day/24hrs = 1225 vehicles/hr
Estimating a linear relationship: at 500 vehicles/hr, maximum car exhaust is 250 kg/hr
500 vehicles/250 kg/hr = 1225 vehicles/x kg/hr
x = 612 kg/hr
Therefore, 612 kg/hr is approximately the maximum car exhaust, on average, per hour permissible
for this intersection. Note that this provides only a rough estimation, and therefore a flexible limit
as the distribution of cars in real world application is not even.
Engineering Strategies and Practices
59
Appendix E: Relevant Municipal By-laws, Provincial Laws, and Federal
Legislation
1. City of Toronto Construction Requirements [27]
● Consult with your neighbors before working on a project
● Communicate with your neighbors and keep them well informed
● Remove the waste and clean up after you complete the project
● Consult with Street Occupation Permit before starting a demolition, construction or renovation
project
● Construction should only be done during Monday to Friday 7:00 to 19:00 and Saturdays 9:00 to
19:00
● Construction must be safe for both the workers and users. Please ensure the construction is safe
by complying with the bylaw. Failure to comply may result in fine:
● Construction must not interfere with any neighboring services, including underground
lines
● Protect the trees and shrubs prior to construction
● The construction site must be closed with protective fencing to prohibit public access
(Toronto Municipal Code - Construction Fence Bylaw - Chapter 313)
● If the construction involves the alteration of overhead power lines in anyways,
remember to contact Toronto Hydro.
● Portable toilets must not be placed anywhere near the neighboring homes and must be
hidden
● Garbage and bins must be kept away from the neighboring properties
● No construction vehicles are allowed on private neighboring properties
● No burning of construction waste of any sort
● Idling construction vehicles are not allowed. Nor should any dangerous goods and
equipments be left unattended.
● Ensure all the construction workers are properly equipped
2. City of Toronto By-law with Regards to Trees and Plants
Private Tree By-law: Toronto Municipal Code, Chapter 813, Article III regulates planting of trees
and other vegetation, pertinent to the green space on the Dundas traffic island involved in the
intersection redesign [49][50].
3. City of Toronto By-law with Regards to Noise
The “Noise” By-law states that no noise shall be heard in public areas Monday to Friday before
7am and after 7pm, and before 9am and after 7pm on Saturday [28].
4. City of Toronto By-law with Regards to Zoning Information [52][53]
This by-law provides information for different zones and residential areas:
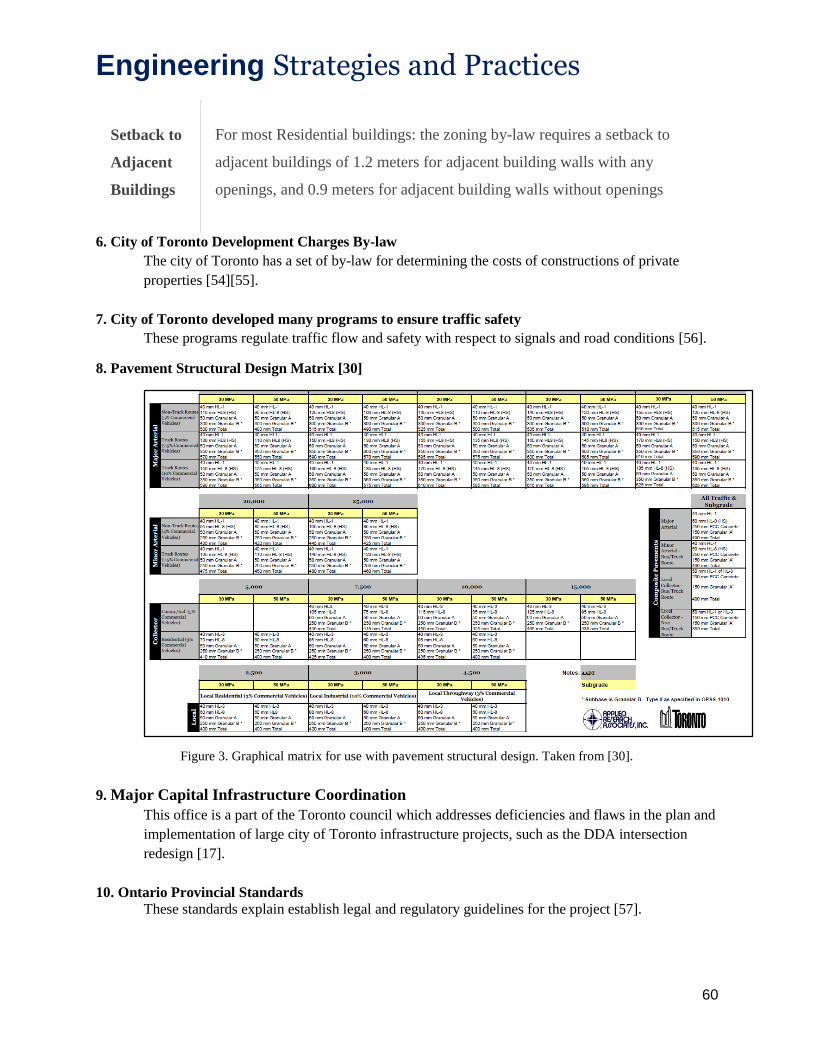
Engineering Strategies and Practices
60
Setback to
Adjacent
Buildings
For most Residential buildings: the zoning by-law requires a setback to
adjacent buildings of 1.2 meters for adjacent building walls with any
openings, and 0.9 meters for adjacent building walls without openings
6. City of Toronto Development Charges By-law
The city of Toronto has a set of by-law for determining the costs of constructions of private
properties [54][55].
7. City of Toronto developed many programs to ensure traffic safety
These programs regulate traffic flow and safety with respect to signals and road conditions [56].
8. Pavement Structural Design Matrix [30]
Figure 3. Graphical matrix for use with pavement structural design. Taken from [30].
9. Major Capital Infrastructure Coordination
This office is a part of the Toronto council which addresses deficiencies and flaws in the plan and
implementation of large city of Toronto infrastructure projects, such as the DDA intersection
redesign [17].
10. Ontario Provincial Standards These standards explain establish legal and regulatory guidelines for the project [57].

Engineering Strategies and Practices
61
11. Government of Canada Motor Vehicle Safety Act
This legislation explicitly deals with the safety of motor vehicles, a major component of the
redesign [33].
12. Government of Canada Highway Traffic Act
This Highway Traffic Act defined permissible modifications to road surfaces and intersections
[34]. It will play a significant role in navigating the legal constraints of the DDA project.
13. Must accommodate all types of motorized/non-motorized vehicles and pedestrians
a. Minimum head clearance: 4.15 meters [60]
b. Minimum lane width: 2.8 meters [60]
c. Must permit the passage of vehicles up to 23 meters in length [60][61]
d. Must be accessible to all pedestrians, regardless of their age, gender, race, religious
belief, and health conditions [7][8][62]
e. Pedestrian sidewalks must be at least 3 meters wide and clearly marked by 0.1 meter lines
[60]
f. All curb lanes must be at least 3.3m allowing for passages of all TTC buses [137]
g. All bike lanes must be at least 1.5m wide[138]
h. Shared curb lanes (vehicles and cyclists) must be at least 4.3m wide [137]
Table 2. Minimum lane width specifications and other influencing factors. Taken from [137].
Engineering Strategies and Practices
62
Appendix F: Cost Estimate for Proposed Design - Island Dugout Master Plan
Machinery Cost:
The design requires many different types of heavy road machinery such as bulldozers, hydraulics
excavator, articulated trucks, asphalt roller, smooth drum roller, and a hydraulics breaker.
Dozer D39EX: ($4,200 per month) X 15 months = $63,000
Hydraulics Excavator GH6: ($4,700 per month) X 8 months = $37,600
Articulated trucks HM-300: ($12,000 per month) X 6 months = $72,000
Smooth drum roller 3307: ($4,000 per month) X 1 month = $4,000
Hydraulics breaker PC88: ($3,800 per month) X 6 months = $22,800 [152]
Total Heavy Machinery Rental Cost = $199,400
Cost to remove existing intersection (labour fuel included, machinery is separate):
1. Removing Existing Asphalt:
Width of the road = 12.9m (3 lanes + 2 bike lanes)
Area of road removed = 302m X 12.9m = 3,896sqm
Cost to remove the asphalt road = 3,896sqm X $4.06/sqm = $15,818 [82]
2. Stripping of Topsoil:
Cost to remove the topsoil = 3,896sqm X $1.80sqm = $7,013 [82]
3. Removing the concrete sidewalk:
Length of sidewalks removed = 604m
Average width of sidewalks = 1.5m [83]
Area of sidewalks removed = 604m X 1.5m = 906sqm
Cost to remove concrete sidewalks = 906sqm X 9.39$/sqm = $8507 [82]
Total Cost to Remove Existing Intersection = $31,338
Stone Pitching Foundation Material Cost:
Plant and labour cost = $10.23 per tonne
Plant and transportation = $0.17 per tonne
Material cost = $67.55 per tonne
Total cost = $77.95 per tonne
Tonnes of Stone Pitching required = (12.9m X 140m) X 0.533 tonne = 962.598 tonnes
Total Cost for Stone Pitching Foundation = $75,034
Asphalt Material Cost (two-coat hot asphalt thickness of 75mm - bottom coating 50mm, and top coating
25mm):
0.062 (top) + 0.115 (bottom) tonnes of Asphalt is needed per square meter of road
Engineering Strategies and Practices
63
0.22 hours of labour is required to lay and roll one square meter of roll
Material cost: $41.32 per tonne of Asphalt
Material cost (0.177 tonnes):$7.31 per square meter
Cost to hire the roller, the driver, fuel and oil ($18.78 per hour): $4.13 per square meter
Cost for labour ($11.27 per hour): $2.48 per square meter
Total cost: $13.92 per square meter
Bottom coating 50mm, and top coating 25mm:
0.062 tonnes of Asphalt required per square meter
Width of road = 16.2m (4 lanes + 2 bike lanes)
Length of road = 140m
Total Cost for Asphalt Surfacing = (16.2m X 140m) X $13.92 = $31, 570
Cost to mix, labour and pour the concrete sidewalk:
Length of sidewalk built = 200m
Width of sidewalk = 1.525m
Area of sidewalk constructed = 200m X 1.525m = 305sqm
Cost to construct the concrete sidewalk = 305sqm X $47.96/sqm = $14,627 [82]
Traffic Lights Installation Cost:
Engineering Design cost = $2,415 to $3,675
Construction Cost for Traffic Lights = $13,650 to $26,250 [85]
Cost of Parking Lot Expropriation:
Amount of land required = 365.7sqm
Average net value of Industrial and Commercial/Retail Property in Neighbourhood = $56.94 per sqm [84]
Cost to purchase the parking lot = 365.7sqm X 56.94$ = $20,822
Cost of Maintenance:
Cost to maintain traffic lights = $252 to $305 per year [85]
Installing Streetlights [153][154][155]:
Total high efficiency street lamps to be installed: 41m/2 street lamp = 11
$1500*11 = $16,500
Cost to Install Street Lamps = $16,500
Engineering Strategies and Practices
64
Installing Bridge Lighting [156]:
Pedestrian bridge light: 2/5m
6 * 2 * $136.62 = $1639.44
Cost to Install Pedestrians Bridge Lighting = $1639.44
Gateway Bridge Construction [157]:
Length: 29.7m
Width: 2.74m
$1500/linear foot
$1500 * 29.7m * 3.2808 = $146,159.64
Cost to build Gateway Bridge = $146,159.64
Park Space Expansion [158][159][160]:
Area of the park: 1750.8m^2 + 2947.1m^2 = 4697.9m^2
Sodding price: $0.98/ft^2
Sodding the park: 4697.9 * 0.98 * 10.7637 = $49,555.45
Tree planting: PINE-Austrian Pine * 5 + SPRUCE-Colorado Blue Spruce * 5 + SPRUCE-Glacier Blue
Colorado Spruce * 5 = $100 * 5 + $160 * 5 + $50 * 5 = $1,550
Planting labour price: $110/hr * 2hr/tree * 15 trees = $330
Total Cost of Park Creation = $54,405.45
Cost Breakdown Summary:
Total Road Machinery Cost = $199,400
Total Cost to Remove Existing Intersection = $31,338
Total Cost for Stone Pitching Foundation = $75,039
Total Cost for Asphalt Surfacing = (16.2m X 140m) X $13.92 = $31, 574
Cost to Pour the Concrete Sidewalk = 305 sqm X $47.96/sqm = $14,627 [82]
Construction Cost for Traffic Lights = $13,650 to $26,250 [85]
Cost to Purchase the parking lot = 365.7sqm X 56.94$ = $20,822
Cost to Install Street Lamps = $16,500
Cost to Install Pedestrians Bridge Lighting = $1639.44
Cost to Build Gateway Bridge = $146159.64
Total Cost of Park Expansion = 54,405.45
Grand Total: $607,560.53

Engineering Strategies and Practices
65
Appendix G: Intersection Maps and Site Visualization
This appendix contains relevant site maps, key elements of which were verified during the site visit
performed by the team on January 28, 2014.
Most notable are the East-West Dupont St. Annette St. bike lanes (Figure 3), which run in both directions
over even the narrowest sections of the intersection, and the existing sewer mains that are buried direction
below the intersection (Figure 8). These must be considered should excavation be required, and could
potentially add cost.
Figure 3. Bike lanes currently installed surrounding the DDA intersection. Taken from [58].
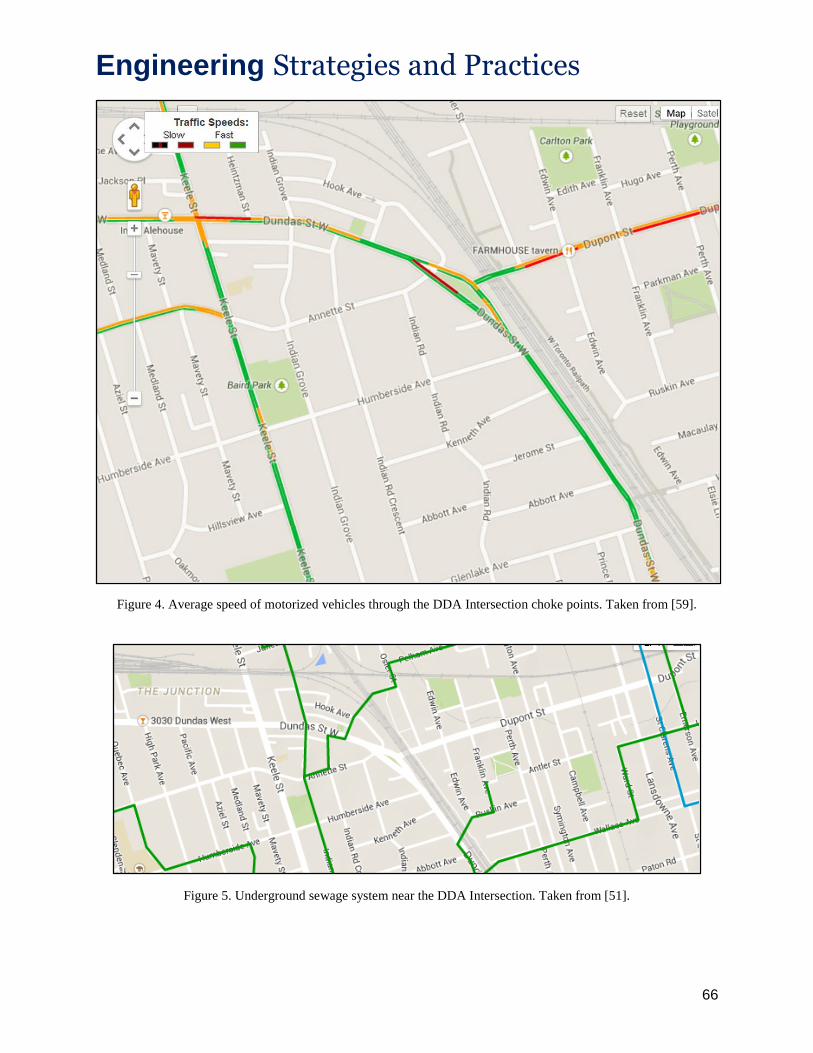
Engineering Strategies and Practices
66
Figure 4. Average speed of motorized vehicles through the DDA Intersection choke points. Taken from [59].
Figure 5. Underground sewage system near the DDA Intersection. Taken from [51].
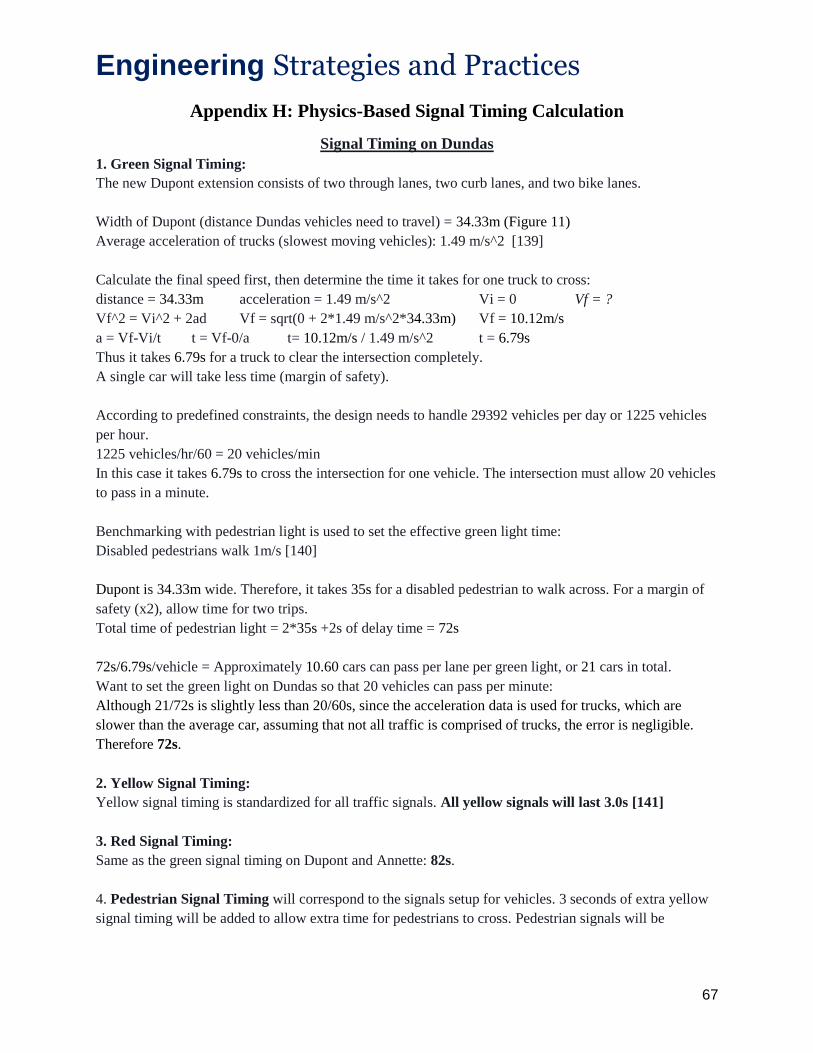
Engineering Strategies and Practices
67
Appendix H: Physics-Based Signal Timing Calculation
Signal Timing on Dundas
1. Green Signal Timing:
The new Dupont extension consists of two through lanes, two curb lanes, and two bike lanes.
Width of Dupont (distance Dundas vehicles need to travel) = 34.33m (Figure 11)
Average acceleration of trucks (slowest moving vehicles): 1.49 m/s^2 [139]
Calculate the final speed first, then determine the time it takes for one truck to cross:
distance = 34.33m acceleration = 1.49 m/s^2 Vi = 0 Vf = ?
Vf^2 = Vi^2 + 2ad Vf = sqrt(0 + 2*1.49 m/s^2*34.33m) Vf = 10.12m/s
a = Vf-Vi/t t = Vf-0/a t= 10.12m/s / 1.49 m/s^2 t = 6.79s
Thus it takes 6.79s for a truck to clear the intersection completely.
A single car will take less time (margin of safety).
According to predefined constraints, the design needs to handle 29392 vehicles per day or 1225 vehicles
per hour.
1225 vehicles/hr/60 = 20 vehicles/min
In this case it takes 6.79s to cross the intersection for one vehicle. The intersection must allow 20 vehicles
to pass in a minute.
Benchmarking with pedestrian light is used to set the effective green light time:
Disabled pedestrians walk 1m/s [140]
Dupont is 34.33m wide. Therefore, it takes 35s for a disabled pedestrian to walk across. For a margin of
safety (x2), allow time for two trips.
Total time of pedestrian light = 2*35s +2s of delay time = 72s
72s/6.79s/vehicle = Approximately 10.60 cars can pass per lane per green light, or 21 cars in total.
Want to set the green light on Dundas so that 20 vehicles can pass per minute:
Although 21/72s is slightly less than 20/60s, since the acceleration data is used for trucks, which are
slower than the average car, assuming that not all traffic is comprised of trucks, the error is negligible.
Therefore 72s.
2. Yellow Signal Timing:
Yellow signal timing is standardized for all traffic signals. All yellow signals will last 3.0s [141]
3. Red Signal Timing:
Same as the green signal timing on Dupont and Annette: 82s.
4. Pedestrian Signal Timing will correspond to the signals setup for vehicles. 3 seconds of extra yellow
signal timing will be added to allow extra time for pedestrians to cross. Pedestrian signals will be
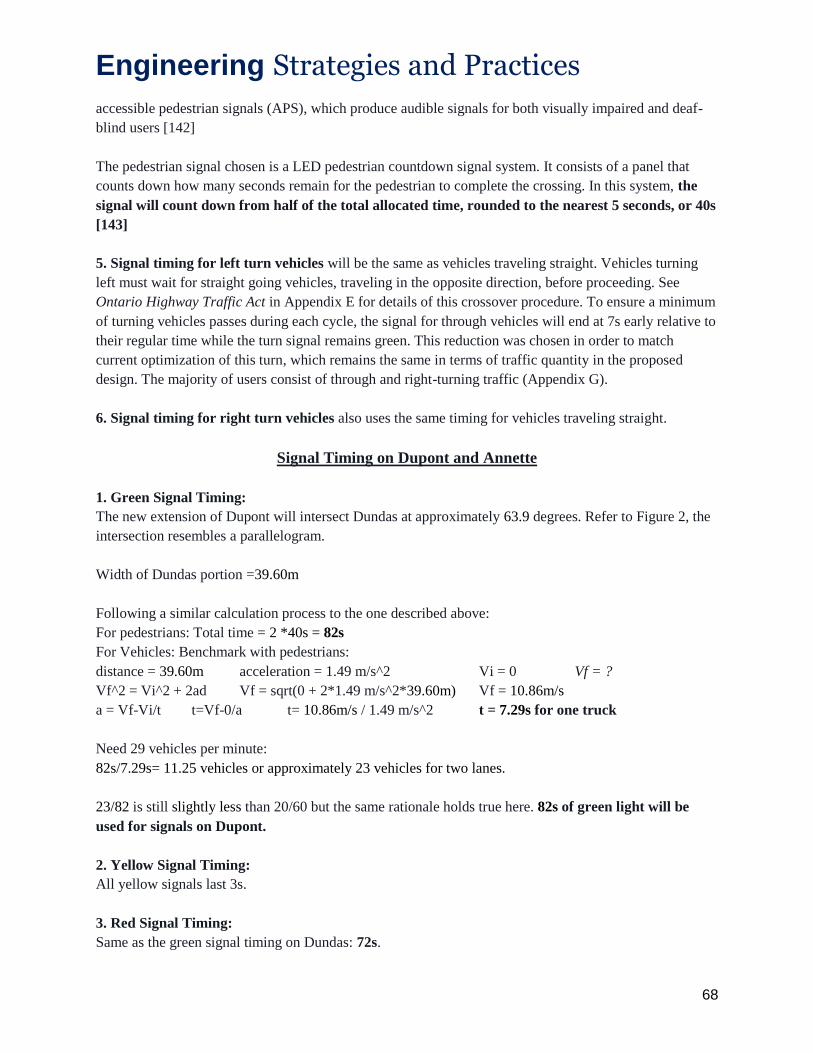
Engineering Strategies and Practices
68
accessible pedestrian signals (APS), which produce audible signals for both visually impaired and deaf-
blind users [142]
The pedestrian signal chosen is a LED pedestrian countdown signal system. It consists of a panel that
counts down how many seconds remain for the pedestrian to complete the crossing. In this system, the
signal will count down from half of the total allocated time, rounded to the nearest 5 seconds, or 40s
[143]
5. Signal timing for left turn vehicles will be the same as vehicles traveling straight. Vehicles turning
left must wait for straight going vehicles, traveling in the opposite direction, before proceeding. See
Ontario Highway Traffic Act in Appendix E for details of this crossover procedure. To ensure a minimum
of turning vehicles passes during each cycle, the signal for through vehicles will end at 7s early relative to
their regular time while the turn signal remains green. This reduction was chosen in order to match
current optimization of this turn, which remains the same in terms of traffic quantity in the proposed
design. The majority of users consist of through and right-turning traffic (Appendix G).
6. Signal timing for right turn vehicles also uses the same timing for vehicles traveling straight.
Signal Timing on Dupont and Annette
1. Green Signal Timing:
The new extension of Dupont will intersect Dundas at approximately 63.9 degrees. Refer to Figure 2, the
intersection resembles a parallelogram.
Width of Dundas portion =39.60m
Following a similar calculation process to the one described above:
For pedestrians: Total time = 2 *40s = 82s
For Vehicles: Benchmark with pedestrians:
distance = 39.60m acceleration = 1.49 m/s^2 Vi = 0 Vf = ?
Vf^2 = Vi^2 + 2ad Vf = sqrt(0 + 2*1.49 m/s^2*39.60m) Vf = 10.86m/s
a = Vf-Vi/t t=Vf-0/a t= 10.86m/s / 1.49 m/s^2 t = 7.29s for one truck
Need 29 vehicles per minute:
82s/7.29s= 11.25 vehicles or approximately 23 vehicles for two lanes.
23/82 is still slightly less than 20/60 but the same rationale holds true here. 82s of green light will be
used for signals on Dupont.
2. Yellow Signal Timing:
All yellow signals last 3s.
3. Red Signal Timing:
Same as the green signal timing on Dundas: 72s.
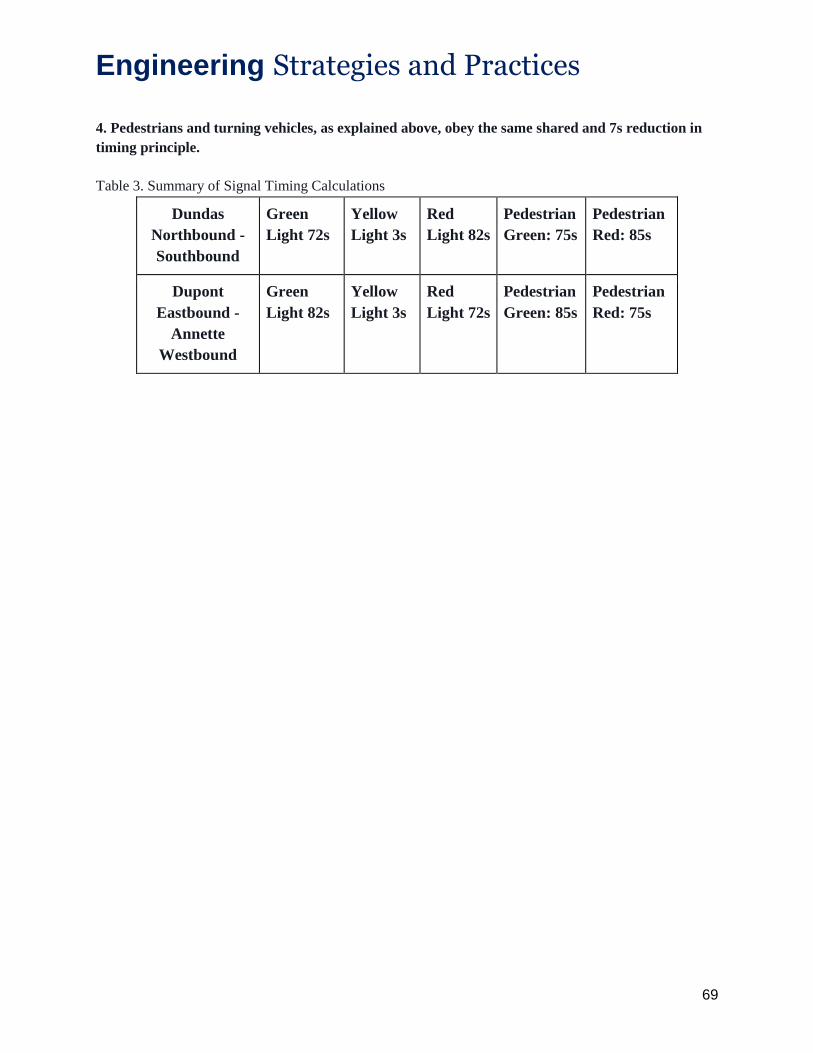
Engineering Strategies and Practices
69
4. Pedestrians and turning vehicles, as explained above, obey the same shared and 7s reduction in
timing principle.
Table 3. Summary of Signal Timing Calculations
Dundas
Northbound -
Southbound
Green
Light 72s
Yellow
Light 3s
Red
Light 82s
Pedestrian
Green: 75s
Pedestrian
Red: 85s
Dupont
Eastbound -
Annette
Westbound
Green
Light 82s
Yellow
Light 3s
Red
Light 72s
Pedestrian
Green: 85s
Pedestrian
Red: 75s
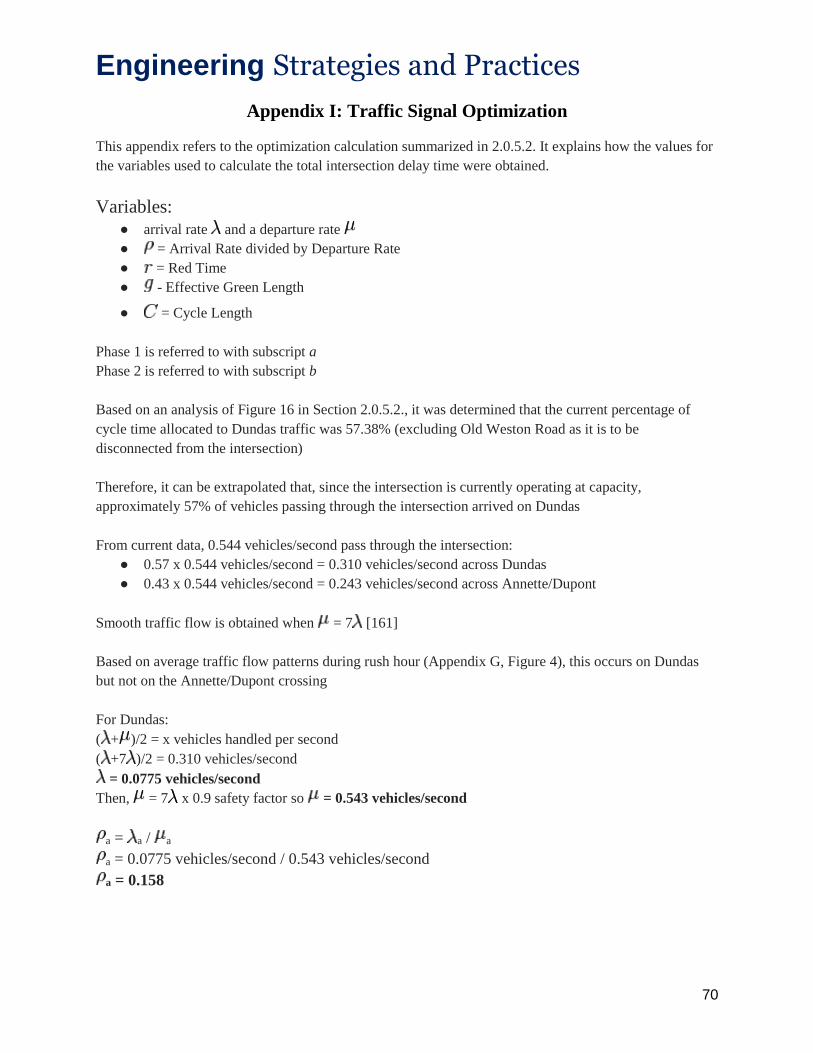
Engineering Strategies and Practices
70
Appendix I: Traffic Signal Optimization
This appendix refers to the optimization calculation summarized in 2.0.5.2. It explains how the values for
the variables used to calculate the total intersection delay time were obtained.
Variables:
● arrival rate and a departure rate
● = Arrival Rate divided by Departure Rate
● = Red Time
● - Effective Green Length
● = Cycle Length
Phase 1 is referred to with subscript a
Phase 2 is referred to with subscript b
Based on an analysis of Figure 16 in Section 2.0.5.2., it was determined that the current percentage of
cycle time allocated to Dundas traffic was 57.38% (excluding Old Weston Road as it is to be
disconnected from the intersection)
Therefore, it can be extrapolated that, since the intersection is currently operating at capacity,
approximately 57% of vehicles passing through the intersection arrived on Dundas
From current data, 0.544 vehicles/second pass through the intersection:
● 0.57 x 0.544 vehicles/second = 0.310 vehicles/second across Dundas
● 0.43 x 0.544 vehicles/second = 0.243 vehicles/second across Annette/Dupont
Smooth traffic flow is obtained when = 7 [161]
Based on average traffic flow patterns during rush hour (Appendix G, Figure 4), this occurs on Dundas
but not on the Annette/Dupont crossing
For Dundas:
( + )/2 = x vehicles handled per second
( +7 )/2 = 0.310 vehicles/second
= 0.0775 vehicles/second
Then, = 7 x 0.9 safety factor so = 0.543 vehicles/second
a = a / a
a = 0.0775 vehicles/second / 0.543 vehicles/second
a = 0.158

Engineering Strategies and Practices
71
Similarly for Phase 2 (b), using ( + )/2 = 0.234 vehicles handled per second, where = 3.5 (traffic
flow half a slow, no longer smooth based on rush hour traffic data), and a safety factor of 0.8 (less
accurate farther from ideal conditions):
= 0.0585 vehicles/second
= 0.164 vehicles/second
b = 0.357
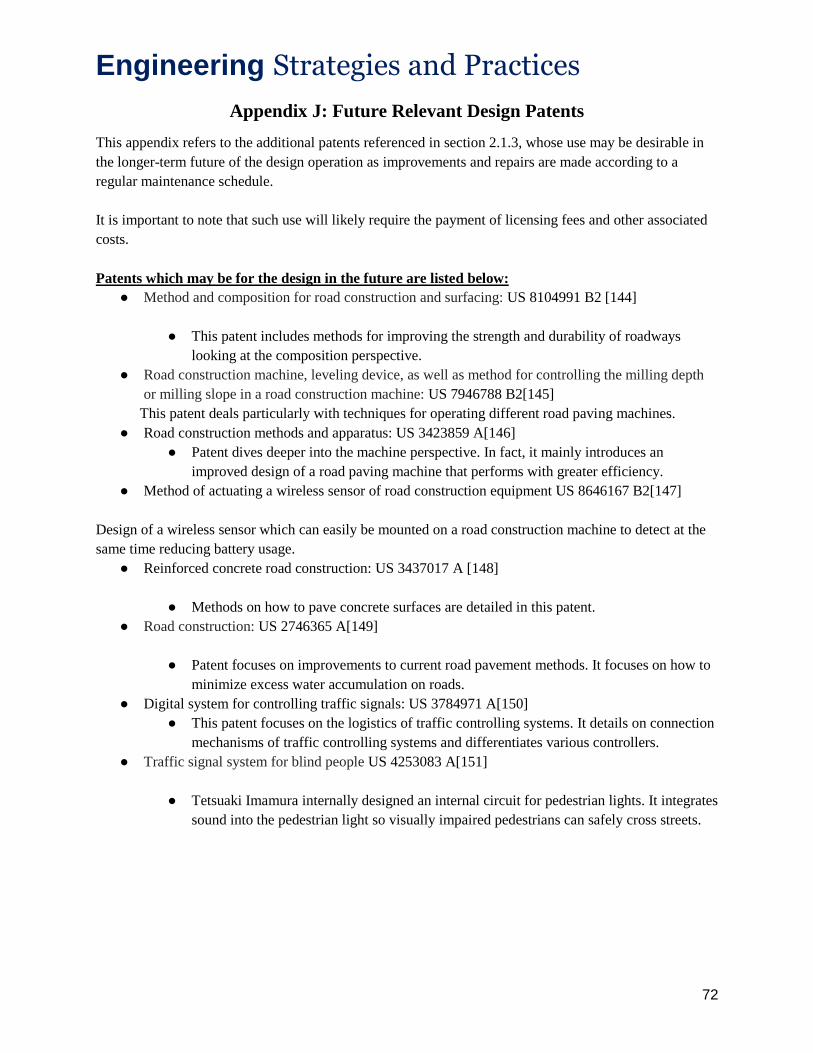
Engineering Strategies and Practices
72
Appendix J: Future Relevant Design Patents
This appendix refers to the additional patents referenced in section 2.1.3, whose use may be desirable in
the longer-term future of the design operation as improvements and repairs are made according to a
regular maintenance schedule.
It is important to note that such use will likely require the payment of licensing fees and other associated
costs.
Patents which may be for the design in the future are listed below:
● Method and composition for road construction and surfacing: US 8104991 B2 [144]
● This patent includes methods for improving the strength and durability of roadways
looking at the composition perspective.
● Road construction machine, leveling device, as well as method for controlling the milling depth
or milling slope in a road construction machine: US 7946788 B2[145]
This patent deals particularly with techniques for operating different road paving machines.
● Road construction methods and apparatus: US 3423859 A[146]
● Patent dives deeper into the machine perspective. In fact, it mainly introduces an
improved design of a road paving machine that performs with greater efficiency.
● Method of actuating a wireless sensor of road construction equipment US 8646167 B2[147]
Design of a wireless sensor which can easily be mounted on a road construction machine to detect at the
same time reducing battery usage.
● Reinforced concrete road construction: US 3437017 A [148]
● Methods on how to pave concrete surfaces are detailed in this patent.
● Road construction: US 2746365 A[149]
● Patent focuses on improvements to current road pavement methods. It focuses on how to
minimize excess water accumulation on roads.
● Digital system for controlling traffic signals: US 3784971 A[150]
● This patent focuses on the logistics of traffic controlling systems. It details on connection
mechanisms of traffic controlling systems and differentiates various controllers.
● Traffic signal system for blind people US 4253083 A[151]
● Tetsuaki Imamura internally designed an internal circuit for pedestrian lights. It integrates
sound into the pedestrian light so visually impaired pedestrians can safely cross streets.
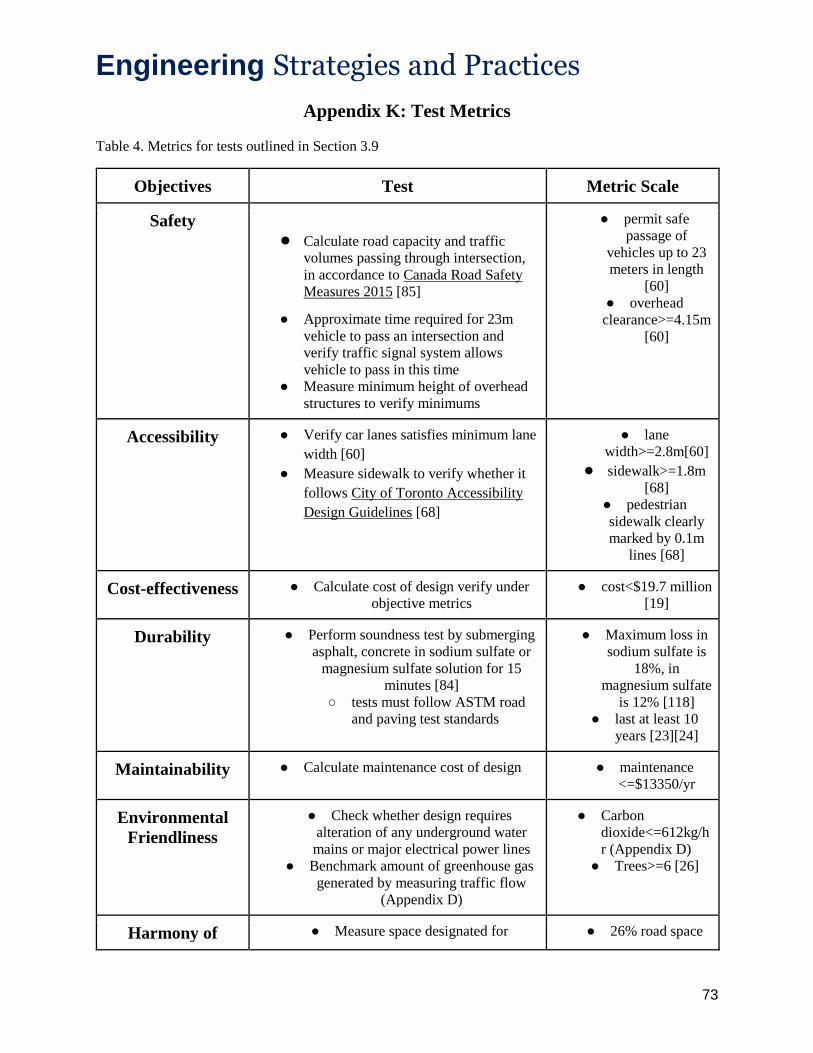
Engineering Strategies and Practices
73
Appendix K: Test Metrics
Table 4. Metrics for tests outlined in Section 3.9
Objectives Test Metric Scale
Safety
● Calculate road capacity and traffic
volumes passing through intersection,
in accordance to Canada Road Safety
Measures 2015 [85]
● Approximate time required for 23m
vehicle to pass an intersection and
verify traffic signal system allows
vehicle to pass in this time ● Measure minimum height of overhead
structures to verify minimums
● permit safe
passage of
vehicles up to 23
meters in length
[60]
● overhead
clearance>=4.15m
[60]
Accessibility ● Verify car lanes satisfies minimum lane
width [60]
● Measure sidewalk to verify whether it
follows City of Toronto Accessibility
Design Guidelines [68]
● lane
width>=2.8m[60]
● sidewalk>=1.8m
[68] ● pedestrian
sidewalk clearly
marked by 0.1m
lines [68]
Cost-effectiveness ● Calculate cost of design verify under
objective metrics
● cost<$19.7 million
[19]
Durability ● Perform soundness test by submerging
asphalt, concrete in sodium sulfate or
magnesium sulfate solution for 15
minutes [84]
○ tests must follow ASTM road
and paving test standards
● Maximum loss in
sodium sulfate is
18%, in
magnesium sulfate
is 12% [118]
● last at least 10
years [23][24]
Maintainability ● Calculate maintenance cost of design ● maintenance
<=$13350/yr
Environmental
Friendliness
● Check whether design requires
alteration of any underground water
mains or major electrical power lines
● Benchmark amount of greenhouse gas
generated by measuring traffic flow
(Appendix D)
● Carbon
dioxide<=612kg/h
r (Appendix D)
● Trees>=6 [26]
Harmony of ● Measure space designated for ● 26% road space

Engineering Strategies and Practices
74
Proportions pedestrians, calculate percentage under
total road space
for pedestrians
[27]
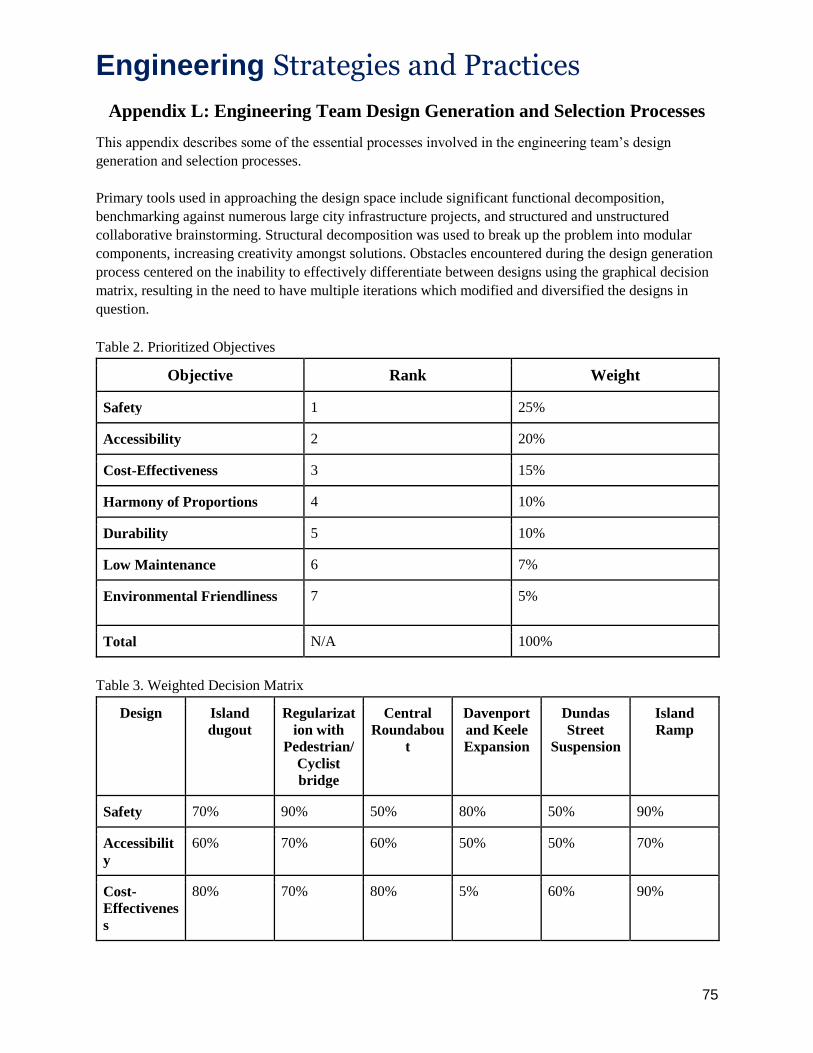
Engineering Strategies and Practices
75
Appendix L: Engineering Team Design Generation and Selection Processes
This appendix describes some of the essential processes involved in the engineering team’s design
generation and selection processes.
Primary tools used in approaching the design space include significant functional decomposition,
benchmarking against numerous large city infrastructure projects, and structured and unstructured
collaborative brainstorming. Structural decomposition was used to break up the problem into modular
components, increasing creativity amongst solutions. Obstacles encountered during the design generation
process centered on the inability to effectively differentiate between designs using the graphical decision
matrix, resulting in the need to have multiple iterations which modified and diversified the designs in
question.
Table 2. Prioritized Objectives
Objective Rank Weight
Safety 1 25%
Accessibility 2 20%
Cost-Effectiveness 3 15%
Harmony of Proportions 4 10%
Durability 5 10%
Low Maintenance 6 7%
Environmental Friendliness 7 5%
Total N/A 100%
Table 3. Weighted Decision Matrix
Design Island
dugout Regularizat
ion with
Pedestrian/
Cyclist
bridge
Central
Roundabou
t
Davenport
and Keele
Expansion
Dundas
Street
Suspension
Island
Ramp
Safety 70% 90% 50% 80% 50% 90%
Accessibilit
y
60% 70% 60% 50% 50% 70%
Cost-
Effectivenes
s
80% 70% 80% 5% 60% 90%
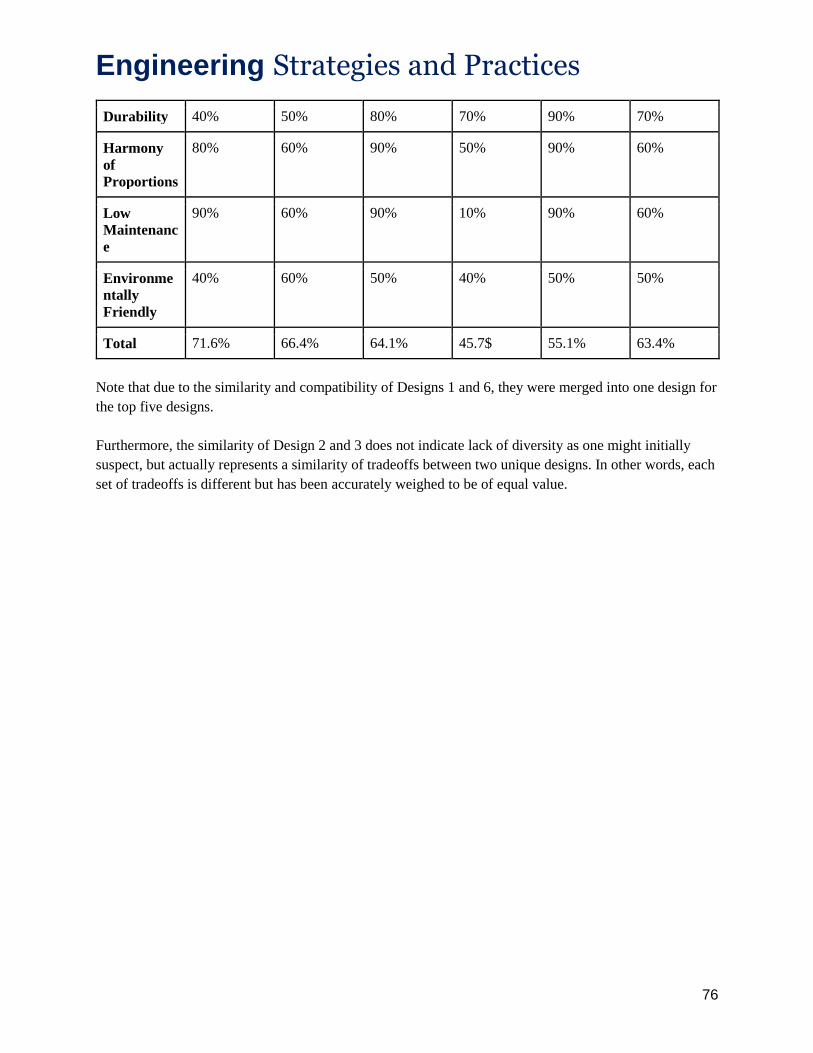
Engineering Strategies and Practices
76
Durability 40% 50% 80% 70% 90% 70%
Harmony
of
Proportions
80% 60% 90% 50% 90% 60%
Low
Maintenanc
e
90% 60% 90% 10% 90% 60%
Environme
ntally
Friendly
40% 60% 50% 40% 50% 50%
Total 71.6% 66.4% 64.1% 45.7$ 55.1% 63.4%
Note that due to the similarity and compatibility of Designs 1 and 6, they were merged into one design for
the top five designs.
Furthermore, the similarity of Design 2 and 3 does not indicate lack of diversity as one might initially
suspect, but actually represents a similarity of tradeoffs between two unique designs. In other words, each
set of tradeoffs is different but has been accurately weighed to be of equal value.