ducted kinetic alfve´n waves in plasma with steep density ... · ducted kinetic alfve´n waves in...
TRANSCRIPT

Ducted kinetic Alfven waves in plasma with steep density gradients
Saeid Houshmandyar1,2 and Earl E. Scime2
1Solar Observatory Department, Prairie View A&M University, Prairie View, Texas 77446, USA2Department of Physics, West Virginia University, Morgantown, West Virginia 26506-6315, USA
(Received 2 September 2011; accepted 27 October 2011; published online 29 November 2011)
Given their high plasma density (n� 1013 cm�3), it is theoretically possible to excite Alfven waves
in a conventional, moderate length (L� 2 m) helicon plasma source. However, helicon plasmas are
decidedly inhomogeneous, having a steep radial density gradient, and typically have a significant
background neutral pressure. The inhomogeneity introduces regions of kinetic and inertial Alfven
wave propagation. Ion-neutral and electron-neutral collisions alter the Alfven wave dispersion
characteristics. Here, we present the measurements of propagating kinetic Alfven waves in helium
helicon plasma. The measured wave dispersion is well fit with a kinetic model that includes the
effects of ion-neutral damping and that assumes the high density plasma core defines the radial
extent of the wave propagation region. The measured wave amplitude versus plasma radius is con-
sistent with the pile up of wave magnetic energy at the boundary between the kinetic and inertial
regime regions. VC 2011 American Institute of Physics. [doi:10.1063/1.3662113]
I. INTRODUCTION
Alfven waves are the fundamental, low-frequency, elec-
tromagnetic modes of magnetized plasmas. In the ideal mag-
netohydrodynamic (MHD) approximation, they propagate
exclusively along the background magnetic field at the Alfven
speed vA¼B0=(l0nimi)1=2, where B0 is the background mag-
netic field strength and ni and mi are the ion density and mass,
respectively. More realistic descriptions of the plasma envi-
ronment require inclusion of finite plasma pressure, electron
inertia, collisions with background neutrals, spatial gradients
in the magnetic field and plasma density, and boundaries.
These additional effects complicate the simplistic model of
Alfven propagation by introducing new phenomena such as
nonzero parallel electric fields and cross-field propagation.
In low resistivity plasmas such as the solar atmosphere,
where the plasma and magnetic fields are strongly coupled,
driven plasma flows can lead to the excitation of Alfven
waves. Recent observations from Hinode, a high-resolution
solar imaging mission,1 confirm that upward propagating
Alfven waves in the solar chromosphere exist and appear to
be driven by photospheric flows and upwelling plasma.2 The
solar corona, the region above the chromosphere, is nearly
200 times hotter than the Sun’s surface. Therefore, the Hinodeobservations have lent support to models of coronal heating
which hypothesize that low-frequency Alfven waves can heat
ions in the corona if the waves propagate into the regions of
weaker magnetic field strength (through an ion cyclotron reso-
nance) or through damping of Alfven wave cascades at ion
spatial scales. The amount of energy stored in the observed
Alfven waves is consistent with the magnitude of the calcu-
lated additional energy source required to explain the million
degree coronal temperatures. Prior to the Hinode measure-
ments, the observations of Alfven waves in the high speed so-
lar wind3 triggered the development of Alfven wave-based
coronal ion heating models.4–7 Although the coronal ion heat-
ing problem has motivated the development of many recent
models of Alfven wave propagation, dispersive Alfven waves,
i.e., those Alfven waves with nonzero parallel electric fields
and which propagate obliquely, have been of long standing
theoretical and experimental interest because of their possible
roles in auroral phenomena8,9 and fusion plasmas.
First, formulated by Hannes Alfven for a conducting
fluid,10 the dispersion relation for a classic shear Alfven
waves (SAW) is x¼ kjjvA, where kjj is the parallel component
of the wave number, and parallel and perpendicular directions
are defined with respect to the background magnetic field B0.
A classic SAW has a large perpendicular wavelength (k\)
and insignificant parallel electric field. It also has a constant
parallel phase velocity (vPhasejj ¼x=kjj ¼ vA). However, when
k\ becomes small, the wave dispersion changes significantly
and additional effects must be included in the theory. Just
how small is “small” for the perpendicular wavelength
depends on the ability of the electrons to respond to the wave
fields. When the electron thermal speed exceeds the Alfven
speed, vTe¼ (2kBTe=me)1=2> vA, electrons move fast enough
to respond adiabatically to the wave fields and the wave is
commonly referred to as a “kinetic Alfven wave (KAW).” In
this limit, the spatial scale that defines a “small” perpendicu-
lar wavelength is the ion sound gyroradius, qs¼ cs=xci, where
xci¼ eB0=mic is the ion cyclotron frequency and
cs¼ (kBTe=mi)1=2 is the ion sound speed, with e being the
charge of an electron, kB is Boltzmann’s constant, me is the
electron mass, and c is the speed of light.11
For electron thermal speeds less than the Alfven speed,
electron inertia becomes important and the wave is referred
to as an “inertial Alfven wave (IAW).” In this limit, the rele-
vant “small” spatial scale is the electron skin depth,
de¼ c=xpe, where xpe¼ (4pnee2=me)
1=2 and ne is the elec-
tron density. The electron thermal to Alfven speed ratio can
also be expressed as the plasma beta scaled by the ion-to-
electron mass ratio,
vTe
vA
� �2
¼ �b ¼ mi
meb ¼ mi
me
� �8pnekBTe
B20
� �: (1)
1070-664X/2011/18(11)/112111/10/$30.00 VC 2011 American Institute of Physics18, 112111-1
PHYSICS OF PLASMAS 18, 112111 (2011)
Author complimentary copy. Redistribution subject to AIP license or copyright, see http://php.aip.org/php/copyright.jsp

Thus, very low beta plasmas, such as the auroral zone, the
edge of laboratory plasmas, and the base of the solar corona,
are systems in which inertial Alfven waves propagate. In
higher beta systems, e.g., fusion plasmas, the solar wind, and
the magnetosphere, kinetic Alfven wave propagation is
expected. Of particular importance to the experiments that
are described in this work is that KAWs are forward propa-
gating (phase and group velocities are in the same direction)
waves, whereas IAWs are backward propagating waves.
Therefore, a KAW wave propagating into a region of
decreasing plasma density, at a density gradient for instance,
will have to couple into IAW propagating in the opposite
direction; essentially trapping the wave power on the higher
density side of the gradient.
The low frequency nature of Alfven waves (i.e.,
x=xci< 1, required to satisfy the constraint of the MHD
approximation) and the range of Alfven speeds achievable in
laboratory experiments typically necessitate a very long ex-
perimental system in which to study Alfven wave physics.
The long parallel length (L� 20 m) and reproducible plasma
of the large plasma device (LAPD)12 have made it an ideal
facility for Alfven wave experiments. The higher densities of
helicon plasma sources, as with some previous facilities used
for Alfven wave studies,13,14 can theoretically compensate
for the much shorter achievable plasma lengths.15,16 How-
ever, there are a number of challenges arising from the char-
acteristics of helicon sources which need to be addressed.
One is the steep radial gradient in plasma density, which
imposes two distinct regimes of kinetic and inertial Alfven
wave propagation. The second challenge is the high neutral
to plasma density fraction, which introduces wave damping
through finite ion-neutral and electron-ion collisions.
This work presents laboratory observations of low fre-
quency wave excitation and propagation in a “helicon”
plasma source, which are consistent with the expected prop-
agation of “kinetic Alfven waves.” The measured disper-
sion relation is in good agreement with a KAW model that
includes the effects of neutral collisions and finite perpen-
dicular wave number (k\) effects. In Sec. II, we provide the
relevant theoretical background for the experimental condi-
tions. The experimental apparatus and diagnostic tools are
presented in Sec. III. The measurements and analysis and
interpretation of the measurements are provided in Secs. IV
and V.
II. ALFVEN WAVE THEORY
Finite perpendicular wavelength effects in Alfven wave
propagation typically arise in laboratory experiments through
the excitation of Alfven waves by small scale antennas, e.g.,
the shear Alfven wave experiments in the LAPD device,17 or
through the effects of chamber walls, which introduce a fi-
nite perpendicular wavelength by forcing the wave fields of
the Alfven waves to satisfy conducting or insulating wall
boundary conditions.18 Regardless of the origin of the finite
perpendicular wavelength, its existence modifies the simple
Alfven wave dispersion relation. In the experiments reported
here, we will demonstrate that the observed Alfven wave
propagation is consistent with the imposition of a finite
perpendicular wavelength by boundary conditions created by
the high density “core” region typical of a helicon plasma.
Another limitation of the classic Alfven model approach
is the assumption of extremely low wave frequencies. Typi-
cal laboratory studies excite waves at frequencies compara-
ble to the ion-cyclotron frequency, fci¼xci=2p, because it is
experimentally easier to couple significant powers to anten-
nas at higher frequencies and because the physics of wave
propagation near the ion cyclotron resonance is often of in-
terest. Although inclusion of the Hall term in the MHD mo-
mentum equation introduces a finite frequency term in the
dispersion relation,19 other finite frequency effects and criti-
cal phenomena such as Landau damping and finite Larmor
radius corrections are not easily incorporated in a MHD for-
mulation.20 Thus, we briefly review here the warm plasma
theory model for Alfven wave propagation.
In a warm plasma, the ion and electron particle distribu-
tion functions evolve according to the Maxwell-Boltzmann
equation
@f
@tþ v � rf þ q
mEþ v� B½ � � rvf ¼ df
dt
����c
; (2)
where the distribution function is f(x,v,t)¼ f0(v)þ f1(x,v,t)and f0 is the equilibrium distribution function (assumed to be
Maxwellian). The right hand side of Eq. (2) is the collision
operator and for collisionless plasmas (df=dt)c¼ 0. The field
perturbations are given by Maxwell’s equations and satisfy
the wave equation
k� k� Eð Þ þ x2
c2e$ � E ¼ 0; (3)
where c is the speed of light and e$
is the warm plasma dielec-
tric tensor for a wave frequency of x. The elements of the
warm plasma dielectric tensor for collisionless plasmas are
readily available in the literature, e.g., Swanson.21 In the low
frequency limit and assuming an equilibrium magnetic field
along the z axis, Eq. (3) reduces to22
n2jj � exx
� �ezz þ n2
?exx ¼ 0; (4)
where njj ¼ ckjj=x, n\¼ ck\=x, and the relevant e$
tensor
elements are
exx ¼ 1þX
j
x2pjffiffiffi
2p
xkjjvTj
1
lj
X1n¼�1
n2CnðljÞZðfnjÞ
�x2
pi
x2ci � x2
1� C0ðliÞli
; (5)
ezz ¼ 1�X
j
x2pjffiffiffi
2p
xkjjvTj
X1n¼�1
CnðljÞZ0ðfnjÞ
� 2x2
peffiffiffi2p
xkjjvTe
f0e 1þ f0eZðf0eÞ½ �; (6)
where j denotes the species (e for electron and i for ions),
lj ¼ k2?q
2j ; qj is the gyroradius for each species, Cn(lj)
¼ exp(�lj)In(lj), In(x) is the modified Bessel function, Z(fnj)
is the plasma dispersion function20 with an argument of
112111-2 S. Houshmandyar and E. E. Scime Phys. Plasmas 18, 112111 (2011)
Author complimentary copy. Redistribution subject to AIP license or copyright, see http://php.aip.org/php/copyright.jsp

fnj ¼x� nxcjffiffiffi
2p
xkjjvTj
; (7)
and Z0(fnj)¼�2[1þ fnjZ(fnj)] is the derivative of the plasma
dispersion function with respect to fnj. Employing the analy-
sis of Gekelman et al.,17 the low frequency Alfven wave dis-
persion relation is
Z0ðf0eÞ1�b
1� x=xcið Þ2li
1� C0ðliÞ� f2
0e
" #¼ ck?
x
� �2
: (8)
Equation (8) incorporates finite Larmor radius and finite fre-
quency effects through the 1 – C0(li) and 1� (x=xci)2
terms, respectively.
For low ion temperatures relative to the electron temper-
ature and in the kinetic regime, where �b > 1, Z0 approaches a
constant value of �2 and the dispersion relation becomes17
x ¼ kjjvA
ffiffiffiffiffiffiffiffiffiffiffiffiffiffiffiffiffiffiffiffiffiffiffiffiffiffiffiffiffiffiffiffiffiffiffiffiffiffi1� x2
�x2
ci þ k2?q
2s
q: (9)
Note that the ion sound gyroradius scale appears naturally in
the dispersion and the finite frequency effect is equally appa-
rent. Note also that with these effects included, the Alfven
waves become dispersive, i.e., the phase speed and group ve-
locity now depend on the perpendicular wavelength of the
wave. For small perpendicular structures, k2?q
2s �1, the paral-
lel phase velocity of the wave can exceed vA. In our helicon
source plasmas, the ion sound gyroradius is typically 0.9 cm.
Thus, perpendicular wavelengths on the order of 7 cm can
have a significant effect on the wave dispersion. In the limit
of small wave frequencies relative to the ion cyclotron fre-
quency, the common expression for a dispersive kinetic
Alfven wave is recovered.20
x ¼ kjjvA
ffiffiffiffiffiffiffiffiffiffiffiffiffiffiffiffiffiffi1þ k2
?q2s
q: (10)
In the inertial regime (low density, low temperature, and
strong magnetic field), where �b < 1, Z0 is approximately
equal to f�2 and the dispersion relation becomes17
x ¼ kjjvA
ffiffiffiffiffiffiffiffiffiffiffiffiffiffiffiffiffiffiffiffiffiffiffi1� x2
�x2
ci
1þ k2?d
2e
s: (11)
Here again, in the low frequency limit, the more common
expression for dispersive inertial Alfven waves is recovered
x ¼kjjvAffiffiffiffiffiffiffiffiffiffiffiffiffiffiffiffiffiffi
1þ k2?d
2e
q : (12)
The inertial and kinetic dispersion relations both reduce to
the classic shear Alfven wave expression in the limit of zero
perpendicular wave number (k\qs 1 or k\de 1) and
very low frequency waves. For the inertial waves, the elec-
tron skin depth is typically 0.2 cm in our plasmas. Thus, for
low frequency waves in the inertial regime, perpendicular
wavelengths less than 35 cm will result in a decrease of the
wave phase speed to values less than vA.
The plasma environment created in laboratory experi-
ments also requires an assessment of the impact of electron-
ion and ion-neutral collisions on Alfven wave propagation.
Collisions become important when the electron mean free
path becomes comparable to the Alfven wave wavelength.
Gekelman et al. showed that electron-ion collision frequen-
cies as large as 50 times the ion cyclotron frequency (in their
afterglow plasma) did not significantly affect the wave prop-
agation characteristics.17 For Coulomb collision rates, in cgs
units, given by23
vei ¼pnee4 ln Kffiffiffiffiffiffiffiffiffiffiffiffiffiffiffiffiffi
2mekBT3e
p ; (13)
where lnK is the Coulomb logarithm, they argued that the
principal effect was pitch angle scattering of the electrons
and that the pitch angle scattering actually served to reduce
Landau damping of the waves by reducing the length of time
that particles could remain in Landau resonance with the
wave. For our helicon plasmas, the electron-ion collision
rates are comparable to those in the LAPD afterglow plas-
mas. Thus, Alfven wave propagation should not be sup-
pressed by Coulomb collisions.
An important difference, however, is the much larger
ion-neutral collision frequency in the bulk helicon plasma.
Whereas the LAPD plasmas are nearly fully ionized, the he-
lium helicon plasma ionization fraction in these experiments
varies from 50%�90% in the plasma core to 10% or less at
the plasma edge. The effects of neutral collisions on Alfven
wave propagation was first considered by Woods.18 Later
researchers have extended his initial work.24,25 Woods
showed that the effect of ion-neutral collision can be incor-
porated into the Alfven wave dispersion through a pseudo-
ion-cyclotron frequency x*ci¼xci=S, where S is a frequency
dependent and complex factor representing mass loading of
ions by neutrals and it describes the complex coupling
between the plasma and neutral fluids,
S ¼ 1þ qn=qm
1� ix=xni; (14)
where qm and qn are the plasma and neutral mass densities,
respectively, and xni¼ nnrniui is the ion-neutral collision fre-
quency, with nn being the neutral atom density, ui the aver-
age ion thermal velocity, and rni the ion-neutral collision
cross section. For a helium plasma, the ion-neutral collision
cross section (including charge exchange and elastic colli-
sions)26 is approximately 6.8� 10�15 cm2 for an ion temper-
ature of 0.25 eV.
The ion-neutral collision effect is introduced into the
Alfven wave expressions, Eqs. (9) and (11), through an
effective ion mass mi*¼miS. The most significant impact of
ion-neutral collisions is the downshift and of the ion-
cyclotron resonance in the Alfven dispersion relation to fre-
quencies below the ion cyclotron frequency (collisions can
also suppress the resonance). The downshift has been
observed experimentally and has been reproduced in more
complete theoretical models.15,27 For helium plasma parame-
ters of ne¼ 1� 1013 cm�3, B0¼ 560 G, and Ti¼ 0.25 eV, the
112111-3 Ducted kinetic Alfven waves in plasma Phys. Plasmas 18, 112111 (2011)
Author complimentary copy. Redistribution subject to AIP license or copyright, see http://php.aip.org/php/copyright.jsp

effect of ion-neutral collisions on the Alfven dispersion rela-
tion is shown in Fig. 1, where Eq. (9) is plotted as a function
of the ratio of neutral to plasma density for waves with zero
perpendicular wave number.
III. EXPERIMENTAL APPARATUS
The Hot hELicon eXperiment (HELIX)28 is a typical
linear helicon source with a hybrid stainless steel-PyrexTM
vacuum chamber (Fig. 2); the PyrexTM chamber is 61 cm
long and 10 cm in diameter and the stainless steel section is
91 cm long and 15 cm in diameter. One set of four 6 in. Con-
flatTM ports and four sets of four 2-3=4 in. ConflatTM crossing
ports are used for diagnostics access. The stainless steel
chamber opens into the 1.8 m diameter, 4.4 m long diffusion
LEIA (large experiment on instabilities and anisotropies)
chamber. All the measurements reported here were per-
formed in the HELIX portion of the system. A 19 cm, m¼þ 1 helical antenna is wrapped around the PyrexTM tube
and couples the rf power supplied from a 2 kW, ENI 1000, rf
amplifier into the plasma. The antenna system operates over
a frequency range of 6–18 MHz. The power is impedance-
matched through a p-matching network consisting one load
and three tuning capacitors. Ten water-cooled electromag-
nets provide a constant and nearly uniform magnetic field of
0–1400 G. The base pressure of the HELIX-LEIA system is
maintained at 10�7 Torr by three turbomolecular drag
pumps. A MKS 1179 mass flow valve with a PR-4000 flow
controller governs the flow of gas into HELIX. The gas pres-
sure is measured by a Balzers PKR250 full range pressure
gauge located at far end of the HELIX.
For a HELIX magnetic field (BH) of 560 G (correspond-
ing to a helium ion-cyclotron frequency of 213.6 kHz), zero
LEIA magnetic field (BL), an antenna frequency of 13.56
MHz, 900 W of rf power, and a helium discharge pressure of
18 mTorr, the mean electron density (ne) and temperature
(Te) as a function of axial and radial position are shown in
Fig. 3. The gas was fed into the system from the end of HE-
LIX opposite of the LEIA chamber.29,30 The measurements
shown in Fig. 3 include a linear interpolation to fill the loca-
tions in the plot between the actual measurements. The
measured values are preserved in the contour plot at each
measurement location. Also shown in the Fig. 3 are the ion
sound gyroradius and a comparison between the measured
electron thermal and Alfven speeds as a function of axial and
radial positions. The electron temperature and density meas-
urements are obtained with a moveable rf-compensated
Langmuir probe. These source parameters are chosen to
maximize the plasma density while simultaneously minimiz-
ing the on-axis neutral density (as determined by laser
absorption spectroscopy31); the measured neutral density is
�5.0� 1012 cm�3 out to a radius of �4 cm, yielding an ioni-
zation fraction of 50%. The electrostatic and=or magnetic
fluctuation measurements reported here are performed at
axial locations of z¼ 70 cm, z¼ 85 cm, and z¼ 100 cm.
The waves are launched from a dipole antenna located
at z¼ 55 cm (Fig. 4). The antenna consists of 4 turns of 4
gauge, enamel insulated, copper wire encased in a ceramic
annulus. For wave launching, the antenna is positioned at the
center of the plasma and waves excited such that the mag-
netic perturbation is parallel to the background magnetic
field, i.e., a compressional Alfven wave should be excited.
The antenna design was chosen to minimize perturbation to
the plasma by letting the high-density center of plasma pass
through the 1.52 cm diameter hole in the center of the
FIG. 1. The parallel wave number versus normalized wave frequency for
shear Alfven waves according to Eq. (9); assuming a zero perpendicular
wave number. Dispersion curves are shown for neutral to ion density ratios
of 0.5, 0.75, 1.0, 1.5, and 2. The plasma parameters used in the calculation
are ne¼ 1� 1013 cm�3, Ti¼ 0.25, and B0¼ 560 G.
FIG. 2. (Color online) Schematic of HELIX-LEIA apparatus (a portion of
the end of the LEIA chamber is shown at the right of this figure). The 19 cm
long m¼ 1 antenna surrounds the glass portion of the chamber at z¼ 0 cm.
Ten electromagnets, aligned as shown, provide the magnetic field in the
source region. The ports at 70, 85, and 100 cm were used for electrostatic
and magnetic fluctuation measurements. The launching antenna was posi-
tioned at z¼ 55 cm.
112111-4 S. Houshmandyar and E. E. Scime Phys. Plasmas 18, 112111 (2011)
Author complimentary copy. Redistribution subject to AIP license or copyright, see http://php.aip.org/php/copyright.jsp

annulus. An ENI 1040L rf amplifier (driven with a HP
33120A function generator) supplies the current to the dipole
antenna. The maximum magnetic field generated by the
antenna is measured to be 12 (62) G, over the frequency
range 10–250 kHz. To avoid overheating of the dipole
antenna, the helicon source is operated in a pulsed mode
instead of its standard steady-state mode. Each helicon pulse
lasts 256 ms, and the pulse repetition frequency is 0.034 Hz.
As a result of the helicon plasma creation process, there
is considerable rf noise contamination of internal probe meas-
urements in helicon sources. To suppress the rf noise in the
experiments reported here, 100 differentially amplified time
series (from either the electrostatic or magnetic probes) are
synchronously averaged for each measurement. The averag-
ing is synchronized with the initiation of the wave excitation
by the dipole antenna. To eliminate the possibility that the
background rf noise might also become synchronously aver-
aged since the timing of the wave launching is based on a
fixed delay from the start of the helicon pulse, a random time
delay (shorter than a half-period of the rf wave) was added to
the delay between the initiation of the helicon pulse and the
wave excitation pulse for each of the 100 measurements. The
average time series is post-processed with a narrow-band dig-
ital, zero-phase distortion, filter32 centered on the wave
launching frequency. Although the digital filter does not play
a particularly important role in the calculations of relative
phase between signals from different probes, the reduction in
noise obtained through the filtering process has a substantial
effect on the calculation of the amplitudes of the launched
waves from the probe measurements.
Each time series is recorded with a 12-bit Joerger
VTR10012 digitizer. The digitizer has maximum digitation
rate of 100 MHz and each of the eight differential channels
can acquire up to 262 144 points. In the experiments reported
here, the digitation rate was set to 1 MHz. Frequency aliasing
of the 13.56 MHz rf noise is eliminated by pre-processing
the measured signals with a differential amplifier with a roll-
off frequency well below the digitizer’s Nyquist frequency
of 500 kHz. Each measurement channel (pre-amplifier plus
digitizer) has a small DC offset that is measured and sub-
tracted out for the electrostatic and magnetic fluctuation
measurements. The long record lengths of 262 144 points for
each measurement channel permit the subdivision of each
time series measurement into smaller intervals to increase
the effective number of data sets for averaging without sig-
nificantly impacting the frequency resolution of each mea-
surement. Thus, the random noise level in each averaged
time series is further reduced by a factor of M�1=2 for a set
of M time series.
IV. ELECTROSTATIC FLUCTUATION MEASUREMENTS
A radially scanning 4-tip electrostatic probe is used to
record electrostatic fluctuations during each wave launching
pulse. The probe consists of four tungsten tips, 2 mm long
and 0.59 mm in diameter, held in a 4-bore alumina shaft that
is 4.8 mm in diameter. The alumina shaft extends 7.5 cm
from a larger diameter boron nitride cap. Inside the probe
shaft, the probe leads are enclosed in the alumina shaft and
an additional thin copper tube to prevent pickup of electro-
static fluctuations along the length of the probe shaft. The
FIG. 3. (Color online) (a) Electron density, (b) electron temperature, (c) and ion sound gyroradius versus radius and axial distance from the rf antenna. (d) The
electron thermal speeds (filled symbols) and Alfven speeds (open symbols) as functions of plasma radius for different axial locations, at z¼ 55 cm (circles), z¼ 70
cm (squares), z¼ 85 cm (diamonds), and z¼ 100 cm (triangles). The speeds are based on the density and temperature measurements shown in (a) and (b).
FIG. 4. The wave launching antenna assembly.
112111-5 Ducted kinetic Alfven waves in plasma Phys. Plasmas 18, 112111 (2011)
Author complimentary copy. Redistribution subject to AIP license or copyright, see http://php.aip.org/php/copyright.jsp

tungsten tips are arranged in a square pattern with sides of
1.4 mm (see Fig. 5).
The electrostatic probe is inserted radially so that each
two-tip pair is aligned along the background magnetic field.
Measurements at different axial locations are obtained by
physically moving the probe to a new port axial. The impact
on the experimental system is minimal as the probe is
inserted through a load-lock valve and chamber vacuum is
maintained throughout the process. Each tip measures the
floating potential fluctuations due to the waves launched from
the dipole antenna. The average of the difference between the
measurements from the top and bottom horizontally aligned
pairs of tips is reported as the axial electric field (Ez), which
is proportional to the axial current driven by the antenna. The
azimuthal electric field (Eh) is calculated from the difference
between the signals from the vertically aligned pair of tips
closest to the antenna to minimize the effects of shadowing
of the downstream tips on the azimuthal electric field mea-
surement. The radial electric field (Er) is calculated from the
differences between electric potential measurements using a
single tip (the top tip closest to the antenna) obtained at multi-
ple radial locations. For the radially resolved measurements,
the probe is moved in 0.5 cm radial increments.
Shown in Fig. 6 is an example of 100 synchronously
averaged potential fluctuation measurements for a 100 kHz
wave at r¼ 0 cm for three different axial locations: 70 cm,
85 cm, and 100 cm. The fluctuations are measured with the
top tip closest to the antenna. Also shown in Fig. 6(d) are
measurements at z¼ 70 cm as a function of radius. All time
series shown have been post-processed with the digital filter
described previously. The wave is easily visible in the meas-
urements at z¼ 70 cm and 85 cm. The radially resolved fluc-
tuation observations clearly show that, 70 cm downstream of
the antenna, the potential fluctuations arising from the wave
pulses from the antenna are strongly confined to the central
“core” of the plasma; r< 1 cm. The radial extent of the large
amplitude potential fluctuations is consistent with radial
extent of the high density region of the plasma that can pass
through the hole in the launching antenna. The two regions
of reduced electrostatic perturbation amplitude that appear in
Fig. 6 at 1.5–2.0 cm and at 4 cm roughly line up with the
outer radius of the launching antenna and the transition to
the metal shaft of the launching antenna probe. Thus, they
appear to be artifacts of the wave excitation hardware.
The electric field amplitudes obtained from the differ-
ence in signal between two tips at z¼ 70 cm are shown in
Fig. 7 as a function of radius for two different wave excitation
frequencies: 50 kHz and 100 kHz. Electric fields in all three
cylindrical directions (r, h, z) are observed with the radial
electric field being the largest. The much larger radial electric
field is shown on a different scale (left vertical axis of the
plots) than the other two components (right vertical axis of
the plots). Note that for the 50 kHz excitation, the axial and
azimuthal electric fields are limited to the inner few cm of the
plasma. For the 100 kHz wave, the electric field fluctuations
extend to larger radii, with the significant radial electric field
fluctuations out to r¼ 5 cm. The appearance of any finite
axial electric field and, thus, an axial current, is surprising
given that the antenna is design to excite compressional
Alfven waves by inducing an azimuthal electric field in the
plasma. In fact, the azimuthal electric field component is
smaller than the axial electric field for all radii and for both
FIG. 5. Sketch of the electrostatic probe. The probe is inserted with the four
tips (2 mm long and 0.59 mm in diameter) perpendicular to the magnetic
field, with the upper and lower pairs aligned along the magnetic field. The
alumina shaft extends 7.5 cm from the boron nitride housing. The top two
tips or bottom two tips can be used for axial electric field (Ez) measurements,
and the two left two or two right tips can be used for azimuthal electric field
(Eh) measurements. The tungsten tips are spaced 1.4 mm apart.
FIG. 6. (Color online) Synchronously averaged time series from the upper upstream electrostatic probe tip, for r¼ 0 cm and 100 kHz at (a) z¼ 70 cm, (b)
z¼ 85 cm, and (c) z¼ 100 cm. (d) The synchronously averaged and digitally filtered electrostatic potential recorded by the digitizer from a single tip of the
electrostatic probe at z¼ 70 cm versus radius and time.
112111-6 S. Houshmandyar and E. E. Scime Phys. Plasmas 18, 112111 (2011)
Author complimentary copy. Redistribution subject to AIP license or copyright, see http://php.aip.org/php/copyright.jsp

wave frequencies examined. These measurements suggest
that 70 cm downstream of the antenna, the wave excited by
the antenna has coupled to a mode capable of driving shear
Alfven waves in the core region of the plasma.
Also shown in Fig. 7(c) are the radial phase differences
obtained from the single probe tip as it is scanned across the
plasma radius at z¼ 70 cm. The floating potential fluctua-
tions undergo a complete 2p phase shift from r¼ 0 to r¼ 1
cm. These phase shift measurements are consistent with elec-
trostatic wave structures, i.e., perpendicular wavelengths,
which are considerably smaller than twice the chamber ra-
dius at the 70 cm location.
V. MAGNETIC FLUCTUATION MEASUREMENTS
Two arrays of magnetic fluctuation sense coils (B-dot
coils) are used to measure the phase velocity and amplitude
of the Alfven waves excited by the antenna. One probe con-
tains an array of eight radially spaced Br coils. The other
probe has an array of transverse coils that are used for Bh and
Bz measurements. Each sense coil is wound from enameled
40 gauge wire on a cylindrical, ceramic bobbin. The eight
coils are mated to the eight high-speed, differential, digitizer
channels. As B-dot probes are prone to electrostatic fluctua-
tion pickup, each probe array is inserted into a grounded 6.9
cm long, thin-walled stainless steel tube that is enclosed at
one end. The other end is vacuum welded to a micro flange.
The two leads of each coil pass through an additional 41.4
cm long stainless steel tube with another micro flange at one
end and a grounded electronics box containing 8 floating
BNC connectors at the other end. The micro flanges are
sealed with a copper gasket and the entire coil array inserted
into the vacuum chamber through a sliding vacuum seal.
Thus, the B-dot coils are electrostatically shielded by the
probe shaft and cooling air enters from the open end of the
probe shaft. For the Bh and Bz measurements, the orientation
of the internal coil array is held fixed relative to the probe
shaft with an alignment pin.
Magnetic fluctuation measurements are performed at
z¼ 70 cm, z¼ 85 cm, and z¼ 100 cm for the same wave
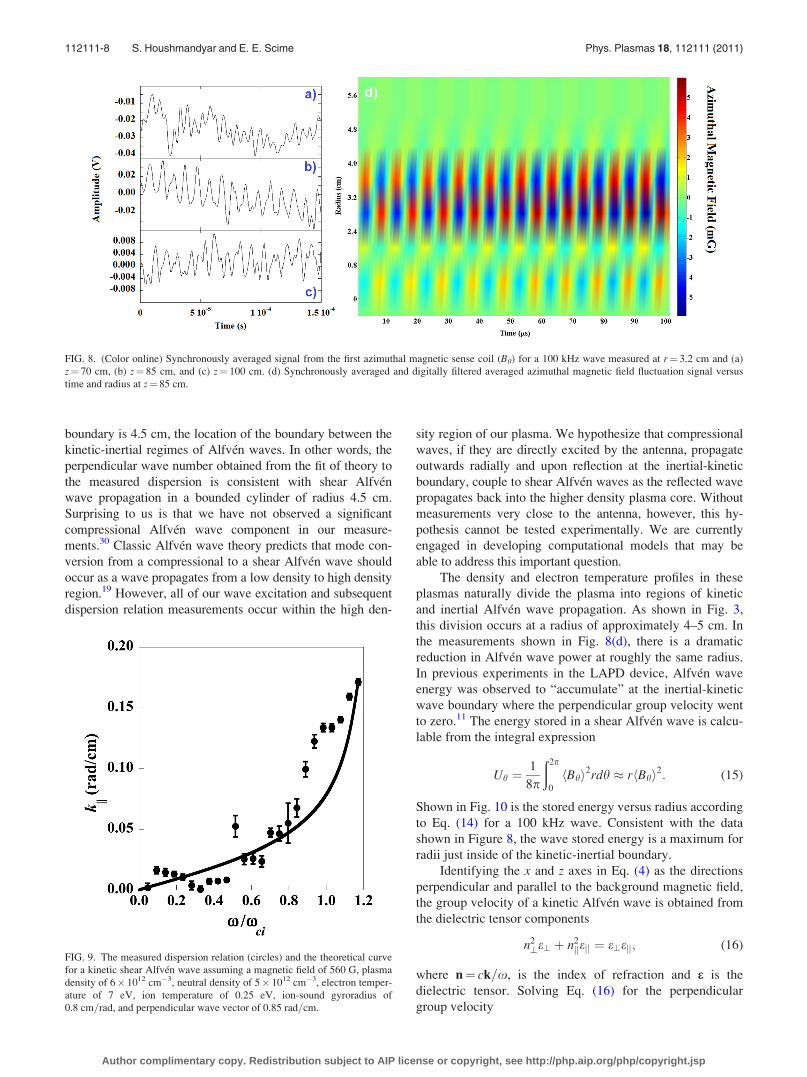
launching antenna position of z¼ 55 cm. An example of a
synchronously averaged signal, where each signal is
obtained from the first azimuthal coil, Bh, is shown in Fig. 8
for r¼ 3.2 cm and an excitation frequency of 100 kHz. Also
shown in Fig. 8(d) are radially resolved Bh measurements for
the same wave excitation frequency at z¼ 85 cm. An azi-
muthal fluctuation, a shear Alfven wave, is clearly observed
propagating in time in the radially resolved measurements.
The wave amplitude is a maximum between radii of 2.5 cm
and 4.0 cm and vanishes for radii larger than 4 cm.
The magnetic fluctuation measurements at different axial
and radial locations are post-processed to calculate the paral-
lel wave number as a function of radius and wave excitation
frequency, i.e., the dispersion relation. Only two spatially sep-
arated time series measurements are required to determine the
parallel wave number. However, in this work, measurements
were performed at three axial locations so that we could see if
there is any evolution in the parallel wavelength as the wave
propagated along the axis of the system. In fact, in the near
field of the antenna, during comparison of magnetic fluctua-
tion measurements from at z¼ 70 cm and z¼ 85 cm, we find
little evidence of shear Alfven wave propagation. Further
downstream, a clear and consistent phase difference along the
axis is obtained for Br measurements at z¼ 85 cm and
z¼ 100 cm, at r¼ 0 cm. The parallel wave number obtained
from these measurements as a function of normalized wave
frequency is shown in Fig. 9. Also shown in Fig. 9 is the
theory curve for a kinetic Alfven wave assuming a �7 cm
perpendicular wavelength (k\¼ 0.85 rad=cm) and including
the collisional effects of the measured neutral helium density.
As shown by Woods,18 Alfven wave fields must vanish at the
boundary for a confined system. In cylindrical geometry, the
wave fields are given by Bessel functions and this constraint
is satisfied when the argument of the first Bessel function,
k\a¼ 3.83, i.e., the first root. For a perpendicular wave num-
ber of 0.85 rad=cm, the radius of the effective plasma
FIG. 7. (Color online) Amplitude of radial (circles), azimuthal (diamonds), and axial (triangles) electric field components measured at z¼ 70 cm for wave ex-
citation frequencies of (a) 50 kHz and (b) 100 kHz. (c) The radial phase difference obtained from radial electric field measurements as a function of plasma ra-
dius and wave frequency at z¼ 70 cm.
112111-7 Ducted kinetic Alfven waves in plasma Phys. Plasmas 18, 112111 (2011)
Author complimentary copy. Redistribution subject to AIP license or copyright, see http://php.aip.org/php/copyright.jsp
boundary is 4.5 cm, the location of the boundary between the
kinetic-inertial regimes of Alfven waves. In other words, the
perpendicular wave number obtained from the fit of theory to
the measured dispersion is consistent with shear Alfven
wave propagation in a bounded cylinder of radius 4.5 cm.
Surprising to us is that we have not observed a significant
compressional Alfven wave component in our measure-
ments.30 Classic Alfven wave theory predicts that mode con-
version from a compressional to a shear Alfven wave should
occur as a wave propagates from a low density to high density
region.19 However, all of our wave excitation and subsequent
dispersion relation measurements occur within the high den-
sity region of our plasma. We hypothesize that compressional
waves, if they are directly excited by the antenna, propagate
outwards radially and upon reflection at the inertial-kinetic
boundary, couple to shear Alfven waves as the reflected wave
propagates back into the higher density plasma core. Without
measurements very close to the antenna, however, this hy-
pothesis cannot be tested experimentally. We are currently
engaged in developing computational models that may be
able to address this important question.
The density and electron temperature profiles in these
plasmas naturally divide the plasma into regions of kinetic
and inertial Alfven wave propagation. As shown in Fig. 3,
this division occurs at a radius of approximately 4–5 cm. In
the measurements shown in Fig. 8(d), there is a dramatic
reduction in Alfven wave power at roughly the same radius.
In previous experiments in the LAPD device, Alfven wave
energy was observed to “accumulate” at the inertial-kinetic
wave boundary where the perpendicular group velocity went
to zero.11 The energy stored in a shear Alfven wave is calcu-
lable from the integral expression
Uh ¼1
8p
ð2p
0
Bhh i2rdh � r Bhh i2: (15)
Shown in Fig. 10 is the stored energy versus radius according
to Eq. (14) for a 100 kHz wave. Consistent with the data
shown in Figure 8, the wave stored energy is a maximum for
radii just inside of the kinetic-inertial boundary.
Identifying the x and z axes in Eq. (4) as the directions
perpendicular and parallel to the background magnetic field,
the group velocity of a kinetic Alfven wave is obtained from
the dielectric tensor components
n2?e? þ n2
jjejj ¼ e?ejj; (16)
where n¼ ck=x, is the index of refraction and e is the
dielectric tensor. Solving Eq. (16) for the perpendicular
group velocity
FIG. 9. The measured dispersion relation (circles) and the theoretical curve
for a kinetic shear Alfven wave assuming a magnetic field of 560 G, plasma
density of 6� 1012 cm�3, neutral density of 5� 1012 cm�3, electron temper-
ature of 7 eV, ion temperature of 0.25 eV, ion-sound gyroradius of
0.8 cm=rad, and perpendicular wave vector of 0.85 rad=cm.
FIG. 8. (Color online) Synchronously averaged signal from the first azimuthal magnetic sense coil (Bh) for a 100 kHz wave measured at r¼ 3.2 cm and (a)
z¼ 70 cm, (b) z¼ 85 cm, and (c) z¼ 100 cm. (d) Synchronously averaged and digitally filtered averaged azimuthal magnetic field fluctuation signal versus
time and radius at z¼ 85 cm.
112111-8 S. Houshmandyar and E. E. Scime Phys. Plasmas 18, 112111 (2011)
Author complimentary copy. Redistribution subject to AIP license or copyright, see http://php.aip.org/php/copyright.jsp

vg? ¼ 2k?x2
c2�
k2jj
e?
!@ejj@xþ ejj
2xc2þ
k2jj
e2?
@e?@x
!" #�1
; (17)
where the perpendicular and parallel components of the
dielectric tensor are given in Eqs. (5) and (6). Inserting the
shear Alfven wave dispersion relation, Eq. (17) reduces to
the complex expression11
vg? ¼ �2k?q2s x�
Z0 fð Þ; (18)
where Z0 is the derivative of the plasma dispersion function
and f¼x=kjjve is the normalized wave phase speed. Follow-
ing the analysis of Vincena et al.11 and Stratton,33 it is the
real part of Z0 that is physically relevant and the group veloc-
ity becomes
vg? ¼ �2k?q2s xRe Z0 fð Þ½ �
�Z0 fð Þj j2: (19)
The real part of Z0 goes to zero, and thus, the group velocity
goes to zero, where f � 0.924. Using the measured plasma
and wave parameters, the calculated value of f is shown in
Fig. 11 as a function of plasma radius for a variety of wave
frequencies. The parallel wave numbers used for the f data
are based on the magnetic fluctuation measurements at
z¼ 85 cm and z¼ 100 cm. Thus, at the boundary separating
the kinetic and inertial Alfven regimes, theory combined
with the measured parallel wavelengths yields a prediction
that the perpendicular wave group velocity should approach
zero, thereby “ducting” the Alfven wave within the uniform
plasma region in the same way an optical fiber achieves total
internal reflection. The observed increase in stored wave
energy around radii of 4 cm, just inside the boundary at radii
of 5–6 cm evident in Fig. 11, is consistent with Alfven wave
ducting within the high density core plasma.
VI. SUMMARY
The experimental observations presented here are con-
sistent with a shear kinetic Alfven waves being ducted inside
the higher density, core, region of a helium helicon plasma.
Features of this work are similar to a previous study of
Alfven wave propagation in a helicon source.15 However, in
these experiments, the neutral helium density was directly
measured, the high density core of the plasma clearly plays a
key role in the wave dispersion, and the launching antenna
was designed to couple to compressional and not shear
Alfven waves. At the radius where the Alfven speed and the
electron thermal speed are equal, the perpendicular group ve-
locity appears to decrease and the wave energy accumu-
lates—consistent with previous experiments in LAPD.
These experiments demonstrate that Alfven wave experi-
ments are feasible in any high-density helicon source. How-
ever, since the long-term goal of these Alfven wave
experiments is to understand the ion heating mechanisms in
the Sun’s corona, future experiments will involve the excita-
tion of oppositely propagating Alfven waves at larger ampli-
tudes so that nonlinear cascades to smaller spatial scales
might be observed. Additional control of the perpendicular
wavelength of the excited waves, a key parameter in the non-
linear coupling process, might be achievable through the de-
velopment of launching structures with enforced, small scale,
periodic structures.34
ACKNOWLEDGMENTS
This work was supported by NSF Award No. PHY-
0902085.
1R. Erdelyi and V. Fedun, Scinece 318, 1572 (2007).2J.-S. He, C.-Y. Tu, E. Marsch, L.-J. Guo, S. Yao, and H. Tian, Astron.
Astrophys. 497, 525 (2009).3J. W. Belcher, Astrophys. J. 168, 509 (1971).
FIG. 10. Stored wave energy based on the azimuthal magnetic fluctuation
measurements as a function of plasma radius for wave excitation frequency
of 100 kHz. These measurements are performed at z¼ 100 cm and are nor-
malized to the peak value.
FIG. 11. (Color online) The logarithm of f (¼ x=kjjve) as a function of
plasma radius and wave excitation frequency. The wave phase difference
measurements used are based on the measurements obtained between axial
positions of z¼ 85 cm and z¼ 100 cm. At r¼ 4.8 cm, the same location as
the boundary between kinetic and inertial regimes, f has local maxima for
each driving frequency.
112111-9 Ducted kinetic Alfven waves in plasma Phys. Plasmas 18, 112111 (2011)
Author complimentary copy. Redistribution subject to AIP license or copyright, see http://php.aip.org/php/copyright.jsp

4J. V. Hollweg, J. Geophys. Res. 105(A7), 15699, doi:10.1029/
1999JA000449 (2000).5C.-Y. Tu and E. Marsch, J. Geophys. Res. 106, 8233, doi:10.1029/
2000JA000024 (2001).6J. V. Hollweg and P. A. Isenberg J. Geophys. Res. 107(A7), 1147,
doi:1029/2001JA000270 (2002).7T. K. Suzuki and S. Inutsuka, Astrophys. J. Lett. 1, L49 (2005).8V. Angelopoulos, J. P. McFadden, D. Larson, C. W. Carlson, S. B. Mende,
H. Frey, T. Phan, D. G. Sibeck, K.-H. Glassmeier, U. Auster, E. Donovan,
I. R. Mann, I. J. Rae, C. T. Russell, A. Runov, X.-Z. Zhou, and L. Kepko,
Science 321, 931 (2008).9D. J. Knudsen, J. Geophys. Res. 101, 10761, doi:10.1029/96JA00429 (1996).
10H. Alfven, Nature 150, 405 (1942).11S. Vincena, W. Gekelman, and J. Maggs, Phys. Rev. Lett. 93, 105003 (2004).12W. Gekelman, H. Pfister, Z. Lucky, J. Bamber, D. Leneman, and J. Maggs,
Rev. Sci. Instrum. 62, 2875 (1991).13Y. Amagishi, M. Inutake, T. Akitsu, and A. Tsushima, Jpn. J. Appl. Phys.
20, 2127 (1981).14Y. Amagishi and A. Tsushima, Plasma. Phys. Controlled Fusion 26, 1489
(1984).15C. Watts and J. Hanna, Phys. Plasmas 11, 1358 (2004).16O. Grulke, C. M. Franck, and T. Klinger, AIP Conf. Proc. 669, 412
(2003).17W. Gekelman, S. Vincena, D. Leneman, and J. Maggs, J. Geophys. Res.
102, 7225, doi:10.1029/96JA03683 (1997).18L. C. Woods, J. Fluid. Mech. 13, 570 (1962).
19A. Hasegawa and C. Uberoi, The Alfven Waves (Technical Information
Center, U.S. Department of Energy, USA, 1982).20K. Stasiewicz, P. Bellan, C. Chaston, C. Kletzing, R. Lysak, J. Maggs, P.
Pokhotelov, C. Seyler, P. Shukla, L. Stenflo, A. Streltsov, and J.-E. Wah-
land, Space. Sci. Rev. 92, 423 (2000).21D. G. Swanson, Plasma Kinetic Theory (CRC, Taylor & Francis Group,
Boca Raton, FL, 2008).22R. L. Lysak and W. Lotko, J. Geophys. Res. 101, 5085, doi:10.1029/
95JA03712 (1996).23R. A. Koch and W. Horton, Jr., Phys. Fluids 18, 861 (1975).24G. Muller, Plasma Phys. 16, 813 (1974).25D. G. Swanson, Plasma Waves, 2nd ed. (IOP, Bristol, UK, 2003).26S. Yun, K. Taylor, and G. R. Tynan, Phys. Plasmas 7, 3448 (2000).27Y. Amagishi and M. Tanaka, Phys. Rev. Lett. 71, 360 (1993).28J. L. Kline, E. E. Scime, R. F. Boivin, A. M. Keesee, and X. Sun, Plasma
Sources Sci. Technol. 11, 413 (2002).29S. Houshmandyar, S. Sears, S. Chakraborty Thakur, J. Carr, Jr., M. Gal-
ante, and E. E. Scime, Rev. Sci. Instrum. 81, 10D704 (2010).30S. Houshmandyar, Ph.D. thesis, Department of Physics, West Virginia
University, 2010.31S. Houshmandyar and E. E. Scime, Plasma Sources Sci. Technol. (to be
published).32F. Gustafsson, IEEE Trans. Signal Process. 44, 988 (1996).33J. A. Stratton, Electromagnetic Theory (McGraw-Hill, New York, 1941).34C. A. Kletzing, S. R. Bounds, and J. Martin-Hinder, Phys. Rev. Lett. 90,
035004 (2003).
112111-10 S. Houshmandyar and E. E. Scime Phys. Plasmas 18, 112111 (2011)
Author complimentary copy. Redistribution subject to AIP license or copyright, see http://php.aip.org/php/copyright.jsp