dual impact of elevated temperature on plant defence and ... temperature... · dual impact of...
TRANSCRIPT

ARTICLE
Dual impact of elevated temperature on plantdefence and bacterial virulence in ArabidopsisBethany Huot 1,2,3, Christian Danve M. Castroverde 1,3, André C. Velásquez1, Emily Hubbard1,
Jane A. Pulman4,5, Jian Yao6, Kevin L. Childs 4,5, Kenichi Tsuda 7,
Beronda L. Montgomery1,2,8,9 & Sheng Yang He1,2,3,4,9,10
Environmental conditions profoundly affect plant disease development; however, the
underlying molecular bases are not well understood. Here we show that elevated tempera-
ture significantly increases the susceptibility of Arabidopsis to Pseudomonas syringae pv. tomato
(Pst) DC3000 independently of the phyB/PIF thermosensing pathway. Instead, elevated
temperature promotes translocation of bacterial effector proteins into plant cells and causes
a loss of ICS1-mediated salicylic acid (SA) biosynthesis. Global transcriptome analysis reveals
a major temperature-sensitive node of SA signalling, impacting ~60% of benzothiadiazole
(BTH)-regulated genes, including ICS1 and the canonical SA marker gene, PR1. Remarkably,
BTH can effectively protect Arabidopsis against Pst DC3000 infection at elevated temperature
despite the lack of ICS1 and PR1 expression. Our results highlight the broad impact of a major
climate condition on the enigmatic molecular interplay between temperature, SA defence and
function of a central bacterial virulence system in the context of a widely studied susceptible
plant–pathogen interaction.
DOI: 10.1038/s41467-017-01674-2 OPEN
1 Department of Energy Plant Research Laboratory, Michigan State University, East Lansing, MI 48824, USA. 2 Cell and Molecular Biology Program, MichiganState University, East Lansing, MI 48824, USA. 3 Plant Resilience Institute, Michigan State University, East Lansing, MI 48824, USA. 4Department of PlantBiology, Michigan State University, East Lansing, MI 48824, USA. 5 Center for Genomics Enabled Plant Science, Michigan State University, East Lansing,MI 48824, USA. 6 Department of Biological Sciences, Western Michigan University, Kalamazoo, MI 49008, USA. 7Department of Plant-MicrobeInteractions, Max Planck Institute for Plant Breeding Research, 50829 Cologne, Germany. 8 Department of Biochemistry and Molecular Biology, MichiganState University, East Lansing, MI 48824, USA. 9Department of Microbiology and Molecular Genetics, Michigan State University, East Lansing, MI 48824,USA. 10 Howard Hughes Medical Institute, Michigan State University, East Lansing, MI 48933, USA. Correspondence and requests for materials should beaddressed to B.L.M. (email: [email protected]) or to S.Y.H. (email: [email protected])
NATURE COMMUNICATIONS |8: 1808 |DOI: 10.1038/s41467-017-01674-2 |www.nature.com/naturecommunications 1
1234
5678
90
P lant diseases represent one of the most important causes ofcrop loss worldwide1; therefore, understanding themechanisms underlying disease development is critical for
developing effective disease control measures as part of globalefforts to enable crop yields commensurate with increasingdemand1,2. Weather plays a large role in determining theoutcome of plant–pathogen interactions, and it has been notedthat disease epidemics are more likely to occur when environ-mental conditions are suboptimal for the plant3,4. Responding tocombined stresses (e.g., abiotic plus biotic) is challenging forplants because the response needed to mitigate one stress oftencan exacerbate another4,5. Breeding efforts to enhance yieldtypically reduce genetic diversity, which increases vulnerability todisease, and is also likely to negatively impact the resilience ofplant immunity under adverse environmental conditions1,6.Increasing our understanding of how specific environmentalfactors affect the host and the pathogen as well as their interac-tions can inform strategies for developing robust crop resistanceunder increasingly unpredictable climate conditions.
The ability of the bacterial pathogen Pseudomonas syringae pv.tomato DC3000 (Pst DC3000) to cause disease in Arabidopsisthaliana (hereafter Arabidopsis) has made it a popular model forstudying plant–pathogen interactions7. Two important virulencemechanisms employed by Pst DC3000 to cause disease are thephytotoxin coronatine (COR) and the type III secretion system(T3SS), which translocates bacterial effectors into host cells7.Conflicting results exist with respect to the effect of temperatureon these virulence mechanisms. Elevated temperature has anegative effect on the expression of both COR-related and T3SS-related genes in vitro8. However, elevated temperature did notaffect Pst DC3000 production of COR in planta9. Whetherelevated temperature affects the production and translocation oftype III bacterial effectors into plants is unknown.
Salicylic acid (SA) is a major plant defence hormone importantfor both local and systemic resistance against biotrophicand hemi-biotrophic pathogens, such as Pst DC300010. InArabidopsis, pathogen-induction of SA biosynthesis occurs pre-dominantly through the isochorismate pathway involving ICS111.Following SA induction, the master regulator, NPR1, accumulatesin the nucleus where it interacts with TGA and WRKY tran-scription factors (TFs) to promote transcriptional reprogram-ming12. Among the many genes induced by SA, PR1 is one ofthe most widely used markers for SA signalling in Arabidopsis13.SA-mediated defence has been well established as a crop pro-tecting mechanism; for example, an SA synthetic analogue, ben-zothiadiazole (BTH), can provide resistance resulting in increasedyield in multiple crops, including wheat14 and maize15. Addi-tionally, over-expression of NPR1 has been shown to improvedisease resistance in rice16. Basal defence against Pst DC3000 andinduction of SA during effector-triggered immunity have beenshown to be compromised at elevated temperature17,18. However,it is unclear whether either of these outcomes results from a directimpact of temperature on the SA pathway, as SA-deficientmutants were reported to retain temperature sensitivity duringbasal defence18, and loss of effector-triggered immunity-inducedSA may be an indirect effect resulting from temperature-mediatedloss of upstream resistance (R) protein function. SA also plays arole in pattern-triggered immunity19, which has been reported tonot be suppressed at elevated temperature20.
It was not clear until recently how plants sense elevatedtemperature. The phyB red-light photoreceptor is a negativeregulator of the PIF4 growth-promoting TF21, and was shown tofunction as a thermosensor in plants22,23. At elevated tempera-tures, heat inactivation of phyB results in de-repression of PIF4-regulated genes, enabling growth22. Another recent study suggeststhat PIF4 mediates defence suppression at elevated temperature;
however, all the pif mutants tested retained temperature-sensitivepathogen growth24.
Although previous research has studied the effects of elevatedtemperatures on effector-triggered immunity or pattern-triggeredimmunity, our knowledge of the impact of elevated temperatureon disease development—from pathogen virulence systemsand host defence to temperature sensing—during a susceptibleplant–pathogen interaction remains fragmented, preventingformulation of a cohesive model that could guide futureresearch. We sought to address this knowledge gap by studyingthe model susceptible Arabidopsis-Pst DC3000 pathosystem.Contrary to prevailing results obtained in vitro, we discoveredthat elevated temperature has a positive effect on the function ofthe T3SS in planta, and a negative, but phyB/PIF-independenteffect on SA-mediated defence in the host, resulting in overallenhanced disease. Remarkably, although BTH-induction of thetemperature-sensitive PR1/ICS1 branch is compromised at 30 °C,BTH-mediated protection against Pst DC3000 persists. Wepropose an integrated model illustrating the interplays betweentemperature, SA-mediated defence and the function of the T3SSin the context of a susceptible plant–pathogen interaction.
ResultsElevated temperature enhances disease susceptibility.Temperatures between 27–30 °C are considered ‘moderatelyelevated’ for Arabidopsis, which is more susceptible to Pst DC3000infection in this temperature range18,24–27. However, some of thesestudies used plants that were grown at acclimated temperatures forlong periods of time before disease assays18,27, resulting in plants withdramatically different morphology, including exaggerated hypocotyland petiole elongation, due to PIF4-induction of auxin28. Althoughperiods of elevated temperature vary in nature, to minimize theimpact of physiological differences confounding our study, we firstassessed the effect of a shorter, 2-day temperature acclimation periodon infection of Arabidopsis plants by Pst DC3000. Four-week-oldplants were acclimated to test chambers at 23 °C (control) or 30 °C(test) for only 48 h prior to syringe-infiltration with Pst DC3000.Morphological differences were greatly reduced between test andcontrol plants acclimated for 48 h relative to those acclimated for7 days (Supplementary Fig. 1a–c). We observed a 30-fold increase inbacterial growth as well as a dramatic increase in disease-associatedchlorosis in plants at 30 °C relative to those at 23 °C (Fig. 1a, b). Incontrast, Pst DC3000 grew similarly at 23 °C and 30 °C in vitro(Supplementary Fig. 2), suggesting that the effect of elevated tem-perature on Pst DC3000 multiplication is plant-dependent.
We next conducted Pst DC3000 infections in plants thatwere (i) acclimated and kept at 23 °C following infection (23 °C→23 °C), (ii) acclimated at 30 °C and shifted to 23 °C (30 °C →23 °C), (iii) acclimated at 23 °C and shifted to 30 °C followinginfection (23 °C → 30 °C) or (iv) acclimated and kept at 30 °Cfollowing infection (30 °C → 30 °C). We found that the post-infection temperature is the determining factor in diseasesusceptibility (Supplementary Fig. 3). Although plants wereconsistently more susceptible to Pst DC3000 at 30 °C relativeto plants at 23 °C, the degree of enhanced disease susceptibilitywas more consistent following a 2-day acclimation at 30 °C(Supplementary Fig. 3). Therefore, we used a 2-day acclimation to30 °C prior to inoculation for the remainder of our experiments.
PIF4 was recently proposed as a regulator of growth promotionand immunity suppression at elevated temperature24. Todetermine whether PIFs are responsible for enhanced suscept-ibility at elevated temperature in our system, disease assays wereconducted with wild type (WT, Col-0) and pif1 pif3 pif4 pif529
(hereafter, pifq) mutant plants 1 dpi, 2 dpi and 3 dpi at both 23 °Cand 30 °C. No difference in bacterial growth was observed
ARTICLE NATURE COMMUNICATIONS | DOI: 10.1038/s41467-017-01674-2
2 NATURE COMMUNICATIONS |8: 1808 |DOI: 10.1038/s41467-017-01674-2 |www.nature.com/naturecommunications

between the WT and pifq mutant plants at 30 °C for each timepoint assessed (Supplementary Fig. 4a), indicating that PIFs donot play a major role in mediating elevated temperature-dependent enhancement of disease susceptibility to Pst DC3000inside the infected leaves (i.e., when bacteria are infiltrated intothe leaf apoplast). Next, we examined the possibility thatenhanced susceptibility at elevated temperature is due to heatinactivation of the phyB photoreceptor, which is a positiveregulator of SA-induced PR1 gene expression and has been shownto be a thermosensor for photomorphogenesis22,23,30. To test this,we assessed disease susceptibility in temperature stablephyB transgenic lines (35S::PHYBY276H, referred to as YHBhereafter)31,32. We observed no difference in disease phenotypebetween YHB and Landsberg erecta (Ler) WT plants at either
temperature (Supplementary Fig. 4b). Taken together, weconclude that enhanced susceptibility at elevated temperature isindependent of the phyB/PIF pathway.
Elevated temperature enhances bacterial type III secretion. Wenext examined whether enhanced multiplication of Pst DC3000in planta at 30 °C requires bacterial virulence factors. Specifically,growth of two bacterial mutant strains, Pst DC3000 hrcC−
(hereafter hrcC−, defective in the T3SS33) and Pst DC3118(defective in COR production34), was compared with growthof Pst DC3000 in Arabidopsis plants kept at 23 °C or 30 °C. ThehrcC− mutant strain had no detectable increase in growth at 30 °C(Fig. 1c). In contrast, while disease-associated leaf chlorosis wasgreatly reduced in Pst DC3118-infected plants (Fig. 1d), growth ofthis strain was 400-fold higher at 30 °C than at 23 °C (Fig. 1c),indicating that enhanced growth of Pst DC3000 in planta at 30 °Crequires a functional T3SS but not COR.
We found a requirement of the T3SS for enhanced disease at30 °C surprising because previous in vitro studies had shown anegative effect of elevated temperature on the T3SS8. To resolvethis unexpected dilemma, we directly examined T3SS-mediatedbacterial effector translocation into plant cells at 30 °C using PstDC3000 strains with either the AvrPto, AvrPtoB, HopU1 orHopG1 effectors fused to the CyaA reporter35. To ensuredifferences in effector translocation were not influenced bybacterial populations, plant samples were first selected based onhaving similar bacterial populations at the 4–6 h post-infiltration(hpi) time point used for the translocation assay (SupplementaryFig. 5a, b). A hrcC− mutant strain carrying the PnptII::avrPto-CyaA plasmid was used as a negative control for the translocationassay. We observed a significant increase (2–4-fold) in transloca-tion of all tested effectors at 30 °C compared to that at 23 °C(Fig. 1e), suggesting that, contrary to the prevailing notion fromin vitro studies, increased Pst DC3000 virulence at 30 °C is linkedto increased translocation of bacterial effector proteins.
The SA pathway is compromised at elevated temperature. AsSA-mediated defence plays a major role in protecting Arabidopsisagainst virulent Pst DC3000, we investigated the possibility thatthe SA pathway is compromised at 30 °C. We measured ICS1 andPR1 marker gene expression as well as SA metabolite levels 24 hpiwith mock or Pst DC3000. We observed significant Pst DC3000-induction of both ICS1 (7-fold) and PR1 (60-fold) in plantskept at 23 °C, whereas neither gene was induced by the pathogenat 30 °C (Fig. 2a). Similarly, total SA was induced by Pst DC3000to levels 7-fold higher than in mock-infiltrated plants at 23 °C, butno significant increase was detected at 30 °C (Fig. 2b). To deter-mine whether loss of SA can account for enhanced susceptibilityat elevated temperature, we tested bacterial growth at 1 dpi, 2 dpiand 3 dpi in both WT (Col-0) and sid2-2 (hereafter, ics1) mutantplants. As previously reported18, ics1 plants were more suscep-tible to Pst DC3000 than WT plants at 23 °C, showing 70-foldmore bacterial growth at 2 dpi, which is prior to the bacterialpopulation reaching saturation (Fig. 2c). Under our experimentalconditions, the ics1 mutant showed only a slight (3-fold) increasein bacterial growth at 1 dpi, but showed similar bacterial loadsat 2 dpi and 3 dpi at 23 °C vs. 30 °C (Fig. 2c). As the diseasephenotype of the ics1 mutant at 23 °C resembles that observed inWT plants at 30 °C, we speculated that loss of pathogen-inducedSA in WT plants is likely a major mechanism for enhanceddisease at elevated temperature.
To determine whether increased translocation at elevatedtemperature occurs in addition to or because of loss of SA, wequantified translocation of bacterial effectors in WT and ics1mutants at 23 °C and 30 °C. As before, bacterial populations were
23456789
ba
***
Pst DC3000
30 °C23 °C23 °C 30 °C
c
e
d
2DC3000 DC3118 hrcC–
hrcC–
3456789
10
b
d
c
e
a a
DC3000
DC3118
30 °C23 °C
0
5
10
15
20
******
***
AvrPtoB hrcC–AvrPto
ns
***
23 °C 30 °C
23 °C 30 °C
Log 1
0 C
FU
cm
–2Lo
g 10
CF
U c
m–2
pmol
cA
MP
μg–1
pro
tein
HopU1 HopG1
Fig. 1 Enhanced growth of Pst DC3000 in planta at 30 °C requires the typeIII secretion system and results in elevated levels of effector translocation.a Bacterial growth in plants (n= 4) 3 days after syringe-infiltration with PstDC3000. b Disease symptoms at three dpi for plants in (a). c Bacterialgrowth in plants (n= 4) 3 days after syringe-infiltration with Pst DC3000,Pst DC3118 (coronatine-deficient mutant) or hrcC− (T3SS-deficient mutant)strains. d Disease symptoms three dpi for plants in (c). e Amount of cyclicAMP (cAMP) generated in temperature-acclimated plants syringe-infiltrated with Pst DC3000(PnptII::avrPto-CyaA) (n= 4), Pst DC3000(Ptac::avrPtoB-CyaA) (n= 4), Pst DC3000(Ptac::hopU1-CyaA) (n= 6), Pst DC3000(Ptac::hopG1-CyaA) (n= 6) or hrcC−(PnptII::avrPto-CyaA) (n= 4) strains.Tissue was collected at 4–6 hpi for quantification of cAMP, which wasnormalized by total protein. Higher levels of cAMP indicate moretranslocation of bacterial effectors. All data are representative of threeindependent experiments; graphical data are presented as the mean±standard error of the mean (s.e.m.), with n= biological replicates. Lettersindicate statistical significance based on a two-factor ANOVA with Tukey’sHSD post hoc analysis (p< 0.05); samples sharing letters are notsignificantly different. Asterisks indicate statistical significance based on aStudent’s t test (***p< 0.001) of pairwise comparisons for each individualeffector strain at 23 °C vs. 30 °C; ‘ns’ indicates no significance
NATURE COMMUNICATIONS | DOI: 10.1038/s41467-017-01674-2 ARTICLE
NATURE COMMUNICATIONS |8: 1808 |DOI: 10.1038/s41467-017-01674-2 |www.nature.com/naturecommunications 3

assessed at the same time point as used for translocation assays toconfirm differences in translocation are not due to differences inbacterial population (Supplementary Fig. 5c). We observed asignificant increase (2-fold) in bacterial effector translocation intoics1 vs. WT plants at 23 °C (Fig. 2d), indicating that loss of SAenables more effector translocation. However, there was alsosignificantly more translocation of effector proteins into both WTand ics1 mutant plants at 30 °C (4–5-fold, Fig. 2d), indicatingthat, at elevated temperature, both loss of SA biosynthesis in thehost and increased bacterial translocation of effector proteinslikely contribute to enhanced disease development.
Suppression of SA responses at 30 °C is pathogen independent.We next used BTH to directly interrogate the effect of elevatedtemperature on SA biosynthesis and signalling in a pathogen-freesystem. BTH is widely used as a surrogate for the SA signal, and isa potent inducer of SA response genes in Arabidopsis10,36. BTHsignificantly induced both ICS1 (10-fold) and PR1 (>2500-fold)gene expression as well as total SA levels (15-fold) in plants keptat 23 °C with no significant induction of ICS1, PR1 or SA levelsobserved at 30 °C (Fig. 3a, b). Similarly, BTH-induction of callosedeposition, which is thought to reinforce plant cell walls againstpathogen penetration37, was observed at 23 °C (8-fold) but notat 30 °C (Fig. 3c, d). In contrast, although slightly reduced atelevated temperature, flg22 elicited a strong callose response atboth 23 °C (90-fold) and 30 °C (50-fold; Supplementary Fig. 6a,b), indicating that the observed effect of temperature on BTH-induced callose deposition is likely due to compromised SAsignalling rather than an effect on the callose synthase enzyme.
NPR1 nuclear localization is retained at 30 °C. Elevatedtemperature negatively affects R protein-mediated diseaseresistance19,20. Zhu et al. (2010) showed that loss of R proteinnuclear localization contributes to compromised R-mediateddefence at elevated temperature (28 °C)38. NPR1 is a key regulator
of SA signalling and accumulates in the nucleus upon SA signalperception10,12. As nuclear localization of NPR1 is requiredfor PR1 gene induction39, it is possible that nuclear exclusionof NPR1 results in loss of PR1 gene induction at 30 °C. Toexamine this possibility, we generated transgenic lines expressinga functional NPR1 protein tagged at the C-terminal end with theyellow fluorescent protein (YFP) under control of the nativeNPR1 promoter (pNPR1::NPR1-YFP, hereafter, NPR1-Y1;Supplementary Fig. 7b–d) in a confirmed npr1 knock-out mutant(Supplementary Fig. 7a, c, d). Transgenic lines expressing the YFPprotein under the control of the constitutive 35S promoter (p35S::YFP) were also generated as controls. A nuclear YFP signal wasobserved in mock-treated and BTH-treated NPR1-Y1 plants atboth 23 °C and 30 °C, although the signal was extremely weak inmock-treated plants at both temperatures (Fig. 4a). There was noobservable effect of treatment (chemical or temperature) on YFPsignal detected in the p35S::YFP control, and no YFP signal wasdetected in the parent npr1 plants (Supplementary Fig. 8a, b).
To independently confirm NPR1 nuclear localization,subcellular fractionation experiments were also conducted.NPR1-YFP was observed in whole-cell lysate and both fractionsof BTH-treated samples at both temperatures (Fig. 4b). Westernblotting of UGPase and H3 proteins, which were used ascytosolic-fraction and nuclear-fraction specific markers, respec-tively, showed significant enrichment within their respectivefractions (Fig. 4b). Thus, the confocal microscopic and nuclearfractionation data both show that elevated temperature does notprevent BTH-induced nuclear accumulation of the NPR1 protein.
To confirm the loss of BTH-induction of PR1 proteinaccumulation, western blot analysis using a PR1 antibodywas also conducted with fractionated protein samples confirmedto have NPR1 localized to the nucleus. Similar to PR1 geneexpression (Fig. 3a), PR1 protein was only detectable in BTH-treated plants at 23 °C (Supplementary Fig. 9b). Therefore, inaddition to loss of SA biosynthesis, there appears to be a negativeeffect of elevated temperature on SA-mediated signalling
0
10
20
30
40
a a a
bTotal SA
23 °C
Mock DC3000a b
0
10
20
30
40
23 °C0
2
4
6
8
a aa
bICS1
Nor
mal
ized
gen
eex
pres
sion
23 °C 30 °C
a aa
b PR1
Mock DC3000 Mock DC3000
Nor
mal
ized
gen
eex
pres
sion
23456789
10
23 °C
WT ics1
ABBB
a′bc′b′c′
accb
23 °C 23 °C
c
1 dpi
01234567
WT ics1
23 °C
ab
cd
d
6 hpi
Log 10
CF
U c
m–2
30 °C 30 °C 30 °C
2 dpi 3 dpi
30 °C
μg g
–1 F
WLo
g 2 pm
ol c
AM
Pμg
–1 p
rote
in
30 °C
30 °C
Fig. 2 Enhanced disease at elevated temperature corresponds to loss of SA biosynthesis. a SA marker gene expression (n= 3) and (b) SA metabolitequantification (n= 4) 24 h after vacuum-infiltration with mock or Pst DC3000. qPCR was used for gene expression analysis, with expression of ICS1 andPR1 normalized to the expression of PP2AA3. SA and SAG metabolites were quantified using LCMS, converted to ng, normalized by sample fresh weight(FW) mass (g), and then combined and reported as total SA. c Bacterial growth in WT and ics1 mutant plants (n= 4) at 1, 2 and 3 days after syringe-infiltration (dpi) with Pst DC3000. d Translocation of bacterial effectors in WT and ics1 mutant plants (n= 4) syringe-infiltrated with Pst DC3000(PnptII::avrPto-CyaA). All data are representative of three independent experiments, and are presented as the mean± s.e.m., with n= biological replicates. Lettersindicate statistical significance based on a two-factor ANOVA with Tukey’s HSD post hoc analysis (p< 0.05); samples sharing letters are not significantlydifferent. Data for each time point in (c) were analysed separately
ARTICLE NATURE COMMUNICATIONS | DOI: 10.1038/s41467-017-01674-2
4 NATURE COMMUNICATIONS |8: 1808 |DOI: 10.1038/s41467-017-01674-2 |www.nature.com/naturecommunications

downstream of NPR1 leading to PR1 expression and proteinaccumulation.
Temperature bifurcates the SA-regulated transcriptome. Thedramatic effect of elevated temperature on BTH-induction ofthe canonical SA marker genes PR1 and ICS1 prompted us toconduct RNA sequencing (RNA-seq) to determine the extent ofelevated temperature’s impact on BTH-mediated global transcrip-tional reprogramming. We identified 169 differentially expressedgenes (DEGs) in response to temperature alone (23 °C mock vs.30 °C mock) and 2820 DEGs in response to BTH (BTH vs. mock at23 °C or 30 °C) using cut-off criteria of 4-fold change in expression(log2 value≥± 2) and Storey’s q-value< 0.01 (q-values calculatedfrom p-values based on t test, see Supplementary Note 1 for furtherdetails; Supplementary Data 1). Based on gene ontology (GO)analysis of the 23 °C mock vs. 30 °C mock DEGs, genes upregulatedat 30 °C are primarily involved in response to abiotic stress, such asheat, whereas genes downregulated at 30 °C are primarily annotatedas being involved in responses to biotic stress (SupplementaryTable 1, Supplementary Data 2).
Because changes in basal gene expression due to temperaturewill impact fold change, we analysed the BTH vs. mock DEGs intwo ways: (i) fold change (BTH/mock) and (ii) expression levels(23 °C BTH vs. 30 °C BTH). k-means cluster analysis (k= 9) was
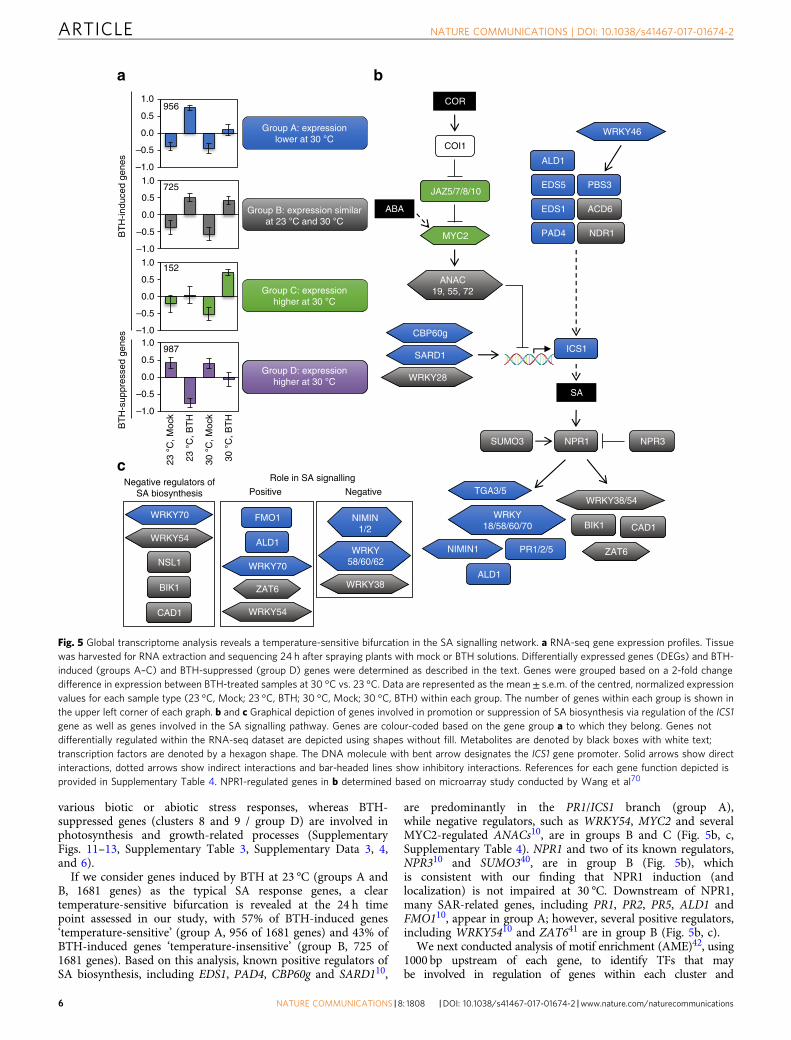
conducted with the 2820 BTH-responsive DEGs, and a heat mapwas generated to visualize gene expression patterns. Clusters 1–7contain genes induced by BTH (1833 genes), with cluster 1, 2 and3 genes exhibiting compromised induction, cluster 4 genes havingsimilar induction, and cluster 5, 6 and 7 genes showing enhancedinduction at 30 °C; clusters 8 and 9 contain genes suppressedby BTH at 23 °C but compromised in suppression at 30 °C(987 genes, Supplementary Fig. 10). For the analysis based onexpression levels, a 2-fold cut-off was used to categorize genes asfollows: group A, expression lower at 30 °C vs. 23 °C (956 genes);group B, expression similar at 30 °C and 23 °C (725 genes); andgroup C, expression higher at 30 °C vs. 23 °C (152 genes; Fig. 5a).As 810 out of 987 BTH-suppressed genes showed higherexpression at 30 °C, these genes were kept in a single group D(Fig. 5a). A comparison of gene distribution by cluster andgroup reveals that 42% of genes that did not show differentialinduction based on cluster analysis (i.e. cluster 4) showedcompromised expression at 30 °C based on group analysis(i.e. group A), indicating that cluster-based and group-basedanalyses have different sensitivities (Supplementary Table 2).Based on meta-analysis of publicly available microarray datasets(clusters only) and functional annotations using GO analyses,BTH-induced genes (clusters 1–7 / groups A–C) are involved in
0
1
2
3
4
5
Nor
mal
ized
gen
eex
pres
sion
0
25
50
75
0
20
40
60
80
0
10
20
30
a
b
d
c
23 °C
a a a
b
a a a
b
23 °C
a a a
b
23 °C
30 °C
Mock
Nor
mal
ized
gen
eex
pres
sion
BTH
ICS1 PR1
Total SA
Cal
lose
mm
–2
a a a
b
Mock BTH Mock BTH
Mock BTH Mock BTH
μg g
–1 F
W
30 °C 23 °C 30 °C
30 °C 23 °C 30 °C
Fig. 3 Induction of SA defence responses is compromised at 30 °C. a SAmarker gene expression in plants (n= 6) 24 h after spraying with mock orBTH. b SA metabolite quantification in plants (n= 4) 48 h after sprayingwith mock or BTH. Gene expression and LCMS data were processed andanalysed as described in Fig. 2. c Quantification and d representativeimages of callose accumulation from plants (n= 6) 24 hpi with mock orBTH. Scale bar length represents 100 µm. All data are representative ofthree independent experiments. All graphical data are presented as themean± s.e.m., with n= biological replicates. Letters indicate statisticalsignificance based on a two-factor ANOVA with Tukey’s HSD post hocanalysis (p< 0.05); samples sharing letters are not significantly different
a
b
BTH
WNPR1-Y1
α-GFP
α-UGPase
α-H3
BTHMock
YFP
23 °C
OverlayYFP
30 °C
25 kDa
55 kDa
100 kDa
130 kDa
Overlay
npr1C N W
30 °C23 °C– + – +
30 °C23 °C– + – +
30 °C23 °C– + – + +
23 °C
Fig. 4 Induction of NPR1 nuclear localization is retained at 30 °C.a Representative confocal microscopy images of NPR1-YFP plants (n= 4) 24 hafter spraying with mock or BTH. Images are of YFP (yellow) alone or YFPoverlaid on Brightfield (BF, grey-scale). Scale bar length represents 10 µm. bWestern blots of whole-cell lysate (W), non-nuclear (C, cytosolic) andnuclear (N) enriched fractions isolated from NPR1-Y1 transgenic plants treatedwith mock (−) or BTH (+) solutions at 23 °C or 30 °C. Equal volumes (10 µl)of each protein sample were loaded and run in two separate 4–12 % gradientSDS-PAGE gels. Following transfer to PVDF membranes, one blot was probedwith α-GFP primary antibody to detect the NPR1-YFP protein while the otherblot was cut in two and the upper portion probed with α-UGPase (a cytosolicprotein control) and the lower portion probed with α-H3 (a nuclear proteincontrol). Whole-cell lysate extracted from npr1 plants treated with BTH at 23 °C was used as the negative control for the NPR1-YFP band. All data arerepresentative of three independent experiments
NATURE COMMUNICATIONS | DOI: 10.1038/s41467-017-01674-2 ARTICLE
NATURE COMMUNICATIONS |8: 1808 |DOI: 10.1038/s41467-017-01674-2 |www.nature.com/naturecommunications 5
various biotic or abiotic stress responses, whereas BTH-suppressed genes (clusters 8 and 9 / group D) are involved inphotosynthesis and growth-related processes (SupplementaryFigs. 11–13, Supplementary Table 3, Supplementary Data 3, 4,and 6).
If we consider genes induced by BTH at 23 °C (groups A andB, 1681 genes) as the typical SA response genes, a cleartemperature-sensitive bifurcation is revealed at the 24 h timepoint assessed in our study, with 57% of BTH-induced genes‘temperature-sensitive’ (group A, 956 of 1681 genes) and 43% ofBTH-induced genes ‘temperature-insensitive’ (group B, 725 of1681 genes). Based on this analysis, known positive regulators ofSA biosynthesis, including EDS1, PAD4, CBP60g and SARD110,
are predominantly in the PR1/ICS1 branch (group A),while negative regulators, such as WRKY54, MYC2 and severalMYC2-regulated ANACs10, are in groups B and C (Fig. 5b, c,Supplementary Table 4). NPR1 and two of its known regulators,NPR310 and SUMO340, are in group B (Fig. 5b), whichis consistent with our finding that NPR1 induction (andlocalization) is not impaired at 30 °C. Downstream of NPR1,many SAR-related genes, including PR1, PR2, PR5, ALD1 andFMO110, appear in group A; however, several positive regulators,including WRKY5410 and ZAT641 are in group B (Fig. 5b, c).
We next conducted analysis of motif enrichment (AME)42, using1000 bp upstream of each gene, to identify TFs that maybe involved in regulation of genes within each cluster and
–1.0
–0.5
0.0
0.5
1.0–1.0
–0.5
0.0
0.5
1.0
–1.0
–0.5
0.0
0.5
1.0
–1.0
–0.5
0.0
0.5
1.0
WRKY54
ba
956
725
152
987
Negative regulators ofSA biosynthesis
BIK1
NSL1
WRKY54
WRKY70
TGA3/5
NPR1
SA
ICS1
CBP60g
SARD1
WRKY28
ANAC19, 55, 72
MYC2
COR
COI1
JAZ5/7/8/10
ABA EDS1
PAD4
PBS3
NDR1
SUMO3 NPR3
WRKY46
WRKY18/58/60/70
WRKY58/60/62
WRKY38
NIMIN1/2
CAD1
Negative
WRKY70
ZAT6
Positive
FMO1
ALD1PR1/2/5
c
ALD1
EDS5
WRKY38/54
BIK1 CAD1
ZAT6NIMIN1
ACD6
ALD1
23 °
C, M
ock
30 °
C, M
ock
23 °
C, B
TH
30 °
C, B
TH
BT
H-s
uppr
esse
d ge
nes
Group A: expressionlower at 30 °C
Group B: expression similarat 23 °C and 30 °C
Group C: expressionhigher at 30 °C
Group D: expressionhigher at 30 °C
BT
H-in
duce
d ge
nes
Role in SA signalling
Fig. 5 Global transcriptome analysis reveals a temperature-sensitive bifurcation in the SA signalling network. a RNA-seq gene expression profiles. Tissuewas harvested for RNA extraction and sequencing 24 h after spraying plants with mock or BTH solutions. Differentially expressed genes (DEGs) and BTH-induced (groups A–C) and BTH-suppressed (group D) genes were determined as described in the text. Genes were grouped based on a 2-fold changedifference in expression between BTH-treated samples at 30 °C vs. 23 °C. Data are represented as the mean± s.e.m. of the centred, normalized expressionvalues for each sample type (23 °C, Mock; 23 °C, BTH; 30 °C, Mock; 30 °C, BTH) within each group. The number of genes within each group is shown inthe upper left corner of each graph. b and c Graphical depiction of genes involved in promotion or suppression of SA biosynthesis via regulation of the ICS1gene as well as genes involved in the SA signalling pathway. Genes are colour-coded based on the gene group a to which they belong. Genes notdifferentially regulated within the RNA-seq dataset are depicted using shapes without fill. Metabolites are denoted by black boxes with white text;transcription factors are denoted by a hexagon shape. The DNA molecule with bent arrow designates the ICS1 gene promoter. Solid arrows show directinteractions, dotted arrows show indirect interactions and bar-headed lines show inhibitory interactions. References for each gene function depicted isprovided in Supplementary Table 4. NPR1-regulated genes in b determined based on microarray study conducted by Wang et al70
ARTICLE NATURE COMMUNICATIONS | DOI: 10.1038/s41467-017-01674-2
6 NATURE COMMUNICATIONS |8: 1808 |DOI: 10.1038/s41467-017-01674-2 |www.nature.com/naturecommunications

group (Supplementary Data 5). The cluster-based analyses weredifficult to interpret, as the same cis elements were identified asover-represented in several clusters (Supplementary Table 5a);however, the group-based analyses were more informative. Whilegenes in groups A and B had an over-representation of the W-boxmotif bound by WRKY TFs, known to regulate genes induced byboth biotic and abiotic stresses43, only genes in group A had anover-representation of the as-1 element bound by TGA TFs44,
which are known to regulate SA-responsive PR genes10 (Supple-mentary Table 5b). Genes containing cis elements bound by TFregulating circadian responses, such as CCA145, were over-represented in group B, which is the temperature-insensitive group.Additionally, genes in group C had an over-representation of ciselements bound by TFs involved in jasmonic acid (JA) and abscisicacid (ABA) signalling as well as the CAMTA2 and CAMTA3 TFs,both of which are negative regulators of SA46,47. Finally, group Dgenes had an over-representation of cis elements bound by PIFs,MYCs and multiple TFs involved in growth-related processes.
Enhanced susceptibility is not due to major SA antagonists.Our GO and promoter analyses showed that plants treated withBTH at 30 °C have an upregulation of genes involved in JA, ethy-lene (ET) and ABA signalling pathways (Supplementary Tables 3and 5), which are known to antagonize SA biosynthesis andsignalling48–50. We conducted further experiments to determinewhether these pathways are also upregulated during Pst DC3000infection at elevated temperature. We found no measurable effect oftemperature on pathogen-induction of ET-responsive genes, EIN2and ERF6, following infection; however, both JA pathway markergenes, LOX2 and MYC2, as well as the NCED3 gene involved inABA biosynthesis were induced to higher levels by Pst DC3000 at30 °C compared to those at 23 °C (Fig. 6a, c, e; SupplementaryFig. 14a, c). ABA metabolite levels were also increased followingpathogen infection at 30 °C (Supplementary Fig. 14e). Therefore,while SA biosynthesis and signalling are compromised, PstDC3000-induction of JA-mediated signalling and ABA biosynthesisare enhanced at elevated temperature.
To test whether ABA, JA or ET has a causal role in enhancedsusceptibility at elevated temperature, we conducted diseaseassays at 23 °C and 30 °C using the aba2-151,52 (hereafter aba2)ABA-deficient mutant, the dde2-253 JA-deficient mutant (defec-tive in the ALLENE OXIDE SYNTHASE gene; hereafter aos), themyc2 myc3 myc454 (hereafter myc2/3/4) JA-signalling mutant andthe ein2-155 (hereafter ein2) and ein3 eil148 ET-signallingmutants. As expected, all five mutants showed a significant(5–10-fold) reduction of Pst DC3000 growth at 23 °C comparedto WT plants (Fig. 6b, d, f; Supplementary Fig. 14b, d). However,based on the retention of temperature sensitivity in the mutantplants and similar levels of susceptibility between these mutantsand the corresponding WT plants at 30 °C, we conclude none ofthese hormone signalling pathways is primarily responsible forenhanced susceptibility to Pst DC3000 at elevated temperature.
We also found enrichment of CAMTA-targeted cis elements ingenes more highly induced and/or expressed following BTHtreatment at 30 °C (Supplementary Table 5). CAMTA1,CAMTA2 and CAMTA3 are TFs that function redundantlyin repressing SA biosynthesis at temperatures between 19 °C and22 °C47,56. This repression is relieved upon pathogen perceptionor in response to cold temperatures (~4 °C), enabling SAaccumulation in these conditions56,57. As expected, the camta2camta3 double mutant (hereafter camta2/3) showed enhancedresistance against Pst DC3000 relative to WT plants at 23 °C(90-fold less growth; Fig. 6g). Unlike the other mutants of SAnegative regulators tested, the camta2/3 mutant retained partiallyheightened resistance at 30 °C (13-fold less growth; Fig. 6g),indicating that CAMTAs may contribute to enhanced suscept-ibility at elevated temperature. In support of this, total SA in thecamta2/3 mutants was significantly elevated at 30 °C, with levelssimilar to pathogen-treated WT plants at 23 °C (Fig. 6h).However, although ICS1 and PR1 gene expression was constitu-tively elevated in the camta2/3 mutant relative to WT plants at23 °C, expression of these genes remained compromised at 30 °C(Fig. 6i), indicating that loss of ICS1 and PR1 gene expression at
23456789
23456789
23456789
10ba
e
Nor
mal
ized
gen
eex
pres
sion
0
1
2
0
100
200
300
a a
c
b
MYC2
Mock DC3000
0
2
4
aab
ab
EIN2
Mock DC3000
NCED3
a
b
aa
Mock DC3000
Nor
mal
ized
gen
eex
pres
sion
Nor
mal
ized
gen
eex
pres
sion
dc
f
WT ein3 eil1
a
bcc
WT myc2/3/4
a
bc c
ab bcc
WT aba2
23456789
02468
1012
0
2
4
6
i
Nor
mal
ized
gen
eex
pres
sion
ICS1
Total SA
g
a
b b b
a′ a′ a′ a′
a′ a′
b′ b′
ab
c c
WT camta2/3
WT, Mock camta2/3, Mock
WT, DC3000 camta2/3, DC3000
a
cbcb
hWT, Mock camta2/3, Mock
WT, DC3000 camta2/3, DC3000
0
100
200PR1
a′ a′ a′ b′a ab
bc
c
Nor
mal
ized
gen
eex
pres
sion
23 °C
23 °C 30 °C 23 °C 30 °C
23 °C 30 °C
23 °C 30 °C 23 °C 30 °C
23 °C 30 °C
Log 10
CF
U c
m–2
Log 2
μg g
–1 F
WLo
g 10 C
FU
cm
–2
30 °C23 °C 30 °C
23 °C 30 °C 23 °C 30 °C
Log 10
CF
U c
m–2
Log 10
CF
U c
m–2
Fig. 6 Major SA antagonistic pathways are not responsible for enhancedsusceptibility to Pst DC3000 at elevated temperature. a ET, c JA and e ABAmarker gene expression in plants (n= 3) 24 h after vacuum-infiltration withmock or Pst DC3000. Bacterial growth in WT and b ein3 eil1, d myc2/3/4,f aba2 and g camta2/3 mutant plants (n= 4) 3 days after vacuum-infiltration with Pst DC3000. h SA metabolite quantification and i SAmarker gene expression in WT and camta2/3 mutant plants (n= 4) 3 daysafter vacuum-infiltration with mock or Pst DC3000. Gene expression andLCMS data were processed and analysed as described in Fig. 2. Data arepresented as the mean± s.e.m. with n= biological replicates and arerepresentative of three independent experiments. Letters indicate statisticalsignificance based on a two-factor ANOVA with Tukey’s HSD post hocanalysis (p< 0.05); samples sharing letters are not significantly different.Data in h and i were analysed in two groups based on temperature
NATURE COMMUNICATIONS | DOI: 10.1038/s41467-017-01674-2 ARTICLE
NATURE COMMUNICATIONS |8: 1808 |DOI: 10.1038/s41467-017-01674-2 |www.nature.com/naturecommunications 7

elevated temperature is not due to CAMTA2/3-mediatedsuppression.
BTH confers resistance at 30 °C without inducing ICS1 or PR1.BTH is an SA analogue available commercially as a means of cropdisease control58. The dramatic effect on SA biosynthesis andsignalling at 30 °C raises the possibility that BTH may fail toprotect plants against pathogens at elevated temperature. Todirectly test this possibility, we conducted BTH protection assaysin WT plants at 23 °C and 30 °C. To our surprise, BTH-treatedWT plants had 150–200-fold less bacterial growth and showed nodisease symptoms relative to the mock-treated controls at bothtemperatures (Fig. 7a, b). Even more surprising is that BTHprotection occurred with no induction of the ICS1 and PR1marker genes or accumulation of SA at 30 °C (Fig. 7c, d). Thus,BTH can fully protect Arabidopsis against Pst DC3000 in theabsence of the canonical SA marker genes, ICS1 and PR1.
We next tested whether BTH-mediated protection at 30 °Crequires the core SA signalling pathway. BTH protection assayswere conducted in WT, npr1mutant and tga2 tga5 tga659 (hereaftertga2/5/6) triple mutant plants. Mock-treated npr1 mutant plantshad 30-fold higher bacterial growth relative to mock-treatedWT plants at 23 °C; BTH no longer provided protection in thenpr1mutant plants at either temperature (Fig. 7e). Similarly, mock-treated tga2/5/6 mutant plants had 10-fold more bacterial growththan mock-treated WT plants at 23 °C (Fig. 7f). BTH protection iscompletely absent in tga2/5/6 mutants at 30 °C (Fig. 7f), indicatingthat NPR1, TGA2, TGA5 and TGA6 are required for BTH-mediated protection at elevated temperature.
Next, we tested the effect of BTH on translocation of bacterialeffectors to determine whether BTH-mediated restriction ofvirulence proteins into plant cells contributes to protection atelevated temperature. A higher bacterial inoculum was used inBTH-treated plants than in mock-treated plants to enable equalbacterial populations in plants at 4 hpi (Supplementary Fig. 15a).We observed a significant reduction (2–3-fold) in translocation ofAvrPto-CyaA effector protein in BTH-treated plants relative tothe mock-treated controls at both temperatures (Fig. 7g).However, although the trends were consistent across allexperiments, the effect size of BTH on bacterial effectortranslocation was more variable at 30 °C (SupplementaryFig. 15b). From these data, we conclude that BTH restriction ofbacterial effector translocation contributes to protection at bothtemperatures, but there are likely other mechanisms involved inBTH-induced disease resistance.
DiscussionAccording to the long-standing ‘disease triangle’ dogma in plantpathology, plant–pathogen interactions can only be fully under-stood within the context of environment60. Elevated temperaturehas been shown to break down effector-triggered immunity andpromote disease in many plant-pathosystems61, from fungalinfection of wheat62 to viral infection of tobacco63. While someinsight regarding the molecular mechanisms involved in loss ofeffector-triggered immunity has been gained64, the underlyingcause for a potentially general enhancement of disease suscept-ibility in compatible plant–pathogen interactions (i.e. in theabsence of effector-triggered immunity) was poorly understoodprior to this study. We provide evidence that enhanced multi-plication of virulent Pst DC3000 inside Arabidopsis leaves atelevated temperature is independent of the phyB/PIF thermo-sensing pathway (Supplementary Fig. 4a, b). Instead, enhancedbacterial multiplication at 30 °C requires a functional T3SS(Fig. 1c), and, contrary to the widely held notion based on studiesof the T3SS in vitro8, is associated with increased translocation of
bacterial effectors into plant cells (Fig. 1e). We also show thatenhanced susceptibility of Arabidopsis under our conditions (i.e.when bacteria are pressure-infiltrated directly into the plantleaves) is linked to loss of SA, and the SA-deficient ics1 mutant
020406080
100120
23456789
10
23456789
10
ba
23 °C
30 °C
Mock
c
ba
c c b′
a′
b′ b′
23 °C
dc
ba
PR1b
a a a
e
Mock BTH
WT, Mock npr1, Mock
WT, BTH npr1, BTH
Mock + Mock BTH + DC3000
0
1
2
3
4
5ICS1
b
aa
a
Nor
mal
ized
gen
eex
pres
sion
Nor
mal
ized
gen
eex
pres
sion
23 °C
Log 1
0 C
FU
cm
–2
30 °C
BTH
30 °C 23 °C 30 °C
0
20
40
d
Total SAb
a a
Mock + Mock
BTH + DC3000
23 °C
μg g
–1 F
W
30 °C 23 °C 30 °C
Log 1
0 C
FU
cm
–2
23456789
10
a
bc
b
c′
a′
b′ b′
fWT, Mock tga2/5/6, Mock
WT, BTH tga2/5/6, BTH
g
0
2
4
6
8
pmol
cA
MP
μg–1
prot
ein
*** ***
###
###
Mock BTH hrcC
23 °C
Log 1
0 C
FU
cm
–2
30 °C 23 °C 30 °C
a
Fig. 7 BTH protection against Pst DC3000 at 30 °C requires NPR1 andTGAs but occurs without ICS1 and PR1 expression. a Bacterial growth inmock- or BTH-pre-treated plants (n= 4) 3 days after vacuum-infiltrationwith Pst DC3000. b Disease symptoms three dpi in plants in a. c SA markergene expression (n= 3) and d SA metabolite quantification (n= 4) 24 hpiof plants in a. Gene expression and LCMS data were processed andanalysed as described in Fig. 2. Bacterial growth in mock- or BTH-pre-treated WT, e npr1 and f tga2/5/6 mutant plants (n= 4) 3 days aftervacuum-infiltration with Pst DC3000. g Translocation of bacterial effectorproteins in plants (n= 4) pre-treated with mock or BTH 24 h beforesyringe-infiltration with Pst DC3000(PnptII::avrPto-CyaA). Additionalmock-treated plants (n= 4 for each temperature) were infiltrated withhrcC−(PnptII::avrPto-CyaA strains) as a negative control. Tissue was collectedat 4 hpi for quantification of cAMP, which was normalized by total protein.All data are representative of three independent experiments; graphicaldata are presented as the mean± s.e.m. with n= biological replicates.Letters indicate statistical significance based on a two-factor ANOVA withTukey’s HSD post hoc analysis (p< 0.05); samples sharing letters are notsignificantly different. Data in e and f were analysed in two groups based ontemperature as indicated by the prime symbol (′). Symbols in g denotestatistical significance based on a one-factor ANOVA with Dunnett’s posthoc analysis (***, ###p< 0.001) using the mock-treated sample at eachtemperature as the means for comparison
ARTICLE NATURE COMMUNICATIONS | DOI: 10.1038/s41467-017-01674-2
8 NATURE COMMUNICATIONS |8: 1808 |DOI: 10.1038/s41467-017-01674-2 |www.nature.com/naturecommunications

exhibits a largely temperature-insensitive disease phenotype, witha similar level of susceptibility as WT plants at 30 °C (Fig. 2c).RNA-seq analysis of combinations of temperature and BTHtreatments, reveal temperature-sensitive and temperature-insensitive branches in the SA gene expression network (Fig. 5).We also provide evidence that BTH confers robust protectionagainst disease at 30 °C even in the absence of canonical ICS1 andPR1 gene expression (Fig. 7a–c). Collectively, these results high-light the multi-faceted impact of elevated temperature on themolecular interplay between temperature, SA-mediated defenceand the function of a central bacterial virulence system in one ofthe best studied susceptible plant–pathogen interactions.
We considered three potential models that could explain howelevated temperature affects the compatible host-pathogeninteraction to enable enhanced disease. Based on previousin vitro analyses showing a negative effect of elevated temperatureon the expression of virulence-associated genes8 and our datashowing loss of pathogen-induced SA biosynthesis (Fig. 2b),Model 1 predicts that elevated temperature negatively affects bothpathogen virulence and SA-mediated defence. In this model,enhanced disease would result from increased host susceptibilityin spite of compromised bacterial virulence. However, theinability of the non-pathogenic hrcC− mutant strain to growmore in plants at elevated temperature indicates that a functionalT3SS is required for enhanced bacterial growth at 30 °C (Fig. 1c).Moreover, our results show that effector translocation in planta ismore efficient at 30 °C (Fig. 1e), effectively refuting Model 1.
Alternatively, Model 2 proposes that elevated temperatureenhances bacterial virulence, which then causes loss of SA bio-synthesis to promote disease. Pst DC3000 generated COR, whichis known to specifically target and antagonize SA biosynthesis byactivating JA-mediated signalling50, was previously shown to beunaffected by elevated temperature in planta9. Although symptomdevelopment was greatly reduced in plants infected with a COR-deficient mutant, growth of this strain was enhanced similarlyto that of Pst DC3000 at 30 °C (Fig. 1c, d), thereby eliminatingCOR-mediated suppression of SA biosynthesis as a potentialmechanism. As bacterial effector translocation is increased at30 °C, it is possible that an effector-mediated process may con-tribute to loss of SA biosynthesis at elevated temperature. How-ever, the loss of BTH-induced SA production at 30 °C (Fig. 3b),which is a pathogen-free treatment, prompts rejection of Model 2.
Therefore, we propose a third model whereby elevated tem-perature both antagonizes SA accumulation in the host and pro-motes translocation of virulence proteins by the pathogen resultingin enhanced disease (Fig. 8). Increased bacterial effector transloca-tion into the ics1 mutant relative to WT plants at 23 °C (Fig. 2d)suggests that loss of SA may result in increased ‘permeability’ of thecell to T3SS-mediated pathogenesis. This enhanced permeabilitywould result in the observed temperature sensitivity of the ics1mutant to effector delivery. We typically observe a positive corre-lation between bacterial effector translocation and bacterial multi-plication. However, at 30 °C, there is significantly more bacterialeffector translocation into ics1mutant relative to WT plants with nofurther increase in bacterial populations (Fig. 2c, d). This suggeststhere is a minimum threshold of bacterial effector translocationrequired for maximal bacterial multiplication, after which no fur-ther positive effect may be observed.
One outstanding question to be addressed is the mechanismresponsible for loss of SA at elevated temperature. Based onin vitro activity assays, which show the ICS1 enzyme maintains>90% maximal activity from 4 to 37 °C65, and our data showingcomplete loss of ICS1 gene induction at 30 °C, it seems likely thatloss of SA biosynthesis and accumulation occurs upstream ofICS1 gene expression. However, we cannot rule out the possibilityof additional changes in ICS1 and other SA biosynthesis protein
modifications at elevated temperature that mayaffect their activities. In this study, we discovered upregulationof a number of known negative regulators ofICS1-mediated SA biosynthesis, including components of JA-mediated50 and ET-mediated48 signalling and ABA46 biosynth-esis (Fig. 6a, c, e; Supplementary Fig. 14a, c, e). However, allhormone mutants tested showed similar levels of susceptibility asthe WT plants at 30 °C (Fig. 6b, d, f; Supplementary Fig. 14b, d),indicating that none of these pathways is solely responsible for SAsuppression at elevated temperature.
Retention of resistance in the camta2/3 mutants and in BTH-treated WT plants at 30 °C in the absence of PR1 and ICS1 geneinduction (Figs. 6g, i and 7a, c) is striking. In particular, theobserved retention of BTH-induced NPR1 nuclear accumulation(Fig. 4), and the requirement for NPR1 and the TGA2, TGA5,TGA6 TFs (Fig. 7e, f) indicates that the core SA signalling pathwayis utilized to facilitate this resistance at 30 °C. Global tran-scriptome analysis of BTH-regulated genes revealed atemperature-sensitive bifurcation in the SA signalling pathway atthe 24 h time point assessed in our study, with ~60% of genes inthe canonical PR1/ICS1 temperature-sensitive branch, and ~40%of genes in the temperature-insensitive branch (Figs. 5 and 8).Based on the lack of induction of PR1 and ICS1 by either PstDC3000 or BTH alone (Figs. 2a and 3a) or in combination at 30 °C (Fig. 7c), it is possible that a major part of the SA-regulatedtranscriptome is dispensable for BTH-mediated protection againstPst DC3000 (Fig. 8). This surprising result indicates that either thetemperature-insensitive branch of the SA transcriptome and/or agene expression-independent process underlies BTH-mediated
SA
SAResistanceGroup B ?Group C?
BTH
NPR1ICS1
PR1/ICS1Group A
TGA
Fig. 8 Model for the Arabidopsis-Pst DC3000 interaction at elevatedtemperature. At elevated temperature (depicted by the sun), pathogen-induction of SA biosynthesis via the ICS1 enzyme is blocked andtranslocation of bacterial T3E proteins is enhanced to promote disease.SA signalling induced by the SA synthetic analogue, BTH, is also affected,with the PR1/ICS1 branch (group A in Fig. 5a) no longer induced. However,BTH-mediated resistance against Pst DC3000 is still conferred at elevatedtemperature in a NPR1- and TGA2/5/6-dependent manner. It is possiblethat genes in the temperature-insensitive branch, group B and/or genes inthe elevated temperature + BTH-induced branch, group C, are involved inBTH-mediated resistance under this condition. Solid arrows representdirect positive interactions, dotted arrow represents induction of ICS1 inresponse to pathogen detection and bar-headed lines represent inhibitoryinteractions
NATURE COMMUNICATIONS | DOI: 10.1038/s41467-017-01674-2 ARTICLE
NATURE COMMUNICATIONS |8: 1808 |DOI: 10.1038/s41467-017-01674-2 |www.nature.com/naturecommunications 9

resistance against Pst DC3000 at 30 °C. We chose the 24 h timepoint for gene expression analysis because this is when PR1, PR2and PR5 genes are most highly expressed following BTH treat-ment36. However, it is important to note that this provides only asnap shot of the dynamic transcriptional landscape, and futureresearch should examine whether temperature-sensitive genesmay be induced or suppressed at earlier or later time points.
In summary, we have studied the impact of an important climatecondition, elevated temperature, on a widely studied compatibleplant–pathogen interaction. Our results highlight pathogen-inducedSA production as a key temperature-vulnerable step in the SAdefence network. In addition, our study revealed a surprisinglypositive effect of elevated temperature on bacterial translocationin planta, which challenges the long-standing notion based onprevious in vitro studies that an efficient T3SS requires a lowtemperature (e.g., 18–20 °C)8. Surprisingly, in spite of the increasein pathogen virulence, we still observed BTH-mediated protectionagainst Pst DC3000 infection. This finding supports the continueduse of BTH as a crop protectant even at elevated temperatures.Because the SA pathway is an integral component of the plantimmune system, we hope that the fundamental insights gainedfrom this study will stimulate future research to uncover additionaltemperature-sensitive and temperature-insensitive nodes of theplant immune system. This information should prove useful forgenetic manipulation of climate-relevant components of the plantimmune system to enhance plant resilience to combined adverseabiotic and biotic conditions.
MethodsPlant materials and growth conditions. Arabidopsis Columbia-0 (Col-0),Landsberg erecta (Ler) WT and mutant plants (in Col-0 or Ler background) weresoil-grown (2:1 ‘Arabidopsis mix’:perlite covered with standard Phiferglass mesh)for 3–4 weeks at 12 h light (85± 10 µmolm−2 s−1), 12 h dark, 23 °C and 60%relative humidity. The pif1-1 pif3-3 pif4-2 pif5-3 (pifq)29, tga2-1 tga5-1 tga6-159,sid2-2 (ics1)11, ein2-155, ein3-1 eil1-148, dde2-2 (aos)53, myc2 myc3 myc454, aba2-152
and camta2 camta3-156 mutant plants and 35S::PHYBY276H (YHB)31,32 transgenicplants were previously characterized. The npr1-6 (SAIL-708F09) T-DNA insertionmutant was obtained from the Arabidopsis Biological Resource Centre (ABRC) atThe Ohio State University. T-DNA insertion mutants were genotyped using theREDExtract-N-Amp Plant PCR kit (Sigma) following the manufacturer’s protocol.Primers used for genotyping are listed in Supplementary Table 6.
Temperature and chemical treatments. For temperature assays, chambers wereset to either 23 °C (control) or 30 °C (test), with all other conditions the same asabove. Three-week-old to four-week-old plants were used for all experimentsexcept confocal microscopy, for which 2-week-old plants were used to minimizeloss of age-related decrease in YFP-associated fluorescence. Plants were moved totest chambers 2 h after lights were turned on and acclimated for 48 h beforepathogen infiltration. For experiments with chemical pre-treatment, plants weretemperature-acclimated for 24 h before spraying with either mock (0.1% DMSO,0.01% Silwet L-77) or benzo(1,2,3)thiadiazole-7-carbothioic acid-S-methyl ester(BTH, Chem Service Inc.; 100 µM, 0.1% DMSO, 0.01% Silwet). For callose assays,flg22 (200 nM in 0.1% DMSO) served as a positive control, and all solutions wereinfiltrated into leaves using a needleless syringe. Pathogen infection or other assayswere performed 24 h after chemical treatment.
Phytohormone extraction and quantification. Phytohormones were extractedand quantified as previously described66 with some modifications. Leaf tissuebetween 10 and 50 mg (fresh weight, FW) was flash-frozen in liquid nitrogen,ground and extracted at 4 °C overnight (~16 h) using 0.3–0.5 mL of ice-coldextraction buffer (methanol:water (80:20 v/v), 0.1% formic acid, 0.1 g L−1 butylatedhydroxytoluene, 100 nM ABA-d6). Filtered extracts were quantified using anAcquity Ultra Performance Liquid Chromatography (UPLC) system (WatersCorporation, Milford, MA) as previously described66, except the capillary voltage,cone voltage and extractor voltage were set to 3.5 kV, 25 V and 5 V, respectively,and the desolvation gas and cone gas were set to flow rates of 600 L h−1 and50 L h−1, respectively. Selected ion monitoring (SIM) was conducted in the negativeES channel for SA (m/z 137> 93), SA glucoside (SAG; m/z 299.1> 137), ABA(m/z 263.1> 153.1) and the internal ABA-d6 standard (m/z 269.1> 159.1).Parent> daughter SIM pairs, as well as the optimal source cone and collisionenergy voltages for each compound monitored were determined using Quan-Optimize software. Analyte responses based on peak area integrations relative tothe internal standard was determined using QuanLynx v4.1 software (Waters,
Milford, MA). Both the SA and SAG analytes were quantified based on the SAstandard curve and ABA was quantified based on the ABA standard curve tocalculate the sample concentrations (nM), which were converted to ng using themolecular weight of the compound and the extraction volume, and were thennormalized by sample FW in g. SA and SAG concentrations were combined andreported as total SA.
RNA extraction and qPCR. RNA was extracted from flash-frozen, ground leaftissue with the ToTally RNA kit following the manufacturer’s protocol (Ambion).Samples were digested with DNaseI (Roche) to remove any genomic DNA con-tamination, and then purified using the RNeasy Mini kit (Qiagen). M-MLV reversetranscriptase (RT, Life Technologies) was used to synthesize cDNA. For all genes ofinterest, ~1.5 ng of cDNA template was used for quantitative PCR (qPCR), withexpression normalized to the PP2AA3 internal control gene using the equation2−ΔCT, where ΔCT is CT target gene–CT PP2AA3 (see Supplementary Table 6 forprimer sequences). All qPCR reactions were performed using the SYBR® Greenmaster mix (Life Technologies) and 7500 Fast Real-Time PCR system (AppliedBiosystems, Foster City, California), with three technical replicates and a minimumof three biological replicates per experimental treatment.
RNA sequencing and data analysis. Three biological replicates of each experi-mental treatment were selected based on quality (RIN score 7) using a BioAnalyzerAgilent 2100. Samples were pooled on two lanes of an Illumina HiSeq 2500 RapidRun flow cell (v1) and sequenced in a 1 × 50 bp single-end format using Rapid SBSreagents. Details regarding sequencing, read counts and data analysis are providedin Supplementary Note 1.
Callose accumulation. Following temperature acclimation and chemical treat-ment, leaves were harvested and cleared in 100% ethanol overnight. Cleared leaveswere fixed with a 75% ethanol, 25% acetic acid solution for 2 h, after which leaveswere washed consecutively with 75% ethanol, 50% ethanol and 150 mM K2HPO4
pH 9.5 for 15 min. Finally, leaves were stained in an aniline blue solution (0.1%,150 mM K2HPO4 pH 9.5) overnight at 4 °C. Callose deposits were visualized usingan Olympus IX71 inverted microscope with a 120-watt metal halide lamp (X-Citeseries 120) using a DAPI filter (Semrock, excitation 377/50 and emission 447/60).Images shown are at ×10 magnification. Callose counts were processed usingImageJ (Rasband W.S., National Institutes of Health, USA). Images were firstconverted to 32-bit grey-scale, after which the threshold of the image was adjustedso that only callose deposits were visible over the background. Callose depositswere then counted using the analyse particles tool. Four callose measurements werecollected per leaf; each individual leaf was collected from a different plant. Six toeight plants were evaluated per treatment.
Preparation and selection of transgenic lines. The pNPR1::NPR1-YFP and p35S::YFP constructs were generated by Gateway cloning and then used for Agro-bacterium-mediated transformation of npr1-6 (SAIL_708F09) and Col-0 plants.Details for cloning and screening of transgenic lines are described in Supple-mentary Note 2.
Disease and BTH protection assays. Pst DC3000 inoculum was prepared at aconcentration of ~1–3 × 10⁶ colony-forming units (CFU) mL−1 (an optical densityat an absorbance wavelength of 600 nm (OD600) of ~0.001) as described in Sup-plementary Note 3. For time course disease assays with ics1 and pifq mutants, alower inoculum of ~4–5 × 10⁵ was used to assess disease phenotypes in the mutantplants prior to saturation of bacterial growth. Bacterial infiltration and quantifi-cation are described in Supplementary Note 3.
In vitro growth assay. An overnight culture of Pst DC3000 (grown in LM + Rif)was diluted to an OD600 of 0.05 (LM only), which was then divided into six 125 mLflasks. Three flasks each were incubated with shaking (225 RPM) at 23 °C or 30 °C.Bacterial populations were assessed at each time point by measuring the OD600
with a spectrophotometer (DU 800, Beckman Coulter).
Effector translocation assay. Following temperature treatments, plants wereinfiltrated using a needless syringe with a high inoculum (2–4 × 10⁷ CFUmL−1,0.25 mM MgCl2) of Pst DC3000 or the hrcC− mutant carrying the PnptII::avrPto-CyaA plasmid35, or Pst DC3000 containing either the Ptac::avrPtoB-CyaA67, Ptac::hopU1-CyaA67 or Ptac::hopG1-CyaA68 plasmid. For translocation experimentsusing plants pre-treated with mock or BTH, BTH-treated plants were infiltratedwith inoculum ~1.5 times higher than that used to infiltrate mock-treated plants.This was done to enable samples with equivalent bacterial populations 4 hpi. Leafdiscs were harvested using a biopsy punch 4–6 hpi for both bacterial populationquantification and cAMP quantification, which was normalized by total plantprotein. cAMP was extracted and quantified using the Direct cAMP ELISA kit(ENZO) according to the manufacturer’s protocol. Total protein was quantifiedusing a Quickstart Bradford assay (BioRad) according to the manufacturer’sprotocol.
ARTICLE NATURE COMMUNICATIONS | DOI: 10.1038/s41467-017-01674-2
10 NATURE COMMUNICATIONS |8: 1808 |DOI: 10.1038/s41467-017-01674-2 |www.nature.com/naturecommunications

Nuclear fractionation and western blotting. Following temperature and chemicaltreatments, a minimum of 0.5 g (FW) leaf tissue was harvested and the massrecorded prior to flash freezing in liquid nitrogen. After grinding, cell lysate wasisolated using the CelLytic PN Isolation/Extraction Kit (Sigma), using the semi-pure fractionation method according to the manufacturer’s protocol. Followingisolation and fractionation, the whole-cell lysate and cytosolic fractions werediluted with an equal volume of 4× SDS Laemmli sample buffer (125 mM Tris-HCl, pH 6.8; 4% (w/v) SDS; 20% glycerol; 0.02% bromophenol blue; 5% (v/v) β-mercaptoethanol) while the nuclei pellet was resuspended in 100 µl of 2× SDSLaemmli sample buffer, resulting in a nuclear-fraction sample with an 8-fold higherconcentration than the whole-cell or cytosolic-fraction samples. All samples wereboiled for 10 min at 95 °C, equal volumes of each were loaded in 4–12% SDS-PAGEgradient gels (NuPAGE, Novex) and run for 40–50 min at 200 V. Proteins weretransferred to PVDF membranes at room temperature for 1 h at 25 V.Primary antibodies used were α-GFP (1:7500, Abcam, cat# ab290), for detectionof NPR1-YFP; α-PR169 (1:5000, gift from Xinnian Dong, Duke University);α-UGPase (1:3000, Agrisera, cat# AS05 086) and α-H3 (1:10,000, Agrisera, AS10710). The secondary antibody used for all blots was a goat α-rabbit (1:20,000,ThermoFisher Scientific, cat# 31460). A third protein gel was run and stained withCoomassie to enable visualization of protein loading. Uncropped images for allwestern blots are provided in Supplementary Fig. 16.
Confocal microscopy. Images were taken on a Zeiss 510 Meta Confocal LaserScanning system configured on a Zeiss AxioObserver.Z1 inverted microscope (CarlZeiss Microscopy, Thornwood, NY) using a Zeiss ×63 C-Apochromat waterimmersion objective (NA 1.2). Sequential imaging with a Kalman averaging of 4and pinhole set to 120 µm was used to capture images from a single confocal plane.Bright field (BF) images were recorded using an Argon 514 nm laser. YFP wasexcited with an Argon 514 nm laser set at 20% and fluorescence emission wasrecorded using a 535–565 band pass filter. Aim Image Browser Software (ZeissLSM) was used to add scale bars and for adjustments to brightness and contrast,which were as follows: NPR1-Y1 images, contrast 60%; npr1 images, contrast 65%;35S::YFP YFP images, brightness 52%, contrast 55%; 35S::YFP BF images, bright-ness 48%, contrast 55%. Images were also adjusted for sharpness and contrast usingMicrosoft PowerPoint as follows: all images, sharpness + 50%; npr1 BF images,contrast (+20%); 35S::YFP YFP images, −40% contrast; 35S::YFP BF images, +20%contrast.
Statistical analysis. A minimum of three independent experiments were done forall assays unless otherwise indicated. Sample size used for experiments is indicatedin the figure legends and was selected based on previously published work ofsimilar experiments shown to be sufficient for statistical analyses. Statistical sig-nificance was determined using a Student’s t test (Excel) for pairwise comparisons,a one-way analysis of variance (ANOVA) followed by a Dunnett’s test (Prism 6,GraphPad Software, Inc.) for comparisons of multiple test samples to the samecontrol, or by conducting a 2 × 2 factorial ANOVA followed by Tukey’s honestsignificant difference (HSD) test (RStudio (https://www.rstudio.com/) for multi-variate analyses. In the case of unequal variances as determined by theBrown–Forsythe test (α≤ 0.05, Prism 6, GraphPad Software, Inc.), data were log-transformed prior to conducting statistical analysis.
Data availability. All the RNA-seq reads for this work have been submitted toNCBI under BioProject PRJNA325245. The authors declare that all other datasupporting the findings of this study are within the manuscript and its supple-mentary files or are available from the corresponding author upon request.
Received: 14 January 2017 Accepted: 6 October 2017
References1. Strange, R. N. & Scott, P. R. Plant disease: a threat to global food security. Annu.
Rev. Phytopathol. 43, 83–116 (2005).2. Oerke, E. C. Crop losses to pests. J. Agric. Sci. 144, 31–43 (2006).3. Colhoun, J. Effects of environmental factors on plant disease. Annu. Rev.
Phytopathol. 11, 343–364 (1973).4. Atkinson, N. J. & Urwin, P. E. The interaction of plant biotic and abiotic
stresses: from genes to the field. J. Ex. Bot. 63, 3523–3543 (2012).5. Mittler, R. & Blumwald, E. Genetic engineering for modern agriculture:
challenges and perspectives. Ann. Rev. Plant Biol. 61, 443–462 (2010).6. Tanksley, S. D. & McCouch, S. R. Seed banks and molecular maps: unlocking
genetic potential from the wild. Science 277, 1063–1066 (1997).7. Xin, X. F. & He, S. Y. Pseudomonas syringae pv. tomato DC3000: a model
pathogen for probing disease susceptibility and hormone signaling in plants.Annu. Rev. Phytopathol. 51, 473–498 (2013).
8. Smirnova, A. et al. Thermoregulated expression of virulence factors in plant-associated bacteria. Arch. Microbiol. 176, 393–399 (2001).
9. Weingart, H., Stubner, S., Schenk, A. & Ullrich, M. S. Impact of temperatureon in planta expression of genes involved in synthesis of the Pseudomonassyringae phytotoxin coronatine. Mol. Plant Microbe Interact. 17, 1095–1102(2004).
10. Fu, Z. Q. & Dong, X. N. Systemic acquired resistance: turning local infectioninto global defense. Ann. Rev. Plant Biol. 64, 839–863 (2013).
11. Wildermuth, M. C., Dewdney, J., Wu, G. & Ausubel, F. M. Isochorismatesynthase is required to synthesize salicylic acid for plant defence. Nature 414,562–565 (2001).
12. Pajerowska-Mukhtar, K. M., Emerine, D. K. & Mukhtar, M. S. Tell me more:roles of NPRs in plant immunity. Trends Plant Sci. 18, 402–411 (2013).
13. van Loon, L. C., Rep, M. & Pieterse, C. M. J. Significance of inducible defense-related proteins in infected plants. Annu. Rev. Phytopathol. 44, 135–162 (2006).
14. Gorlach, J. et al. Benzothiadiazole, a novel class of inducers of systemic acquiredresistance, activates gene expression and disease resistance in wheat. Plant Cell8, 629–643 (1996).
15. Morris, S. W. et al. Induced resistance responses in maize. Mol. Plant MicrobeInteract. 11, 643–658 (1998).
16. Chern, M. S. et al. Evidence for a disease-resistance pathway in rice similar tothe NPR1-mediated signaling pathway in Arabidopsis. Plant J. 27, 101–113(2001).
17. Malamy, J., Hennig, J. & Klessig, D. F. Temperature-dependent induction ofsalicylic acid and its conjugates during the resistance response to tobaccomosaic virus infection. Plant Cell 4, 359–366 (1992).
18. Wang, Y., Bao, Z., Zhu, Y. & Hua, J. Analysis of temperature modulation ofplant defense against biotrophic microbes. Mol. Plant Microbe Interact. 22,498–506 (2009).
19. Tsuda, K., Sato, M., Glazebrook, J., Cohen, J. D. & Katagiri, F. Interplaybetween MAMP-triggered and SA-mediated defense responses. Plant J. 53,763–775 (2008).
20. Cheng, C. et al. Plant immune response to pathogens differs with changingtemperatures. Nat. Commun. 4, 2530 (2013).
21. Quint, M. et al. Molecular and genetic control of plant thermomorphogenesis.Nat. Plants 2, 15190 (2016).
22. Jung, J. H. et al. Phytochromes function as thermosensors in Arabidopsis.Science 354, 886–889 (2016).
23. Legris, M. et al. Phytochrome B integrates light and temperature signals inArabidopsis. Science 354, 897–900 (2016).
24. Gangappa, S. N., Berriri, S. & Kumar, S. V. PIF4 coordinates thermosensorygrowth and immunity in. Arabidopsis Curr. Biol. 27, 1–7 (2017).
25. Liu, J. Z., Feng, L. L., Li, J. M. & He, Z. H. Genetic and epigenetic control ofplant heat responses. Front. Plant Sci. 6, 267 (2015).
26. Menna, A., Nguyen, D., Guttman, D. S. & Desveaux, D. Elevated temperaturedifferentially influences effector-triggered immunity outputs in Arabidopsis.Front. Plant Sci. 6, 995 (2015).
27. Xiao, S. Y., Brown, S., Patrick, E., Brearley, C. & Turner, J. G. Enhancedtranscription of the Arabidopsis disease resistance genes RPW8.1 and RPW8.2via a salicylic acid-dependent amplification circuit is required for hypersensitivecell death. Plant Cell 15, 33–45 (2003).
28. Proveniers, M. C. G. & van Zanten, M. High temperature acclimation throughPIF4 signaling. Trends Plant Sci. 18, 59–64 (2013).
29. Leivar, P. et al. Multiple phytochrome-interacting bHLH transcription factorsrepress premature seedling photomorphogenesis in darkness. Curr. Biol. 18,1815–1823 (2008).
30. Genoud, T., Buchala, A. J., Chua, N.-H. & Métraux, J.-P. Phytochromesignalling modulates the SA-perceptive pathway in Arabidopsis. Plant J. 31,87–95 (2002).
31. Su, Y.-s. & Lagarias, J. C. Light-independent phytochrome signaling mediatedby dominant GAF domain tyrosine mutants of Arabidopsis phytochromes intransgenic plants. Plant Cell 19, 2124–2139 (2007).
32. Hu, W., Su, Y.-S. & Lagarias, J. C. A light-independent allele of phytochrome Bfaithfully recapitulates photomorphogenic transcriptional networks. Mol. Plant2, 166–182 (2009).
33. Roine, E. et al. Hrp pilus: an hrp-dependent bacterial surface appendageproduced by Pseudomonas syringae pv tomato DC3000. Proc. Natl Acad. Sci.USA 94, 3459–3464 (1997).
34. Ma, S.-W., Morris, V. L. & Cuppels, D. A. Characterization of a DNA regionrequired for production of the phytotoxin coronatine by Pseudomonas syringaepv. tomato. Mol. Plant Microbe Interact. 4, 69–74 (1991).
35. Schechter, L. M., Roberts, K. A., Jamir, Y., Alfano, J. R. & Collmer, A.Pseudomonas syringae type III secretion system targeting signals and noveleffectors studied with a cya translocation reporter. J. Bacteriol. 186, 543–555(2004).
36. Lawton, K. A. et al. Benzothiadiazole induces disease resistance in Arabidopsisby activation of the systemic acquired resistance signal transduction pathway.Plant. J. 10, 71–82 (1996).
NATURE COMMUNICATIONS | DOI: 10.1038/s41467-017-01674-2 ARTICLE
NATURE COMMUNICATIONS |8: 1808 |DOI: 10.1038/s41467-017-01674-2 |www.nature.com/naturecommunications 11

37. Underwood, W. The plant cell wall: A dynamic barrier against pathogeninvasion. Front. Plant Sci. 3, 85 (2012).
38. Zhu, Y., Qian, W. Q. & Hua, J. Temperature modulates plant defense responsesthrough NB-LRR proteins. PLoS Path. 6, e1000844 (2010).
39. Kinkema, M., Fan, W. H. & Dong, X. N. Nuclear localization of NPR1 isrequired for activation of PR gene expression. Plant Cell 12, 2339–2350 (2000).
40. Saleh, A. et al. Posttranslational modifications of the master transcriptionalregulator NPR1 enable dynamic but tight control of plant immune responses.Cell Host Microbe 18, 169–182 (2015).
41. Shi, H. et al. The cysteine2/histidine2-type transcription factor ZINC FINGEROF ARABIDOPSIS THALIANA6 modulates biotic and abiotic stress responsesby activating salicylic acid-related genes and C-REPEAT-BINDING FACTORGenes in Arabidopsis. Plant Physiol. 165, 1367–1379 (2014).
42. McLeay, R. C. & Bailey, T. L. Motif enrichment analysis: a unified frameworkand an evaluation on ChIP data. BMC Bioinformatics 11, 165 (2010).
43. Rushton, P. J., Somssich, I. E., Ringler, P. & Shen, Q. J. WRKY transcriptionfactors. Trends Plant Sci. 15, 247–258 (2010).
44. Lam, E. & Lam, Y. K. Binding site requirements and differential representationof TGF factors in nuclear ASF-1 activity. Nucleic Acids Res. 23, 3778–3785(1995).
45. Alabadi, D. et al. Reciprocal regulation between TOC1 and LHY/CCA1 withinthe Arabidopsis circadian clock. Science 293, 880–883 (2001).
46. Cao, F. Y., Yoshioka, K. & Desveaux, D. The roles of ABA in plant-pathogeninteractions. J. Plant Res. 124, 489–499 (2011).
47. Du, L. et al. Ca2+/calmodulin regulates salicylic-acid-mediated plant immunity.Nature 457, 1154–1158 (2009).
48. Chen, H. et al. ETHYLENE INSENSITIVE3 and ETHYLENE INSENSITIVE3-LIKE1 repress SALICYLIC ACID INDUCTION DEFICIENT2 expression tonegatively regulate plant innate immunity in Arabidopsis. Plant Cell 21,2527–2540 (2009).
49. Yasuda, M. et al. Antagonistic interaction between systemic acquired resistanceand the abscisic acid–mediated abiotic stress response in Arabidopsis. Plant Cell20, 1678–1692 (2008).
50. Zheng, X. Y. et al. Coronatine promotes Pseudomonas syringae virulence inplants by activating a signaling cascade that inhibits salicylic acid accumulation.Cell Host Microbe 11, 587–596 (2012).
51. Leon-Kloosterziel, K. M. et al. Isolation and characterization of abscisic acid-deficient Arabidopsis mutants at two new loci. Plant J. 10, 655–661 (1996).
52. Schwartz, S. H., Leon-Kloosterziel, K. M., Koornneef, M. & Zeevaart, J. A.Biochemical characterization of the aba2 and aba3 mutants in Arabidopsisthaliana. Plant Physiol. 114, 161–166 (1997).
53. von Malek, B., van der Graaff, E., Schneitz, K. & Keller, B. The Arabidopsismale-sterile mutant dde2-2 is defective in the ALLENE OXIDE SYNTHASEgene encoding one of the key enzymes of the jasmonic acid biosynthesispathway. Planta 216, 187–192 (2002).
54. Major, I. T. et al. Regulation of growth–defense balance by the JASMONATEZIM-DOMAIN (JAZ)-MYC transcriptional module. New Phytol. 215,1533–1547 (2017).
55. Guzmán, P. & Ecker, J. R. Exploiting the triple response of Arabidopsis toidentify ethylene-related mutants. Plant Cell 2, 513–523 (1990).
56. Kim, Y., Park, S., Gilmour, S. J. & Thomashow, M. F. Roles of CAMTAtranscription factors and salicylic acid in configuring the low-temperaturetranscriptome and freezing tolerance of Arabidopsis. Plant J. 75, 364–376(2013).
57. Zhang, L., Du, L., Shen, C., Yang, Y. & Poovaiah, B. W. Regulation of plantimmunity through ubiquitin-mediated modulation of Ca(2+) -calmodulin-AtSR1/CAMTA3 signaling. Plant J. 78, 269–281 (2014).
58. Beckers, G. J. M. & Conrath, U. Priming for stress resistance: from the lab to thefield. Curr. Opin. Plant Biol. 10, 425–431 (2007).
59. Zhang, Y., Tessaro, M. J., Lassner, M. & Li, X. Knockout analysis of Arabidopsistranscription factors TGA2, TGA5, and TGA6 reveals their redundantand essential roles in systemic acquired resistance. Plant Cell 15, 2647–2653(2003).
60. Stevens, R. in Plant Pathology, An Advanced Treatise Vol. 3. (ed. Horsfall, J. G.)357–429 (Academic Press, New York, NY USA; 1960).
61. Alcázar, R. & Parker, J. E. The impact of temperature on balancing immuneresponsiveness and growth in Arabidopsis. Trends Plant Sci. 16, 666–675 (2011).
62. Dickson, J. G. & Holbert, J. R. The relation of temperature to the developmentof disease in plants. Am. Nat. 62, 311–333 (1928).
63. Samuel, G. Some experiments on inoculating methods with plant viruses, andon local lesions. Ann. Appl. Biol. 18, 494–507 (1931).
64. Hua, J. Modulation of plant immunity by light, circadian rhythm, andtemperature. Curr. Opin. Plant Biol. 16, 406–413 (2013).
65. Strawn, M. A. et al. Arabidopsis isochorismate synthase functional in pathogen-induced salicylate biosynthesis exhibits properties consistent with a role indiverse stress responses. J. Biol. Chem. 282, 5919–5933 (2007).
66. Zeng, W. Q. et al. A genetic screen reveals Arabidopsis stomatal and/orapoplastic defenses against Pseudomonas syringae pv. tomato DC3000. PLoSPath. 7, e1002291 (2011).
67. Crabill, E., Joe, A., Block, A., van Rooyen, J. M. & Alfano, J. R. Plant immunitydirectly or indirectly restricts the injection of type III effectors by thePseudomonas syringae type III secretion system. Plant Physiol. 154, 233–244(2010).
68. Block, A. et al. The Pseudomonas syringae type III effector HopG1 targetsmitochondria, alters plant development and suppresses plant innate immunity.Cell Microbiol. 12, 318–330 (2010).
69. Pajerowska-Mukhtar, K. M. et al. The HSF-like transcription factor TBF1 is amajor molecular switch for plant growth-to-defense transition. Curr. Biol. 22,103–112 (2012).
70. Wang, D., Amornsiripanitch, N. & Dong, X. N. A genomic approach to identifyregulatory nodes in the transcriptional network of systemic acquired resistancein plants. PLoS Path. 2, 1042–1050 (2006).
AcknowledgementsWe thank Dr. A. Daniel Jones for the (ABA)-d6 standard used for LCMS; Dr. XinnianDong for the α-PR1 antibody; Dr. Peter Quail for the pifq mutant; Dr. Gregg Howe forthe myc2 myc3 myc4 mutant; Dr. Michael Thomashow for the camta2 camta3 mutant;Dr. Clark Lagarias for the YHB transgenic line; Dr. Brian H. Kvitko for generation of thePst DC3000(PnptII::avrPto-CyaA) and Pst DC3000 hrcC−(PnptII::avrPto-CyaA) strains; Dr.James Alfano for the Pst DC3000(Ptac::avrPtoB-CyaA), Pst DC3000(Ptac::hopU1-CyaA)and Pst DC3000(Ptac::hopG1-CyaA) strains; Melinda Frame for confocal microscopysupport; Jim Klug and Cody Keilen for greenhouse support; and Scott A. Caughel forartistic rendering of the model used in Fig. 8. We also acknowledge funding provided bythe College of Natural Science, Michigan State University Dissertation ContinuationFellowship, Plant Science Excellence Fellowship and University Enrichment Fellowshipto B.H.; funding from the Max Planck Society and Deutsche Forschungsgemeinschaftgrant SFB670 to K.T.; support from the Chemical Sciences, Geosciences and BiosciencesDivision, Office of Basic Energy Sciences, Office of Science, US Department of Energythrough grant no.DE–FG02-91ER20021 to B.L.M. and support from the Gordon andBetty Moore Foundation GBMF3037 and Michigan State University Plant ResilienceInstitute to S.Y.H.
Author contributionsB.H., B.L.M. and S.Y.H. conceived research and designed experiments. C.D.M.C. con-tributed to qPCR, disease assays and translocation assays. A.V.L. performed calloseexperiments. E.H. contributed to qPCR and complementation analysis of pNPR1::NPR1-YFP transgenic lines. For RNA-seq analyses, J.A.P. conducted DAVID analyses, K.L.C.assisted with gene expression profiling and K.T. performed DEG, k-means clustering,heat map generation, Genevestigator and AME analyses. J.Y. generated the p35S::YFPtransgenic line, performed initial characterization of the npr1-6 allele and assisted withgeneration of the pNPR1::NPR1-YFP transgenic lines. B.H. performed all other experi-ments. B.H. and S.Y.H. wrote the manuscript with input from all co-authors.
Additional informationSupplementary Information accompanies this paper at doi:10.1038/s41467-017-01674-2.
Competing interests: The authors declare no competing financial interests.
Reprints and permission information is available online at http://npg.nature.com/reprintsandpermissions/
Publisher's note: Springer Nature remains neutral with regard to jurisdictional claims inpublished maps and institutional affiliations.
Open Access This article is licensed under a Creative CommonsAttribution 4.0 International License, which permits use, sharing,
adaptation, distribution and reproduction in any medium or format, as long as you giveappropriate credit to the original author(s) and the source, provide a link to the CreativeCommons license, and indicate if changes were made. The images or other third partymaterial in this article are included in the article’s Creative Commons license, unlessindicated otherwise in a credit line to the material. If material is not included in thearticle’s Creative Commons license and your intended use is not permitted by statutoryregulation or exceeds the permitted use, you will need to obtain permission directly fromthe copyright holder. To view a copy of this license, visit http://creativecommons.org/licenses/by/4.0/.
© The Author(s) 2017
ARTICLE NATURE COMMUNICATIONS | DOI: 10.1038/s41467-017-01674-2
12 NATURE COMMUNICATIONS |8: 1808 |DOI: 10.1038/s41467-017-01674-2 |www.nature.com/naturecommunications