consequences of elevated temperature on prairie plants
TRANSCRIPT

Consequences of elevated temperature on prairie plants:
legumes, nitrogen, and phenology
A DISSERTATION
SUBMITTED TO THE FACULTY OF THE GRADUATE SCHOOL
OF THE UNIVERSITY OF MINNESOTA
BY
Heather Renee Whittington
IN PARTIAL FULFILLMENT OF THE REQUIREMENTS
FOR THE DEGREE OF
DOCTOR OF PHILOSOPHY
Jennifer S. Powers
May 2012

© Heather R. Whittington 2012

i
Acknowledgments
I first and foremost want to acknowledge and thank my advisor Jennifer Powers for her
support, guidance, and patience. I am especially grateful for her endless encouragement,
without which I could not have completed this dissertation.
I wish to thank my committee members, both past and present, for their advice and
guidance. I appreciate the time and effort you gave.
I also thank my fellow lab members and graduate students for their support and
encouragement.
I thank and acknowledge Troy Mielke, the student interns, and the staff of Cedar Creek
Ecosystem Science Reserve. Without them my field research would not have been
possible. I also thank Laura Deede who’s invaluable help with the growth chamber
experiment is greatly appreciated. I acknowledge Andrea Hess, Robyn Yechout, and
Caiti Langer for their tireless collection of phenology data.
Lastly, I thank my family for their loving support through this long process.

ii
Dedication
This thesis is dedicated to Dr. Peter H. Graham for sharing his knowledge and passion for
prairie legumes.

iii
Abstract
Because prairies are often nitrogen (N) limited, prairie legumes can have
significant impacts on the nitrogen (N) dynamics of these communities because of their
ability to add fixed N to their surroundings through symbiotic biological N2-fixation and
their N-rich tissues that can stimulate net nitrogen mineralization. Predicted increases in
temperature have the potential to alter legume traits and functioning, which can feedback
to affect ecosystem dynamics. The goal of this dissertation was to examine the effect of
elevated temperature on the growth, phenology, and N nutrition of four prairie legumes:
Amorpha canescens, Dalea purpurea, Lespedeza capitata, and Lupinus perennis, using
both a growth chamber experiment and a manipulative field warming experiment. In the
growth chamber experiment, seedlings of Lespedeza exhibited higher biomass and shoot
N content at 28°C than 25°C, while Lupinus seedlings displayed decreased nodulation
and lower shoot N concentration at the higher temperature. In the field warming study,
Dalea and Lupinus displayed higher biomass under warming and all species exhibited
lower shoot N concentrations under warming. Neither N2-fixation nor net N
mineralization were affected by warming. Warming accelerated flowering for several
species, including Amorpha and Dalea, and accelerated spring green-up, as evidenced by
higher normalized difference vegetation index (NDVI) values in warmed communities in
May. These results indicate that prairie legumes are responsive to increases in
temperature in a species-specific manner and that warming may alter N-cycling by
changing legume abundance and tissue N chemistry. Additionally, significant
interannual variation in many variables and in their responses to warming emphasizes the
need for long term studies to better understand and predict potential consequences of
elevated temperature on plants and their ecosystems.

iv
Table of Contents
Acknowledgments ……………………..………………………………………………… i
Dedication ……………………………………………………………………………….. ii
Abstract …………………………………………………………………………………. iii
Table of Contents............................................................................................................... iv
List of Tables …………………………………………………………………………… vi
List of Figures ……………………………..…………...……………………………..... vii
Introduction …………………………………………………………….………………... 1
Chapter 1- Growth responses, biomass partitioning, and nitrogen isotopes of prairie
legumes in response to elevated temperature and varying nitrogen source in a growth
chamber experiment …………………………………………………………...………….4
Summary …………………………………………………………………………5
Introduction ………………………………………………………………………6
Methods …………………………………………………………………………9
Results ………………………………………………………………………13
Discussion ………………………….…..……………………………………15
Tables and Figures ………………………………………………………………22
Chapter 2- Consequences of elevated temperatures on prairie legume biomass and
nitrogen cycling in a field warming experiment in Minnesota ………….………………29
Summary ……………………………………..…………………………………30
Introduction ………………………………...……………………………………31
Methods ………………..………………………….…………………………33
Results …………………………………………………..…………………38
Discussion ……………………………………………………………………40
Tables and Figures ………………………………………………………………47

v
Chapter 3 - Phenological responses of prairie plants to elevated temperature in a field
experiment in Minnesota ………………………………………………………..……….58
Summary ………………………………………………………………………59
Introduction ……………………………………………………………………60
Methods ……………………………………………….………………………62
Results …………………………………………….………….………………66
Discussion …………………………………………………………….…………69
Tables and Figures …………………………………...………………….………74
Supplemental Information …………………………………………………..82
Conclusion ……………………………………………………………………...……… 84
Bibliography …………………………………………………………………………….86

vi
List of Tables
Chapter 1
Table 1-1. ANOVA results on seedling variables 22
Table 1-2. Mean shoot [N] values by temperature and N-source 24
Table 1-3. Mean shoot δ15
N values by temperature and N-source 25
Chapter 2
Table 2-1. Summary of ANOVA models 47
Table 2-2. ANOVA results on soil variables and N mineralization 48
Table 2-3. Mean increase in soil temperature (°C) 49
Table 2-4. ANOVA results on legume variables 50
Table 2-5. Mean shoot [N] by species, warming, year, and diversity 51
Chapter 3
Table 3-1. Ambient climate and increases in soil temperature 74
Table 3-2. Species characteristics and sample sizes 75
Table 3-3. Summary of phenological variables 76
Table 3-4. ANOVA results on reproductive variables 77
Table 3-5. Eigenvectors of PCA variables 78
Table S3-1. Yearly means of population level reproductive variables 82
Table S3-2. Yearly means of individual level reproductive variables 83

vii
List of Figures
Chapter 1
Figure 1-1. The assembled Magenta units used to grow seedlings 26
Figure 1-2. The effect of temperature and N-source on biomass 27
Figure 1-3. The effect of temperature on nodule weight 28
Chapter 2
Figure 2-1. Pathways through which warming can affect N2-fixation 52
Figure 2-2. The effect of warming on initial soil moisture 53
Figure 2-3. The effect of warming treatment on net N mineralization 54
Figure 2-4. The effect of warming treatment on aboveground biomass 55
Figure 2-5. The effect of year and diversity on reliance on fixation 57
Chapter 3
Figure 3-1. Difference in peak flowering from ambient 79
Figure 3-2. Axes 1 and 2 of principle components analysis 80
Figure 3-3. Time course of normalized difference vegetation index 81

1
Introduction
Temperature plays a large role in controlling many plant and ecosystem processes,
including biochemical reactions, evapotranspiration, phenology, and plant species global
distribution (Holdridge 1947, Walther 2003). Global temperatures are predicted to rise
by 3-5oC by the end of the century (IPCC 2007), and documented effects of this warming
on plants in many ecosystems are accumulating (Walther 2003, Linderholm 2006, Kelly
and Goulden 2008). One way plants can and are responding to warmer temperatures is
migration, essentially tracking their preferred climate niche. Species that do not shift
their ranges will have to cope with the direct and indirect effects of elevated temperature
through acclimation or adaptation (Walther 2003).
Elevated temperatures can directly and indirectly affect plant functioning and
traits by altering physiological processes (e.g. gas exchange), lowering soil moisture, and
altering nutrient availability. These can lead to changes in plant traits, such as litter
chemistry, that can feedback to affect ecosystem processes (Luo 2007). Moreover,
climate change can lead to species composition and abundance changes, effectively
changing the plant traits of the community which will have consequences for ecosystem
functioning (Diaz and Cabido 1997, Luo 2007, Niu et al. 2010). Thus, to better predict
the consequences of climate change on both the ecosystem and species of interest, one
must understand how climate change will affect factors influencing both ecosystem
processes and plant traits and how these changes interact (Suding et al. 2008).
Data from multiple field warming experiments have indicated that grassland
plants and ecosystems are responsive to elevated temperature, but observed responses are
not always consistent across sites (Dukes et al. 2005, De Boeck et al. 2008, Garten et al.
2008, Cheng et al. 2010, Dijkstra et al. 2010). Detailed analysis of the responses and the
mechanisms behind them at multiple sites is essential and will allow comparisons
between these sites to better understand both universal and site-specific mechanisms
behind the responses (or lack thereof).
Grasslands of North America, commonly referred to as prairies, range from the
Rocky Mountains to the Mississippi River drainage basin and extend from Mexico into
Canada (Pieper 2005). These prairies historically covered 1.6 million km2 in the U.S.,

2
but have experienced an 80% decline in area since European settlement (Samson and
Knopf 1994). Tallgrass prairies have seen the greatest decline, with estimates of only 1-4%
remaining (Samson and Knopf 1994, Piper et al. 2007). A greater understanding of the
potential consequences of climate change for these ecosystems will be critical to future
restoration efforts.
Like many terrestrial ecosystems, prairies are often nitrogen (N) limited,
(LeBauer and Treseder 2008, Craine and Jackson 2010). Legumes (Fabaceae) play an
important role in the N cycle because they have the ability through their symbiosis with
N2-fixing bacteria to add N to their surroundings. It has been estimated that prairie
legumes contribute only ~5% of added N to the system (Woodmansee et al. 1981), most
likely because of their relative low abundance. However, small changes in N additions
can have significant consequences over time (Seastedt et al. 1991, Kindscher and Tieszen
1998). With their relatively low C:N tissues, legumes enhance N cycling by increasing N
mineralization (Craine et al. 2002, Eviner and Chapin 2003). Presence of legumes can
increase productivity and N concentrations in non-leguminous neighbors (Mulder et al.
2002, Lee et al. 2003, Temperton et al. 2007) and can increase soil carbon accumulation,
possibly through their own high biomass production or their influence on the biomass of
other species (Knops and Tilman 2000, Fornara and Tilman 2009). This stimulatory
effect of legumes may play an important role in managing prairies for ecosystem services,
such as sustainable biofuel production (Fargione et al. 2009, Luscher et al. 2011).
Many aspects of the N2-fixation symbiosis and its environmental drivers are
influenced by temperature and water availability (Fig. 2-1). Thus, climate change has the
potential to alter the amount of N added to plant communities by legumes, and in turn
affect community dynamics such as competition and ecosystem processes including the
biogeochemical cycles of nitrogen and carbon. The vast majority of N2-fixation and
temperature research using manipulative experimental studies is focused on leguminous
crop or forage species. Few studies have examined the response to climate change in
legumes native or naturalized to North American prairies (Garten et al. 2008).
My dissertation research examines the potential impact of elevated temperature on
grassland plants native or naturalized to the tallgrass prairies of North America. Since
3
these systems are often strongly N limited, the first two chapters of my thesis investigate
the effects of elevated temperature on four focal legume species: Amorpha canescens,
Dalea purpurea (Petalostemum purpureum), Lespedeza capitata, and Lupinus perennis.
The third chapter broadens the number of focal species and examines phenological
responses to warming for 12 species, including grasses and non-leguminous forbs.
The research in Chapter 1 examines the effect of temperature on growth and N-
nutrition of legume seedlings and determines whether the temperature response depends
on source of N. Using controlled conditions is advantageous as it allows detection of the
direct effects of temperature on the focal legumes without many of the complex
interactions and feedbacks that naturally occur in an ecosystem.
Because interactions in natural environments have the potential to modify direct
temperature responses on legumes, the research detailed in Chapter 2 used a
manipulative field warming study in Minnesota to investigate the effect of elevated
temperature on the biomass and N traits of mature legumes. To better understand
mechanisms behind potential responses, several environmental factors known to affect
N2-fixation were also monitored for potential responses to warming. Since this field
experiment overlays a plant diversity experiment, I was also able to examine the
influence of plant species diversity on the warming response.
Using this same field warming experiment, the research in Chapter 3 asks
whether prairie plant species will shift their phenology in response to warming. To
answer this question, I examined the response of several phenological variables at three
scales: individual plants, populations, and community patches. This chapter also extends
the focal plant species to include several grasses and non-leguminous forbs to better
understand community wide responses and attempt to examine potential differences
between functional groups.

4
Chapter 1
Growth responses, biomass partitioning, and nitrogen isotopes of prairie
legumes in response to elevated temperature and varying nitrogen source in
a growth chamber experiment
A version of this chapter was published:
Whittington, H.R., L. Deede, and J. S. Powers. 2012. Growth responses, biomass
partitioning, and nitrogen isotopes of prairie legumes in response to elevated
temperature and varying nitrogen source in a growth chamber experiment. American
Journal of Botany 99: 838-846.
5
Summary
Because legumes can add nitrogen (N) to ecosystems through symbiotic fixation,
they play important roles in many plant communities such as prairies and grasslands.
However, very little research has examined the effect of projected climate change on
legume growth and function. Our goal was to study the effects of temperature on the
growth, nodulation, and N chemistry of prairie legumes and to determine if these effects
are mediated by source of N. We grew seedlings of Amorpha canescens, Dalea purpurea,
Lespedeza capitata, and Lupinus perennis at 25/20°C (day/night) or 28/23°C with and
without rhizobia and mineral N in controlled environment growth chambers. Biomass,
leaf area, nodule number and mass, and shoot N concentration and δ15N values were
measured after twelve weeks of growth. Both temperature and N-source affected
responses in a species-specific manner. Lespedeza showed increased growth and higher
shoot N content at 28°C. Lupinus displayed decreases in nodulation and lower shoot N
concentration at 28°C. The effect of temperature on shoot N concentration only occurred
in those individuals relying on N2-fixation as the sole N source, but there was no effect of
temperature on δ15
N values in these plants. Elevated temperature enhanced seedling
growth of some species, while inhibiting nodulation in another. Temperature-induced
shifts in legume composition or nitrogen dynamics may be another potential mechanism
through which climate change affects unmanaged ecosystems.

6
Introduction
Legumes (Fabaceae) play an important role in the nitrogen (N) cycle of terrestrial
ecosystems, as they are often a significant source of N inputs (Cleveland et al. 1999) due
to their symbiosis with dinitrogen (N2) fixing rhizobia bacteria. Ongoing increases in
global temperatures due to anthropogenic releases of greenhouse gases to the atmosphere
will affect this role because temperature is known to affect N2-fixation and other plant
physiological processes such as photosynthesis and nutrient uptake (Bassirirad 2000,
Aranjuelo et al. 2007). The vast majority of research investigating legume responses to
temperature is focused on crop or forage species (Kessler et al. 1990, Zachariassen and
Power 1991, Lilley et al. 2001). By contrast, very little research has examined the
possible impacts of warming on legumes native to prairies despite the influential role of
these species in these often N limited ecosystems (Tilman 1984, Garten et al. 2008).
Nitrogen fixing legumes account for 1-17% of the biomass in U.S. prairies (Piper
et al. 2007) and only contribute about 5% of total N input into these systems
(Woodmansee et al. 1981). However, prairies are generally N limited (Craine and
Jackson 2010) and even small changes in N inputs can have a large impact over time
(Seastedt et al. 1991, Kindscher and Tieszen 1998). At a local scale, legumes influence
the surrounding plants by increasing N availability, as evidenced by increased biomass
and higher N concentration in non-legume neighbors (Mulder et al. 2002, Temperton et al.
2007) and can increase soil carbon accumulation (Fornara and Tilman 2008). Legumes
are also becoming increasingly important in restoration efforts (Graham 2005) and
greater knowledge of the consequences of climate change on these species can help
inform these efforts.
Temperature affects many aspects of the N2-fixation symbiosis. Warming can
inhibit nodulation (Barrios et al. 1963, Purwantari et al. 1995, Lira Jr. et al. 2005), slow
nodule development (Piha and Munns 1987, Lira Jr. et al. 2005), and reduce nodule
activity (Meyer and Anderson 1959, Hungria and Franco 1993, Aranjuelo et al. 2007). In
a recent literature synthesis, Houlton et al. (2008) found that optimal nitrogenase activity
occurs in the temperature range of 20-30oC. The authors used these data to include a soil

7
temperature component to a terrestrial biogeochemical model explaining global patterns
of N2-fixation and legume abundance and found that temperature limits N2-fixation in
northern latitude forests (Houlton et al. 2008). The optimal temperature for plant growth
and N2-fixation is often species-specific, however, and depends on both the rhizobia and
legume species (Piha and Munns 1987, Purwantari et al. 1995).
In unmanaged environments, legumes commonly rely on N2-fixation only when
mineral N in the soil is relatively unavailable, as N2-fixation is energetically costly from a
physiological stand point (Gutschick 1981). Additionally, compatible strains of rhizobia
may not be present in the environment, forcing legumes to rely solely on mineral N
(Larson and Siemann 1998). Because both N2-fixation and uptake have been shown to be
affected by temperature (Hatch and Macduff 1991), we can speculate that the source of N
to the plant (i.e. N2-fixation or mineral N) may mediate the effects of elevated
temperatures. For example, if N2-fixation is more sensitive to changes in temperature
than mineral N uptake, plants relying solely on N2-fixation may show greater responses
to temperature increases. Greater sensitivity to changes in temperature was seen for both
Glycine max (soybean) and Lupinus albus (lupine) plants relying solely on fixation
compared to those given mineral N (Legros and Smith 1994), and nodule activity in
Glycine max was affected by changing root temperature from 18 to 32°C but mineral N
uptake was not affected (Marcus-Wyner and Rains 1982). At small changes in
temperature, plants may be able to adjust mineral N uptake to meet their demand
(Bassirirad 2000) but this may be more difficult with N2-fixation, as fixation involves
interaction with rhizobia and directly involves enzymatic activity both of which
temperature can affect directly (Lie 1981, Sprent and Sprent 1990).
Direct quantification of whole-plant N2-fixation rates in field studies is currently
not possible, thus many studies use the natural abundance isotopic method to estimate
nitrogen fixation (Boddey et al. 2000, Garten et al. 2008). This method uses a two end-
member mixing model and takes advantage of the difference between the δ15
N of
atmospheric N2 (which is defined as 0‰) compared to that of mineral nitrogen available
to the legume from the soil (which is typically enriched in the heavy stable isotope of N)
(Shearer and Kohl 1991). In these calculations of the percentage of N derived from

8
fixation (%Ndfa), it is necessary to account for isotope fractionation that occurs during the
fixation process and transfer of fixed nitrogen throughout the plant. This B-value is
obtained by growing the legume of interest without mineral N, such that N2-fixation is
the sole N source. Thus, the B-value can serve as one end-member in the two end-
member mixing model. B-values of shoot tissue range from -3.61 to +1.9‰ and depend
on the legume species and rhizobial strain (Boddey et al. 2000, Unkovich et al. 2008). It
is possible that this discrimination may be altered by temperature, but to our knowledge
no studies have reported on this possibility. Understanding whether B-values are altered
by growing temperatures is essential for application of the natural abundance method to
predict how N2-fixation may respond to ongoing climate change.
In addition to potential effects on N nutrition, temperature can also affect growth,
physiology, and morphology of legumes, with feedbacks for plants, rhizobia, and
ecosystem N cycling. Temperature-induced changes in photosynthesis and respiration
may affect plant growth and productivity, and will also affect N2-fixation rates since both
processes determine the amount of carbon that is available for fixation. In turn,
temperature-induced changes in N2-fixation can affect carbon gain processes and growth
by determining N levels. At the ecosystem scale, any changes to legume productivity and
fixation rates will alter the total amount of N that is fixed and thus the amount of N that is
added to the community.
In this study, we used a growth chamber experiment to examine the effect of
warming on prairie legume growth and function. Four legume species, Amorpha
canascens, Dalea purpurea, Lespedeza capitata, and Lupinus perennis were selected
because they are common in North American prairies and also are present in a
manipulative field experiment to quantify the responses of prairie plants to increased
temperatures (Chapter 2). These species were grown at two temperatures with and
without rhizobia and with or without mineral N. Using highly controlled conditions in a
growth chamber allowed us to isolate the effects of temperature and N source, without
confounding effects of soil moisture or other factors that may vary in field experiments.
Our specific goals were to determine: i) whether seedling growth, morphology, and N
chemistry depended upon species, temperature, and N source, and ii) whether nodulation

9
and isotopic discrimination factors were affected by species and temperature. We
expected that plants relying solely on N2-fixation would be the most sensitive to
temperature differences because N2-fixation would be affected more than mineral N
uptake. We also expected that plants relying solely on N2-fixation would display slower
growth than individuals given mineral N because N2-fixation is more costly than uptake.
Methods
Species
The focal study species were Amorpha canescens Pursh, Dalea purpurea Vent.,
Lespedeza capitata Michx., and Lupinus perennis L. (hereafter referred to by genus). All
four of these perennial species are native and common to the grasslands of central North
America, and differ in phenology and other traits. Lupinus is active in the spring and
early summer and flowers in late spring. Lespedeza flowers in late summer. Amorpha
and Dalea flower during the early to middle summer. Lespedeza forms nodules with
determinate growth and translocates fixed nitrogen as ureides. Amorpha and Dalea form
indeterminate nodules that maintain a meristem and transport nitrogen as amides.
Lupinus forms unique indeterminate nodules and also transports nitrogen as amides
(Sprent 2001).
Experimental set-up
Plants were grown in stacked 350 cm3
Magenta® vessels (PhytoTechnology
Laboratories, Lenexa, Kansas, USA) that allowed us to manipulate nutrient solution and
rhizobia inoculation. The bottom vessel held nutrient solution, the middle vessel was
filled with silica sand, and the top vessel acted as a lid (Fig. 1-1). A cotton wick between
the bottom and middle vessels transferred nutrient solution from the bottom unit to plant
roots, giving unlimited access to water and nutrients. The assembled Magenta vessels
were autoclaved with nutrient solutions before planting. The bottom vessels containing

10
nutrient solutions were clear and we cannot rule out the possibility that photosynthetic
organisms were growing there. However, we saw no indications over the course of the
experiment that this was occurring.
Seeds from Prairie Moon Nursery (Winona, Minnesota, USA) were surface
sterilized with either bleach (Amorpha and Dalea) or sulfuric acid (Lespedeza and
Lupinus). The sulfuric acid also acted as a scarifying agent. Three seeds of a species
were planted into the sterile sand of each growing unit and were thinned to one plant per
vessel three weeks after germination.
Treatments — Plants were assigned to six treatments that consisted of factorial
combinations of growing temperatures (25/20oC (day/night) or 28/23
oC )) and three N-
source treatments. The daytime low temperature represents the average growing season
temperature in southern Minnesota (Cedar Creek LTER data,
http://cedarcreek.umn.edu/research/weather/). The high temperature regime represents a
three degree increase, which is within the predicted range of temperature increases by
2100 (IPCC 2007) and is similar to the warming treatment in a field experiment at Cedar
Creek (East Bethel, Minnesota, USA) that contains these legume species (Whittington, in
prep). The three N-source treatments were presence of rhizobia without mineral N,
presence of rhizobia with mineral N, and absence of rhizobia with mineral N. The
combination of no rhizobia and no mineral N was not included in the experimental design
as plants would not be expected to survive. We note that these three N-source treatments
encompass the full range of possibilities that may occur in the field, i.e. compatible
rhizobia strains may be present or absent, and mineral N may be sparingly available or
present in non-limiting amounts. We contend that the “true situation” in the field is likely
to lie in between these extremes, thus our results constrain the possible responses of the
species we studied to variation in N and/or rhizobia. Each treatment was replicated 10
times.
Plants not receiving supplemental N received the following N-free nutrient
solution: 1mM CaCl2, 1mM MgSO4, 10µM NaFeEDTA, 1mM K2SO4, 100µM KH2PO4,
0.01µM, (NH4)6Mo7O24, 0.16µm ZnSO4, 0.04µM CuSO4, 2µM H3BO3, and 0.4µM
MnSO4 (modified from Franco and Munns (1982)). Seedlings in the mineral N

11
treatments received the above nutrient solution that was supplemented with NH4NO3 to a
concentration of 100mg N/L. The quantity of N available in the nutrient solution was
sufficient to provide N in excess of plant demand over the course of the experiment, i.e.
we did not expect N-limitation of plant growth in the treatments receiving mineral N over
the duration of the experiment, and is within the range of N added in similar studies of
legumes (Legros and Smith 1994, Plies-Balzer et al. 1995).
Five days after planting, seedlings in the rhizobia treatments were inoculated with
1 or 2 strains of compatible rhizobia. Species-specific rhizobia strains were obtained
from the Rhizobia Research Laboratory at the University of Minnesota. Strains were
originally isolated from Minnesota soils and were chosen for their known ability to
nodulate the focal species (P. H. Graham, personal communication). Amorpha was
inoculated with a strain of Mesorhizobium amorphae, and Dalea was inoculated with two
Rhizobium spp. strains that are genetically similar to R. etli and R. leguminosarum (Tlusty
et al. 2005) . The identity of the strains used to inoculate Lespedeza and Lupinus is
unknown. Strains were subcultured on yeast extract mannital agar (BYMA) plates for
one week, then transferred to BYMA broth culture. Broth cultures were shaken for five
days and then centrifuged. The resulting pellets were resuspended in dilution fluid to an
approximate concentration of 5.5 x 10⁵ cells mL
-1. One milliliter of inoculum was
pipetted on the sand surface of the vessel containing the corresponding species to give a
rhizobia concentration of approximately 103 cells per gram of soil.
Growing conditions — Plants were grown in controlled environment chambers
(Conviron, Winnipeg, Canada) under a 12 hour photoperiod at two different temperature
regimes: 25/20oC (day/night) (low) or 28/23
oC (high). Two chambers were used for
each temperature regime to ensure temperature differences were not simply due to
chamber effects. Light levels ranged from 210 to 250 µmoles m-2
s-1
within each
chamber and were similar among chambers. Plants were randomly moved within their
chamber on a weekly basis.

12
Measurements
After 12 weeks of growth, plants were harvested and separated into roots, stems,
leaves, and nodules. Leaves were placed in wet paper towel and scanned within 12 hours
to calculate leaf area using ImageJ software (Abramoff et al. 2004). Nodules were
counted and weighed immediately after harvest. The mass per nodule of each individual
was calculated by dividing the total fresh nodule weight by the total number of nodules.
All tissue was then dried at 65oC for >48 hours and weighed. The average specific leaf
area (SLA in units of cm2 g
-1) of each individual was calculated by dividing the total leaf
area by the total dry weight of leaves.
15N Analysis —In order to calculate the isotopic discrimination due to fixation (B-
value) and shoot nitrogen concentrations (shoot [N]), all of the aboveground plant tissue
(stems and leaves) was ground in a ball-mill grinder and a subset was sent to the Stable
Isotope Lab at UC-DAVIS for 15
N analysis. The B-value is defined as the δ15N value of
individuals relying completely on fixation for nitrogen (i.e. individuals not receiving
added mineral N). Shoot tissue of plants in the mineral N only treatment was also
analyzed for 15
N. Last, we analyzed the 15
N composition of NH4NO3 to help us interpret
the isotopic signatures of plants grown with both mineral N and rhizobia. We had
originally intended to use the 15
N data to estimate the percentage of N derived from
fixation (%Ndfa) for plants in the treatments receiving both mineral N and rhizobia, but
we were unable to do so because of poor nodulation. However, determining whether B-
values of plants relying on fixation as their sole N source differs among species and
between temperatures regimes is also an important goal of our study.
Statistical analysis
Differences in the response variables of biomass, leaf area, leaf number, SLA,
shoot [N], nodule number, and nodule weight among the treatments of species,
temperature regime, and N-source were determined with ANOVAs using JMP 9 software
(SAS Institute Inc., Cary, North Carolina, USA). The experiment was analyzed as a split
plot design, with temperature as the whole plot factor and species and N-source as the

13
split plot factors. Species, temperature, and N-source were included as fixed effects in
the models, while chamber and its interaction with species and N-source were included as
random effects to account for the split plot design. When an effect was significant, post-
hoc Tukey HSD tests were used to determine significant differences between individual
treatment levels. All biomass, leaf area, leaf number, SLA, and shoot [N] variables were
transformed with the natural logarithm to improve normality and decrease non-constant
variance. Nodule number and weight were square-root transformed for the same purpose.
Histograms of the data indicated that transformations sufficiently improved normality.
Results
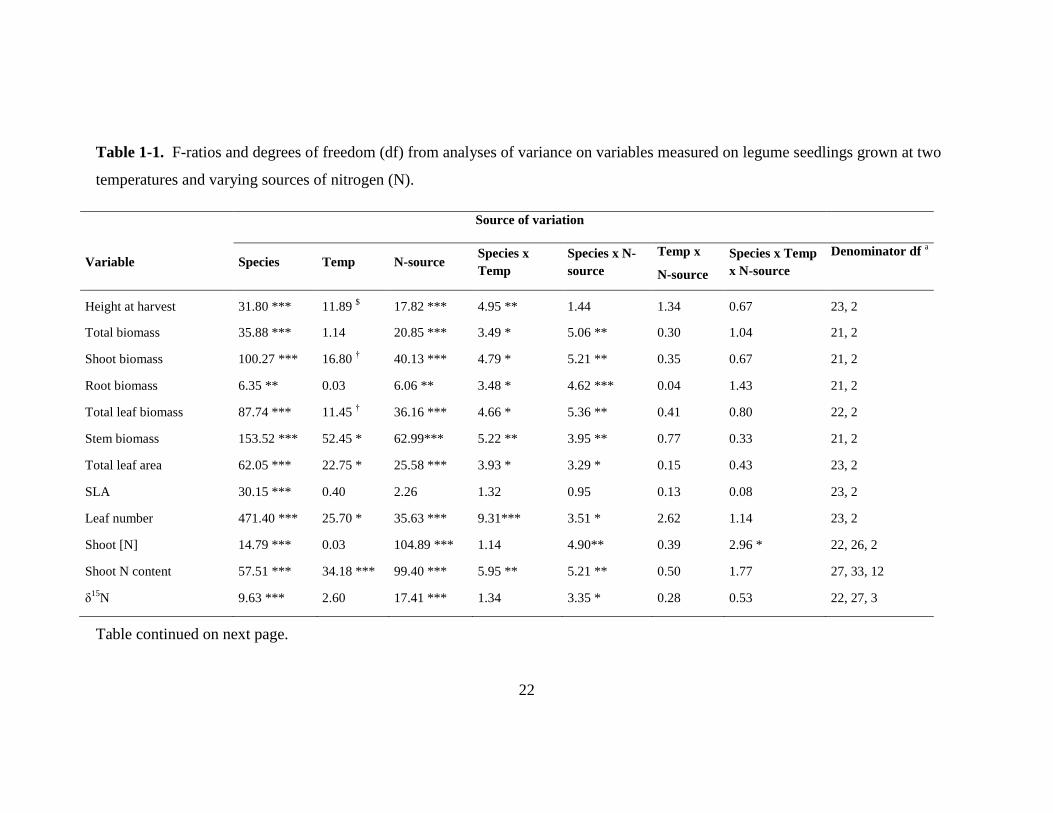
Overall, while species differences accounted for the majority of variation in
morphological variables, both temperature and N-source also affected many of these
traits in a species-specific manner (Table 1-1). N-source was the largest source of
variation in shoot [N] and nodule variables, but these responses were also affected by
temperature in some species. An interaction between temperature and N-source was
detected only in leaf chemistry and nodule variables, but not growth or morphology.
Growth and Morphology
Both temperature and N-source affected total, aboveground, and belowground
biomass in a species-specific manner (Fig. 1-2). Temperature significantly affected the
biomass of Lespedeza only. In this species, aboveground biomass was 109% larger at
28oC than at 25
oC. Root biomass was not affected by temperature in any species.
Amorpha plants grown without mineral N, i.e. that relied solely on N2-fixation, had 65%
less total and root biomass than plants receiving mineral N. Shoot biomass was 40-70%
lower in Amorpha and Lupinus individuals relying solely on N2-fixation than those
receiving mineral N.
Lespedeza plants growing at the high temperature regime had twice the total leaf
area and twice as many leaves as those in at the lower temperature. Dalea individuals in
the warmer treatment also exhibited 28% more leaves at 28oC than 25
oC. Amorpha

14
individuals relying solely on N2-fixation exhibited 40% fewer leaves and 53% less leaf
area than individuals given mineral N. Specific leaf area (SLA) was the only
morphological variable that was unaffected by temperature and/or N-source (Table 1-1).
Nitrogen Concentrations
Shoot N concentration was 45 to 57% lower in plants relying only on N2-fixation
than in those given mineral N for all species but Dalea (Table 1-2). Temperature affected
shoot [N] in Lupinus individuals relying solely on N2-fixation only, with 51% less shoot
[N] at high temperature. There was a trend for 34% and 17% lower shoot [N] at 25oC
than 28oC for Lespedeza and Amorpha individuals relying solely on N2-fixation,
respectively, but this difference was not statistically significant.
For all species but Dalea, the smaller shoot biomass and lower shoot [N]
displayed by individuals depending solely on N2-fixation compared to those given
mineral N led to a 72-81% lower total N content in shoots (data not shown). For
Lespedeza, total shoot N content was 49% lower at 25°C than 28°C, with a trend for the
largest difference occurring in individuals relying solely on N2-fixation. There was a
trend for Amorpha and Lupinus individuals relying solely on N2-fixation to display 50%
higher or 54% lower total shoot N content values, respectively, at high than low
temperature, but this difference was not statistically significant. Except for Lupinus
individuals given only rhizobia at 28°C, most individuals exhibited more N content in
their shoots than found in seed (data not shown).
δ15
N values
The NH4NO3 used in the nutrient solution had a δ15
N value of 1.65‰.
Surprisingly, individuals relying solely on the nutrient solution for an N source displayed
negative δ15
N values, while the δ15
N values of individuals given both rhizobia and
mineral N were more similar to that of the nutrient solution (Table 1-3), although our
ability to detect treatment effects and interactions may be limited by sample size.

15
Species and N-source caused significant differences in shoot δ15
N values, while
temperature did not. Lespedeza displayed significantly lower δ15
N values than the other
species overall. Amorpha individuals grown with both rhizobia and mineral N had
significantly higher δ15
N values than those solely relying on N2-fixation or mineral N
uptake. Dalea individuals given both sources of N had significantly higher δ15
N values
than those relying solely on N2-fixation.
Nodules
Only three individuals in the mineral N only treatment developed nodules,
indicating minimal contamination. Only 12.5% of plants with both rhizobia and mineral
N had nodules, while 92.5% of individuals with rhizobia but no mineral N possessed
nodules.
Lupinus individuals relying only on N2-fixation possessed 86% fewer nodules at
28oC than 25
oC, and nodules were 63% smaller at the high temperature. These two
trends led to 87% less total nodule fresh weight in the warmer treatment for Lupinus (Fig.
1-3). One reason for this trend was the strong effect of temperature on the proportion of
plants containing nodules in Lupinus individuals relying solely on N2-fixation.
Nodulation decreased from 100% of plants containing nodules at 25oC to 40% at 28
oC.
Other species did not show a significant effect of temperature on nodule number or mass.
Differences in nodule number and fresh weight between species were only apparent in
individuals relying solely on N2-fixation.
Discussion
Prairie legumes often play an influential role in the dynamics of their
surroundings by adding nitrogen (N), enriching soil organic matter, and stimulating N
mineralization (Fargione et al. 2007, Fornara and Tilman 2008, Fornara et al. 2009).
Despite this importance, very little is known about the effects of elevated temperature on
prairie legumes. Knowledge of how climate change will affect these species is important
for predicting prairie functioning in the future, and will help inform preservation and

16
restoration practices. We grew four prairie legume species at two temperatures that
mimicked climate change (25/20°C and 28/23°C) and with or without rhizobia and
mineral N to determine if these factors affected i) seedling growth, morphology, and N
chemistry and ii) nodulation and nitrogen isotope discrimination. We found that
temperature and/or N-source affected many of these traits in a species-specific manner.
Lespedeza showed enhanced growth under the high temperature while Lupinus displayed
detrimental effects of warming on nodulation.
Temperature Effects
Previous studies examining legume growth and temperature have shown that the
temperature response can depend on species (Zachariassen and Power 1991, Purwantari
et al. 1995). It should be noted, however, that most studies compare species across
relatively large temperature gradients, i.e. of 20°C (Purwantari et al. 1995). In contrast,
we examined a smaller temperature range (3°C difference) that is similar to forecasted
temperature increases and still found species-specific responses. Warming affected the
growth and morphology of two of the four species, Lespedeza and Dalea. Lespedeza
plants were 60% larger and had twice the leaf area at 28°C than 25°C. Dalea displayed
28% more leaves in the high temperature, but there was no temperature effect on total
leaf area, indicating that leaves produced at 28°C were smaller than those at 25°C. In
contrast to our findings, Medicago sativa (alfalfa), displayed decreased growth at 28°C
compared to 25°C (Aranjuelo et al. 2007).
Numerous studies have shown that temperature affects nodule number and weight
in a species-specific manner (Jones 1921, Purwantari et al. 1995, Lira Jr. et al. 2005), and
we found similar results. Lupinus plants relying solely on N2-fixation had 63% smaller
and 86% fewer nodules at the high temperature, suggesting that temperature may have
affected both the initiation of nodulation and nodule development. This reduction in total
nodule mass most likely led to decreased rates of N2-fixation on a whole plant basis.
Indeed, while biomass was not statistically affected by temperature in these individuals,
they displayed 35% lower shoot [N] at the low temperature. Lupinus grows in the cooler
spring months, and 28°C may be above the optimal temperature for Lupinus and/or the

17
rhizobia strain used in the study. Our results suggest that if Lupinus does not shift its
phenology in response to future climate change, it may show detrimental effects of
elevated temperature in relation to nodulation, possibly leading to decreases in N2-
fixation. It should be noted, however, that we only used one strain of rhizobia to
inoculate Lupinus. Since the strain of rhizobia can affect the temperature response, the
exact response in the field may depend on the rhizobia strains present (Montanez et al.
1995).
Our expectation that plants relying solely on N2-fixation would display larger
responses to temperature, i.e. greater warming effects on growth and morphological
variables, than plants receiving mineral N, because the N2-fixation symbiosis may be
more sensitive to warming than mineral N uptake, was not seen. Previous studies in the
literature that have addressed this question have yielded mixed results. In several studies,
Glycine max (soybean) and Phaseolus vulgaris (common bean) relying more on N2-
fixation than soil N uptake displayed larger effects of root temperature on N
accumulation and biomass growth than plants receiving more mineral N (Lie 1971, Piha
and Munns 1987, Legros and Smith 1994). However, Kessler et al. (1990) found
evidence that the growth response of Trifolium repens (white clover) to temperature did
not depend on N-source. Contrary to our expectations, we found no significant
temperature by N-source interactions for the biomass or morphological variables,
suggesting that source of N may not be important to the temperature response of growth
for these legumes.
Only shoot [N] in Lupinus showed a larger temperature response in individuals
relying solely on fixation compared to those given mineral N, perhaps reflecting a
temperature effect on N2-fixation, as others have shown in global literature syntheses
(Houlton et al. 2008). As mentioned above, the decrease in nodulation at 28°C compared
to 25°C in Lupinus probably led to a decrease in or lack of N2-fixation, likely limiting the
N content to that present in the seed. In Lespedeza individuals relying solely on N2-
fixation, the larger total shoot N content at 28°C compared to 25°C suggests more N2-
fixation at the high temperature. Although not statistically significant, individuals grown
at 28°C did display a trend towards higher total nodule fresh mass than those grown at

18
25°C. Increased rates of nodule activity could also have led to this difference in N
content, as well. However, since we did not measure N2-fixation rates directly, we can
only speculate on the causes and consequences of this pattern. We were also unable to
examine the effects of temperature on the percent of N derived from fixation (%Ndfa)
because of the poor nodulation of individuals given both rhizobia and mineral N. These
shoot N results do suggest a higher sensitivity of N2-fixation to temperature than mineral
N uptake for these two species, but this difference surprisingly did not affect the
sensitivity of growth to temperature.
The effect of temperature on N2-fixation is often included in conceptual models of
N2-fixation regulation (Hartwig 1998, Vitousek et al. 2002, Reed et al. 2011), but is not
always explicitly included in simulation models used to examine how ecological controls
on N2-fixation and legumes lead to the observed patterns of global N2-fixation rates
(Vitousek and Field 1999, Menge et al. 2009). Houlton et al. (2008) did include
temperature constraints on nitrogenase activity in a terrestrial biogeochemical model.
Using data from the literature, they developed an empirical relationship between N2-
fixation rates and soil temperature. Including this relationship in the model helped to
explain the observable patterns of low N2-fixation rates in high latitude forests. They
used a single relationship, but it is known that legume and rhizobial species can vary in
their response to temperature (Piha and Munns 1987, Purwantari et al. 1995). Although
our growth chamber study is on a much smaller scale than most continental modeling
studies, it does provide further evidence that temperature can affect N2-fixation
differently for co-occurring legume species. Incorporating this variation may improve
the representation of N2-fixation in ecosystem models.
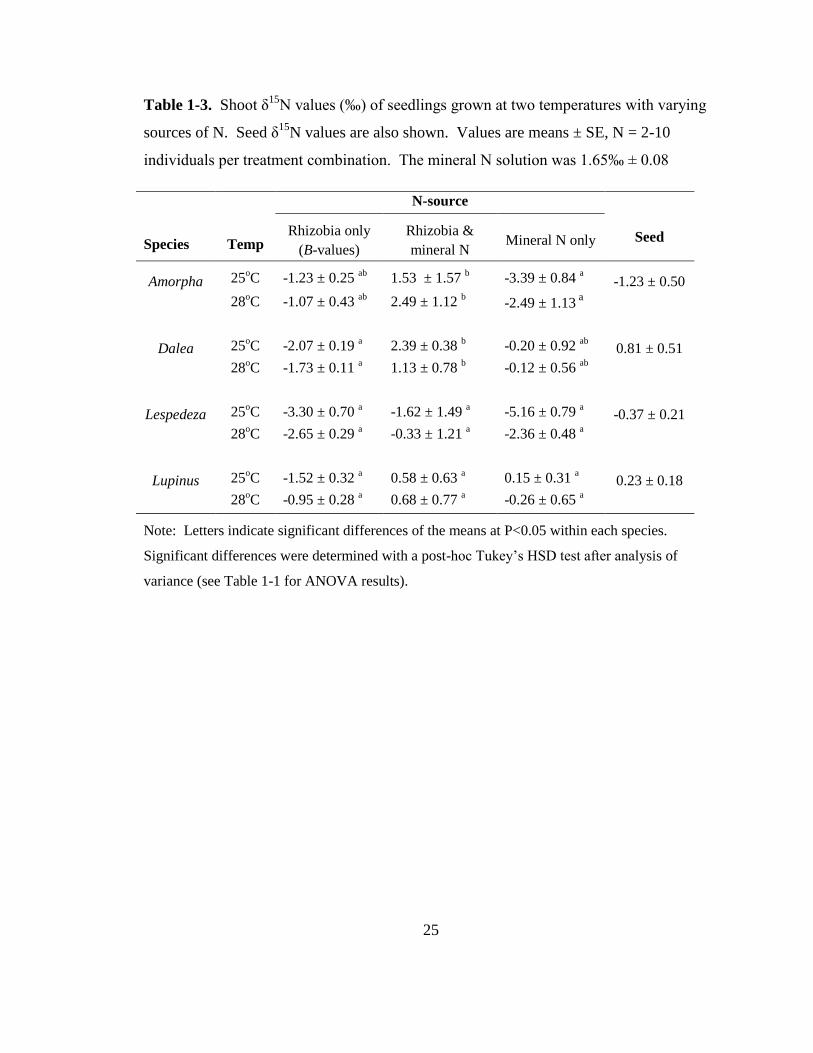
In general, temperature did not affect δ15N values, including the B-value of any
species, i.e., the δ15
N value of individuals relying solely on N2-fixation. The B-value
adjusts for the isotopic fractionation that occurs during the fixation process and transfer
of fixed N throughout the plant and is important because it serves as an end-member in
mixed model equations to calculate the percentage of N derived from fixation in field
grown plants (Unkovich et al. 2008). Our mean B-values, -2.97 to -1.16‰, fall within
the range of commonly reported mean shoot B-values of -3.61 to 1.9‰ (Boddey et al.

19
2000, Unkovich et al. 2008). Isotopic fractionation can be affected by environmental
factors such as nutrient availability and soil moisture, although the effects are often small
(Ledgard 1989). To our knowledge, this was the first study to examine the effect of
temperature on B-values. Our findings are encouraging for field studies of N2-fixation
that employ the natural abundance technique, because it suggests that B-values obtained
at one growth temperature can be applied to plants grown at different temperatures.
N-source effects and inferences from δ15
N
In most species, individuals relying 100% on N2-fixation were 36% smaller than
those given mineral N, as we expected. Both Legros and Smith (1994) and Purwantari et
al. (1995) found similar results with Sesbania sesban and Glycine max, respectively.
This reduction in biomass may be due to the high carbon costs of N2-fixation (Ryle et al.
1979, Gutschick 1981). These plants could also have been limited by nitrogen, as
suggested by the 40% lower shoot [N] values in plants relying solely on N2-fixation than
those given mineral N, because N2-fixation was limited. Thus, if elevated temperature
affects the availability of mineral N in the soil and/or the activity of N2-fixation,
productivity of legumes is likely to be affected.
The effects of N-source on δ15
N values were not as we expected. Surprisingly,
δ15
N values of those given both rhizobia and mineral N did not always display
intermediate δ15N values between those relying solely on N2-fixation (-2.97 to -1.16‰)
and those only given mineral N (-3.60 to -0.07‰). Additionally, individuals receiving
mineral N did not display δ15
N values more similar to the bulk fertilizer than those
receiving rhizobia. The reason for these results is not clear, although we can suggest
several hypotheses to explain these patterns : i) discrimination against the heavier isotope
occurs during both N2-fixation and mineral N uptake (Kohl and Shearer 1980, Yoneyama
et al. 2001); ii) discrimination due to translocation of N from roots to shoots is fairly
similar regardless of source; iii) preferences for NH4+ or NO3
- vary among species or
treatments (Clarkson et al. 1986, Macduff and Jackson 1991); and iv) larger plants
display higher δ15
N values more similar to the bulk fertilizer because of more complete
use of the nitrogen pool.

20
We caution that our ability to extrapolate our growth chamber results to the field
is limited. Our results pertain to legume seedlings and the response of mature plants with
large root systems and growing in competition is likely to differ. Our seedlings did not
experience water limitation, but seedlings in the field may be more affected by warming-
induced decreases in soil moisture than by direct effects of temperature increases.
Additionally, the response is likely to be mediated by the available rhizobia strains. We
used one or two strains, but these species are capable of nodulating with many strains
(Tlusty et al. 2004). On the other hand, the seedling stage of many plants’ life cycles is
often vulnerable to environmental factors, and places a strong filter on the composition of
the future plant community. Our study suggests that certain legume species may be
favored by climate change, while other species may not, and this may have implications
not only for the diversity of prairie communities in a warmer world, but also for N
cycling.
Conclusion
Overall, temperature and N-source influenced growth, nodulation, and N content
in a species-dependent manner. Lespedeza exhibited enhanced seedling growth under
warming while Lupinus displayed decreased nodulation under warming. In response to
warming as a consequence of climate change, plants can shift their range, shift their
phenology, acclimate, and/or adapt (Walther 2003). Since legumes are often dependent
on specific rhizobia strains, their response may be limited by the response of rhizobia.
Although, we can only extrapolate the results of a growth chamber experiment to field
situations with caution, our study indicates that the seedlings of certain legume species
may display beneficial effects of elevated temperature while other species may not.
Assistance and Funding
I thank Laura Deede for assistance in experimental set-up and data collection. I
thank the late Peter Graham for assistance with laboratory methods and Cece Martin,

21
David Manning, and Jen Reese for assistance with the harvest. I also thank Sarah Hobbie,
Michael Russelle, and three anonymous reviewers for reviews of previous drafts.
Funding for this study was provided by an LTER grant from the National Science
Foundation (DEB-0620652 ) to David Tilman and colleagues.
22
Table 1-1. F-ratios and degrees of freedom (df) from analyses of variance on variables measured on legume seedlings grown at two
temperatures and varying sources of nitrogen (N).
Source of variation
Variable Species Temp N-source Species x
Temp
Species x N-
source
Temp x
N-source
Species x Temp
x N-source
Denominator df a
Height at harvest 31.80 *** 11.89 $ 17.82 *** 4.95 ** 1.44
1.34 0.67 23, 2
Total biomass 35.88 *** 1.14 20.85 *** 3.49 * 5.06 ** 0.30 1.04 21, 2
Shoot biomass 100.27 *** 16.80 † 40.13 *** 4.79 * 5.21 ** 0.35 0.67 21, 2
Root biomass 6.35 ** 0.03 6.06 ** 3.48 * 4.62 *** 0.04 1.43
21, 2
Total leaf biomass 87.74 *** 11.45 † 36.16 *** 4.66 * 5.36 ** 0.41 0.80 22, 2
Stem biomass 153.52 *** 52.45 * 62.99*** 5.22 ** 3.95 ** 0.77 0.33 21, 2
Total leaf area 62.05 *** 22.75 * 25.58 *** 3.93 * 3.29 * 0.15 0.43 23, 2
SLA 30.15 *** 0.40 2.26 1.32 0.95 0.13 0.08 23, 2
Leaf number 471.40 *** 25.70 * 35.63 *** 9.31*** 3.51 * 2.62 1.14 23, 2
Shoot [N] 14.79 *** 0.03 104.89 *** 1.14 4.90** 0.39 2.96 * 22, 26, 2
Shoot N content 57.51 *** 34.18 *** 99.40 *** 5.95 ** 5.21 ** 0.50 1.77 27, 33, 12
δ15
N 9.63 *** 2.60 17.41 *** 1.34 3.35 * 0.28 0.53 22, 27, 3
Table continued on next page.

23
Table 1-1, continued.
Source of variation
Variable Species Temp N-source Species x
Temp
Species x N-
source
Temp x
N-source
Species x Temp
x N-source
Denominator df a
Nodule number 7.28 ** 0.42 265.49 *** 5.36 ** 8.00 *** 0.27 4.32** 22, 2
Total nodule fresh mass 6.45 ** 2.58 252.95 *** 10.82 *** 3.49 * 3.61 * 8.50 *** 22, 2
Mass per nodule 6.65 ** 9.39 † 221.53 *** 5.79 ** 2.31 † 4.03 * 5.05 ** 22, 2
Numerator df 3 1 2 3 6 2 6
$, *, **, *** indicate significance at the P< 0.10, 0.05, 0.01, and 0.001 levels, respectively.
a For all variables except shoot [N], shoot N content, and δ
15N, the first value denotes df for all effects except “Temp,” and the second value is the
df for the “Temp” main effect. For nitrogen variables, the first value indicates df for all effects containing “N-source,” the second value denotes df
for remaining effects that contain “Species,” and the third value indicates the df for the “Temp” main effect.
Note: The significant species x temperature interaction for total and root biomass arose because species differed at one temperature but not the
other. Within a species, there was no effect of temperature on total or root biomass.

24
Table 1-2. Shoot [N] (mg/g) of seedlings grown at two temperatures with varying
sources of N. Values are means ± SE, N = 2-10 individuals per treatment combination.
N-source
Species Temp Rhizobia only Rhizobia &
mineral N Mineral N only
Amorpha 25oC 17.04 ± 1.05
a 35.22 ± 2.31
c 35.49 ± 2.20
c
28oC 20.55 ±1.56
ab 33.87 ± 3.38
bc 38.19 ± 2.90
c
Dalea 25oC 33.74 ± 1.28
ab 33.86 ± 3.56
ab 47.96 ± 4.39
a
28oC 31.26 ± 0.89
b 38.94 ± 7.15
ab 43.77 ± 3.93
ab
Lespedeza 25oC 17.73 ± 0.80
a 48.90 ± 8.73
b 56.93 ± 4.60
b
28oC 26.76 ± 1.15
ab 44.37 ± 7.74
b 47.61 ± 2.53
b
Lupinus 25oC 21.45 ± 1.84
b 32.52 ± 1.72
a 35.56 ± 1.30
a
28oC 14.11 ± 1.19
c 32.84 ± 2.92
ab 36.30 ± 1.98
a
Note: Letters indicate significant differences of the means at P<0.05 within each species that
were determined from a post-hoc Tukey’s HSD test after analysis of variance (see Table 1-1 for
ANOVA results).
25
Table 1-3. Shoot δ15
N values (‰) of seedlings grown at two temperatures with varying
sources of N. Seed δ15
N values are also shown. Values are means ± SE, N = 2-10
individuals per treatment combination. The mineral N solution was 1.65‰ ± 0.08
N-source
Species Temp Rhizobia only
(B-values)
Rhizobia &
mineral N Mineral N only Seed
Amorpha 25oC -1.23 ± 0.25
ab 1.53 ± 1.57
b -3.39 ± 0.84
a -1.23 ± 0.50
28oC -1.07 ± 0.43
ab 2.49 ± 1.12
b -2.49 ± 1.13
a
Dalea 25oC -2.07 ± 0.19
a 2.39 ± 0.38
b -0.20 ± 0.92
ab 0.81 ± 0.51
28oC -1.73 ± 0.11
a 1.13 ± 0.78
b -0.12 ± 0.56
ab
Lespedeza 25oC -3.30 ± 0.70
a -1.62 ± 1.49
a -5.16 ± 0.79
a -0.37 ± 0.21
28oC -2.65 ± 0.29
a -0.33 ± 1.21
a -2.36 ± 0.48
a
Lupinus 25oC -1.52 ± 0.32
a 0.58 ± 0.63
a 0.15 ± 0.31
a 0.23 ± 0.18
28oC -0.95 ± 0.28
a 0.68 ± 0.77
a -0.26 ± 0.65
a
Note: Letters indicate significant differences of the means at P<0.05 within each species.
Significant differences were determined with a post-hoc Tukey’s HSD test after analysis of
variance (see Table 1-1 for ANOVA results).

26
Figure 1-1. The assembled Magenta units used to grow the seedlings. A) A seedling
growing in sand. B) The cotton wick that transferred nutrient solution from the bottom
vessel to plant roots.

27
Figure 1-2. The effect of temperature and nitrogen-source on shoot and root dry mass of
four legume species A) Amorpha canescens, B) Dalea purpurea, C) Lespedeza capitata,
and D) Lupinus perennis. White bars above zero display shoot biomass and gray bars
below zero show belowground biomass. Error bars indicate ±1 SE. Within each species
and variable, letters indicate significant differences among treatments at P<0.05.
Significant differences were determined from post-hoc Tukey HSD tests after analyses of
variance (see Table 1-1 for ANOVA results).

28
Figure 1-3. The effect of temperature on the total fresh weight of nodules for individuals
of four legumes species relying 100% on fixation for nitrogen. Light gray bars represent
individuals grown at 25/20°C (day/night) and the dark gray bars represent those grown at
28/23°C. Error bars display ±1 SE. * indicates a significant difference (P<0.05) among
the temperature treatments within each species. Significant differences were determined
with a post-hoc Tukey HSD test after analysis of variance (see Table 1-1 for ANOVA
results).

29
Chapter 2
Consequences of elevated temperatures on prairie legume biomass and
nitrogen cycling in a field warming experiment in Minnesota
30
Summary
Current and ongoing increases in global temperature are likely to have direct and
indirect effects on the nitrogen (N) cycle, including those mediated through effects on
legumes, which have a special role in the N-cycle through their N2-fixation ability. These
effects can feedback to alter plant functioning and community structure, especially in N
limited ecosystems. We used a manipulative field warming and plant diversity
experiment to investigate the potential effects of elevated temperature on the
aboveground biomass, shoot [N], and N2-fixation reliance of four prairie legumes
(Amorpha canescens, Dalea purpurea, Lespedeza capitata, and Lupinus perennis) during
the first two years of warming. We also monitored the effect of warming on soil
microclimate and in-situ net N mineralization rates, as these variables likely mediate the
effect of warming on legumes. Warming decreased soil moisture and increased soil
temperature, but had no effect on net N mineralization. Warming increased aboveground
biomass of Dalea and Lupinus, but decreased shoot [N] for all species. There was no
effect of warming on the reliance on N2-fixation, estimated with the 15
N natural
abundance method, for these species. Plant species diversity did not have strong effects
on the response of most variables to warming. These results suggest that legume-
mediated effects of temperature on N-cycling will be due to changes in legume biomass
and tissue chemistry not N2-fixation. We did observe strong interannual variation
between a wet and dry year for many variables, suggesting that these traits are responsive
to climate fluctuations.

31
Introduction
Nitrogen (N) is often a limiting nutrient in many temperate ecosystems (LeBauer
and Treseder 2008; Craine and Jackson 2010). Because many aspects of the N cycle are
impacted by temperature and water availability, climate change has the potential to
impact plant and ecosystem functioning by altering the N cycle (Shaver et al. 2000,
Rustad et al. 2001). In addition, recent modeling studies indicate that inclusion of N
dynamics and feedbacks in global simulation models can significantly alter predictions
when compared to models that do not include coupling of the carbon and N cycles
(Sokolov et al. 2008, Thornton et al. 2009, Zaehle et al. 2010). Understanding the effects
of climate change on the N cycle is crucial to predicting the future response of
ecosystems as well as vegetation feedbacks to the climate (Hungate et al. 2003, Finzi et al.
2011).
Legumes play an influential role in N cycling by adding N to their surroundings
through N2-fixation and increasing plant N-availability with their relatively high N litter
(Vitousek and Walker 1989, Craine et al. 2002, Temperton et al. 2007). In U.S. prairies,
N2-fixing legumes comprise 1-17% of the biomass (Piper et al. 2007). Due to their rarity,
they only account for about 5% of the total N input into the system (Woodmansee et al.
1981) although the exact contribution is likely to be mediated by their abundance.
However, even small changes in N inputs may have a large impact in these N-limited
communities over time (Kindscher and Tieszen 1998). Thus, knowledge of legume
functioning under future climate is an important component to understanding how N
cycling may change. Most studies focus on crop or forage legumes. Comparatively little
research has examined the effects of climate change on legumes native or naturalized to
the U.S. prairies (Garten et al. 2008).
Elevated temperature can influence N2-fixation through several direct and indirect
pathways (Fig. 2-1). Soil temperature is known to affect almost all aspects of the N2-
fixation process. Soil temperature can effect nodulation (Barrios et al. 1963, Purwantari
et al. 1995), nodule development (Piha and Munns 1987), and nodule activity (Meyer and
Anderson 1959, Hungria and Franco 1993). Similar to extreme soil temperature, drought

32
conditions inhibit all aspects of the symbiosis (Sprent 1972, Serraj et al. 1999, Aranjuelo
et al. 2007). Since legumes typically show a preference for soil N, with reliance on
fixation decreasing with increasing soil N (Allos and Bartholomew 1955, West et al.
2005), changes in soil N availability may also affect N2-fixation. Net N mineralization is
commonly used as an index of plant available N (Schimel and Bennett 2004). Elevated
temperature has been found to increase net N mineralization in several studies (Rustad et
al. 2001, Schmidt et al. 2002, Melillo et al. 2011), but no change or decreases have been
found as well (Rustad et al. 2001, Verburg et al. 2009). Moreover, the response of
mineralization to temperature may vary within a growing season (Shaw and Harte 2001)
or between years (Wan et al. 2005), and is likely to be mediated by soil moisture (Rustad
et al. 2001, Verburg et al. 2009). Furthermore, temperature may affect N2-fixation
through its effect on photosynthesis and respire ation. Both photosynthesis and
respiration were altered in several species during a field warming study in Oklahoma
(Zhou et al. 2007). For both Trifolium repens (white clover) and Medicago sativa
(lucerne), N2-fixation increased when air temperature increased but root temperature
remained constant (Harding and Sheehy 1980, Kessler et al. 1990). By altering
photosynthesis and respiration, temperature can alter the demand for N and the amount of
carbon substrate available for fixation.
Temperature effects on N cycling and legumes may be influenced by plant
diversity and the context of the surrounding plant community. Diversity, often measured
as species richness, affects both abiotic soil conditions such as temperature and moisture
and N-dynamics such as supply and demand (Hooper et al. 2005). Both negative and
positive correlations between soil moisture and species number have been reported (De
Boeck et al. 2006, Fornara and Tilman 2009). Increases in temperature are expected to
decrease soil moisture by increasing evapotranspiration (Harte et al. 1995, De Boeck et al.
2006). Greater shading at higher diversity may attenuate this effect, but greater biomass
at higher diversity could also lead to higher water demand and evapotranspiration. No
interaction between warming and diversity was seen in a warming study on mesocosms
that varied in species number (De Boeck et al. 2006). Mineral soil N-availability (as
indicated by potential mineralization rates) may be higher in more diverse plant

33
communities (Zak et al. 2003, Malchair et al. 2010, Oelmann et al. 2011). However,
demand and competition for mineral N is likely to be greater at higher diversity, causing
legumes to increase their reliance on N2-fixation as species numbers increase (Carlsson et
al. 2009, Fornara and Tilman 2009, Roscher et al. 2011).
To better understand the possible consequences of climate change on legume
functioning and their impact on N cycling in prairies, we used a manipulative field
warming experiment to examine the response of four native legumes (Amorpha
canescens, Dalea purpurea, Lespedeza capitata, Lupinus perennis) to elevated
temperature in a biodiversity experiment in central Minnesota, USA. These species are
widely distributed, vary in traits such as phenology and nodule type (Sprent 2001), and
showed contrasting responses to a 3 °C temperature gradient under controlled conditions
in a growth chamber experiment (Chapter 1) (Whittington et al. 2012). Here we
examined the impact of warming and diversity on N2-fixation as estimated with the 15
N
natural abundance method, and three potential drivers of N2-fixation, (soil temperature,
soil moisture, and N mineralization) (Fig. 2-1). In addition, we measured legume
biomass and tissue C and N chemistry to determine whether these also changed in
response to elevated temperature and diversity. We expected that elevated temperature
would decrease N fixation and mineralization through effects on soil moisture, but that
these responses would be mediated by plant community diversity. In addition, we also
expected that these parameters and warming effects would vary between years as a
function of the ambient variation in temperature and rainfall.
Methods
Experimental Setup
We examined the effects of elevated temperature on legumes in a large field
warming experiment that was established in a long-term (>15 yrs) biodiversity
experiment at Cedar Creek Ecosystem Science Reserve (East Bethel, MN) (Tilman et al.
2001). In 1994 and 1995, 9x9 m2 plots were seeded with 1, 2, 4, 8, 16, or 32 species of

34
grassland plants native or naturalized to Minnesota. In 2008, 38 of these plots were
selected to be part of the Biodiversity and Climate (BAC) warming experiment. These
plots consist of six 32-species, nine 16-species, nine 4-species, and one monoculture plot
of each of the following species: Achillea millifolium, Amorpha canescens, Andropogon
gerardii, Dalea purpurea, Koeleria cristata, Lespedeza capitata, Liatris aspera, Lupinus
perennis, Panicum virgatum, Poa pratensis, Schizachyrium scoparium, Solidago rigida,
and Sorghastrum nutans. Each plot is split into three 2.5m x 3m subplots with different
warming treatments: ambient, low, and high. Warming is achieved via infrared heat
lamps (Kalglo Electronics, Bethlehem, PA, USA) suspended 1.8 m aboveground from
metal frames. Lamps over high and low subplots emit 1200 and 600 watts of radiation,
respectively. These lamp parameters were chosen to increase the surface soil temperature
in bare ground plots by 3°C and 1.5°C for high and low warming treatments respectively.
Extensive testing of the warming footprint was done prior to installing the lamps to verify
that these targeted soil temperatures were achieved. Metal flanges over the lamp and a
metal bar under the lamp help distribute heat over the subplot. Metal flanges and frames
(without lamps) were also hung over ambient subplots to account for any possible effect
of shading. Heating occurs April through November, and here we report data collected
during 2009 and 2010.
Soil Temperature and Moisture
Surface soil temperature in each subplot was monitored hourly with three
iButtons (Maxim, Sunnyvale, California, USA), installed 2cm below the surface. For
each subplot, the mean soil temperature recorded during the in situ N mineralization
incubation periods is reported. Soil moisture in the top 18cm was measured
gravimetrically as part of the N-mineralization measurements. One initial soil core (see
below) was taken from each subplot in May, July, and September of 2009 and 2010.
Approximately 10g of soil from each core was weighed, dried at 105°C for 48 hours, and
re-weighed.

35
Biomass
Aboveground biomass of legumes in each subplot was estimated by harvesting
plants in early August in 2009 and 2010 and is used as a proxy for abundance. In each
subplot, all biomass 1cm above ground was clipped from two 10cm x 1.5m strips. The
location of these strips was the same for all subplots but varied between years to avoid
resampling the same location. Tissue was sorted to species, dried, and weighed.
Stable Nitrogen Isotope Analysis and Ndfa Calculations
Nitrogen isotopic composition was measured on harvested legume tissue to
estimate N2-fixation through the 15
N natural abundance method. This method relies on a
difference in the stable isotopic composition of mineral soil N compared to that of air.
Legumes relying more on N2-fixation will have δ15
N values closer to zero, which is δ15
N
of air. Shoot tissue samples (i.e. stems plus leaves) from two individuals in each subplot
of polyculture plots and from three individuals in each monoculture subplot were ground
and analyzed for N concentration and its stable isotopes at the Stable Isotope Facility at
University of California, Davis, on a PDZ Europa ANCA-GSL elemental analyzer
coupled to a PDZ Europa 20-20 isotope ratio mass spectrometer (Sercon Ltd., Cheshire,
UK). Shoot tissue of non-legume individuals from subplots that did not contain legumes
was also analyzed to act as reference plants, i.e. the δ15
N signatures of these plants
represent the values of plants grown using N sources from the soil only. Reference
species were the C3 forbs Achillea millifolium, Monarda fistulata, and Solidago rigida.
The percent of nitrogen derived from fixation (%Ndfa) was estimated with the
following equation (Shearer and Kohl 1989):
%Ndfa = δ15
N of reference plant - δ15
N of legume x 100
δ15
N of reference plant - δ15
N of fixed N
The reference plants approximate the δ15
N value of available mineral nitrogen in the soil.
The δ15
N of fixed nitrogen (referred to as the B-value) is defined as the species-specific
isotopic composition of tissue when legumes are grown using N2 fixation as the sole N
source, and is typically determined in growth chamber experiments. Ideally, the

36
reference plant(s) chosen should be similar to the legume of interest, especially in rooting
depth, phenology, and mycorrhizal status, as these characteristics influence where and
when mineral nitrogen is obtained. Good matches, however, can be difficult to find
especially when restricted to planted communities like our field experiment. For this
reason, we used mean values from several species as our reference. Some legume
individuals displayed values δ15
N values above the mean reference value, yielding
negative %Ndfa values. We set these values of estimated %Ndfa to zero. We also found
that our field values of δ15
N were lower than B-values that we measured previously in a
growth chamber experiment (Table 1-3) (Whittington et al. 2012), most likely because
the rhizobial strains used in the lab experiment did not fully match those in the field.
Because of this, we used the lowest δ15
N value from the field as the B-value, making the
assumption that at least one individual is fixing 100% of its N.
Shoot [C] and [N] values were measured at the same time as nitrogen isotopic
composition. Total shoot N content was calculated by multiplying the mean shoot [N]
for each species in each subplot by the harvested biomass for that species in that subplot.
Net N mineralization
An index of plant available mineral N was estimated by measuring net N
mineralization three times a year (late spring, summer, and autumn) with 1 month in-situ
incubations. At the start of each interval in mid-May, mid-July, or mid-September, two
tubes 18cm in length and 2cm in diameter were hammered into each subplot. One tube
was removed immediately and the soil stored in plastic freezer bags on ice until
extraction of N within 24 hours. The second tube was capped and left in the ground for 1
month before it was removed and the soil N extracted. To extract mineral N (NH4+ and
NO3-), approximately 10g of soil was added to 50mL of 2M KCl, shaken for 1 hour, and
then filtered through Whatman1 filter paper. Blanks were created by shaking and
filtering KCl without added soil. The extracts were stored at -20oC until further analysis.
Soil moisture was measured gravimetrically at the time of extraction as described above.
The amount of NH4+ and NO3
- in the KCl soil extracts was measured colorimetrically
using a protocol based on Weatherburn (1967) or Doane and Harworth (2003),
37
respectively, and modified for 96-well plates (Allison and Treseder 2008). Absorbance
was measured with a SpectraMax Plus spectrophotometer (Molecular Devices, Sunnyvale,
CA, USA) equipped with a plate reader. Dilutions of NH4Cl and KNO3 solutions were
use to create standard curves for each plate. Each plate contained three replicates of each
sample and standard, which were averaged. We calculated net N mineralization as the
difference in blank-corrected NH4+ and NO3
- between final and initial cores.
Statistical Analysis
We used analysis of variance (ANOVA) to examine the effects of year, warming,
diversity, and incubation period (late spring, summer, and autumn) on net N
mineralization and initial soil moisture (measured on soil extracted with the initial N
mineralization core). Unfortunately, we have no measurements of soil temperature
during the late spring 2009 incubation period, so we ran separate ANOVAs for each year
to determine the effect of warming treatment, diversity, and incubation period on mean
surface soil temperature.
We used ANOVA to determine the effect of warming treatment, species, year,
and diversity on variables measured on focal legume individuals (biomass, %Ndfa, shoot
[N], shoot C:N, and total shoot N content). However, the following experimental
constraints prevented us from examining all main effects and interactions in a single
model: (i) monoculture plots were not replicated for individual species, (ii) by design not
all legume species occur in the 4-species plots, and (iii) the 32-species plots were planted
from a different seed mix and thus are not included in any of the diversity analyses. For
these reasons, we analyzed subsets of the data separately to answer different questions
(Table 2-1). In the first model, we limited our analysis to the two species (Dalea and
Lespedeza) that were found in both 4 and 16 species plots in order to examine potential
species x diversity interactions. The second model included species as a random factor to
examine the effect of diversity at three levels (1-, 4-, and 16-species). The third model
focused on differences among species and only used data from high diversity plots (16-
and 32-species) where all legume species are present.

38
All analyses were performed with JMP Pro 9.0 software (SAS Institute, Cary,
North Carolina, USA). In each of the analyses, plot and its interaction with subplot were
included as random factors to account for the split plot design. Aboveground biomass
and %Ndfa were square root transformed and total shoot N was log-transformed to
improve normality.
Results
Ambient Climate
Mean annual growing season temperature was 16.1°C and 17.2°C in 2009 and
2010, respectively. Cumulative precipitation during the growing season was 388mm in
2009 and 2010 was considerably wetter with 655mm rainfall.
Soil Microclimate and N Dynamics
Experimental warming significantly increased surface soil temperature by 0.5-
2.5°C during all incubation periods except late spring 2010 (Table 2-2), indicating that
our warming treatments were likely warming the vegetation, as well. The effect of
warming on soil temperature was influenced by diversity, with larger increases at low
diversity (Table 2-3). Soil moisture (measured on initial samples during N mineralization
incubations) varied among years and seasons (Fig. 2-2). It was 126% higher in early
spring of 2010 compared to 2009 and 29% higher in mid-July than mid-May or
September (Fig. 2-2). High warming significantly decreased soil moisture by 9%,
although this was largely driven by the 20% decrease under warming in mid-July of 2009
(Fig. 2-2). Diversity did not affect the response of soil moisture to warming.
Mean net N mineralization rates were low but consistently positive except for
autumn 2009. Net N mineralization was affected by year and incubation period, but was
unaffected by warming treatment (Fig. 2-3a,b). Results were similar when expressing
mineralization per gram of soil or per gram of soil N. Mineralization during autumn was
30 times higher in 2010 than 2009. In 2010 autumn mineralization was 8 times higher

39
than late spring mineralization in 2010. When NH4+ and NO3
- dynamics were examined
separately, warming only affected net ammonification in 2010 during autumn when high
and low warming increased net ammonification by 50% and 13%, respectively, compared
to ambient (Fig. 2-3c,d). Warming treatment had no effect on net nitrification (Table 2-
2).
Legume Biomass, N Concentrations, and Reliance on Fixation
In general, the three subsets of data yielded similar results in ANOVA (Table 2-4),
however the main effects that explained the largest amount of variation differed among
the variables. Biomass and total shoot N content were affected mostly by species identity
and species diversity (Table 2-4 and Fig 2.4). While shoot [N] and %Ndfa were also
affected strongly by species, they showed large interannual variation and smaller if any
effects of warming treatment (Table 2-5 and Fig. 2-5).
Aboveground biomass of the four focal legumes was affected by all four effects,
and many of the interactions were significant (Table 2-4). There was 72% and 53%
lower legume biomass in 16-species plots than 1- or 4-species plots, respectively (Fig
2.4b). Warming significantly affected biomass of Dalea and Lupinus, but this effect
depended upon year. For Dalea in 2010, aboveground biomass in the high warming
treatment was over twice and four times that seen in the ambient treatment for 4-species
and 16-species plots, respectively (Fig 2.4a). In 16- and 32-species plots, Lupinus
displayed 88% and 78% higher biomass under high and low warming, respectively, than
under ambient conditions (Fig 2.4c). When species were pooled (Model 2), an effect of
warming on biomass was only detectable in 16-species plots (Fig 2.4b). In 16- and 32-
species plots, Amorpha and Lupinus exhibited 60-63% less biomass in 2010 than 2009.
Year accounted for the most variation in shoot [N] with 13-47% higher shoot N in
2010 than 2009, depending on species (Table 2-5). Warming treatment affected shoot [N]
only in 2010 when warming decreased [N] by 8-32%, depending on species. Individuals
of all species growing in monoculture displayed 6% and 22% higher shoot [N] than those
in 4- and 16-species plots, respectively. Dalea displayed the highest shoot [N] values and
Lupinus displayed the lowest shoot [N] values. Shoot C:N results were similar to shoot

40
[N] (data not shown). Total shoot N content did not follow the trends seen for shoot [N].
Diversity and species were the only factors that affected total shoot N. Following the
trends seen for aboveground biomass, total shoot N content was lower in 16-species plot
compared to 1- and 4-species plots. In 16-species plots, Lupinus exhibited the highest
total N content while Dalea displayed the lowest.
Legume shoot δ15
N values varied from -4.43‰ to 2.41‰ (mean -2.06‰), and
reference plant values overlapped legume values with a range of -6.69‰ to 3.40‰ (mean
-1.41‰). Significant interannual variation in %Ndfa was evident in all three ANOVA
models, mostly driven by interannual variation in Dalea and Lupinus (Fig. 2-5b). In
Dalea, %Ndfa was twice as high in 2010 than 2009, and Lupinus displayed 44%
higher %Ndfa values in 2010 than 2009. Plots with higher diversity generally displayed
higher %Ndfa values. In 2010, %Ndfa in 16- and 4-species plots was twice that exhibited
in monocultures, while %Ndfa was three times higher in 16-species plots compared to 4-
species plots in 2009 (Fig. 2-5b). Species also differed in %Ndfa, with Lespedeza and
Amorpha relying the most on fixation and Lupinus relying the least. Warming treatment
did not affect %Ndfa (Table 2-4).
Discussion
Ongoing global climate change may affect ecosystem nutrient cycling, plant traits,
and community structure directly and indirectly. Because nitrogen (N) is often a limiting
nutrient and legumes play a significant role in N cycling, we examined the potential
impacts of warming on perennial prairie legumes and in situ net N mineralization rates
using a manipulative field warming study. As expected, warming increased soil
temperature and decreased soil moisture. Contrary to our expectations, net N
mineralization rates, an index of plant available N, did not differ among warming
treatments or diversity levels, but showed strong interannual variation during the autumn
sampling period. Warming decreased shoot [N] but had no effect on the reliance on N2-
fixation. Warming increased aboveground biomass for two species. This higher biomass
did not lead to higher aboveground N pools in these legumes, though, because of the

41
lower shoot [N]. Overall, these results suggest small potential legume-mediated changes
to N-cycling under elevated temperatures for this prairie ecosystem, and that climate
change may affect ecosystem N cycling more via effects on legume abundance and tissue
N chemistry than effects on N2-fixation.
Soil Microclimate and Nitrogen Dynamics
Experimental warming achieved via heat lamps or buried cables typically
increases soil temperature and decreases soil moisture (Rustad et al. 2001). We found
that warming increased surface soil temperature and the effect was stronger at lower
diversity levels, as we expected. This diversity effect may have been caused by
decreased evapotranspiration at higher diversity due to greater shading of the soil surface.
It could also be an artifact of the warming method. The higher biomass in more diverse
plots may cause higher transpiration rates and higher air humidity. The higher humidity
in more diverse plots may have absorbed more of the infrared radiation, decreasing the
amount that reached the soil surface. Warming also decreased soil moisture in the top 18
cm, but this response was not affected by diversity. However, we temper this conclusion
with the caveat that our soil moisture measurements were single time point measurements
that may not reflect the mean effect of warming or its interaction with diversity over the
growing season.
Net N mineralization is often used as an index of plant available N (Schimel and
Bennett 2004). Contrary to our expectations, we found no effect of warming or diversity
on net N mineralization rates. Previous studies have yielded mixed results on the effect
of warming on net N mineralization (Rustad et al. 2001). In a subalpine warming
experiment in the Rocky Mountains, warming did not affect N transformation rates in a
mesic site, but did increase net N mineralization in a dry site for two out of three years
(Shaw and Harte 2001). Interannual variation in the warming response of N
mineralization was also seen in an Oklahoma tallgrass prairie warming experiment, with
warming increasing it one year and decreasing it the next (Wan et al. 2005). A lack of
response may be due to the antagonistic effects of decreasing soil moisture and increasing
soil temperature. We did find that the warming treatment increased net ammonification

42
in the autumn of 2010, but warming had no effect on net nitrification. Net nitrification
was larger than ammonification and likely had more influence on net N mineralization
rates. The increase in ammonification may have arisen due to higher gross mineralization
rates, lower microbial immobilization, or decreased nitrification rates under warming.
Contrary to our findings, warming increased immobilization during the first two years of
two other field warming studies (Shaw and Harte 2001, Larsen et al. 2011).
Mineralization rates were much higher during the autumn of 2010 compared to
any other time period. The reasoning for this is unclear. Possibly, decomposition of
senesced Lupinus occurred during this period, and the higher soil moisture in 2010
allowed a large pulse of mineralized N to be released. For all incubation periods except
autumn 2010, net N mineralization values ranged from -0.2 to 0.3 ugN g-1
soil day-1
,
which is several orders of magnitude smaller than values measured in 2007 reported
previously for these plots (Fornara et al. 2009) but more similar to gross mineralization
rates measured in these plots in 2000 (Zak et al. 2003). The reason behind this
discrepancy is unclear, but may be due to variation in methods or relatively high
concentrations of NO3- and NH4
+ occasionally found in our blanks.
Legume Biomass, N Concentrations, and Reliance on Fixation
Dalea and Lupinus were the only species that displayed an aboveground biomass
response to warming treatment, with three and two times, respectively, higher biomass
under warming when averaged across 4-, 16-, and 32-species plots in 2010. The biomass
harvest occurred when Lupinus was senescing. For this species, warming may have
delayed senescence leading to higher biomass in these subplots at the time of harvest,
although we detected no effect of warming on community NDVI during this time in 2011
(Chapter 3). In a growth chamber experiment with seedlings of these species, Lespedeza
was the only species to display enhanced growth under elevated temperature, although
there was trend for a small increase in biomass for Dalea (Fig. 1-3) (Whittington et al.
2012). These discrepancies could indicate that seedlings and mature plants will respond
differently to warming, and these differences could interact to affect community structure
over time. The differences between the two studies could also be due to the indirect and

43
complex interactions that occur in field settings but not in the controlled environment of
a growth chamber. Increases in legume abundance and biomass may lead to higher fixed
N inputs and greater mineral N availability to neighboring plants.
Warming decreased shoot [N] concentrations, with reductions of 8-32%
depending on species, suggesting a decrease in mineral N uptake. This reduction in
uptake could be due to decreased soil moisture or undetected decreases in soil N
availability. We also cannot rule out the possibility of warming effects on root biomass
or architecture that could also affect N uptake. Previous studies have yielded mixed
results on the impact of warming on tissue nitrogen concentrations. Warming decreased
shoot [N] in several species of Oklahoma tallgrass prairie (An et al. 2005). Similar results
have been found for clover (Lilley et al. 2001), rhizome peanut (Fritschi et al. 1999), and
several woody species (Tolvanen and Henry 2001). Warming, however, was found to
increase [N] in a moist tundra ecosystem (Welker et al. 2005), and the authors attribute
this increase to an increase in N mineralization. In an old-field grassland community in
Tennessee, warming had no effect on shoot [N] in several species, including two
legumes (Garten et al. 2008). Decreases in shoot [N] (and resulting increases in shoot
C/N) may affect herbivory and litter chemistry which, in turn, will affect decomposition
(Hobbie 1992, Cornwell et al. 2008). Decreases in shoot [N] may also decrease the
stimulatory effect these legumes have on mineralization. These effects may then
feedback to affect nutrient cycling, plants, and other trophic levels.
Despite the reduction in shoot [N] seen under warming in our experiment, total
shoot N content was not affected by warming, indicating that total aboveground biomass
N pools in legumes were unchanged. Surprisingly, we did not see higher total shoot N
content for Dalea or Lupinus under warming even though warming treatment increased
biomass for these species. For these species, the decrease in [N] counteracted the effect
of increased biomass under warming. If the reliance on N2-fixation remains constant, the
lack of a warming effect on legume aboveground N pools suggests that the amount of
fixed N added to this system by these legumes will remain unchanged in the future.
Interannual variation in shoot [N] was larger than variation due to warming
treatment. N concentration was higher in 2010 when it was warmer and wetter than 2009.

44
These environmental conditions may have led to higher N uptake ability (Bassirirad 2000)
and/or N availability, although our measures of plant available N during late spring and
summer did not show significant differences between years. We also found strong
interannual variation in shoot [N] of grasses collected in these plots, but not in non-
leguminous forbs (data not shown).
Contrary to expectation, N2-fixation (estimated as the proportion of nitrogen
derived from fixation, %Ndfa) was not affected by warming treatment. As with net N
mineralization, the warming induced soil moisture decreases may have offset the
increases in soil temperature. Also, our net N mineralization results indicate no change in
plant available soil N under warming. The effects of warming on these three drivers of
N2-fixation probably combined to produce no change in the reliance on fixation. We also
found no effect of warming on nodule fresh weight, which ranged from 0 g m-3
to 240 g
m-3
among subplots in 2011 (data not shown). Warming affected N2-fixation in several
other field warming studies (Lilley et al. 2001, Garten et al. 2008). The lack of any
warming induced changes to %Ndfa and total N content in our study suggests that the
amount of fixed N added to these systems will not change significantly due to future
temperature increases. The future response, though, is likely to depend on how the
specific drivers of N2-fixation are affected and on potential changes to legume abundance.
Nitrogen fixation did show variation among years and diversity levels. Percent
Ndfa was higher in 2010 than 2009, most likely due to higher precipitation and warmer
temperatures. The legumes also displayed greater reliance on fixation as diversity
increased, as we expected. It is likely that these legumes face stronger competition for
mineral N in the presence of many non-legume neighbors, including grasses, than they
experience in less diverse plots. A decrease in competition for N in lower diversity plots
was also visible in our [N] results. Shoot [N] increased with decreasing diversity for
these legumes, with 22% higher [N] in monoculture than plots with 16 species. Evidence
for this phenomenon has also been found in several other studies (Lilley et al. 2001,
Carlsson et al. 2009, Roscher et al. 2011). These results suggest that any warming-
induced changes in diversity or species composition may indirectly affect fixation rates
and, in turn, the amount of fixed N that is added to the community.

45
The 15
N natural abundance method for measuring %Ndfa used in this study is not
without limitations (Shearer and Kohl 1986, Handley and Raven 1992, Boddey et al.
2000). Our values of %Ndfa may be inflated since we assumed at least one individual of
each species was relying solely on fixation each year. However, our values are still
relatively low compared to values reported for the same species in a different field
experiment in the same field (West et al. 2005). Our low values most likely occurred
because several individuals exhibited higher δ15
N values than the mean reference values.
Since a negative reliance on fixation is not feasible, we set the %Ndfa value to zero for
these individuals. Our data suggest that this method for measuring N2-fixation may not
be suitable for this system since there was not a large difference in the δ15
N values of
legumes and reference plants. Since we did not see a large difference between legume
δ15
N values and reference plant δ15
N values, our %Ndfa values should not be considered
as quantitative measurements of N2-fixation and it would be inappropriate to use these
values to estimate amount of fixation on an ecosystem wide basis (Ledgard and Peoples
1988). We attempted to measure the δ15
N of mineral soil N using a diffusion method
(Stark and Hart 1996, Stephan and Kavanagh 2009) and our KCl soil extracts but
insufficient recovery prevented us from calculating δ15
N values.
Our experimental design allowed us to examine the potential influence of plant
species diversity on the effects of warming in these communities. Diversity did not affect
the warming response in any variable except soil temperature, suggesting that species
composition did not influence the response to warming. This result contrasts that found
in an European grassland warming and diversity experiment (De Boeck et al. 2008). In
this study, warming-induced decreases in aboveground biomass were higher at higher
species diversity. The authors attribute this interaction to increased evapotranspiration
and thus increased drought conditions under warming in more diverse communities
compared to the drought experienced under warming in less diverse communities.
However, this experiment was performed in mesocosms with plants that had been
growing for only three years. These relatively young plants may not have had to time to
develop large root systems, making them more vulnerable to the effects of warming on
soil moisture. Our warming experiment investigated the effect of warming on established

46
(~15 years) plants that likely have large root systems. The legumes in our study may
have access to deep water and thus the warming-induced decreases in soil moisture did
not inhibit biomass production.
Conclusion
Our results after two years of warming suggest that the impacts of temperature
increases on legumes and N-cycling in this system are likely to be mediated through
changes in legume abundance and tissue chemistry and not through N2-fixation. The
only effects of warming on legumes were a decrease in shoot [N] for all species and
increased shoot biomass for two species. These effects have the potential to alter N-
cycling. We also found few significant interactions between diversity and warming,
suggesting that diversity has little influence on the warming responses of N-cycling
processes. However, many of the variables we measured showed strong differences
between a very dry year and the following wet year, which confirms that these processes
are responsive to climate. The strong interannual variation underscores the need for
multi-year, manipulative field experiments. Additionally, significant effects of warming
may arise over time as changes, especially to community structure, accumulate and
interact, and these effects will not be detected in single year studies.
Assistance and Funding
Raw soil temperature and biomass data were organized by Peter Wragg and
Margaret Kosmala, respectively. We thank Troy Mielke and all the Cedar Creek interns
who assisted in data collection. Funding for this research was provided by a NSF-LTER
grant to David Tilman, a Grant-in-Aid-of-Research from University of Minnesota to
Jennifer. S. Powers, and a University of Minnesota College of Biological Sciences Plant
Traits Course research grant to Heather R. Whittington.

47
Table 2-1. Summary of three analysis of variance models used to analyze variables
measured on legume individuals.
Model
Subset of data
analyzed
Fixed effects included
in model Unique insight
1
Dalea and Lespedeza
individuals in 4- and
16-species plots
Year, Species,
Diversity, Warming
treatment
Highlights potential
species x diversity
interactions
2
Individuals in 1-, 4-,
and 16-species plots
Year, Diversity,
Warming treatment
Permits diversity to
be examined at three
levels
3 Individuals in 16-
and 32- species plots
Year, Species,
Warming treatment
Allows all species to
be compared

48
Table 2-2. F-ratios(degrees of freedom) from ANOVA of fixed effects on soil variables measured during the first two years of a warming
and plant diversity experiment.
Y year, S species, D diversity, W warming, P incubation period. †,* indicate significant effect at P<0.1 and 0.05, respectively. The first degrees
of freedom (df) value is numerator df and second value is denominator df. 1Insignificant (P>0.1) 3-way and 4-way interactions not shown.
Effect 1
Soil Temp
Soil moisture
Net N
mineralization
Net
ammonification
Net
nitrification 2009 2010
Y -- -- 3688.8 (1,435) * 6.0 (1,435) * 0.2 (4,58) 13 (1,435) *
D 16.4 (2,29) * 26.2 (2,29) * 2.1 (2,29) 0.4 (2,29) 0.5 (2,29) 0.9 (2,29)
W 334.8 (2,58) * 299.2 (2,58) * 13.4 (2,58) * 1.0 (2,58) 3.3 (2,58)* 0.2 (2,58)
P 8756.9 (1,87) * 7996.1 (2,174) * 179(2,435) * 1.8 (2,435) 2.1 (2,435) 7.7 (2,435)*
Y x D -- -- 22.7(2,435) * 0.5 (2,435) 0.5 (2,435) 1.4 (2,435)
Y x W -- -- 3.3 (2,435)* 1.1 (2,435) 4.1(2,435) * 0.1 (2,435)
Y x P -- -- 60.8 (2,435) * 3.5 (2,435) * 2.4(2,435) † 10.0(2,435) *
D x W 7.7 (4,58) * 13.7 (4,58) * 0.4 (4,58) 0.5 (4,58) 1.0 (4,58) 0.7 (4,58)
D x P 22.6 (2,87) * 22.1 (4, 174) * 2.2(4,435) † 0.3 (4,435) 0.7 (4,435) 0.9 (4,435)
W x P 0.4 (2,87) 11.7 (4,174) * 2.4 (4,435)* 1.2 (4,435) 3.3(4,435) * 0.2 (4,435)
Y x W x P -- 3.1 (4,435)* 1.2 (4,435) 3.2(4,435) * 0.2 (4,435)
D x W x P 0.5 (4,87) 2.3 (8,174) * 0.8 (8,435) 1.0 (8,435) 0.7 (8,435)

49
Table 2-3. Mean increase in surface soil temperature (°C) from ambient in plots varying
in diversity under two levels of warming.
Year
Warming
treatment
Diversity level
1-species 4-species 16-species 32-species
2009 High 2.46 2.37 1.45 2.24
Low 1.08 1.07 0.62 1.06
2010 High 2.64 1.98 1.30 1.77
Low 1.09 1.12 0.51 0.98

50
Table 2-4. F-ratios(degrees of freedom) from ANOVA models 1, 2, and 3 used to analyze
variables measured on legume individuals during the first two years of a warming and
plant diversity experiment.
Effect1
Aboveground
biomass Shoot [N] %Ndfa
Total shoot N
content
Model 1 Y 2.0 (1,70) 51.3 (1,171)* 59.3 (1,171) * 0.7 (1,54)
S 39.8 (1,99) * 7.3 (1,72) * 39.1 (1,53) * 0.2 (1,38)
D 20.2.4 (1,11) * 0.2 (1,13) 10.2 (1,13) * 44.7 (1,13) *
W 5.0 (2,25) * 8.4 (2,27) * 0.6 (2,30) 3.1 (2,17)
Y x S 0.3 (1,71) 0.7 (1,166) 24.0 (1,167) * 0.1 (1,52)
Y x D 2.4 (1,71) 0.3 (1,72) 12.5 (1,171) * 0.3 (1,54)
Y x W 4.7 (2,70) * 4.0 (2,170) * 0.7 (2,170) 0.5 (2,59)
S x D 102.2 (1,89) * 3.5 (1,72) † 0.2 (1,54) 13.0 (1,38) *
S x W 3.0 (2,88) † 2.5 (2,102) † 4.6 (2,98) * 0.2 (2,60)
D x W 0.1 (2,25) 0.1 (2,27) 0.1 (2,30) 0.4 (2,59)
Y x D x W 1.7 (2,71) 3.5 (2,170) * 0.1 (2,170) 0.4 (2,59)
Model 2 Y 1.8 (1,174) 68.3 (1,371) * 13.2 (1,367) * 0.7 (1,153)
D 14.0 (2,15) * 12.2 (2,15) * 10.8 (2,17) * 20.7 (2,14) *
W 5.5 (2,132) * 7.0 (2,50) * 0.9 (2,47) 0.6 (2,126)
Y x D 4.9 (2,175) * 1.0 (2,372) 17.7 (2,368) * 0.8 (2,154)
Y x W 2.9 (2,175) 4.4 (2,368) * 1.2 (2,367) 0.7 (2,152)
D x W 3.6 (4,101) * 0.9 (4,47) 1.3 (4,44) 0.9 (4,112)
Model 3 Y 29.0 (1,211) * 72.9(1,443) * 31.7 (1,441) * 8.4 (1,203) *
S 53.8 (3,227) * 61.2(3,414) * 55.6 (3,442) * 19.9(3,206) *
W 3.4 (2,24) * 4.8(2,30) * 1.4 (2,25) 0.4 (2,27)
Y x S 8.3 (3,211) * 2.9 (3,434) * 4.1 (3, 431) * 2.8 (3,194) *
Y x W 1.1 (2,211) 6.5(2,446) * 1.7 (2,444) 0.5 (2,204)
S x W 2.6 (6,232) * 1.1 (6,450) 0.4 (6,446) 1.4 (6,210)
Y year, S species, D diversity, W warming. †,* indicate significant effect at P<0.1 and 0.05,
respectively. The first degrees of freedom (df) value is numerator df and second value is
denominator df. 1Insignificant (P>0.1) 3-way and 4-way interactions not shown.

51
Table 2-5. Shoot [N] (mg/g) of four legumes grown at three diversity levels and under
three warming treatments for two years. Values are means ±SE.
Year
Effect Level 2009 2010
Species1 Amorpha 14.4 ±0.3
c 17.5 ±0.4
ab
Dalea 17.0 ±0.3 ab
18.9 ±0.4 a
Lespedeza 15.0 ±0.2 bc
17.5 ±0.3 a
Lupinus 9.8 ±0.3 d 14.0 ±0.9
c
Warming
treatment
Ambient 14.7±0.5 cd
20.0 ±0.7 a
Low 14.3 ±0.4 d 17.4 ±0.5
b
High 14.3 ±0.5 cd
16.1 ±0.5 bc
Diversity2 1-species
a 16.2 ±0.8 21.0 ±1.0
4-species b 16.3 ±0.4 18.4 ±0.4
16-species b 13.4 ±0.3 16.9 ±0.5
Letters indicate significant differences among means within each effect (P<0.05, post-hoc
Tukey’s HSD tests after ANOVA).
1 Values shown are means pooled across 16- and 32-species plots
2 There were no diversity x year interactions and the differences between the diversity
levels is shown with letters next to the level.

52
Figure 2-1. Several pathways through which warming can affect N2-fixation.

53
Figure 2-2. The effect of warming on initial soil moisture measured at the start of three N mineralization incubation periods in 2009 (a)
and 2010 (b). Letters indicate significant differences among means (P<0.05, post-hoc Tukey’s HSD test after ANOVA) across both
years. Error bars indicate ±SE.

54
Figure 2-3. The effect of warming treatment on net N mineralization (a,b) and net
ammonification (c,d) at three time periods in 2009 (a,c) and 2010 (b,d). Error bars
indicate ±SE. Letters indicate significant differences across years (P<0.05 post-hoc
Tukeys HSD tests after ANOVA).

55
Figure 2-4. The effect of warming on aboveground biomass as analyzed with three
different subsets of data. (a) The effect of warming on biomass as analyzed with model 1.
Only 2010 data are shown as this was the only year to show a significant effect of
warming. (b) The influence of diversity on the warming response of biomass (model 2).
Means are pooled across species and years. (c, next page) The effect of warming on
biomass for each species in diverse plots (model 3). Means are pooled across both years
16- and 32-species plots. Error bars represent ±SE. Letters indicate significant
differences (P<0.05 post-hoc Tukeys HSD tests after ANOVA) among means within each
model.

56
Figure 2-4 (continued).

57
Figure 2-5. The effect of year and diversity on the proportion of N derived from fixation
(Ndfa). (a) Interannual variation in Ndfa for the four focal legumes. (b) The effect of
plant diversity on Ndfa. Error bars indicate ±SE. Letters indicate significant differences
among means (P<0.05 post-hoc Tukey’s HSD tests after ANOVA).

58
Chapter 3
Phenological responses of prairie plants to elevated temperature in a field
experiment in Minnesota

59
Summary
As temperature is a common regulator of plant phenology, future increases in
global temperatures are likely to cause shifts in the timing of many plant phenophases,
such as flowering and senescence, with the potential for feedbacks on species interactions
and carbon cycling. We used a 3-year field warming study in a temperate grassland to
investigate the effects of warming on the reproductive phenology of 12 perennial plant
species. We also examined the effect of warming on green-up and senescence by
measuring normalized difference vegetation index (NDVI) of these plant communities
throughout one growing season. We found that several species, Amorpha canescens,
Dalea purpurea, and Andropogon gerardii, exhibited accelerated flowering (5-9 days
earlier) under warming. For many species, interannual variability in flowering time was
as large or larger than the effect of warming treatment in any given year. For several
species, responses to warming were not consistent among years. Species did not cluster
into groups based on their reproductive phenological response to warming. Warming led
to higher NDVI values only in the spring, indicating that warming accelerated spring
green-up, but had no effect on senescence. These results suggest that the community
flowering profile will be altered under warming, potentially affecting trophic and
competitive interactions, and indicate that the timing to peak biomass will be accelerated,
likely affecting ecosystem carbon cycling. The large interannual variation we found and
the fact that species’ responses to warming could not be predicted by one year of data
collection highlight the need for long-term global change studies.

60
Introduction
Global mean air temperatures have risen 0.65°C in the past 50 years and are
predicted to rise another 1.8-4.0°C by 2100 (IPCC 2007). Many plant phenological
events, defined as the timing of recurring life history events such as emergence,
flowering, and senescence, are controlled in large part by temperature and are expected to
change with climate (Peñuelas and Filella 2001). Indeed, both observational studies
(Fitter and Fitter 2002, Menzel et al. 2006, Miller-Rushing and Primack 2008) and
manipulative warming experiments (Dunne et al. 2003, Sherry et al. 2007, Jarrad et al.
2008, Liancourt et al. 2012) document shifts in plant phenology that have already
occurred or are likely to occur in the near future. While studies that find changes in
phenology with temperature change are accumulating, a consistent understanding of
which variables are most sensitive to temperature change, and whether species’
phenological responses to temperature differ consistently among functional types has yet
to emerge.
Many plant phenological investigations focus on the timing of emergence and
senescence, as shifts in these events have implications for net primary productivity and
thus global carbon cycling (Penuelas et al, 2009). Some studies have shown earlier
emergence or leaf out dates and delays in senescence when individual plants are
monitored (Arft et al. 1999, Menzel et al. 2001). This lengthening of the growing season
has also been observed regionally or globally with remotely sensed vegetation reflectance
indices (Myneni et al. 1997, Jeong et al. 2011). For North America, satellite reflectance
data suggest that the lengthening of the growing season is due mostly to a delay in
autumn senescence of approximately 9.4 days over the past thirty years (Jeong et al.
2011).
The timing of reproduction (budding, flowering, seeding) is another common
event examined in phenological studies. Shifts in the timing of reproduction have
consequences for plant-pollinator interactions, fitness, and competitive interactions
(Visser and Both 2005, Parmesan 2007, Forrest et al. 2010, Wolkovich and Cleland
2011). Collectively, studies have found that the effect of warming on flowering time

61
(either peak flowering or first flowering date) is species-specific, with some species
displaying a response while others are not affected (Bradley et al. 1999, Penuelas et al.
2002, Liancourt et al. 2012). This result is not surprising as some species are probably
regulated by factors other than temperature, such as photoperiod (Tooke and Battey
2010). The majority of species exhibiting a shift in flowering with temperature elevation
show an advancement of flowering (Dunne et al. 2003, Cleland et al. 2006, Menzel et al.
2006, Miller-Rushing and Primack 2008) but a few show delayed flowering (Penuelas et
al. 2002, Sherry et al. 2007). For example, in one study of 57 Mediterranean species, 27
showed an advancement of flowering over the past 50 years while only 3 showed a delay
in flowering (Penuelas et al. 2002).
In an effort to enhance predictions of which plants will respond to warming,
researchers have tried to find patterns that correlate phenological responses to species
traits. One trait commonly considered is flowering seasonality, i.e. when species tend to
flower during the growing season. Some studies have reported a stronger response in
early flowering species (Fitter and Fitter 2002, Menzel et al. 2006, Miller-Rushing and
Primack 2008) while others found no correlation between the response and flowering
seasonality (Penuelas et al. 2002, Jarrad et al. 2008, Liancourt et al. 2012). One study of
grassland species detected a relationship between the direction of the shift and flowering
seasonality. Early flowering species flowered earlier while later flowering species
showed delayed flowering when plots of prairie vegetation were experimentally warmed
for one year (Sherry et al. 2007). A similar lack of consensus among studies exists when
taxonomy, growth form, or origin (native vs. non-native) are related to phenological
responsiveness (Fitter and Fitter 2002, Penuelas et al. 2002, Davis et al. 2010).
While the patterns of plant phenological responses to increasing temperatures are
emerging, there are at least three gaps in understanding that remain. 1) Do species within
functional groups respond similarly to elevated temperatures? 2) Do slight increases in
temperature (e.g. 1 °C) elicit the same responses as larger temperature increases? 3)
What is the magnitude of inter-annual variation in these processes?
Here we used a manipulative field warming experiment to examine the impact of
low (~1 °C) and high (~3° C) warming on the phenology of perennial grassland plants at

62
three hierarchical scales: individual, population, and patch (i.e. groups of plants from
different species). For three years, we monitored height and reproductive timing on
tagged individuals and observed flowering in populations of twelve species that vary in
functional group (C4 warm-season grasses, C3 cool-season grasses, legumes, and non-
leguminous forbs) and flowering seasonality. To monitor green-up and senescence of the
community, we measured canopy reflectance of small patches from which we calculated
the normalized difference vegetation index (NDVI), a measure of greenness.
We predicted that early flowering species would show advancement of flowering
under warming while later flowering species would exhibit delays, following the results
seen in a warming experiment with similar grassland species (Sherry et al. 2007). We
expected warmed communities to show accelerated green up and delayed senescence, but
that the response of senescence would be more apparent than emergence because annual
spring burning would disconnect emergence from temperature in our prairie ecosystems.
Because shifts in phenology have already occurred in the past fifty years as a result of
temperature increases similar to that produced by the low intensity warming treatment,
we expected our low warming treatment to induce significant changes in phenology but
at a smaller magnitude than those of the high warming treatment.
Methods
Site Description
This study occurred in a manipulative field warming experiment at Cedar Creek
Ecosystem Science Reserve in East Bethel, MN, USA. This site occurs on a sandy
glacial outwash plain with sandy soils low in nitrogen (Tilman 1987). The long-term
mean annual temperature of this site is 6.8°C, and long-term mean annual precipitation is
799mm, 12% of which typically falls as snow. The long-term mean growing season
(April through September) temperature is 16.4°C, and the long-term mean growing
season precipitation is 583mm. Ambient climatic data for the three years of our
experiment appear in Table 3-1.

63
Experimental Design
The warming experiment was superimposed on an existing 13-year old grassland
biodiversity experiment (Tilman et al. 2001). In 1994 and 1995, 9x9m2 plots were sowed
with seed mixtures containing 1, 4, 16, or 32 species of perennial grassland plants native
or naturalized to Minnesota and varying in functional groups (Tilman et al. 2001). In
2008, a subset of these plots was split into three 2.5x3m subplots and overhead infrared
heat lamps (Kalglo Electronics, Bethlehem, PA, USA ) were hung over two of these
subplots (one lamp per subplot) to achieve two levels of warming: low and high. Lamps
emit 600 and1200 watts of radiation in high and low warming subplots, respectively. The
height of lamps (1.8m) and amount of radiation were chosen for their ability to warm
bare ground surface soil by 3°C and 1.5°C for high and low warming, respectively. The
presence of vegetation, though, will attenuate soil warming. Metal flanges were placed
over the lamps to facilitate even distribution of heat the subplot. Flanges without lamps
were also placed over the third ambient control subplot. Surface soil temperature was
monitored hourly with three iButtons (Maxim, Sunnyvale, CA, USA) buried ~1cm deep
in each subplot.
Sampling Approach
We made phenological observations of reproductive events at two scales, the
individual and the population scale, and measured canopy reflectance at the patch scale
(i.e. small areas that include many individuals of several species). Individual scale
measurements were made on tagged individuals of twelve species (Table 3-2), allowing
us to follow the same plant over time and revealing the average response of individuals of
that species. However, these measurements do not necessarily reveal whole population
responses, such as first flowering date and peak flowering, so we also made direct
observations of reproduction at the population level. Reflectance measurements were
made at the patch scale as the footprint of the sensor is too large to isolate a single
individual. It should be noted that not all phenological events were measured at all levels
(e.g. flowering could not be discerned from reflectance measurements).

64
Observations of Reproduction
Because, by design, not every species appears in the low diversity treatments (e.g.
1- and 4-species plots), we restricted our phenological observations of reproduction to the
16- and 32-species plots, where there was greater representation of our twelve target
species. The targeted species are all native, perennial prairie plants that were seeded in
when the original biodiversity experiment was established (Table 3-2). These species
represent three families (Asteraceae, Fabaceae, and Poaceae) and have been previously
placed into functional groups including: C3 (cool season) grasses, C4 (warm season)
grasses, legumes, and non-legume forbs. These species display a range of flowering
times (i.e. flowering seasonality) from May to September (Table 3-2).
For individual-scale measurements, at the start of each growing season from 2009
to 2011, up to three individuals of each species were tagged in each subplot of eleven 16
or 32 species plots. Once a week, the height of these tagged individuals was measured
and reproductive stage was recorded. The number of individuals tagged and the number
of those that flowered are noted in Table 3-2. Stages included budding and flowering. In
addition to tracking individuals, we also monitored population-level phenology in each
subplot. For each species, the percentage of individuals flowering in each subplot was
estimated each week. From these individual and population level observations, we
calculated the variables presented in Table 3-3. We restricted our individual and
population observations to a 40cm wide by 2.5m long strip along the center of each
subplot to ensure that the plants would not be disturbed by other measurements occurring
in the plots.
Reflectance Measurements
We measured canopy reflectance spectra of the subplots with a UniSpec single
channel spectrometer (PP Systems International, Amesbury, MA, USA) equipped with a
straight fiberoptic cable, which quantifies canopy reflectance at 3nm wavelength intervals
from 400nm to 1000nm. An L-shaped scaffold was used to hold the sensor 150cm over
the plots during measurement. We placed the scaffold in the same location to ensure that

65
the same 36cm diameter “patch” was measured each time. At each time point, we
measured the reflectance spectra of two patches for each subplot monitored. In 2011, we
measured canopy reflectance of subplots in all 4-, 16-, and 32-species plots throughout
the growing season, starting in May after plots were burned and ending early November
when the majority of plants had senesced. All readings were taken within two hours of
solar noon and frequently referenced to a white standard.
We used these spectra to calculate the normalized difference vegetation index
(NDVI) using the equation (R800 –R660)/(R800 +R660), where R is the reflectance at the
indicated wavelength. The NDVI is used extensively in image analysis from both remote
sensing and ground-based sensors as an index of ‘greenness’ that ranges from -1 to 1,
with higher values indicating more green biomass (Pettorelli et al. 2005).
Statistical Analysis
The effects of species, year, and warming treatment on the calculated individual
and population-level phenology variables were analyzed with analysis of variance. To
account for the split-plot design, the ANOVA models included plot and its interaction
with subplot (warming treatment) as random factors in addition to the fixed main and
interactive effects of species, year, and warming treatment. For the individual level
variables, Type III sums of squares were used to test the significance of the fixed effects.
At the population level, the ability to monitor the phenology of a species may depend on
the abundance of that species in the plots, i.e. one may be more likely to detect
statistically significant responses for abundant rather than rare species. To account for
this when analyzing the population level variables, we added unpublished data on species
biomass (a proxy for abundance) as the first effect in the model and used sequential Type
I sums of squares to remove any variation in response due to abundance. For each year,
aboveground biomass was collected in 0.1 x 1.5m strips in each subplot. For each
species in each subplot, the biomass over the three years was summed and used as a
proxy for relative abundance. Achillea, Solidago, and Sorghastrum were excluded from
most of the analyses because too few individuals flowered. When the three-way
interaction was not near significance, it was removed from the model. Comparisons

66
between treatment levels were analyzed either with Tukey HSD post-hoc tests or with
pair-wise least square differences, using the Bonferroni adjustment to correct for multiple
comparisons. Height data were log-transformed to improve normality.
We did not have sufficient power in our design to include functional group as a
main effect in our ANOVAs. As an alternative, we used principal components analysis
(PCA) to determine whether phenological responses of species were consistent among
groups and years. For each species and year, the difference between the high subplot and
ambient subplot value for the following six phenological variables was calculated: first
flowering date (FFD), peak flowering date, mean date of budding and flowering of
tagged individuals, length of flowering season, and mean duration of flowering of tagged
individuals. These plot differences (warming treatment responses) were averaged across
plots for each species and year and then analyzed with PCA. Since all the variables are
not in the same units, the analysis was performed on the correlation matrix.
Patch-level NDVI of 4- and 16-species plots was analyzed with ANOVA with
diversity, warming treatment, and date as fixed factors and plot as random factor. NDVI
was arcsine transformed to improve normality. Mean differences were determined with
post-hoc Tukey’s HSD tests. The 32-species plots were analyzed in a separate ANOVA
because they were planted with species drawn from a different species pool and so cannot
be included as another diversity level with the other plots. All statistical analyses were
performed with JMP 9 software (SAS Institute, Inc., Cary, North Carolina, USA).
Results
Warming treatment effects on soil temperature
Soil temperature data indicate that our warming treatments effectively warmed the
surface soil (and by inference, also the air temperature), but that the magnitude of
warming effects varied among diversity treatment and year (Table 3-1). On average,
high warming increased soil temperature by 1.3°C over the growing season. Low
warming increased soil temperature by 0.66°C.

67
Reproductive phenology
For all but one reproductive variable, the main effects of species, year, and
warming treatment were all significant (Table 3-4). Not unexpectedly, the species effect
accounted for most of the variation in all variables. For many variables, the variation
among years exceeded the variation due to warming treatment. The interaction of species
with year or warming treatment was often significant, indicating that specific species are
driving the results.
For individuals in diverse communities, warming generally led to earlier
flowering at both the population and individual scales, with the largest response seen
under high warming. First flowering dates (FFD) for Dalea and Amorpha were 9 and 7
days earlier under high intensity warming compared to ambient, respectively. Amorpha,
Andropogon, Dalea, and Schizachyrium reached peak flowering 7, 6, 5, and 6 days earlier,
respectively, under high warming than ambient (Fig. 3-1). The main effect of warming
for FFD and peak flowering was significant in 2010 and 2011. Tagged individuals of
Amorpha and Dalea flowered 7 and 8 days earlier, respectively, under high warming
compared to ambient. Tagged individuals of Andropogon in low warming subplots
flowered 7 days earlier than those in ambient subplots.
Overall, FFD and peak flowering date were 8 days earlier in 2010 and 1-2 days
earlier in 2011 compared to 2009. Amorpha and Dalea were the only two species that
did not display significant interannual variability in FFD or peak flowering date (Table
S3-1). Tagged individuals of Andropogon, Lespedeza, Liatris, Lupinus, and
Schizachyrium flowered at significantly different dates among years (Table S3-2).
Budding at the individual level was also affected by warming treatment and year,
with several species driving the results. Budding occurred 7 days earlier under high
warming compared to ambient controls for Amorpha and Dalea. Tagged individuals of
all species except Poa and Andropogon differed significantly in budding date among
years (Table S3-2).
Across all species in 2010, the length of the flower season was 18% longer and
the duration of flowering for a tagged individual was 16% longer under high warming
than ambient. However, an effect of warming treatment within each species could not be

68
detected for these two variables. All species except Amorpha, Lupinus, and
Schizachyrium showed significant interannual variation in flowering season length (Table
S3-1). Lupinus, Andropogon, and Liatris showed variation in the duration of flowering
among years (Table S3-2).
Warming treatment did not affect the height at which individuals flowered. A
post-hoc Tukey’s HSD test on the significant three-way interaction revealed that
warming did not affect height at flowering within each year for any species. All species
except Amorpha flowered at different heights among years. Across all species, height at
flowering was tallest in 2011 and shortest in 2009 (data not shown).
PCA Analysis of warming treatment response
To help determine if groups of species share similar responses to warming
treatment, differences between high warming and ambient subplot values for six
phenological variables were analyzed with principal components analysis (Fig. 3-2). The
first axis of the PCA explains 47% of the variation in the response, while the second axis
accounts for 20% of the variation. Table 3-5 gives the loading values/eigenvectors of
each variable for the first two axes. First flowering date had the highest loading value for
axis one and duration of flowering had the highest loading value for axis two. Species do
not cluster into distinct groups. There is also no clear pattern among years, but some
species show more year to year variation in response compared to others. For example,
Lupinus responses cluster together while Liatris responses are mores scattered across the
first two axes.
Patch-level NDVI
For 4- and 16-species plots, warming treatment only affected NDVI early in the
growing season, on 17-May and 23-May (ANOVA warming x date, F(30,1420) = 2.69,
P<0.0001) (Fig. 3-3). High warming subplots displayed 68% and 24% higher NDVI than
ambient subplots on 17-May and 23-May, respectively. There was no significant
diversity by treatment interaction. The 16-species plots exhibited significantly higher

69
NDVI than 4-species plots throughout May and July, suggesting higher biomass in the
more diverse plots (ANOVA diversity x date, F(15,1418) = 31.8, P<0.0001). For the 32-
species plots, Tukey’s HSD tests indicate that NDVI was 40% higher in the high
warming treatment compared to the ambient treatment on 17-May, even though the
treatment effect or the treatment by date interaction were not significant in the ANOVA
(data not shown).
Discussion
Changes to phenology are often the first and most apparent responses to elevated
temperature. We used a manipulative field warming experiment to examine the impact of
elevated temperature on the phenology of perennial grassland plant species. For three
years, we observed several variables of reproductive phenology at both the population
and individual plant scales. Two species that flower mid-season, Amorpha and Dalea,
showed consistent acceleration of flowering in response to the warming treatment.
Importantly, species’ responses to warming were not consistent with flowering
seasonality, and responses to warming were not always consistent among years. Our one
year of patch-level NDVI data indicated that the warming treatment accelerated spring
green-up but did not affect senescence. As predicted, we found stronger responses under
high warming than low warming.
Temperature affected the timing of flowering in a species-specific manner.
Amorpha, Andropogon, and Dalea showed acceleration of at least two flowering
variables under high warming. These species did not show significant advancement of
budding under warming, suggesting that warming may have shortened the duration of
budding. We found evidence for increased duration of flowering, at both the population
and individual scales, although we did not have enough power to detect these changes
within any species. In a 1-year Oklahoma warming study, warming delayed flowering in
Andropogon and Schizachyrium but accelerated budding in Andropogon (Sherry et al.
2007). By contrast, we observed that warming accelerated flowering for these species

70
but did not affect budding. There are a number of possible explanations for the
discrepancies between our findings and their results. The differences may be due to the
short duration (1 year) of the Oklahoma study. The response to warming may differ
between years, as we found for several variables and seen in a 2-year warming study on
the Mongolian steppe (Liancourt et al. 2012). These discrepancies could also arise if a
species’ response to warming depends on its location and the ambient climate. In the
warmer climate of Oklahoma, warming that caused a 3°C increase in soil temperature
(Sherry et al. 2008) may have exceeded a threshold and caused more stress on these
species when compared to warming that caused a ~1.5°C increase in soil temperature in
the cooler climate of Minnesota. The inconsistent results could also be due to different
effects of warming on other variables, such as soil moisture, between the two studies.
Resolving these discrepancies and understanding whether climate change will affect
species differently across their ranges is important because temporal changes to the
flowering profile of a community will have consequences for trophic and competitive
interactions between species and individuals. These interactions can feedback to
influence community dynamics. It will also be useful to know whether the warming
response of a species in one location can be applied throughout that species’ range.
Contrary to our prediction and previous studies (Sherry et al. 2007, Miller-
Rushing and Primack 2008), early flowering species did not show advancement of
flowering nor did late flowering species show delays. Indeed, three of the four species
that showed detectable shifts in flowering are species that flower in the middle of the
growing season. Our warming treatments started in April, but winter temperatures can
influence flowering time of spring flowering species (Miller-Rushing and Primack 2008).
The absence of winter warming could have caused our lack of a detectable response in
our early flowering species. Overall, our results do not show strong evidence that
flowering seasonality is a helpful predictor of flowering phenological responses to future
warming.
We also did not find evidence that species could be grouped according to their
responses to the warming treatment. The PCA did reveal that species may differ in the
interannual variability of their warming response. Some of this variation in response
71
could be an artifact of the variation in species abundances. For example, Liatris was one
of the least abundant species and it showed the greatest interannual variation in response.
In general, our observed responses to warming treatment were strongest in 2010, which
was the warmest year. Possibly other environmental factors, such as more variable
precipitation in 2009 and 2011, affected flowering and obscured our ability to detect a
warming treatment response. Several other multi-year experimental warming studies have
also found yearly differences in phenological flowering responses to warming for several
species (Dunne et al. 2003, Cleland et al. 2006, Liancourt et al. 2012). This year-to-year
variation in response highlights the need for long-term data about how species respond to
climate change.
Many species exhibited significant interannual variation in several flowering
variables. In fact, the effect of year accounted for more variation in all flowering
variables than did warming treatment. Differences in the magnitude of phenological
variables between two years were often similar or larger than the differences between
warmed and unwarmed treatments within a year (Tables S3-1 and S3-2). Some species,
such as Andropogon, Liatris, and Lupinus, showed interannual variability in 6 of the 7
reproductive variables. Dalea and Amorpha, however, exhibited interannual variation in
3 or fewer variables. This lack of interannual variation in these two species was
unexpected, as their response to warming suggest that they are responsive to temperature.
Several experimental warming studies have also observed that interannual variation in
flowering phenology can be just as large or larger than the variation induced by warming
treatment (Dunne et al. 2003, Liancourt et al. 2012). While yearly variations in
temperature probably played a role in causing interannual variation in flowering time,
yearly variation in other factors such as precipitation and the timing of spring burning
likely contributed to interannual variation in these variables, as well (Henebry 2003,
Penuelas et al. 2004, Liancourt et al. 2012).
In 2011, we observed warming treatment effects on the NDVI only in the spring,
contrary to our prediction that senescence would show a stronger response. These results
are consistent with both a recent forest warming study that observed the greatest effect of
warming on leaf area index occurring in late spring and early summer (Rollinson and

72
Kaye 2012) and a temperate grassland warming study that observed no effect of warming
on senescence (Hutchison and Henry 2010), but differ from an arctic tundra warming
experiment that found larger temperature effects on NDVI during senescence than green-
up (Marchand et al. 2004). The higher NDVI in warmed plots during May could have
been caused by earlier emergence of plants, faster growth, or both. Unfortunately, our
measurements do not allow us to distinguish between these two possibilities. The lack of
a detectable warming treatment effect on senescence may have been due, at least in part,
to the lack of precipitation during this period that may have overridden any effect of
warming. The fall of 2011 was very dry, with virtually no precipitation (only ~4mm)
falling in September through October. Although we were unable to detect an effect of
warming treatment on senescence, visual observations suggested a delay of senescence in
many warmed subplots (H. R. Whittington, pers. obs.). While our results predict a longer
growing season and/or shorter time period to peak biomass, one year of data is clearly
insufficient for forecasting whether this trend will persist over time.
At all our measurement scales (individual, population, and patch) we generally
found larger responses under high warming than low warming and were often unable to
detect a response under low warming. However, we do not believe this necessarily
indicates that the plants are not responding to this warming treatment,. Several long-term
observational studies have shown that plants have shifted their phenology in response to
the natural ~1.5°C increase in air temperature that has occurred in the last 50-100 years
(Penuelas et al. 2002, Primack et al. 2004). The magnitude of the trends observed in our
study are within the range seen in these observational studies.
Conclusion
Overall, our results provide further evidence for shifting flowering phenology and
accelerating spring growth under elevated temperature. We found that warming
accelerated flowering in some species but had no effect on others. Species within
functional groups did not respond similarly to warming, and species did not cluster into
distinct groups based on their response. Similar to reproductive phenology, warming

73
accelerated spring green-up but did not affect the timing or rate of senescence. Most
variables showed the strongest response under high warming, but the direction of
response was generally similar under high and low warming. We also found that the
magnitude of interannual variation was similar to or larger than the effect of warming.
The changes in plant phenology we observed have the potential to influence community
dynamics and ecosystem carbon cycling.
Assistance and Funding
The majority of field data collection was performed by Cedar Creek interns
Andrea Hess, Robyn Yechout, and Caiti Langer. Joey Reid, Justin Becknell, and Kristen
Becklund assisted with helpful comments on mansucript. This work was funded by a
NSF-LTER grant to David Tilman and a Grant-in-Aid-of-Research from University of
Minnesota to Jennifer. S. Powers.

74
Table 3-1. Ambient annual and growing season (April through September) climate
summaries (http://cedarcreek.umn.edu/research/weather/) and warming treatment effect
on surface soil temperature for the first 3 years of an experimental warming study at
Cedar Creek Ecosystem Science Reserve, East Bethel, MN.
Annual Growing Season
2009 2010 2011 2009 2010 2011
Mean Temp (°C) 6.4 8.0 8.7 16.1 17.2 15.9
Mean Min Temp (°C) 0.01 1.9 2.4 8.7 10.7 9.9
Mean Max Temp (°C) 12.7 14.1 13.5 23.5 23.7 22.0
Cumulative Precipitation (mm) 636 832 790 388 655 721
Increase in surface soil
temperature in high warming
treatment (°C)
4-species -- -- -- 2.4 1.9 1.6
16-species -- -- -- 1.6 1.3 1.2
32-species -- -- -- 2.6 1.5 1.0
Increase in surface soil
temperature in low warming
treatment (°C)
4-species -- -- -- 1.2 0.9 0.8
16-species -- -- -- 0.7 0.5 0.5
32-species -- -- -- 1.2 0.8 0.8
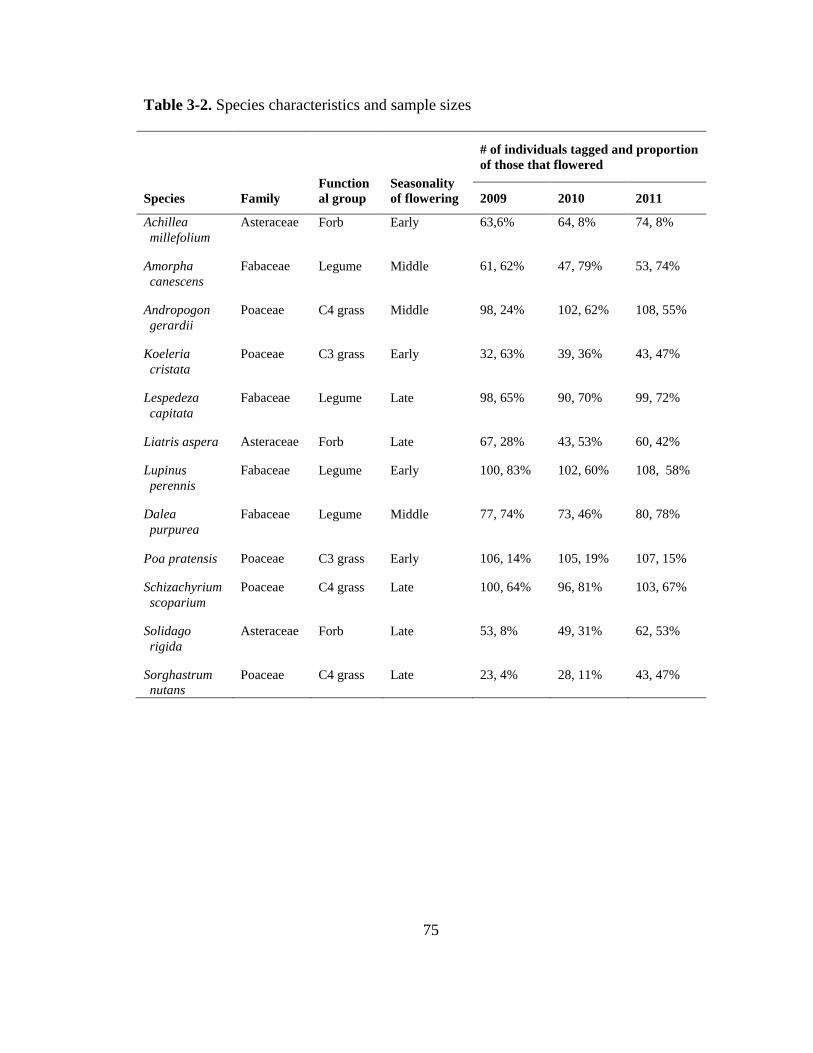
75
Table 3-2. Species characteristics and sample sizes
Species Family
Function
al group
Seasonality
of flowering
# of individuals tagged and proportion
of those that flowered
2009 2010 2011
Achillea
millefolium
Asteraceae Forb Early 63,6% 64, 8% 74, 8%
Amorpha
canescens
Fabaceae Legume Middle 61, 62% 47, 79% 53, 74%
Andropogon
gerardii
Poaceae C4 grass Middle 98, 24% 102, 62% 108, 55%
Koeleria
cristata
Poaceae C3 grass Early 32, 63% 39, 36% 43, 47%
Lespedeza
capitata
Fabaceae Legume Late 98, 65% 90, 70% 99, 72%
Liatris aspera Asteraceae Forb Late 67, 28% 43, 53% 60, 42%
Lupinus
perennis
Fabaceae Legume Early 100, 83% 102, 60% 108, 58%
Dalea
purpurea
Fabaceae Legume Middle 77, 74% 73, 46% 80, 78%
Poa pratensis Poaceae C3 grass Early 106, 14% 105, 19% 107, 15%
Schizachyrium
scoparium
Poaceae C4 grass Late 100, 64% 96, 81% 103, 67%
Solidago
rigida
Asteraceae Forb Late 53, 8% 49, 31% 62, 53%
Sorghastrum
nutans
Poaceae C4 grass Late 23, 4% 28, 11% 43, 47%

76
Table 3-3. Summary of phenological variables calculated from direct observations of
reproduction.
Tagged Individuals Population Level
Budding date First flowering date
Flowering date Length of flowering season*
Duration of flowering* Date of peak flowering
Height at flowering
*The duration of flowering indicates the length of time a
single individual flowers. The length of flowering season
represents the period when any individual of that species is
flowering.

77
Table 3-4. F-ratios(degrees of freedom) from ANOVAs on each reproductive variable. F-ratios of population level variables are from Type 1
sums of squares. Effects were included in the model in the order shown after first including biomass. F-ratios of individual level
variables are from Type III sums of squares.
Population Level Individual Level
Source of
variation FFD
Length of
flowering season
Peak flowering
date
Bud date Flower date
Flowering
Duration
Flowering
Height
S 3252 (7, 575) * 45.7 (7, 598)* 3056 (7, 595) * 872.4 (6, 724)* 1940.6 (8, 1022)* 31.1 (7, 620)* 234.8 (8, 987)*
W 16.3 (2, 19) * 4.4 (2, 21)* 23.5 (2, 17) * 5.8 (2, 30) * 14.8 (2, 30)* 5.3 (2, 41)* 0.02 (2, 29)
Y 139. (2, 564)* 8.9 (2, 585)* 108.2 (2, 582)* 131.9 (2, 715) * 35.9 (2, 1017) * 0.02 (2, 709) 169.1 (2, 978)*
S x W 2.7 (14, 578)* 0.8 (14, 596) 2.8 (14, 595)* 1.8 (12, 710)* 1.6 (16, 994)† 1.3 (14, 616) 1.8 (16, 984)*
S x Y 16.9 (14, 564)* 20.1 (14, 586)* 14.4 (14, 582)* 40.4 (12, 712)* 9.0 (16, 1013)* 9.1 (14, 708)* 12.2 (16, 975)*
W x Y 3.9 (4, 564)* 2.2 (4, 586)† 1.2 (4, 582) 2.1 (4, 710)† 1.4 (4, 1011) 2.1 (4, 708) † 0.89 (4, 979)
S x W x Y 1.5 (28, 565) † -- -- -- -- -- 1.6 (32, 975) *
S species, W warming, Y year. †and * indicate P < 0.10 and 0.05, respectively. The first degrees of freedom (df) value is numerator df and
second value is denominator df.
Note: For population level variables, the results were unchanged when the order of effects was species, year, and warming.

78
Table 3-5. Eigenvectors of variables used for the principal components analysis.
Variable Axis 1 Axis 2
FFD 0.56 0.11
Peak flowering date 0.47 0.32
Length of flowering
season
-0.34 0.41
Bud date 0.45 0.39
Flower date 0.33 -0.40
Flowering duration -0.18 0.64

79
Figure 3-1. Difference in peak flowering date in warmed subplots compared to ambient
subplots for each species. Black bars denote difference in high warming subplots and
light gray bars denote difference in low warming subplots. Koeleria, Solidago, and
Sorghastrum were excluded from the analysis. * indicates significant difference (P<0.5,
post-hoc Tukey’s HSD test after ANOVA) of at least one warming treatment from
ambient. † indicates trend (P<0.10) that at least one warming treatment was different
from ambient.

80
Figure 3-2. Axes 1 and 2 of principle components analysis on the warming responses of
several species in six reproductive phenological variables. Shape of marker indicates
year ( ♦ 2009, ● 2010, ▲ 2011). Color denotes species and functional groups: blues
and purples are legumes, reds are C4 grasses, yellows are C3 grasses, and greens are forbs.
Yearly values for each species are connected by lines.

81
Figure 3-3. Normalized difference vegetation index (NDVI) values over the 2011
growing season for 16-species (a) and 4-species (b) plots. Month names placed at middle
of the month. * indicates high warming NDVI was significantly (P<0.05 post-hoc
Tukey’s HSD test after ANOVA) different from ambient. Error bars denote ±SE.

82
Supplemental Information
Table S3-1. Mean values of population level reproductive variables by species and year.
Values in parentheses indicate standard error. Dates are given as Julian Day. Values in
bold indicate significant differences between at least two years (P<0.0065, least square
mean differences after ANOVA).
Species Year FFD
Peak flowering
date
Length of flowering
season (wk)
Amorpha 2009 191.3 (1.1) 196.6 (0.9) 2.71 (0.23)
2010 188.1 (1.7) 192.3 (1.8) 2.11 (0.18)
2011 189.7 (1.2) 192.0 (0.9) 1.88 (0.20)
Andropogon 2009 208.7 (0.9) 217.3 (0.7) 3.48 (0.19)
2010 195.2 (1.1) 211.9 (1.5) 4.88 (0.16)
2011 203.2 (0.4) 218.0 (1.3) 6.69 (0.21)
Dalea 2009 198.0 (1.3) 205.7 (1.2) 3.36 (0.23)
2010 198.5 (1.5) 201.3 (1.5) 1.95 (0.21)
2011 198.7 (1.0) 203.8 (0.4) 2.75 (0.15)
Koeleria* 2009 162.6 (1.4) 165.7 (1.2) 1.89 (0.23)
2010 160.1 (1.1) 163.0 (1.2) 1.80 (0.25)
2011 167.5 (1.0) 169.2 (0.8) 1.29 (0.13)
Lespedeza 2009 219.4 (1.6) 224.0 (1.2) 2.38 (0.14)
2010 213.4 (1.2) 217.8 (1.2) 1.97 (0.14)
2011 214.3 (1.3) 224.0 (0.8) 3.19 (0.26)
Liatris 2009 242.9 (2.4) 249.2 (2.5) 2.35 (0.31)
2010 236.2 (2.6) 249.1 (2.5) 3.84 (0.29)
2011 246.3 (1.6) 254.4 (1.4) 3.18 (0.27)
Lupinus 2009 140.2 (0.6) 152.5 (0.4) 4.91 (0.08)
2010 133.2 (0.9) 142.8 (0.9) 4.21 (0.19)
2011 144.7 (0.8) 154.4 (0.7) 4.21 (0.16)
Poa 2009 149.2 (0.6) 161.7 (1.0) 3.39 (0.18)
2010 144.7 (0.5) 151.8 (0.5) 3.12 (0.16)
2011 153.7 (0.5) 156.1 (0.3) 2.09 (0.16)
Schizachyrium 2009 230.5 (1.4) 242.3 (1.6) 3.19 (0.30)
2010 209.3 (1.2) 222.5 (1.2) 3.03 (0.14)
2011 216.1 (0.8) 222.5 (1.2) 3.71 (0.17)
Solidago* 2010 229.5 (1.4) 235.5 (1.5) 2.64 (0.27)
2011 230.3 (1.5) 240.9 (1.6) 3.52 (0.31)
* Species not included in statistical analysis

83
Table S3-2. Mean values of individual level reproductive phenological variables by
species and year. Values in parentheses indicate standard error. Dates are given as Julian
Day. Values in bold indicate significant differences between at least two years
(P<0.0056, least square mean differences after ANOVA).
Species Year Bud Date Flower Date
Flowering
duration (wk)
Amorpha 2009 172.5 (1.6) 196.8 (1.4) 1.82 (0.14)
2010 154.3 (2.5) 194.4 (1.9) 1.29 (0.09)
2011 165.8 (1.1) 190.6 (1.0) 1.55 (0.11)
Andropogon 2009 208.2 (1.7) 221.6 (1.3) 1.33 (0.13)
2010 197.2 (1.9) 213.2 (1.9) 1.67 (0.11)
2011 190.8 (1.2) 211.8 (1.3) 2.33 (0.13)
Dalea 2009 178.3 (0.7) 204.6 (1.1) 1.82 (0.10)
2010 169.4 (2.0) 204.7 (2.0) 1.32 (0.11)
2011 176.3 (0.8) 200.4 (0.7) 1.88 (0.09)
Koeleria 2009 140.0 165.5 (0.7) 1.85 (0.15)
2010 138.3 (2.8) 160.1 (1.1) 1.70 (0.26)
2011 149.4 (1.2) 169.4 (0.7) 1.06 (0.06)
Lespedeza 2009 200.5 (1.0) 228.5 (1.3) 1.79 (0.19)
2010 167.4 (1.6) 220.2 (0.9) --
2011 170.8 (1.2) 221.4 (1.1) 1.80 (0.11)
Liatris 2009 208.6 (3.2) 247.4 (1.9) 2.39 (0.22)
2010 178.3 (1.9) 236.9 (2.7) 4.09 (0.31)
2011 185.6 (1.3) 246.5 (1.5) 2.70 (0.21)
Lupinus 2009 132.5 (0.8) 149.2 (0.7) 2.24 (0.09)
2010 123.1 (1.1) 141.5 (0.8) 1.5 (0.10)
2011 140.0 (0.8) 150.0 (0.6) 2.18 (0.11)
Poa 2009 137.1 (1.5) 154.3 (1.6) 1.6 (0.22)
2010 133.9 (1.0) 151.2 (1.7) 1.53 (0.14)
2011 137.0 (1.5) 156.6 (0.4) 1.07 (0.07)
Schizachyrium 2009 229.3 (1.1) 236.0 (1.1) 1.42 (0.16)
2010 202.3 (1.1) 219.8 (1.2) 1.58 (0.10)
2011 -- 220.1 (1.1) 1.67 (0.10)
Solidago* 2010 204.8 (1.9) 229.4 (1.3) 2.82 (0.30)
2011 -- 232.1 (1.2) 2.73 (0.11)
* Species not included in statistical analysis

84
Conclusion
Global climate is changing and how these changes affect plants and the
ecosystems where they are found is an active ecological question. The overall goal of
this dissertation was to evaluate the consequences of elevated temperature on prairie
plants, focusing on legumes and their traits related to nitrogen (N) cycling. Legumes can
have significant impacts in N-limited prairie systems as they increase N availability by
adding newly fixed N and stimulating net N mineralization. Thus, understanding how
elevated temperature affects these legumes and their traits will be important to understand
potential changes to the N-cycle in these systems.
I used both a growth chamber experiment and a manipulative field warming
experiment to investigate the effects of elevated temperature on the growth, N nutrition,
and phenology of multiple life history stages for four legume species that are common to
Minnesota grasslands. In general, these legumes responded to elevated temperature for
many of the variables that were measured, but the responses were often species-specific
and depended on the trait. In the growth chamber experiment, seedlings of Lespedeza
exhibited beneficial effects of elevated temperature, with higher biomass and shoot N
content at 28°C than 25°C. Lupinus seedlings, however, showed detrimental effects of
elevated temperature, with decreased nodulation and lower shoot [N] at the higher
temperature. In the field warming study, Dalea and Lupinus displayed higher biomass
under warming, and all species exhibited lower shoot N concentrations under warming.
Experimental warming did not affect mineralization or N2-fixation in the field.
85
Differences in responses between the growth chamber and field experiments may
indicate different responses between seedlings and adult plants. Differences between the
two studies could also be due to the indirect effects and species interactions that occur in
the field but not the growth chamber. Results from both studies suggest that legume-
mediated effects of warming on the N-cycle are likely to be caused more by changes to
legume abundance and tissue N chemistry than by changes to N2-fixation. Additionally,
warming accelerated the flowering of several species, including Amorpha and Dalea, in
the field. Thus, prairie legumes have the ability to acclimate and adjust to increases in
temperature, but their responses may alter their traits and these changes are likely to
feedback to affect carbon and N cycling, plant community structure, and trophic
interactions.
Last, another key finding was the large interannual variation in many of the
responses to warming in the field. Measurements of soil moisture, net N mineralization,
legume biomass, shoot [N], reliance on fixation, and timing of flowering all exhibited
significant differences among years indicating that these variables are responsive to
changes in climate. The responses of soil moisture, biomass, shoot [N], and reproductive
phenology to warming also showed significant interannual variation. This highlights the
need for multi-year climate change experiments, especially since significant effects of
elevated temperature will arise over time as responses accumulate and interact.

86
Bibliography
Abramoff, M. D., P. J. Magelhaes, and S. J. Ram. 2004. Image processing with ImageJ.
Biophotonics International 11:36-42.
Allison, S. D. and K. K. Treseder. 2008. Warming and drying suppress microbial activity
and carbon cycling in boreal forest soils. . Global Change Biology 14:2898-2909.
Allos, H. F. and W. V. Bartholomew. 1955. Effect of Available Nitrogen on Symbiotic
Fixation. Soil Science Society of America Journal 19:182-184.
An, Y. A., S. Q. Wan, X. H. Zhou, A. A. Subedar, L. L. Wallace, and Y. Q. Luo. 2005.
Plant nitrogen concentration, use efficiency, and contents in a tallgrass prairie
ecosystem under experimental warming. Global Change Biology 11:1733-1744.
Aranjuelo, I., J. J. Irigoyen, and M. Sanchez-Diaz. 2007. Effect of elevated temperature
and water availability on CO2 exchange and nitrogen fixation of nodulated alfalfa
plants. Environmental and Experimental Botany 59:99-108.
Arft, A. M., M. D. Walker, J. Gurevitch, J. M. Alatalo, M. S. Bret-Harte, M. Dale, M.
Diemer, F. Gugerli, G. H. R. Henry, M. H. Jones, R. D. Hollister, I. S. Jonsdottir,
K. Laine, E. Levesque, G. M. Marion, U. Molau, P. Molgaard, U. Nordenhall, V.
Raszhivin, C. H. Robinson, G. Starr, A. Stenstrom, M. Stenstrom, O. Totland, P.
L. Turner, L. J. Walker, P. J. Webber, J. M. Welker, and P. A. Wookey. 1999.
Responses of tundra plants to experimental warming: Meta-analysis of the
international tundra experiment. Ecological Monographs 69:491-511.
Barrios, S., N. Raggio, and M. Raggio. 1963. Effect of temperature on infection of
isolated bean roots by rhizobia. Plant Physiology 38:171-174.
Bassirirad, H. 2000. Kinetics of nutrient uptake by roots: responses to global change.
New Phytologist 147:155-169.
Boddey, R. M., M. B. Peoples, B. Palmer, and P. J. Dart. 2000. Use of the 15
N natural
abundance technique to quantify biological nitrogen fixation by woody perennials.
Nutrient Cycling in Agroecosystems 57:235-270.
Bradley, N. L., A. C. Leopold, J. Ross, and W. Huffaker. 1999. Phenological changes
reflect climate change in Wisconsin. Proceedings of the National Academy of
Sciences of the United States of America 96:9701-9704.
Carlsson, G., C. Palmborg, A. Jumpponen, M. Scherer-Lorenzen, P. Hogberg, and K.
Huss-Danell. 2009. N(2) fixation in three perennial Trifolium species in
experimental grasslands of varied plant species richness and composition. Plant
Ecology 205:87-104.
Cheng, X. L., Y. Q. Luo, B. Su, X. H. Zhou, S. L. Niu, R. Sherry, E. S. Weng, and Q. F.
Zhang. 2010. Experimental warming and clipping altered litter carbon and
nitrogen dynamics in a tallgrass prairie. Agriculture Ecosystems & Environment
138:206-213.
Clarkson, D. F., M. J. Hopper, and L. H. P. Jones. 1986. The effect of root temperature
on the uptake of nitrogen and the relative size of the root system in Lolium
perenne. I. Solutions containing both NH4+ and NO3
-. Plant, Cell and
Environment 9:535-545.

87
Cleland, E. E., N. R. Chiariello, S. R. Loarie, H. A. Mooney, and C. B. Field. 2006.
Diverse responses of phenology to global changes in a grassland ecosystem.
Proceedings of the National Academy of Sciences of the United States of America
103:13740-13744.
Cleveland, C. C., A. R. Townsend, D. S. Schimel, H. Fisher, R. W. Howarth, L. O. Hedin,
S. S. Perakis, E. F. Latty, J. C. Von Fischer, A. Elseroad, and M. F. Wasson. 1999.
Global patterns of terrestrial biological nitrogen (N-2) fixation in natural
ecosystems. Global Biogeochemical Cycles 13:623-645.
Cornwell, W. K., J. H. C. Cornelissen, K. Amatangelo, E. Dorrepaal, V. T. Eviner, O.
Godoy, S. E. Hobbie, B. Hoorens, H. Kurokawa, N. Perez-Harguindeguy, H. M.
Quested, L. S. Santiago, D. A. Wardle, I. J. Wright, R. Aerts, S. D. Allison, P. van
Bodegom, V. Brovkin, A. Chatain, T. V. Callaghan, S. Diaz, E. Garnier, D. E.
Gurvich, E. Kazakou, J. A. Klein, J. Read, P. B. Reich, N. A. Soudzilovskaia, M.
V. Vaieretti, and M. Westoby. 2008. Plant species traits are the predominant
control on litter decomposition rates within biomes worldwide. Ecology Letters
11:1065-1071.
Craine, J. M. and R. D. Jackson. 2010. Plant nitrogen and phosphorus limitation in 98
North American grassland soils. Plant and Soil 334:73-84.
Craine, J. M., D. Tilman, D. Wedin, P. Reich, M. Tjoelker, and J. Knops. 2002.
Functional traits, productivity and effects on nitrogen cycling of 33 grassland
species. Functional Ecology 16:563-574.
Davis, C. C., C. G. Willis, R. B. Primack, and A. J. Miller-Rushing. 2010. The
importance of phylogeny to the study of phenological response to global climate
change. Philosophical Transactions of the Royal Society B-Biological Sciences
365:3201-3213.
De Boeck, H. J., C. Lemmens, H. Bossuyt, S. Malchair, M. Carnol, R. Merckx, I. Nijs,
and R. Ceulemans. 2006. How do climate warming and plant species richness
affect water use in experimental grasslands? Plant and Soil 288:249-261.
De Boeck, H. J., C. Lemmens, C. Zavalloni, B. Gielen, S. Malchair, M. Carnol, R.
Merckx, J. Van den Berge, R. Ceulemans, and I. Nijs. 2008. Biomass production
in experimental grasslands of different species richness during three years of
climate warming. Biogeosciences 5:585-594.
Diaz, S. and M. Cabido. 1997. Plant functional types and ecosystem function in relation
to global change. Journal of Vegetation Science 8:463-474.
Dijkstra, F. A., D. Blumenthal, J. A. Morgan, E. Pendall, Y. Carrillo, and R. F. Follett.
2010. Contrasting effects of elevated CO2 and warming on nitrogen cycling in a
semiarid grassland. New Phytologist 187:426-437.
Doane, T. A. and W. R. Horwath. 2003. Spectrophotometric determination of nitrate with
a single reagent. Analytical Letters 36:2713-2722.
Dukes, J. S., N. R. Chiariello, E. E. Cleland, L. A. Moore, M. R. Shaw, S. Thayer, T.
Tobeck, H. A. Mooney, and C. B. Field. 2005. Responses of grassland production
to single and multiple global environmental changes. Plos Biology 3:1829-1837.

88
Dunne, J. A., J. Harte, and K. J. Taylor. 2003. Subalpine meadow flowering phenology
responses to climate change: integrating experimental and gradient methods.
Ecological Monographs 73:69-86.
Eviner, V. T. and F. S. Chapin. 2003. Functional matrix: A conceptual framework for
predicting multiple plant effects on ecosystem processes. Annual Review of
Ecology Evolution and Systematics 34:455-485.
Fargione, J., D. Tilman, R. Dybzinski, J. HilleRisLambers, C. Clark, W. S. Harpole, J. M.
H. Knops, P. B. Reich, and M. Loreau. 2007. From selection to complementarity:
shifts in the causes of biodiversity-productivity relationships in a long-term
biodiversity experiment. Proceedings of the Royal Society B-Biological Sciences
274:871-876.
Fargione, J. E., T. R. Cooper, D. J. Flaspohler, J. Hill, C. Lehman, T. McCoy, S. McLeod,
E. J. Nelson, K. S. Oberhauser, and D. Tilman. 2009. Bioenergy and Wildlife:
Threats and Opportunities for Grassland Conservation. Bioscience 59:767-777.
Finzi, A. C., A. T. Austin, E. E. Cleland, S. D. Frey, B. Z. Houlton, and M. D.
Wallenstein. 2011. Responses and feedbacks of coupled biogeochemical cycles to
climate change: examples from terrestrial ecosystems. Frontiers in Ecology and
the Environment 9:61-67.
Fitter, A. H. and R. S. R. Fitter. 2002. Rapid changes in flowering time in British plants.
Science 296:1689-1691.
Fornara, D. A. and D. Tilman. 2008. Plant functional composition influences rates of soil
carbon and nitrogen accumulation. Journal of Ecology 96:314-322.
Fornara, D. A. and D. Tilman. 2009. Ecological mechanisms associated with the positive
diversity-productivity relationship in an N-limited grassland. Ecology 90:408-418.
Fornara, D. A., D. Tilman, and S. E. Hobbie. 2009. Linkages between plant functional
composition, fine root processes and potential soil N mineralization rates. Journal
of Ecology 97:48-56.
Forrest, J., D. W. Inouye, and J. D. Thomson. 2010. Flowering phenology in subalpine
meadows: Does climate variation influence community co-flowering patterns?
Ecology 91:431-440.
Franco, A. A. and D. N. Munns. 1982. Nodulation and growth of Phaseolus-vulgaris in
solution culture. Plant and Soil 66:149-160.
Fritschi, F. B., K. J. Boote, L. E. Sollenberger, and L. H. J. Allen. 1999. Carbon dioxide
and temperature effects on forage establishment: tissue composition and nutritive
value. Global Change Biology 5:743-753.
Garten, C. T., A. T. Classen, R. J. Norby, D. J. Brice, J. F. Weltzin, and L. Souza. 2008.
Role of N2-fixation in constructed old-field communities under different regimes
of [CO2], temperature, and water availability. Ecosystems 11:125-137.
Graham, P. H. 2005. Practices and issues in the inoculation of prairie legumes used in
revegetation and restoration. Ecological Research 23:187-195.
Gutschick, V. P. 1981. Evolved strategies in nitrogen acquisition by plants. The
American Naturalist 118:607-637.
Handley, L. L. and J. A. Raven. 1992. The use of natural abundance of nitrogen isotopes
in plant physiology and ecology. Plant, Cell and Environment 15:965-985.

89
Harding, S. C. and J. E. Sheehy. 1980. Influence of shoot and root temperature on leaf
growth, photosynthesis and nitrogen-fixation of lucerne. Annals of Botany
45:229-233.
Harte, J., M. S. Torn, F.-R. Chang, B. Feifarek, A. P. Kinzig, R. Shaw, and K. Shen. 1995.
Global warming and soil microclimate: results from a meadow-warming
experiment. Ecological Applications 5:132-150.
Hartwig, U. A. 1998. The regulation of symbiotic N2 fixation: a conceptual model of N
feedback from the ecosystem to the gene expression level. . Perspectives in Plant
Ecology, Evolution, and Systematics 1:92-120.
Hatch, D. J. and J. H. Macduff. 1991. Concurrent rates of N2 fixation, nitrate and
ammonium uptake by white clover in response to growth at different root
temperatures. Annals of Botany 67:265-274.
Henebry, G. M. 2003. Grasslands of the North American Great Plains. Pages 157-174 in
M. D. Schwartz, editor. Phenology: An integrative environmental science.
Kluwer Academic Publishers, Dordrecht.
Hobbie, S. E. 1992. Effects of plant species on nutrient cycling. Trends in Ecology &
Evolution 7:336-339.
Holdridge, L. R. 1947. Determination of world plant formations from simple climate data.
Science 105:367-368.
Hooper, D. U., F. S. Chapin, J. J. Ewel, A. Hector, P. Inchausti, S. Lavorel, J. H. Lawton,
D. M. Lodge, M. Loreau, S. Naeem, B. Schmid, H. Setala, A. J. Symstad, J.
Vandermeer, and D. A. Wardle. 2005. Effects of biodiversity on ecosystem
functioning: A consensus of current knowledge. Ecological Monographs 75:3-35.
Houlton, B. Z., Y. P. Wang, P. M. Vitousek, and C. B. Field. 2008. A unifying
framework for dinitrogen fixation in the terrestrial biosphere. Nature 454:327-
U334.
Hungate, B. A., J. S. Dukes, M. R. Shaw, Y. Q. Luo, and C. B. Field. 2003. Nitrogen and
climate change. Science 302:1512-1513.
Hungria, M. and A. A. Franco. 1993. Effects of high temperature on nodulation and
nitrogen fixation by Phaseolus vulgaris L. . Plant and Soil 149:95-102.
Hutchison, J. S. and H. A. L. Henry. 2010. Additive Effects of Warming and Increased
Nitrogen Deposition in a Temperate Old Field: Plant Productivity and the
Importance of Winter. Ecosystems 13:661-672.
IPCC. 2007. Climate Change 2007: The Physical Science Basis. Contribution of
Working Group I to the Fourth Assessment Report of the Intergovernmental Panel
on Climate Change. Cambridge, UK and New York, NY, USA.
Jarrad, F. C., C. H. Wahren, R. J. Williams, and M. A. Burgman. 2008. Impacts of
experimental warming and fire on phenology of subalpine open-heath species.
Australian Journal of Botany 56:617-629.
Jeong, S. J., C. H. Ho, H. J. Gim, and M. E. Brown. 2011. Phenology shifts at start vs.
end of growing season in temperate vegetation over the Northern Hemisphere for
the period 1982-2008. Global Change Biology 17:2385-2399.
Jones, F. R. 1921. Effect of soil temperature upon the development of nodules on the
roots of certain legumes. Journal of Agricultural Research 22:17-30.

90
Kelly, A. E. and M. L. Goulden. 2008. Rapid shifts in plant distribution with recent
climate change. Proceedings of the National Academy of Sciences of the United
States of America 105:11823-11826.
Kessler, W., B. C. Boller, and J. Nosberger. 1990. Distinct influence of root and shoot
temperature on nitrogen fixation by white clover. Annals of Botany 65:341-346.
Kindscher, K. and L. L. Tieszen. 1998. Floristic and soil organic matter changes after five
and thirty-five years of native tallgrass prairie restoration. Restoration Ecology
6:181-196.
Knops, J. M. H. and D. Tilman. 2000. Dynamics of soil nitrogen and carbon
accumulation for 61 years after agricultural abandonment. Ecology 81:88-98.
Kohl, D. H. and G. Shearer. 1980. Isotopic fractionation associated with symbiotic N2
fixation and uptake of NO3- by plants. Plant Physiology 66:51-56.
Larsen, K. S., L. C. Andresen, C. Beier, S. Jonasson, K. R. Albert, P. Ambus, M. F.
Arndal, M. S. Carter, S. Christensen, M. Holmstrup, A. Ibrom, J. Kongstad, L.
van der Linden, K. Maraldo, A. Michelsen, T. N. Mikkelsen, K. Pilegaard, A.
Prieme, H. Ro-Poulsen, I. K. Schmidt, M. B. Selsted, and K. Stevnbak. 2011.
Reduced N cycling in response to elevated CO(2), warming, and drought in a
Danish heathland: Synthesizing results of the CLIMAITE project after two years
of treatments. Global Change Biology 17:1884-1899.
Larson, J. L. and E. Siemann. 1998. Legumes may be symbiont-limited during old-field
succession. American Midland Naturalist 140:90-95.
LeBauer, D. S. and K. K. Treseder. 2008. Nitrogen limitation of net primary productivity
in terrestrial ecosystems is globally distributed. Ecology 89:371-379.
Ledgard, S. F. 1989. Nutrition, moisture and rhizobial strain influence isotopic
fractionation during N2 fixation in pasture legumes. Soil Biology & Biochemistry
21:65-68.
Ledgard, S. F. and M. B. Peoples. 1988. Measurement of nitrogen fixation in the field.
Pages 351-367 in J. R. Wilson, editor. Advances in nitrogen cycling in
agricultural ecosystems. CAB International.
Lee, T. D., P. B. Reich, and M. G. Tjoelker. 2003. Legume presence increases
photosynthesis and N concentrations of co-occurring non-fixers but does not
modulate their responsiveness to carbon dioxide enrichment. Oecologia 137:22-
31.
Legros, T. and D. L. Smith. 1994. Root-zone temperature sensitivity of nitrogen-fixing
and nitrate-supplied soybean [Glycine max (L) Merr CV Maple Arror] and Lupin
(Lupinus albus L CV Ultra) plants Environmental and Experimental Botany
34:117-127.
Liancourt, P., L. A. Spence, B. Boldgiv, A. Lkhagva, B. R. Helliker, B. B. Casper, and P.
S. Petraitis. 2012. Vulnerability of the northern Mongolian steppe to climate
change: insights from flower production and phenology. Ecology 93:815-824.
Lie, T. A. 1971. Symbiotic nitrogen fixation under stress conditions. Plant and Soil
Special Vol:117-127.

91
Lie, T. A. 1981. Environmental physiology of the legume-Rhizobium symbiosis. Pages
104-134 in W. J. Broughton, editor. Nitrogen fixation Vol 1: Ecology. Clarendon
Press, Oxford.
Lilley, J. M., T. P. Bolger, M. B. Peoples, and R. M. Gifford. 2001. Nutritive value and
the nitrogen dynamics of Trifolium subterraneum and Phalaris aquatica under
warmer, high CO2 conditions. New Phytologist 150:385-395.
Linderholm, H. W. 2006. Growing season changes in the last century. Agricultural and
Forest Meteorology 137:1-14.
Lira Jr., M. d. A., A. S. T. Lima, J. R. F. Arruda, and D. L. Smith. 2005. Effect of root
temperature on nodule development of bean, lentil, and pea. Soil Biology &
Biochemistry 37:235-239.
Luo, Y. 2007. Terrestrial Carbon-cycle feedback to climate warming. Annual Review of
Ecology Evolution and Systematics 38:683-712.
Luscher, A., J. F. Soussana, and O. Huguenin-Elie. 2011. Role and Impacts of Legumes
in Grasslands for High Productivity and N Gain from Symbiotic N-2 Fixation.
Grassland Productivity and Ecosystem Services:101-107.
Macduff, J. H. and S. B. Jackson. 1991. Growth and preference for ammonium or nitrate
uptake by barley in relation to root temperature. Journal of Experimental Botany
42:521-530.
Malchair, S., H. J. De Boeck, C. Lemmens, R. Merckx, I. Nijs, R. Ceulemans, and M.
Carnol. 2010. Do climate warming and plant species richness affect potential
nitrification, basal respiration and ammonia-oxidizing bacteria in experimental
grasslands? Soil Biology & Biochemistry 42:1944-1951.
Marchand, F. L., I. Nijs, M. Heuer, S. Mertens, F. Kockelbergh, J. Y. Pontailler, I.
Impens, and L. Beyens. 2004. Climate warming postpones senescence in High
Arctic tundra. Arctic Antarctic and Alpine Research 36:390-394.
Marcus-Wyner, L. and D. W. Rains. 1982. Simultaneous measurement of NH4+
absorption and N2 fixation by Glycine max L. Plant Physiology 69:460-464.
Melillo, J. M., S. Butler, J. Johnson, J. Mohan, P. Steudler, H. Lux, E. Burrows, F.
Bowles, R. Smith, L. Scott, C. Vario, T. Hill, A. Burton, Y. M. Zhou, and J. Tang.
2011. Soil warming, carbon-nitrogen interactions, and forest carbon budgets.
Proceedings of the National Academy of Sciences of the United States of America
108:9508-9512.
Menge, D. N. L., S. A. Levin, and L. O. Hedin. 2009. Facultative versus Obligate
Nitrogen Fixation Strategies and Their Ecosystem Consequences. American
Naturalist 174:465-477.
Menzel, A., N. Estrella, and P. Fabian. 2001. Spatial and temporal variability of the
phenological seasons in Germany from 1951 to 1996. Global Change Biology
7:657-666.
Menzel, A., T. H. Sparks, N. Estrella, E. Koch, A. Aasa, R. Ahas, K. Alm-Kubler, P.
Bissolli, O. Braslavska, A. Briede, F. M. Chmielewski, Z. Crepinsek, Y. Curnel,
A. Dahl, C. Defila, A. Donnelly, Y. Filella, K. Jatcza, F. Mage, A. Mestre, O.
Nordli, J. Penuelas, P. Pirinen, V. Remisova, H. Scheifinger, M. Striz, A. Susnik,
A. J. H. Van Vliet, F. E. Wielgolaski, S. Zach, and A. Zust. 2006. European

92
phenological response to climate change matches the warming pattern. Global
Change Biology 12:1969-1976.
Meyer, D. R. and A. J. Anderson. 1959. Temperature and symbiotic nitrogen fixation.
Nature 183:61.
Miller-Rushing, A. J. and R. B. Primack. 2008. Global warming and flowering times in
Thoreau's concord: A community perspective. Ecology 89:332-341.
Montanez, A., S. K. A. Danso, and G. Hardarson. 1995. The effect of temperature on
nodulation and nitrogen-fixation by 5 Bradyrhizobium japonicum strains. Applied
Soil Ecology 2:165-174.
Mulder, C. P. H., A. Jumpponen, P. Hogberg, and K. Huss-Danell. 2002. How plant
diversity and legumes affect nitrogen dynamics in experimental grassland
communities. Oecologia 133:412-421.
Myneni, R. B., C. D. Keeling, C. J. Tucker, G. Asrar, and R. R. Nemani. 1997. Increased
plant growth in the northern high latitudes from 1981 to 1991. Nature 386:698-
702.
Niu, S. L., R. A. Sherry, X. H. Zhou, S. Q. Wan, and Y. Q. Luo. 2010. Nitrogen
regulation of the climate-carbon feedback: evidence from a long-term global
change experiment. Ecology 91:3261-3273.
Oelmann, Y., N. Buchmann, G. Gleixner, M. Habekost, C. Roscher, S. Rosenkranz, E. D.
Schulze, S. Steinbeiss, V. M. Temperton, A. Weigelt, W. W. Weisser, and W.
Wilcke. 2011. Plant diversity effects on aboveground and belowground N pools in
temperate grassland ecosystems: Development in the first 5 years after
establishment. Global Biogeochemical Cycles 25:GB2014, doi:
2010.1029/2010GB003869.
Parmesan, C. 2007. Influences of species, latitudes and methodologies on estimates of
phenological response to global warming. Global Change Biology 13:1860-1872.
Peñuelas, J. and I. Filella. 2001. Responses to a warming world. Science 294:793-795.
Penuelas, J., I. Filella, and P. Comas. 2002. Changed plant and animal life cycles from
1952 to 2000 in the Mediterranean region. Global Change Biology 8:531-544.
Penuelas, J., I. Filella, X. Zhang, L. Llorens, R. Ogaya, F. Lloret, P. Comas, M. Estiarte,
and J. Terradas. 2004. Complex spatiotemporal phenological shifts as a response
to rainfall changes. New Phytologist 161:837-846.
Pettorelli, N., J. O. Vik, A. Mysterud, J. M. Gaillard, C. J. Tucker, and N. C. Stenseth.
2005. Using the satellite-derived NDVI to assess ecological responses to
environmental change. Trends in Ecology & Evolution 20:503-510.
Pieper, R. D. 2005. Grasslands of central North America. Pages 221-263 in J. M. Suttie,
S. G. Reynolds, and C. Batello, editors. Grasslands of the World. FAO, Rome.
Piha, M. I. and D. N. Munns. 1987. Sensitivity of the common bean (Phaseolus vulgaris
L.) symbiosis to high soil temperature. Plant and Soil 98:183-194.
Piper, J. K., E. S. Schmidt, and A. J. Janzen. 2007. Effects of species richness on resident
and target species components in a prairie restoration. Restoration Ecology
15:189-198.

93
Plies-Balzer, E., T. Kong, S. Schubert, and K. Mengel. 1995. Effect of water stress on
plant growth, nitrogenase activity and nitrogen economy of 4 diffrent cultivars of
Vicia faba L. . European Journal of Agronomy 4:167-173.
Primack, D., C. Imbres, R. B. Primack, A. J. Miller-Rushing, and P. Del Tredici. 2004.
Herbarium specimens demonstrate earlier flowering times in response to warming
in Boston. American Journal of Botany 91:1260-1264.
Purwantari, N. D., R. A. Date, and P. J. Dart. 1995. Nodulation and N2 fixation by
Calliandra calothyrsus and Sesbania sesban grown at different root temperatures.
Soil Biology & Biochemistry 27:421-425.
Reed, S. C., C. C. Cleveland, and A. R. Townsend. 2011. Functional ecology of free-
living nitrogen fixation: a contemporary perspecitve. Annual Review of Ecology,
Evolution, and Systematics 42:489-512.
Rollinson, C. R. and M. W. Kaye. 2012. Experimental warming alters spring phenology
of certain plant functional groups in an early-successional forest community.
Global Change Biology 18:1108-1116.
Roscher, C., S. Thein, A. Weigelt, V. M. Temperton, N. Buchmann, and E. D. Schulze.
2011. N(2) fixation and performance of 12 legume species in a 6-year grassland
biodiversity experiment. Plant and Soil 341:333-348.
Rustad, L. E., J. L. Campbell, G. M. Marion, R. J. Norby, M. J. Mitchell, A. E. Hartley, J.
H. C. Cornelissen, and J. Gurevitch. 2001. A meta-analysis of the response of soil
respiration, net nitrogen mineralization, and aboveground plant growth to
experimental ecosystem warming. Oecologia 126:543-562.
Ryle, G. J. A., C. E. Powell, and A. J. Gordon. 1979. The respiratory costs of nitrogen
fixation in soyabean, cowpea, and white clover. Journal of Experimental Botany
30:145-153.
Samson, F. and F. Knopf. 1994. Prairie conservation in North America. Bioscience
44:418-421.
Schimel, J. P. and J. Bennett. 2004. Nitrogen mineralization: challenges of a changing
paradigm. Ecology 85:591-602.
Schmidt, I. K., S. Jonasson, G. R. Shaver, A. Michelsen, and A. Nordin. 2002.
Mineralization and distribution of nutrients in plants and microbes in four arctic
ecosystems: responses to warming. Plant and Soil 242:93-106.
Seastedt, T. R., J. M. Briggs, and D. J. Gibson. 1991. Controls of nitrogen limitation in
tallgrass prairie. Oecologia 87:72-79.
Serraj, R., T. R. Sinclair, and L. C. Purcell. 1999. Symbiotic N-2 fixation response to
drought. Journal of Experimental Botany 50:143-155.
Shaver, G. R., J. Canadell, F. S. Chapin III, J. Gurevitch, J. Harte, G. Henry, P. Ineson, S.
Jonasson, J. Melillo, L. Pitelka, and L. Rustad. 2000. Global warming and
terrestrial ecosystems: a conceptual framework for analysis. Bioscience 50:871-
882.
Shaw, M. R. and J. Harte. 2001. Response of nitrogen cycling to simulated climate
change: differential responses along a subalpine ecotone. Global Change Biology
7:193-210.

94
Shearer, G. and D. H. Kohl. 1986. N2-fixation in field settings: estimations based on
natural 15
N abundance. Australian Journal of Plant Physiology 13:699-756.
Shearer, G. and D. H. Kohl. 1989. Estimates of N2 Fixation in Ecosystems: The Need for
and Basis of the 15
N Natural Abundance Method. Pages 342-374 in P. W. Rundel,
J. R. Ehleringer, and K. A. Nagy, editors. Stable Isotopes in Ecological Research.
Springer-Verlag, New York.
Shearer, G. and D. H. Kohl. 1991. The 15
N natural abundance method for measuring
biological nitrogen fixation: practicalities and possibilities. Pages 103-115 Stable
Isotopes in Plant Nutrition, Soil Fertility, and Environmental Studies.
International Atomic Energy Agency, Vienna.
Sherry, R. A., E. S. Weng, J. A. Arnone, D. W. Johnson, D. S. Schimel, P. S. Verburg, L.
L. Wallace, and Y. Q. Luo. 2008. Lagged effects of experimental warming and
doubled precipitation on annual and seasonal aboveground biomass production in
a tallgrass prairie. Global Change Biology 14:2923-2936.
Sherry, R. A., X. H. Zhou, S. L. Gu, J. A. Arnone, D. S. Schimel, P. S. Verburg, L. L.
Wallace, and Y. Q. Luo. 2007. Divergence of reproductive phenology under
climate warming. Proceedings of the National Academy of Sciences of the United
States of America 104:198-202.
Sokolov, A. P., D. W. Kicklighter, J. M. Melillo, B. S. Felzer, C. A. Schlosser, and T. W.
Cronin. 2008. Consequences of considering carbon-nitrogen interactions on the
feedbacks between climate and the terrestrial carbon cycle. Journal of Climate
21:3776-3796.
Sprent, J. 2001. Nodulation in Legumes. Royal Botanic Gardens, Kew.
Sprent, J. I. 1972. The effects of water stress on nitrogen-fixing root nodules: iv. effects
on whole plants of Vicia faba and Glycine max. New Phytologist 71:603-611.
Sprent, J. I. and P. Sprent. 1990. Nitrogen fixing organisms: pure and applied aspects.
Chapman and Hall, London.
Stark, J. M. and S. C. Hart. 1996. Diffusion technique for preparing salt solutions,
Kjeldahl digests, and persulfate digests for nitrogen-15 analysis. Soil Science
Society of America Journal 60:1846-1855.
Stephan, K. and K. Kavanagh. 2009. Suitability of the diffusion method for natural
abundance nitrogen-15 analysis. Soil Science Society of America Journal 73:293-
302.
Suding, K. N., S. Lavorel, F. S. Chapin, J. H. C. Cornelissen, S. Diaz, E. Garnier, D.
Goldberg, D. U. Hooper, S. T. Jackson, and M. L. Navas. 2008. Scaling
environmental change through the community-level: a trait-based response-and-
effect framework for plants. Global Change Biology 14:1125-1140.
Temperton, V. M., P. N. Mwangi, M. Scherer-Lorenzen, B. Schmid, and N. Buchmann.
2007. Positive interactions between nitrogen-fixing legumes and four different
neighbouring species in a biodiversity experiment. Oecologia 151:190-205.
Thornton, P. E., S. C. Doney, K. Lindsay, J. K. Moore, N. Mahowald, J. T. Randerson, I.
Fung, J. F. Lamarque, J. J. Feddema, and Y. H. Lee. 2009. Carbon-nitrogen
interactions regulate climate-carbon cycle feedbacks: results from an atmosphere-
ocean general circulation model. Biogeosciences 6:2099-2120.

95
Tilman, D. 1987. Secondary succession and the pattern of plant dominance along
experimental nitrogen gradients. Ecological Monographs 57:189-214.
Tilman, D., P. B. Reich, J. Knops, D. Wedin, T. Mielke, and C. Lehman. 2001. Diversity
and productivity in a long-term grassland experiment. Science 294:843-845.
Tilman, G. D. 1984. Plant dominance along an experimental nutrient gradient. Ecology
65:1445-1453.
Tlusty, B., J. M. Grossman, and P. H. Graham. 2004. Selection of rhizobia for prairie
legumes used in restoration and reconstruction programs in Minnesota. Canadian
Journal of Microbiology 50:977-983.
Tlusty, B., P. van Berkum, and P. H. Graham. 2005. Characteristics of the rhizobia
associated with Dalea spp. in the Ordway, Kellogg-Weaver Dunes, and Hayden
prairies. Canadian Journal of Microbiology 51:15-23.
Tolvanen, A. and G. H. R. Henry. 2001. Responses of carbon and nitrogen concentrations
in high arctic plants to experimental warming. Canadian Journal of Botany
79:711-718.
Tooke, F. and N. H. Battey. 2010. Temperate flowering phenology. Journal of
Experimental Botany 61:2853-2862.
Unkovich, M., D. Herridge, M. Peoples, G. Cadisch, R. Boddey, K. Giller, B. Alves, and
P. Chalk. 2008. Measuring plant-associated nitrogen fixation in agricultural
systems. ACIAR Monograph No. 136. Canberra.
Verburg, P. S. J., D. W. Johnson, D. E. Schorran, L. L. Wallace, Y. Luo, and J. A.
Arnone. 2009. Impacts of an anomalously warm year on soil nitrogen availability
in experimentally manipulated intact tallgrass prairie ecosystems. Global Change
Biology 15:888-900.
Visser, M. E. and C. Both. 2005. Shifts in phenology due to global climate change: the
need for a yardstick. Proceedings of the Royal Society B-Biological Sciences
272:2561-2569.
Vitousek, P. M., K. Cassman, C. Cleveland, T. Crews, C. B. Field, N. B. Grimm, R. W.
Howarth, R. Marino, L. Martinelli, E. B. Rastetter, and J. I. Sprent. 2002.
Towards an ecological understanding of biological nitrogen fixation.
Biogeochemistry 57:1-45.
Vitousek, P. M. and C. B. Field. 1999. Ecosystem constraints to symbiotic nitrogen fixers:
a simple model and its implications. Biogeochemistry 46:179-202.
Vitousek, P. M. and L. R. Walker. 1989. Biological invasion by Myrica-Faya in Hawaii -
Plant demography, nitrogen-fixation, ecosystem effects. Ecological Monographs
59:247-265.
Walther, G.-R. 2003. Plants in warmer world. Perspectives in Plant Ecology, Evolution,
and Systematics 6:169-185.
Wan, S. Q., D. F. Hui, L. Wallace, and Y. Q. Luo. 2005. Direct and indirect effects of
experimental warming on ecosystem carbon processes in a tallgrass prairie.
Global Biogeochemical Cycles 19:GB2014, doi:2010.1029/2004GB002315.
Weatherburn, M. W. 1967. Phenol-hypochlorite reaction for determination of ammonia. .
Analytical Chemistry 39:971-974.

96
Welker, J. M., J. T. Fahnestock, P. F. Sullivan, and R. A. Chimner. 2005. Leaf mineral
nutrition of Arctic plants in response to warming and deeper snow in northern
Alaska. Oikos 109:167-177.
West, J. B., J. HilleRisLambers, T. D. Lee, S. E. Hobbie, and P. B. Reich. 2005. Legume
species identity and soil nitrogen supply determine symbiotic nitrogen-fixation
responses to elevated atmospheric [CO2]. New Phytologist 167:523-530.
Whittington, H. R., L. Deede, and J. S. Powers. 2012. Growth responses, biomass
partitioning, and nitrogen isotopes of prairie legumes in response to elevated
temperature and varying nitrogen source in a growth chamber experiment.
American Journal of Botany 99:838-846.
Wolkovich, E. M. and E. E. Cleland. 2011. The phenology of plant invasions: a
community ecology perspective. Frontiers in Ecology and the Environment 9:287-
294.
Woodmansee, R. G., I. Vallis, and J. J. Mott. 1981. Grassland Nitrogen. Pages 443-462 in
F. E. Clark and T. Rosswell, editors. Terrestrial Nitrogen Cycles.
Yoneyama, T., T. Matsumaru, K. Usui, and W. Engelaar. 2001. Discrimination of
nitrogen isotopes during absorption of ammonium and nitrate at different nitrogen
concentrations by rice (Oryza sativa L.) plants. Plant Cell and Environment
24:133-139.
Zachariassen, J. A. and J. F. Power. 1991. Growth-rate and water-use by legume species
at 3 soil temperatures. Agronomy Journal 83:408-413.
Zaehle, S., P. Friedlingstein, and A. D. Friend. 2010. Terrestrial nitrogen feedbacks may
accelerate future climate change. Geophysical Research Letters 37:L01401, doi:
01410.01029/02009GL041345
Zak, D. R., W. E. Holmes, D. C. White, A. D. Peacock, and D. Tilman. 2003. Plant
diversity, soil microbial communities, and ecosystem function: are there any
links? Ecology 84:2042-2050.
Zhou, X. H., X. Z. Liu, L. L. Wallace, and Y. Q. Luo. 2007. Photosynthetic and
respiratory acclimation to experimental warming for four species in a tallgrass
prairie ecosystem. Journal of Integrative Plant Biology 49:270-281.