dual energy x-ray absorptiometry (dxa) is the most - virginia tech
TRANSCRIPT
RELIABILITY AND VALIDITY OF BODY COMPOSITION
AND BONE MINERAL DENSITY MEASUREMENTS BY DXA
MELISSA KAREEN ZACK
Thesis submitted to the Graduate Faculty of
Virginia Polytechnic Institute and State University
in partial fulfillment of the requirements
for the degree of
Master of Science
in
Human Nutrition, Foods, and Exercise
Sharon M. Nickols-Richardson, Ph.D., R.D., Committee Chair
William G. Herbert, Ph.D.
Kathleen Poole, Ph.D.
April 4, 2002
Blacksburg, Virginia
Key words: body composition, body piercing, bone mineral density, distal tibia BMD, dual energy X-ray absorptiometry, metal artifacts, navel jewelry, QDR-4500A, reliability, validity

MELISSA KAREEN ZACK Reliability and Validity of Body Composition and Bone Mineral Density Measurements by DXA (Under the direction of SHARON M. NICKOLS-RICHARDSON) Dual energy X-ray absorptiometry (DXA) has been well established in both clinical and
research settings for measurement of bone mineral density (BMD), and is becoming more widely
utilized for assessment of body composition. Reliability and validity are essential factors in both
applications of this technique; however, neither have been confirmed for the QDR-4500A DXA
at Virginia Tech. Therefore, measurements of the whole body (WB), lumbar spine (LS), total
proximal femur (TPF) and total forearm (TF) were made in a group of young-adult males and
females at two time-points, 5-7 days apart. Significant differences were not found in BMD
(g/cm2) at these body sites with repeated measurements by DXA. Furthermore, measures of
percent body fat (%BF), lean body mass (LBM), and fat mass (FM) by DXA were reliable.
Validity of %BF by DXA was assessed from comparison to single-frequency bioelectrical
impedance analysis (BIA). Significant differences were not found in measures of %BF by DXA
and BIA. A second study investigated the reliability and validity of the QDR-4500A DXA in
measurements of distal tibia (DT) BMD. Significant differences were not found between
repeated measurements. Validity was established by a significant correlation between WB BMD
and DT BMD. A third study examined the influence of navel jewelry on the accuracy of LS
DXA measurements. Repeated measurements with a spine phantom revealed that both a navel
ring and a barbell produced significantly greater measures of LS BMD compared to the spine
phantom alone. Manual correction of navel jewelry did not eliminate BMD inaccuracies. Data
from these studies confirmed that the QDR-4500A DXA at Virginia Tech was a reliable and
valid device in measurement of WB, LS, TPF, TF and DT BMD, as well as %BF, LBM, and
FM. In addition, effects of navel jewelry on LS BMD have been recognized. Further studies

investigating the reliability and validity of DT BMD measures as well as effects of different
types, gauges, and shapes of body jewelry on BMD measures in human subjects are warranted.
iii
ACKNOWLEDGEMENTS
The past two years have been a learning experience more valuable than any I have ever had. I
have learned more about myself, the nature of others, and life in general than I can ever put into
words, but they are lessons that I will carry with me through the rest of this journey. This thesis
is but one example of the numerous things that I have learned while at Virginia Tech, and I owe
its completion to a great number of people.
My greatest thanks go to my advisor, Dr. Sharon M. Nickols-Richardson, Ph.D., R.D. She
has been a wonderful teacher by example, and I will always remember her as being someone
who knows how to “work hard” as well as “play hard.” She has shown me the value of quality
and precision in my work, as opposed to quantity. I value her outlook on life that we all must
learn to laugh at ourselves and not take everything so seriously and hope to some day adopt this
viewpoint as my own. I would also like to thank the other members of my committee, Dr.
Kathleen Poole, Ph.D., and Dr. William Herbert, Ph.D., for their advice, encouragement and
support, and for their smiling faces.
On a more personal level, I owe a tremendous amount of thanks to my husband, Christopher
Zack. He has been, literally, my support system and my lifeline throughout everything. When I
have doubted myself and feared the worst, he has always been there to be my biggest fan and
make me realize that I have nothing to be afraid of in this life, that I am in control. I know that I
could never say or do enough to thank him for his never-ending love and patience, but want him
to know how very much I love him and always will.
Thanks also go to my lab-mates and friends, Jeannemarie Beiseigel, Mary Dean Coleman,
Shannon Reed, Heather Carpenter, and Vanessa Hart, to name just a few– all people whom I
iv

didn’t even know just two short years ago. I am grateful for their support, advice,
encouragement through the rough times, and for lending an ear when I needed to talk.
The wonderful office staff of the HNFE department have contributed to my thesis as well. I
want to thank Sherry Saville for answering countless questions with a bright, smiling face and
for taking care of the numerous piles of copying and scanning that I have handed to her many
times.
Finally, I ‘d like to acknowledge and thank my family for the love, support, and
encouragement that they have always showered me with throughout my life. My mom, Sue
Wood, with whom I share an “eerily” close mother/daughter bond, has always been there for me
when I needed her the most. My dad, Russ Wood, has taught me, by his own example, the value
of hard work. Although we have both come to realize over the years that the very things that get
us ahead in life can also be the demons that tie us down, we stubbornly continue along the same
path. Maybe some day we will find a better way. My sister, Angela Samuelsen, will always be
there for me like only a sister could. I admire her determination and independence, thank her for
her support, and wish her all the best. Even though they know very little of what I have spent the
last two years of my life doing here in Virginia (not because of their lack of interest, but because
of my unwillingness to share all of the details), I couldn’t have made it through without my
family and wish to thank them all from the bottom of my heart.
v

TABLE OF CONTENTS
ACKNOWLEDGEMENTS........................................................................................................ iv
LIST OF TABLES .................................................................................................................. viii
LIST OF FIGURES ..................................................................................................................... x
CHAPTER I................................................................................................................................... 1
INTRODUCTION......................................................................................................................... 1 REFERENCES ................................................................................................................................ 3
CHAPTER II ................................................................................................................................. 6
REVIEW OF LITERATURE ...................................................................................................... 6 BONE DENSITOMETRY AND OSTEOPOROSIS................................................................................... 6 HISTORY OF DUAL ENERGY X-RAY ABSORPTIOMETRY (DXA) ..................................................... 9 MEASUREMENT ISSUES OF BMD BY DXA ................................................................................. 11 BODY COMPOSITION BY DXA .................................................................................................... 17 MEASUREMENT ISSUES OF BODY COMPOSITION BY DXA........................................................... 18 BIOELECTRICAL IMPEDANCE ANALYSIS (BIA)........................................................................... 20 SUMMARY .................................................................................................................................. 23 REFERENCES .............................................................................................................................. 24
CHAPTER III.............................................................................................................................. 31
RELIABILITY AND VALIDITY OF BONE MINERAL DENSTIY AND BODY COMPOSITION MEASURES BY DXA .................................................................................. 31
ABSTRACT.................................................................................................................................. 32 INTRODUCTION........................................................................................................................... 33 MATERIALS AND METHODS ....................................................................................................... 35 RESULTS..................................................................................................................................... 37 DISCUSSION................................................................................................................................ 50 REFERENCES .............................................................................................................................. 53
CHAPTER IV.............................................................................................................................. 57
RELIABILITY AND VALIDITY OF DISTAL TIBIA MEASURES BY DXA ................... 57 ABSTRACT.................................................................................................................................. 58 INTRODUCTION........................................................................................................................... 59 MATERIALS AND METHODS ....................................................................................................... 60 RESULTS..................................................................................................................................... 62 DISCUSSION................................................................................................................................ 67 REFERENCES .............................................................................................................................. 68
CHAPTER V ............................................................................................................................... 71
INFLUENCE OF NAVEL JEWELRY ON BONE MINERAL DENSITY MEASURES OF THE LUMBAR SPINE............................................................................................................... 71
ABSTRACT.................................................................................................................................. 72
vi

INTRODUCTION........................................................................................................................... 73 MATERIALS AND METHODS ....................................................................................................... 74 RESULTS..................................................................................................................................... 76 DISCUSSION................................................................................................................................ 77 REFERENCES .............................................................................................................................. 78
CHAPTER VI.............................................................................................................................. 83
SUMMARY AND FUTURE DIRECTIONS ............................................................................ 83
APPENDIX .................................................................................................................................. 86 APPENDIX A ........................................................................................................................... 87
“DXA Reliability study” ............................................................................................... 87 Informed Consent Form ................................................................................................ 87
APPENDIX B ........................................................................................................................... 91 “DXA Reliability study” ............................................................................................... 91 Health Screening Questionnaire.................................................................................... 91
APPENDIX C ........................................................................................................................... 93 “DXA Validity study”................................................................................................... 93 Informed Consent Form ................................................................................................ 93
APPENDIX D ........................................................................................................................... 97 “DXA Validity study”................................................................................................... 97 BIA Informed Consent Form, Instructions for testing, Data Sheet............................... 97
APPENDIX E.......................................................................................................................... 102 “Tibial Reliability study” ............................................................................................ 102 Informed Consent Form .............................................................................................. 102
APPENDIX F.......................................................................................................................... 106 “Tibial Reliability study” ............................................................................................ 106 Medical History Questionnaire ................................................................................... 106
APPENDIX G ......................................................................................................................... 110 Data Sets...................................................................................................................... 110
APPENDIX H ......................................................................................................................... 114 Statistics ...................................................................................................................... 114
APPENDIX I........................................................................................................................... 116 Navel Jewelry Data ..................................................................................................... 116
APPENDIX J........................................................................................................................... 119 Sample DXA Scans..................................................................................................... 119
VITA........................................................................................................................................... 125
vii

LIST OF TABLES
CHAPTER III
I. Subject characteristics.................................................................................................................40
II. Mean bone mineral density (BMD) values (g/cm2) for all sites at time 1 and time 2 .................40
III. Correlations and coefficients of variation for repeated measurements of bone mineral density
(BMD) by dual energy X-ray absorptiometry .............................................................................41
IV. Mean percent body fat and soft tissue measurements (kg) by dual energy X-ray absorptiometry at
time 1 and time 2 ........................................................................................................................41
V. Correlations and coefficients of variation for repeated measurements of percent body fat and soft
tissue mass by dual energy X-ray absorptiometry.......................................................................42
VI. Mean percent body fat (%BF) of repeated dual energy X-ray absorptiometry measurements and
%BF by bioelectrical impedance analysis...................................................................................42
VII. Subject characteristics, mean bone mineral density (BMD) values (g/cm2), percent body fat
(%BF), and soft tissue measurements (kg) by dual energy X-ray absorptiometry at time 1 and
time 2 for male cyclists ..............................................................................................................43
VIII. Subject characteristics, mean bone mineral density (BMD) values (g/cm2), percent body fat
(%BF), and soft tissue measurements (kg) by dual energy X-ray absorptiometry at time 1 and
time 2 for male non-cyclists .......................................................................................................44
IX. Subject characteristics, mean bone mineral density (BMD) values (g/cm2), percent body fat
(%BF), and soft tissue measurements (kg) by dual energy X-ray absorptiometry at time 1 and
time 2 for female non-cyclists .....................................................................................................45
CHAPTER IV
I. Subject characteristics ..............................................................................................................64
II. Mean distal tibia bone mineral density (BMD) values (g/cm2) for all subjects at time 1 and
time 2............................................................................................................................................64
viii

III. Mean distal tibia bone mineral density (BMD) values (g/cm2) with outliers excluded at time
1 and time 2 ..................................................................................................................................64
IV. Mean distal tibia (DT) and whole body (WB) bone mineral density (BMD) values (g/cm2) for all
subjects at time 1 and time 2 ........................................................................................................65
V. Mean distal tibia (DT) and whole body (WB) bone mineral density (BMD) values (in g/cm2) with
outliers excluded at time 1 and time 2..........................................................................................65
CHAPTER V
I. Analysis of variance for navel ring comparisons ..........................................................................79
II. Analysis of variance for navel barbell comparisons......................................................................80
ix

LIST OF FIGURES
CHAPTER III
1. Correlation between repeated whole body (WB) bone mineral density (BMD) measures (g/cm2)
(N=24) ...........................................................................................................................................46
2. Bland-Altman bias plot for whole body (WB) bone mineral density (BMD)...............................46
3. Correlation between repeated lumbar spine (LS) bone mineral density (BMD) measures (g/cm2)
(N=24) ...........................................................................................................................................46
4. Bland-Altman bias plot for lumbar spine (LS) bone mineral density (BMD)...............................46
5. Correlation between repeated total proximal femur (TPF) bone mineral density (BMD) measures
(g/cm2) (N=24) ..............................................................................................................................47
6. Bland-Altman bias plot for total proximal femur (TPF) bone mineral density (BMD) ................47
7. Correlation between repeated total forearm (TF) bone mineral density (BMD) measures (g/cm2)
(N=24) ...........................................................................................................................................47
8. Bland-Altman bias plot for total forearm (TF) bone mineral density (BMD)...............................47
9. Correlation between repeated % body fat measures by dual energy X-ray absorptiometry
(N=24) ...........................................................................................................................................48
10. Bland-Altman bias plot for % body fat by dual energy X-ray absorptiometry .............................48
11. Correlation between repeated lean body mass (LBM) measures by dual energy X-ray
absorptiometry (N=24) ..................................................................................................................48
12. Bland-Altman bias plot for lean body mass (LBM) by DXA .......................................................48
13. Correlation between repeated fat mass (FM) measures by dual energy X-ray absorptiometry
(N=24) ...........................................................................................................................................49
14. Bland-Altman bias plot for fat mass (FM) by dual energy X-ray absorptiometry ........................49
15. Correlation between % body fat by dual energy X-ray absorptiometry and bioelectrical
impedance analysis (N=24) ...........................................................................................................49
x

16. Bland-Altman bias plot for % body fat by dual energy X-ray absorptiometry and bioelectrical
impedance analysis........................................................................................................................49
CHAPTER IV
1. Correlation between repeated distal tibia (TIB) bone mineral density (BMD) measures (g/cm2)
(N=23) ..........................................................................................................................................66
2. Bland-Altman bias plot for distal tibia (TIB) bone mineral density (BMD) (N=23) ....................66
3. Correlation between repeated distal tibia (TIB) bone mineral density (BMD) measures (g/cm2)
(n=17) ............................................................................................................................................66
4. Bland-Altman bias plot for distal tibia (TIB) bone mineral density (BMD) (n=17) .....................66
CHAPTER V
A. Placement 2 of navel jewelry in phantom spine scan field ..........................................................81
B. Placement 3 of navel jewelry in phantom spine scan field...........................................................81
C. Placement 4 of navel jewelry in phantom spine scan field...........................................................81
D. Placement 5 of navel jewelry in phantom spine scan field...........................................................81
xi

CHAPTER I
INTRODUCTION
Dual energy X-ray absorptiometry (DXA) is the most widely accepted method for the
quantitative assessment of bone mineral status in vivo (Gluer, 2000; Jergas et al., 1995; Lochmuller
et al., 2001; Miller et al., 1999). DXA has also been regarded as a safe, convenient, and non-
invasive method of measuring soft-tissue composition (Haarbo et al., 1991; Hansen et al., 1993;
Lukaski, 1987; Pritchard et al., 1993). However, concern and uncertainty persist that both in vivo
bone mineral density (BMD) measurements and estimation of DXA percent body fat are subject to
sizable systematic inaccuracies (Bolotin, 1998, 2001; Pocock et al., 1997; Tataranni et al., 1996;
Tothill & Avenell, 1998). Accuracy and reproducibility are key issues in both clinical and research
applications of BMD and body composition measurements (Gluer et al. 1995; Madsen et al., 1997;
Orwoll & Oviatt, 1991; Wells & Ryan, 2000). Therefore, establishing the validity of measures from
the Hologic QDR-4500A DXA machine in the Bone metabolism, Osteoporosis and Nutrition
Evaluation (BONE) Laboratory at Virginia Tech is imperative to research and applications related to
bone health.
Osteoporosis is a clinically measurable deficit in BMD affecting approximately 24 million
Americans (Ott, 1998). Osteoporosis and osteoporotic bone fractures represent a significant
health problem, and result in substantial morbidity and mortality. Approximately one-half of
individuals who are able to walk unaided before incurring a hip fracture cannot walk unassisted
afterward (Ott, 1998). Hip fractures, the most serious osteoporosis-related fractures, are
associated with reduced expected survival rates of 12% or more, with the greatest risk for
mortality occurring 3 to 4 months after the fractures (Ott, 1998). In the United States, more than
1.5 million osteoporotic fractures occur each year (Ott, 1998). Health care expenditures
1

attributable to osteoporotic fractures in 1995 were estimated at $13.8 billion (Ray et al., 1997), a
figure that is expected to rise to between $30 and $40 billion by the year 2020 (Fogelman &
Blake, 2000).
Bone densitometry is a practical tool in the clinical setting for use in diagnosing osteoporosis
and for monitoring BMD (Alhava, 1991; Miller et al., 1999). It also has potential for use in body
composition assessment, which is fundamental to the study of biological processes in animals
and humans (Pietrobelli et al., 1996; Pritchard et al., 1993). Nonetheless, gaps exist in current
knowledge concerning both of these applications (Bolotin et al., 2001; Roubenoff et al., 1993).
Both short- and long-term precision of in vivo and in vitro DXA BMD have been established.
Results for long-term precision of lumbar spine, femoral neck, and total hip BMD have been
confirmed at 1.12%; 2.21%; and 1.32%, respectively (Patel et al., 2000). However, these long-
term precision studies have not yet confirmed the reliability of the DXA at Virginia Tech in
either BMD or body composition studies. There is also a paucity of data regarding the reliability
and validity of regional measures of tibial BMD by DXA, as well as the effect of jewelry and
other metal artifacts on BMD readings and the ability of the operator to manually correct for
these potential errors.
Therefore, the purpose of this proposed research was to: (1) establish the reliability and
validity of the Hologic QDR-4500A DXA at Virginia Tech to measure body composition; (2)
establish the reliability and validity of regional tibial DXA measures, and (3) determine
measurement errors represented by metal artifacts, specifically navel jewelry, on lumbar spine
BMD measures and the ability to accurately correct for these errors. The first study showed that
the Hologic QDR-4500A DXA in the BONE Laboratory at Virginia Tech was reliable for BMD
at the whole body, lumbar spine, nondominant total proximal femur, and nondominant total
2

forearm. Additionally, percent body fat (%BF), lean body mass (LBM), and fat mass (FM)
measures by DXA were reliable. Compared to BIA, %BF measures by DXA were valid
(Chapter III). Tibial BMD measures by DXA were reliable and valid when compared to whole
body BMD measures (Chapter IV). The QDR-4500A DXA was not able to fully correct for
errors in BMD measurements of the lumbar spine due to the presence of navel jewelry in the
DXA scan (Chapter V). Lastly, future research and directions are presented in Chapter VI.
References
Alhava EM. Bone density measurements. Calcif Tissue Int. 1991;49Suppl:S21-3. Bolotin HH. Analytic and quantitative exposition of patient-specific systematic inaccuracies inherent in planar DXA-derived in vivo BMD measurements. Med Phys. 1998;25(2): 139-51. Bolotin HH, Sievanen H, Grashuis JL, Kuiper JW, JarvinenTL. Inaccuracies inherent in patient- specific dual-energy x-ray absorptiometry bone mineral density measurements: comprehensive phantom-based evaluation. J Bone Miner Res. 2001;16(2):417-26. Fogelman I, Blake GM. Different approaches to bone densitometry. J Nucl Med. 2000; 41(12):2015-25. Gluer, CC. The use of bone densitometry in clinical practice. Bailleres Best Pract Res Clin Endocrinol Metab. 2000;14(2):195-211. Gluer CC, Blake GM, LuY, Blunt BA, Jergas M, Genant HK. Accurate assessment of precision errors: how to measure the reproducibility of bone densitometry techniques. Osteoporos Int. 1995;5:262-70.
Haarbo J, Gotfredsen A, Hassager C, Christiansen C. Validation of body composition by dual energy x-ray absorptiometry (DEXA). Clin Physiol. 1991;11:331-41.
Hansen NJ, Lohman TG, Going SB, Hall MC, Pamenter RW, Bare LA, Boyden TW, Houtkooper LB. Prediction of body composition in premenopausal females from dual energy x-ray absorptiometry. J Appl Physiol. 1993;75(4):1637-41. Jergas M, Breitenseher M, Gluer CC, Yu W, Genant HK. Estimates of volumetric bone density from projectional measurements improve the discriminatory capability of dual x-ray absorptiometry. J Bone Miner Res. 1995;10(7):1101-10.
3

Lochmuller EM, Krefting N, Burklein D, Eckstein F. Effect of fixation, soft-tissues, and scan projection on bone mineral measurements with dual energy x-ray absorptiometry (DXA). Calcif Tissue Int. 2001;68(3):140-5. Lukaski HC. Methods for the assessment of human body composition: traditional and new. Am J Clin Nutr. 1987;46:537-56. Madsen OR, Jensen J-EB, Sorensen OH. Validation of a dual energy x-ray absorptiometer: measurement of bone mass and soft tissue composition. Eur J Appl Physiol. 1997;75:554-8. Miller PD, Zapalowski C, Kulak CA, Bilezikian JP. Bone densitometry: the best way to detect osteoporosis and to monitor therapy. J Clin Endocrinol Metab. 1999;84(6): 1867-71. Orwoll ES, Oviatt SK. Longitudinal precision of dual-energy x-ray absorptiometry in a multicenter study. The Nafarelin/Bone Study Group. J Bone Miner Res. 1991;6(2): 191-7. Ott K. Osteoporosis and bone densitometry. Radiol Technol. 1998;70(2):129-48. Patel R, Blake GM, Rymer J, Fogelman I. Long-term precision of DXA scanning assessed over seven years in forty postmenopausal women. Osteoporos Int. 2000;11:68-75. Pietrobelli A, Formica C, Wang Z, Heymsfield SB. Dual-energy x-ray absorptiometry body composition model: review of physical concepts. Am J Physiol. 1996;271 (Endocrinol. Metab. 34):E941-E951. Pocock NA, Noakes KA, Majerovic Y, Griffiths MR. Magnification error of femoral geometry using fan beam densitometers. Calcif Tissue Int. 1997;60:8-10. Pritchard JE, Nowson CA, Strauss BJ, Carlson JS, Kaymakci B, Wark JD. Evaluation of dual energy x-ray absorptiometry as a method of measurement of body fat. Eur J Clin Nutr. 1993;47:216-28. Ray NF, Chan JK, Thamer M, Melton LJ, III. Medical expenditures for the treatment of osteoporotic fractures in the united states in 1995: report from the national osteoporosis foundation. J Bone Miner Res. 1997;12(1):24-35. Roubenoff R, Kehayias JJ, Dawson-Hughes B, Heymsfield SB. Use of dual-energy x-ray absorptiometry in body-composition studies: not yet a “gold standard.” Am J Clin Nutr. 1993;58:589-91. Tataranni PA, Pettitt DJ, Ravussin, E. Dual energy x-ray absorptiometry: intermachine variability. Int J Obes Relat Metab Disord. 1996;20(11):1048-50.
4

Tothill P, Avenell A. Anomalies in the measurement of changes in bone mineral density of the spine by dual-energy x-ray absorptiometry. Calcif Tissue Int. 1998;63(2):126-33. Wells J, Ryan PJ. The long-term performance of DXA bone densitometers. Br J Radiol. 2000;73(871):737-9.
5

CHAPTER II
REVIEW OF LITERATURE
Assessment of bone mineral density (BMD) has become the essential diagnostic procedure
for evaluation of patients at risk for osteoporosis. Although various BMD technologies exist in
clinical practice, dual energy X-ray absorptiometry (DXA) is currently the leading bone density
technique. Interest has also been increasing in the use of DXA for the measurement of soft tissue
composition, but with questions arising as to its accuracy and reliability in comparison with other
methods, such as bioelectrical impedance analysis (BIA). In response to this increase in demand,
DXA instruments have continuously undergone technological development. With each upgrade,
issues arise regarding the compatibility with older-generation instruments and reference values
established for older DXA instruments. Aside from these developmental issues, there still
remain fundamental questions pertaining to the reliability and validity of DXA measurements.
Researchers are now expressing concerns regarding systematic inaccuracies inherent in the
technique, as well as other factors of variability.
Bone densitometry and osteoporosis
Bone densitometry has four major applications in clinical practice: quantification of bone
mass or density; assessment of fracture risk; skeletal changes, and body-composition analysis
(Ott, 1998). Measuring bone mass or density can be performed for four general reasons: to
confirm suspected bone loss visible on a standard radiograph; to diagnose osteoporosis; to record
effects of disease progression that alter bone mineral content (BMC) or density; and to monitor
effects of disease process or response to therapy over time (Ott, 1998). Bone densitometry
techniques measure the mineral content of bone either as areal density (g/cm2) or as true
volumetric density (g/cm3) (Ott, 1998). Although bone mass is not the sole component of bone
6

strength, it is an important predictor of fracture risk. Just as blood pressure and cholesterol
determinations are predictors of stroke and cardiovascular disease, so bone density predicts
fracture risk (Miller et al., 1999).
A large variety of bone densitometry and quantitative ultrasound techniques can be used for
the assessment of osteoporosis. Any method used for measuring BMD should be accurate,
precise, sensitive, inexpensive, and involve a minimal exposure to ionizing radiation. Accuracy
expresses how close the measured BMD is to the actual value. Precision assesses the
reproducibility of the measuring technique, a high precision (low coefficient of variation) being
essential in longitudinal studies of bone mass. Sensitivity is the aptitude of the technique to
separate an abnormal (fracture) population from a normal (nonfracture population), or to easily
detect changes in BMD with time and therapy. Excluding ultrasound, bone densitometry
techniques are based on attenuation principles. Bone attenuates, or absorbs, ionizing radiation.
A greater amount of bone will result in more absorption of the ionizing radiation, and therefore
less radiation will be measured by the detection device (Ott, 1998).
In the early 1990s, a Consensus Development Conference convened and produced the
definition of osteoporosis as “a systemic skeletal disease characterized by low bone mass and
microarchitectural deterioration of bone tissue, with a consequent increase in bone fragility and
susceptibility to fracture” (Blake & Fogelman, 2001, p. 69; Smith & Shoukri, 2000, p.23). In
1994, a World Health Organization (WHO) report recommended a clinical definition of
osteoporosis based on expression of BMD measurements in standard deviation (SD) units called
T-scores. The T-score is calculated by taking the difference between a patient’s measured BMD
and the mean BMD of healthy, young-adults matched for gender and ethnic group, and
expressing the difference relative to the young-adult population SD. A T-score, therefore,
7

indicates the difference between the patient’s BMD and the ideal peak bone mass achieved by a
young-adult. Osteoporosis in postmenopausal Caucasian women is defined as a value for BMD
or BMC of more than 2.5 SD below the young average value (T-score ≤ -2.5) for the whole
body, spine, hip, or forearm. An intermediate state of low bone mass (osteopenia) is defined by
a T-score between – 2.5 and –1. A T-score ≥ -1 is considered normal. Severe osteoporosis uses
the same threshold as previously defined, (T-score [ -2.5), but in the presence of one or more
fragility fractures. The rationale for these definitions arise from statistics indicating that when
measurements are made at bone sites most vulnerable to fracture (hip, spine, and wrist),
approximately 30% of postmenopausal women would have osteoporosis, according to the WHO
definition. This figure approximates the average lifetime risk of fracture for a 50-year-old
woman (Blake & Fogelman, 2001; Gluer, 2000; Kanis & Gluer, 2000).
Another useful way of expressing BMD measurements is in Z-score units. A Z-score
represents the number of SDs above or below the bone density value for an age-, weight-,
gender-, and ethnicity-matched adult population. The Z-score is a valuable concept because it
expresses the patient’s risk of sustaining an osteoporotic fracture relative to peers. Generally,
every reduction of 1 SD in BMD is associated with an approximately twofold increase in the
likelihood of fracture (Fogelman & Blake, 2000; Gluer, 2000; Ott, 1998; Ryan, 1997; Smith &
Shoukri, 2000).
The reliability of diagnostic criteria for osteoporosis in other patient groups (e.g. non-whites,
premenopausal women, and men) is not well established. Furthermore, the application of the
WHO criteria using data from bone density measurement methods other than DXA may also be
misleading. Reference data for the mean and the SD for each measurement technique are
developed by the manufacturer of each method, or in the case of DXA by large population
8

screening – from the National Health and Nutrition Examination Survey (NHANES III) – data.
Newer methods of BMD testing have not yet established extensive normative values. In
addition, the detected amount of change in bone density as a result of age, gender, ethnicity, and
disease state will vary with different methods used. Therefore, standardization and cross-
comparison of the T- and Z-scores from various bone density techniques are challenging.
Controversy exists regarding continued strict application of WHO diagnostic criteria or whether
diagnostic criteria based on each technique should be developed.
History of dual energy X-ray absorptiometry (DXA)
Early methods of bone mass measurement (cortical index, radiographic densitometry) were
rather unrefined and imprecise. The first valid technique of BMD measurement, introduced in
1963, was single photon absorptiometry (SPA) of the forearm (Adams, 1992; Maricic & Chen,
2000). A limitation of SPA was its applicability to only peripheral skeletal sites; hence, dual
photon absorptiometry (DPA) was developed for BMD measurements in the axial body. This
technique has now been replaced by DXA. From its clinical introduction in 1987, DXA has
become the gold standard for bone densitometry (Ott, 1998) because of its high image quality,
accuracy and precision, fast scanning times, and low radiation exposure (Ott, 1998). According
to a 1997 National Osteoporosis Foundation (NOF) survey, 89% of bone density tests performed
in the United States in one year used DXA (Smith & Shoukri, 2000).
There are three commercial manufacturers of DXA instruments: Hologic, Lunar, and
Norland. The fundamental principle behind DXA is the measurement of the transmission
through the body of X-rays of 2 different photon energy levels, which are absorbed differently by
mineral and soft tissue. By combining data, DXA can accurately measure bone within soft
9

tissue. Results of DXA represent a composite measure of both cortical and trabecular bone, and
are reported as an areal density in g/cm2.
The first DXA system (Hologic QDR-1000) was introduced in 1990, and contained three
main components. An X-ray generator and tube, located beneath the patient, produced a highly
collimated pencil beam, with two energies produced by alternate pulse voltage at 70 kVp and
140 kVp. A cadmium tungstate crystal detector, attached to a mobile support above the patient,
detected the transmitted X-rays. An internal calibration system was supplied by the
manufacturer (Hologic, Waltham, MA). The X-ray pencil beam swept in rectilinear directions
with a velocity of 60 mm/s for transverse scanning, which resulted in a scan time of about 10
minutes for an image of the lumbar spine. The program software allowed measurement of:
posteroanterior (AP) lumbar spine, femur, wrist, complete spinal column in pediatric patients,
femoral prosthesis, and bones of small animals (Barthe et al., 1997).
A newer Hologic DXA system, the QDR-4500A, was introduced in 1995. This second
generation DXA scanner uses multidetector DXA and functions in the same way as the QDR
1000, except that X-rays are produced by accelerating voltages of 100 kVp and 140 kVp.
Radiation in the form of a fan beam, as opposed to a pencil beam, is detected with 216 solid state
detectors aligned along a C-shaped holder, whose motion is under computer control, and which
rotates so that the source always faces this holder. The software allows for measurement of not
only the most common sites (lumbar spine, femur, and wrist), but also of whole body bone
density, lean body mass and fat mass. Lateral lumbar spine images can also be combined with
AP images to calculate BMD in g/cm3. A primary advantage of this second generation of
scanners over the first generation is the decrease in scanning times. Times are 10s, 30s, 1 min, 2
min, 3 min, and 5 min in the “turbo”, “fast array”, “array” (most commonly used), “high
10

definition”, “whole body”, and “lateral image” modes, respectively (Barthe et al., 1997). Some
disadvantages to this newer DXA system are a higher radiation exposure to both patient and
operator, as well as questionable accuracy of BMC and total body composition measurements
due to the geometric design of the fan-beam scan.
Measurement issues of BMD by DXA
When using bone densitometry for research and/or clinical practice, it is essential to
understand concepts of accuracy and precision when choosing a specific device to answer a
specific clinical question, and in interpretation of results. The accuracy of a test reflects how the
measured result deviates from the true value. However, none of the absorptiometric techniques
measure true bone density, but rather an areal bone density. Errors can be caused by factors
such as variable soft tissue composition, fat content of bone, and errors in measurement of
projected bone area, among various others. Accuracy errors, well known by DXA users, can to a
certain extent be compensated for by using valid reference materials. However, care is to be
taken when comparing results from different densitometers in longitudinal studies.
Precision is the reproducibility error between tests. Changes in BMD are generally very small
and gradual; therefore, precision of measurements is extremely important. Precision is known to
worsen with increase in age, increase in weight (for the femur), and with a reduction in density
values (Lilley et al., 1991). A traditional index for precision error is the coefficient of variation
(CV%), which is the function of the SD divided by the mean. The precision error of current
DXA systems is 1.0% for whole body, ~0.5-1% for the spine, 2.0-5.0% for the femoral neck,
depending on anatomic site analyzed (femoral neck, Ward’s triangle, trochanteric region, shaft)
(Adams, 1992; Alhava, 1991; Gluer et al., 1995), and ~0.6-1.6% for the forearm, again
dependent on the anatomic site (proximal third, mid-distal, ultra-distal) (Nieves et al., 1992).
11

There is very little current literature available regarding the precision of tibial BMD measures by
DXA; however, one group of authors has reported the precision of their measures of the
diaphysis and distal epiphysis of the tibia to be 2.1% and 1.9%, respectively (Casez et al., 1994).
The accuracy of bone mineral measurements is slightly less than the precision, and depends
on soft tissue mass and composition. Referred to as a “two component limitation”, DXA
methodology does not extend to bone sites consisting of more than two absorptiometrically
different components. The technique assumes that there are only two tissue components with
known attenuation coefficients. Regarding bone material as one component, it is then necessary
to presume that the composition and distribution of all extra- and intra-osseous soft tissues and
other body constituents present within the scan area represent an absorptiometrically
homogenous second “component.” It is clear that this assumption is not valid in the human
body, since fat is a third component with very different attenuation characteristics than those of
other soft tissues. Therefore DXA in vivo BMD measurements must be inaccurate to some
degree, either underestimating or overestimating the true BMD to some extent in any given
person. Estimates of accuracy errors range from 2% for measurements at the forearm, ~6% for
AP spine, ~7% for the total hip, and ~10% for the lateral spine (Kanis & Gluer, 2000; Nielsen,
2000). The correction for fat assumes, among other things, that the distribution of fat in the body
is homogenous. Therefore, when measuring BMD at the lumbar spine or hip, variable soft tissue
densities and non-uniform distribution of fat in the abdomen present a problem, as the
attenuation coefficients of the tissues involved lead to fat appearing as negative bone. This is of
particular concern in osteoporotic and elderly persons with low BMD. The estimated random
accuracy error due to fat inhomogeneity is ~3-4% for an AP spine scan, and 9-14% for a lateral
spine scan (Svendsen et al., 1995). These limitations in accuracy created by non-uniform fat
12

distribution will most likely affect longitudinal studies if there are considerable changes of fat in
a subject. However, the possibility of errors resulting from fat distribution should be kept in
mind when classifying an individual’s BMD.
Another systematic inaccuracy inherent in DXA systems is intraunit variation between
devices, which can be as high as 20% (Nielsen, 2000). An example of this disparity is the
finding that the Lunar DPX machine measures consistently higher BMD values (approximately
12-15%) than the Hologic QDR-1000 (Cawte et al., 1999; Mazess et al., 1991). Bone density
results from different manufacturers’ equipment cannot be interchanged when studying
individual patients without careful allowance for the systematic differences. This is shown to be
especially true for femur measurements, due to differences in manufacturers’ databases (Laskey
et al., 1992). Other possible causes of this disparity include variations in approach to dual-
energy production, calibration procedures, edge detection algorithms, and assumptions regarding
fat distribution, as well as differences in the dependency of measurement on the thickness of the
subject and operator-dependent variables such as patient repositioning and scan analysis.
Not only is there variability between different brands, but also significant intermachine
variability existing for the same brands. This is particularly true when upgrading from first to
second generation systems, as a result of magnification and other differences inherent in fan
beam geometry. Due to the magnification effect of fan beam geometry, BMC and bone area
measurements show an apparent dependency on the bone-to-radiation-source distance (Dunn &
Wahner, 1992). When upgrading from a Hologic QDR-1000W to the QDR-4500A, the latter
produces a small systematic overestimate of BMD at low BMD and an underestimate at high
BMD compared with the former. This is most apparent at the spine and femoral neck
(Bouyoucef & Cullum, 1996). The use of the manufacturer’s phantom is important in cross-
13

calibration to calculate differences between the two devices. Using the manufacturer’s routine
calibration procedures when upgrading DXA systems will not produce a significant error when
diagnosing osteoporosis; however, it may affect the ability to detect changes in BMD in
longitudinal studies (Finkelstein et al., 1994a).
The accurate diagnostic classification of an individual depends on various factors. These
include the precise derivation of the reference population mean and SD used to calculate the T-
score, and the comparability of bone mass measurements across different manufacturers.
Discrepancies between patients classified according to the WHO criteria using different
densitometers have been documented (Faulkner et al., 1996; Formica, 1998; Genant et al., 1994).
Problems arise when a single T-score criterion is used for BMD measurements from different
sites. This is due to the fact that T-scores depend on body size, and they vary greatly when
measuring different sites. There is also a challenge when utilizing manufacturers’ reference
ranges. Several authors suggest that the normal reference database may not be appropriate, and
propose that individual populations should use their own reference range T-scores to avoid
misdiagnoses based on another populations’ reference range T-scores (Ahmed et al., 1997;
Gurlek et al., 2000; Maricic & Chen, 2000; Nielsen, 2000; Patel et al., 1998).
It is evident then that the WHO definition of osteoporosis cannot be applied to all sites of
DXA BMD measurements. Correlations between BMD measurements performed at central and
peripheral sites are poor (Delmas, 2000). Correlations are also poor between technologies at the
same site, indicating that BMD at one site cannot be predicted from BMD measured at another
site in an individual, and are thus of very low predictive value (Kanis & Gluer, 2000). Bone is
biologically inhomogenous, and there are variable rates of bone loss at different sites with
advancing age. Individuals deemed osteoporotic at one skeletal site may not be found to be
14

osteoporotic at another. So questions arise as to which measurement site is best. In the
premenopausal and early postmenopausal years (up to age 65), vertebral fractures are the
immediate concern, as age-related bone loss occurs most rapidly in the spine at this time.
Therefore, spinal measurements typically provide the most accurate measure of skeletal state and
response to aging and/or therapy. After the age of 65, hip fractures become the primary concern,
and there are strong indications that hip BMD measurements are best for predicting hip fracture
(Blake et al., 1998; Cummings et al., 1993). However, the degree to which spine BMD best
predicts vertebral fracture, or a radius BMD forearm fracture is much weaker. Recent studies
have confirmed that AP lumbar spine DXA remains the optimum technique for measuring
longitudinal changes (Baran et al., 1997; Faulkner, 1998). Although in the elderly, degenerative
stages will sometimes falsely elevate BMD if measured in the AP direction. If significant
osteophytes, sclerosis, vertebral fracture, aortic calcification, and/or scoliosis is suspected in the
spine, then either lateral spine, spinal quantitative computed tomography (QCT), or alternative
skeletal sites should be evaluated to avoid an overestimation of BMD, and therefore, an
underestimation of fracture risk. Another cause for inaccuracy of spinal BMD measures is due to
the extremely labile state of vertebral marrow. Its red/yellow content changes with various
situations such as altered physical activity, general health conditions, medicinal drug dosages,
and aging. Therefore, DXA BMD inaccuracies can occur as a result of changes in marrow type,
without any actual changes in bone material having taken place (Bolotin et al., 2001).
Lateral scanning of the spine evaluates primarily the vertebral body, which contains
predominantly trabecular bone. This avoids some measurement errors that can occur with AP
testing, which measures the mostly cortical posterior elements of the vertebrae. Because
osteoporosis is usually characterized by a greater relative loss of trabecular than cortical bone,
15

lateral DXA measurements typically identify patients with osteopenia more often than AP DXA
measurements (Adams, 1992; Finkelstein et al., 1994b; Peel & Eastell, 1994). However, the
technique has poorer precision (2-5%) than AP scanning (Adams, 1992), making monitoring of
change more difficult.
Investigations have shown that BMD based on projected two-dimensional area of the bone
tends to overestimate the bone density of larger bones. Hence, another approach to estimating
the true volumetric BMD, bone mineral apparent density (BMAD), has been proposed (Carter et
al., 1992; Cummings et al., 1994). It is now possible to combine the AP and lateral spine data to
infer a volumetric bone density value, which is an estimate of true physical density, measured in
g/cm3. This new measure appears to minimize the confounding effects of variation in bone size
resulting from differences in age, height, weight, and changes in vertebral geometry with age.
Although BMAD appears to provide insights in addition to those of areal density measures, and
may prove useful in cross-sectional studies of various sized subjects and in extended longitudinal
studies of individuals with changing skeletal dimensions, several authors have shown no
improvement in diagnostic accuracy when using BMAD (Duan et al., 1999; Peel & Eastell,
1994; Tabensky et al., 1996).
Although DXA technology has been well established in the measurement of hip and lumbar
spine BMD, the reliability of other regional measures has not been confirmed. Degenerative
diseases among the elderly may compromise the ability to interpret spine and/or hip BMD
values; therefore an alternate site, such as the distal tibia (DT) may provide information
pertaining to mineral distribution, specifically the trabecular to cortical ratio, in a weight-bearing
bone (Casez et al., 1994). In addition, military recruits and individuals engaging in athletics in
which there is repetitive stress or strain to the lower leg are at a higher risk of incurring stress
16

fractures of the DT (Beck et al., 2000; Bennell et al., 1996; Bergman & Miller, 2001; Jones &
Knapik, 1999; Korpelainen et al., 2001; Monteleone, 1995). Numerous factors have been
proposed as potential risk factors for stress fractures, and although data are inconclusive at
present, several authors have found lower BMD to be associated with risk of stress fractures,
particularly in females (Bennell et al., 1996; Dugowson et al., 1991; Lauder et al., 2000; Pouilles
et al., 1989). However, the reliability and validity of DT BMD measurements by the Hologic
QDR-4500A DXA has not been well established in the literature or by the manufacturer of one
type of DXA (Hologic Inc.).
Subjects undergoing DXA measurement are asked to remove all metal from their bodies or
clothing, including items such as jewelry and body piercings. The presence of any metal on a
person may interfere with the accuracy of the DXA scan, although the extent of this error is
unknown. For example, a navel ring may be detected by the DXA as additional bone in the
lumbar spine region; therefore, BMD results will be inaccurate. Studies have not tested whether
it is possible for the operator to manually remove this affected area of the scan while maintaining
accurate BMD results.
Body composition by DXA
Measurement of body composition is valuable in a number of clinical and research situations.
Most methods of assessing body composition have shortcomings or are indirect in the sense that
they rely on physical properties or chemical constants of the body (Svendsen et al., 1993). DXA
was originally developed to measure BMC; however, it can also be used to estimate soft tissue
composition (lean and fat content) from the soft tissue attenuation ratio (Rst), which is defined as
the ratio of beam attenuation at the lower energy relative to the higher energy. Previous studies
17

have shown that Rst and percent fat (% fat) are inversely and linearly related (Svendsen et al.,
1993). Based on this relationship, the % fat of soft tissues can be estimated from Rst.
DXA is becoming one of the most frequently used techniques for body composition
assessment. This is due, in part, to the fact that it is affordable, practical, has a low radiation
dose, is non-invasive, suitable for elderly and very sick patients, and permits quantification of
multiple whole body and regional components including bone, fat, and lean soft tissue masses.
The precision of DXA body composition measures (CV%) has been reported in several studies
for fat mass, lean mass, and % fat as 1.7-2.7%, 0.6-1.4%, and 1.9-2.7%, respectively (Lukaski,
1993; Madsen et al., 1997; Pritchard et al., 1993; Tothill et al., 1994a).
Measurement issues of body composition by DXA
A principal assumption of DXA refers to the “two component limitation.” DXA can
accurately analyze only two components of tissue with sufficiently different attenuation
coefficients – bone and non-bone tissue. However, there are four main components in the human
body: bone mineral, fat-free soft tissue, fat, and water. DXA can legitimately be applied to
determine fat and lean tissue in areas of the body where there is no bone. In whole body
scanning, the fat and lean proportions can be determined in non-bone pixels, which comprise
approximately 60% of the body (Tothill et al., 1994a, 1994b). However, in regions such as the
thorax, arm, and head, the percentage of bone-free pixels will be much lower and may be
insufficient for accurate soft-tissue determinations. It is then necessary to estimate the fat
proportion in the remaining 40% of pixels overlying bone, both to calculate total body fat and to
determine BMC, because fat appears as negative bone in these calculations. This requires
assumptions about fat distribution. Manufacturers use different fat distribution models, and do
not reveal what these are; however, all DXA measurements assume that the amount of fat over
18

bone is the same as that in the adjacent soft-tissue background. Despite this, the non-uniform
distribution of adipose tissue in the abdomen, in particular, is known to cause error (Tothill &
Nord, 1995b).
Different assumptions about fat distribution, including variations in calibration procedures or
standards, probably contribute significantly to the inconsistency in results obtained from
different DXA systems. Very large systematic differences in soft tissue values determined by
the three DXA systems (Hologic, Lunar, and Norland) have been reported (Laskey, 1996; Tothill
et al., 1995a). These differences vary with the region considered, such that precision and
accuracy are lower for measurements of the trunk, where there is much less bone-free soft tissue,
than for the legs (Roubenoff et al., 1993; Tothill et al., 1994a). Several other explanations for the
inter-machine variability include different approaches to edge detection and dual-energy
production. Additionally, differing system sensitivities to AP thickness of the body may exist
(Haarbo et al., 1991; Roubenoff et al., 1993). X-ray beam hardening errors can occur, which
cause the measured Rst value to decrease, and thus % fat to increase, with increasing tissue
thickness (Goodsitt, 1992). At high tissue depths > 20-25 cm, the amount of fat and bone
mineral were overestimated by Lunar and Hologic systems (Laskey, 1996). Finally,
manufacturers use different sources of external calibration, and there is a lack of cross-validation
of instruments from different manufacturers using a standard phantom.
When upgrading DXA systems from first to second generation by the same manufacturer,
errors may occur due to fan-beam magnification. In one study (Ellis & Shypailo, 1998), fan-
beam measurement gave higher lean values and lower fat values when compared with pencil
beam values. Although speculation is made as to the possibility that the manufacturer may have
changed their reference values or cutoff points for the attenuation coefficients used to define the
19
relative lean and fat fractions of the total soft tissue mass, reasons for these differences are
unknown (Ellis & Shypailo, 1998).
Another underexplored area of DXA technology when assessing body composition is the
influence of hydration on soft tissue component estimates. DXA assumes that the hydration of
lean body mass is uniform and fixed at 0.73 mL/g, or 73% (Roubenoff et al., 1993). However,
hydration can vary from 67% to 85%. If a subject contains more than the average amount of
water, DXA will overestimate the fat content. Evidence suggests that DXA is prone to fat
estimation errors related to variation in soft tissue hydration. However, under normal or even
most clinical conditions, this error is expected to be so small as to not pose any substantial
limitations to the accuracy of DXA measurements (Ellis, 2000; Pietrobelli et al., 1998; Tothill et
al., 1994a).
Bioelectrical Impedance Analysis (BIA)
Bioelectrical impedance analysis is a simple, reproducible technique for the assessment of
body composition and has been validated indirectly in normal human subjects (Heitmann, 1994;
Lukaski et al., 1985). The ability of tissues to conduct an electric current has been recognized
for more than 100 years. The aqueous tissues of the body, due to their dissolved electrolytes, are
the major conductors of an electrical current, whereas body fat and bone are relatively poor
conductors (Ellis, 2000). Bioelectrical impedance analysis is based upon the relationship
between the volume of the conductor (i.e., the human body), the conductor’s length (i.e., the
subject’s height), the components of the conductor (i.e., fat or fat-free mass), and its impedance
(Z). Impedance is the pure resistance of a biological conductor to the flow of an alternating
current. It is composed of the sum of two components, resistance (R) and reactance (Xc),
measured at a particular frequency, and is defined by the equation, Z = R2 + Xc2 (Brodie et al.,
20

1998). Resistance is defined as the pure opposition of the body to the flow of an alternating
current. Reactance is produced by the additional opposition to the current from the capacitant
(storage) effects of cell membranes, tissue interfaces, and structural features (Chumlea & Guo,
1997). Both R and Xc are found in the body, although Xc is typically very small relative to Z at
lower frequencies; therefore, R and Z are often considered interchangeable.
Bioelectrical impedance analysis measurements are performed using four adhesive surface
electrodes. They are typically placed on the dorsal surfaces of the right hand and foot, at the
distal metacarpals and metatarsals respectively, and between the distal prominences of the radius
and the ulna at the wrist, and the medial and lateral malleoli at the ankle, while the subject lies
flat on a non-conducting surface with legs abducted. For the single-frequency measurement,
which is typically at 50 kHz, (multifrequency machines are in the order of 5 kHz to 1 mHz), a
weak alternating current is passed through the outer pair of electrodes, while the voltage drop
across the body is measured using the inner pair of electrodes from which the body’s impedance
is derived.
In addition to being a safe, noninvasive, and reliable approach for estimating human body
composition, BIA offers advantages of a relatively inexpensive cost, rapid measurements,
portability, and little operator skill or subject involvement required. Prediction errors of
calculating body fat are estimated to be 3-5% (Brodie et al., 1998). However, even if precision
of measuring current body composition is high and measurement error is acceptable, the
precision of measuring individual changes over time will depend on the accuracy of the initial
and later measurements. In general, BIA is not considered a good predictor of changes in body
composition associated with physical training and weight loss (Lukaski et al., 1985).
21

There are assumptions and limitations for almost all body composition methods. The theory
behind BIA assumes that the conductor is a perfect cylinder with a uniform cross-sectional area,
which does not hold true in the human body. Each cylinder (arms, legs, trunk) has a different
cross-sectional area, and therefore contributes a different resistance. Another consideration is
that the differences in cross-sectional area are not proportional to the differences in percentage
body mass. For example, the trunk may comprise 45% of body mass, but only about 10% of
whole body resistance, while the arm, which contributes only about 4% of body weight, accounts
for about 45% of whole body resistance (Elia, 1993). Therefore changes in the size and
composition of the trunk have little effect on whole body resistance. In this way, variations in
body proportions may enhance the error associated with percentage body fat predictions.
Measurements taken of subjects at the extremes of body fatness will yield less accurate fat-free
mass predictions, tending to overestimate fat mass in the lean and underestimate fat mass in the
obese (Brodie et al., 1998; Chumlea & Guo, 1997; Okasora et al., 1999).
Worldwide, there are many different manufacturers of BIA machines, which often use
different equations for converting the raw measurements of impedance or resistance to estimates
of body composition. This results in the same measurements being translated to greatly different
estimates of body composition in both lean and obese subjects. Estimations of body fat varying
by more than 10% of body weight have been reported (Elia, 1993). There are several reasons for
this disagreement in results.
One major concern relates to the equations incorporated into the software by manufacturers.
The populations used to establish these equations are apparently comprised of a combination of
lean and obese individuals, and have involved different ethnic groups. Gender, age, and weight
are included in some equations, but not in others. Errors will occur when impedance is used to
22

assess body composition in patients with abnormal or changeable water status and/or electrolyte
balance (Gudivaka et al., 1999; Kyle et al., 2001; Lukaski et al., 1985; Montagnani et al., 1998).
Healthy subjects may also experience disturbances in fluid distribution under normal
circumstances. Differences in gender, age, muscle mass, physical activity, menstrual cycle, drug
intake, diet, etc., can be expected to influence impedance readings (Brodie et al., 1998).
Therefore, it is necessary to use different predictive equations for different groups of subjects.
Another source of error pertains to the reference method from which the bioimpedance
equation was established, usually densitometry or water dilution techniques, which make
different assumptions. Any error or drawback in the reference method will be transmitted to the
BIA equation.
Other factors that may influence the impedance measurement, thereby decreasing reliability
include: skin temperature; strenuous exercise before measurement (exercise-induced
dehydration); different body positions; ingestion of a meal before measurements; and incorrect
positioning of electrodes (Brodie et al., 1998). Higher impedance values when taken on the left
side compared to the right side have been reported (Heitmann, 1994; Lukaski et al., 1985).
Several systematic errors of impedance instruments include: measured changes being less than
measurement errors, and different resistance readings on the same subjects measured with
different machines, due to differences in voltage drop and/or current between various
instruments (Brodie et al., 1998).
Summary
Despite existing systematic inaccuracies, DXA has proven to be a valuable and efficient
method for assessing BMD as well as body composition. Because DXA technology yields such
high evaluation and diagnostic potential, there is a need to continue with studies in which
23

accuracy, as well as reliability and validity of DXA are established. Bone densitometry
measurements have typically focused on regions of the lumbar spine and hip because of their
ability to assess risk of fracture and osteoporosis. However, BMD measurements of other
regional areas may prove beneficial, as DT BMD is suggestive of stress fracture risk. The
accuracy of BMD measurements is highest when subjects have no metal on their bodies or
clothing. However, irremovable jewelry such as navel rings must be considered when assessing
BMD results. There is a need to determine measurement errors presented by metal artifacts and
the ability to manually correct for these errors. The purpose of the current research, therefore,
was threefold: (1) to establish the reliability and validity of the Hologic QDR-4500A DXA at
Virginia Tech to measure body composition; (2) to establish the reliability and validity of
regional tibial DXA measures, and (3) to determine measurement errors represented by metal
artifacts on BMD measures at the lumbar spine and ability to correct for these errors. It was
hypothesized that body composition measurements and BMD measurements for the whole body,
lumbar spine, total proximal femur, and total forearm with the Hologic QDR-4500A DXA at
Virginia Tech would be reliable and valid, with precision errors matching those found in the
literature. It was further hypothesized that DT BMD measurements would produce reliable and
valid results. Lastly, it was hypothesized that the DXA operator would be able to manually
correct for any measurement error that body jewelry would have on lumbar spine BMD
measurements.
References
Adams JE. Osteoporosis and bone mineral densitometry. Curr Opin Radiol. 1992;4(6): 11-20. Ahmed AI, Blake GM, Rymer JM, Fogelman I. Screening for osteopenia and osteoporosis: do the accepted normal ranges lead to overdiagnosis? Osteoporos Int. 1997;7(5):432-8.
24
Alhava EM. Bone density measurements. Calcif Tissue Int. 1991;49Suppl:S21-3. Baran DT, Faulkner KG, Genant HK, Miller PD, Pacifici R. Diagnosis and management of osteoporosis: guidelines for the utilization of bone densitometry. Calcif Tissue Int. 1997;61:433-40. Barthe N, Braillon P, Ducassou D, Basse-Cathalinat B. Comparison of two Hologic DXA systems (QDR 1000 and QDR 4500/A). Br J Radiol. 1997;70(835):728-39. Beck TJ, Ruff CB, Shaffer RA, Betsinger K, Trone DW, Brodine SK. Stress fracture in military recruits: gender differences in muscle and bone susceptibility factors. Bone. 2000;27(3): 437-44. Bennell KL, Malcolm SA, Thomas SA, Reid SJ, Brukner PD, Ebeling PR, Wark JD. Risk factors for stress fractures in track and field athletes. A twelve-month prospective study. Am J Sports Med. 1996;24(6):810-8. Bergman, BP, Miller SA. Equal opportunities, equal risks? Overuse injuries in female military recruits. J Pub Health Med. 2001;23(1):35-9. Blake GM, Patel R, Fogelman I. Peripheral or axial bone density measurements? J Clin Densitom. 1998;1:55-63. Blake GM, Fogelman I. Bone densitometry and the diagnosis of osteoporosis. Semin Nucl Med. 2001;31(1):69-81. Bolotin HH, Sievanen H, Grashuis JL, Kuiper JW, JarvinenTL. Inaccuracies inherent in patient-specific dual-energy x-ray absorptiometry bone mineral density measurements: comprehensive phantom-based evaluation. J Bone Miner Res. 2001;16(2):417-26. Bouyoucef SE, Cullum ID, Ell PJ. Cross-calibration of a fan beam x-ray densitometer with a pencil-beam system. Br J Radiol. 1996;69(822):522-31. Brodie D, Moscrip V, Hutcheon R. Body composition measurement: a review of hydrodensitometry, anthropometry, and impedance methods. Nutrition. 1998;14: 296-310. Carter DR, Bouxsein ML, Marcus R. New approaches for interpreting projected bone densitometry data. J Bone Miner Res. 1992;7(2):137-45. Casez, JP, Troendle A, Lippuner K, Jaeger P. Bone mineral density at distal tibia using dual- energy X-ray absorptiometry in normal women and in patients with vertebral osteoporosis or primary hyperparathyroidism. J Bone Miner Res. 1994;9(12):1851-7.
25

Cawte SA, Pearson D, Green DJ, Maslanka WB, Miller CG, Rogers AT. Cross-calibration for clinical trials using dual energy x-ray absorptiometry of the lumbar spine. Br J Radiol. 1999;72(856):354-62. Chumlea WC, Guo SS. Bioelectrical Impedance: a history, research issues, and recent consensus. Emerging Technologies for Nutrition Research. 1997:169-92. Cummings SR, Black DM, Nevitt MC, Browner W, Cauley J, Ensrud K, Genant HK, Palermo L, Scott J, Vogt TM. Bone density at various sites for prediction of hip fractures. Lancet. 1993;341:75-9. Cummings SR, Marcus R, Palermo L, Ensrud KE, Genant HK. Does estimating volumetric bone density of the femoral neck improve the prediction of hip fracture? a prospective study. J Bone Miner Res. 1994;9(9):1429-32. Delmas PD. Do we need to change the WHO definition of osteoporosis? Osteoporos Int. 2000;11:189-91. Dugowson CE, Drinkwater BL, Clark JM. Nontraumatic femur fracture in an oligomenorrheic athlete. Med Sci Sports Exerc. 1991;23(12):1323-5. Duan Y, Parfitt AM, Seeman E. Vertebral bone mass, size, and volumetric density in women with spinal fractures. J Bone Miner Res. 1999;14(10):1796-1802. Dunn WL, Wahner HW. Evaluation of a dual energy x-ray absorptiometry (DXA) bone mineral and body composition measurement system utilizing a fan-beam design. J Nucl Med. 1992;33Suppl:1063. Elia M. The bioimpedance ‘craze.’ Eur J Clin Nutr. 1993;47:825-7. Ellis KJ. Human Body Composition: in vivo methods. Physiol Rev. 2000;80(2):649-80. Ellis KJ, Shypailo RJ. Bone mineral and body composition measurements: cross-calibration of pencil-beam and fan-beam dual-energy x-ray absorptiometers. J Bone Miner Res. 1998;13(10):1613-8. Faulkner KG. Bone densitometry: choosing the proper skeletal site to measure. J Clin Densitom. 1998;1(3):279-85. Faulkner KG, Roberts LA, McClung MR. Discrepancies in normative data between Lunar and Hologic DXA systems. Osteoporos Int. 1996;6:432-6. Finkelstein JS, Butler JP, Cleary RL, Neer RM. Comparison of four methods for cross- calibrating dual-energy x-ray absorptiometers to eliminate systematic errors when upgrading equipment. J Bone Miner Res. 1994a;9(12):1945-52.
26
Finkelstein JS, Cleary RL, Butler JP, Antonelli R, Mitlak BH, Deraska DJ, Zamora-Quezada JC, Neer RM. A comparison of lateral versus anterior-posterior spine dual-energy x-ray absorptiometry for the diagnosis of osteopenia. J Clin Endocrinol Metab. 1994b;78:724-30. Fogelman I, Blake GM. Different approaches to bone densitometry. J Nucl Med. 2000;41(12): 2015-25. Formica CA. Standardization of BMD measurements. Osteoporos Int. 1998;8(1):1-3. Genant JK, Grampp S, Gluer CC, Faulkner KG, Jergas M, Engelke K, Hagiwara S, Van Kuuk C. Universal standardization for dual x-ray absorptiometry: patient and phantom cross- calibration results. J Bone Miner Res. 1994;9(10):1503-14. Gluer, CC. The use of bone densitometry in clinical practice. Bailleres Best Pract Res Clin Endocrinol Metab. 2000;14(2):195-211. Gluer CC, Blake GM, LuY, Blunt BA, Jergas M, Genant HK. Accurate assessment of precision errors: how to measure the reproducibility of bone densitometry techniques. Osteoporos Int. 1995;5:262-70. Goodsitt MM. Evaluation of a new set of calibration standards for the measurement of fat content via DPA and DXA. Med Physics. 1992;19(1):35-44. Gudivaka R, Schoeller DA, Kushner RF, Bolt JG. Single- and multifrequency models for bioelectrical impedance analysis of body water compartments. J Appl Physiol. 1999; 87(3):1087-96. Gurlek A, Bayraktar M, Ariyurek M. Inappropriate reference range for peak bone mineral density in dual-energy x-ray absorptiometry: implications for the interpretation of t-scores. Osteoporos Int. 2000;11(9):809-13. Haarbo J, Gotfredsen A, Hassager C, Christiansen C. Validation of body composition by dual energy x-ray absorptiometry (DEXA). Clin Physiol. 1991;11:331-41. Heitmann BL. Impedance: a valid method in assessment of body composition? Eur J Clin Nutr. 1994;48:228-40. Jones, BH, Knapik JJ. Physical training and exercise-related injuries. Surveillance, research and injury prevention in military populations. Sports Med. 1999;27(2):111-25. Kanis JA, Gluer CC. An update on the diagnosis and assessment of osteoporosis with densitometry. Osteoporos Int. 2000;11:192-202. Korpelainen R, Orava S, Karpakka J, Siira P, Hulkko A. Risk factors for recurrent stress fractures in athletes. Am J Sports Med. 2001;29(3):304-10.
27

Kyle UG, Genton L, Mentha G, Nicod L, Slosman DO, Pichard C. Reliable bioelectrical impedance analysis estimate of fat-free mass in liver, lung, and heart transplant patients. J Parenter Enteral Nutr. 2001;25(2):45-51. Laskey MA. Dual-energy x-ray absorptiometry and body composition. Nutrition. 1996;12(1): 45-51. Laskey MA, Crisp AJ, Cole TJ, Compston JE. Comparison of the effect of different reference data on Lunar DPX and Hologic QDR-1000 dual-energy X-ray. Br J Radiol. 1992;65: 1124-29. Lauder TD, Dixit S, Pezzin LE, Williams MV, Campbell CS, Davis GD. The relation between stress fractures and bone mineral density: evidence from active-duty Army women. Arch Phys Med Rehabil. 2000;81(1):73-9. Lilley J, Walters BG, Heath DA, Drolc Z. In vivo and in vitro precision for bone density measured by dual-energy x-ray absorption. Osteoporos Int. 1991;1:141-146. Lukaski HC. Soft tissue composition and bone mineral status: evaluation by dual-energy x-ray absorptiometry. J Nutr. 1993;123:438-443. Lukaski HC, Johnson PE, Bolonchuk WW, Lykken GI. Assessment of fat-free mass using bioelectrical impedance measurements of the human body. Am J Clin Nutr. 1985;41:810-7. Madsen OR, Jensen J-EB, Sorensen OH. Validation of a dual energy x-ray absorptiometer: measurement of bone mass and soft tissue composition. Eur J Appl Physiol. 1997;75:554-8. Maricic M, Chen Z. Bone densitometry. Clin Lab Med. 2000;20(3):469-88. Mazess RB, Trempe JA, Bisek JP, Hanson JA, Hans D. Calibration of dual-energy x-ray absorptiometry for bone density. J Bone Miner Res. 1991;6:799-806. Miller PD, Zapalowski C, Kulak CA, Bilezikian JP. Bone densitometry: the best way to detect osteoporosis and to monitor therapy. J Clin Endocrinol Metab. 1999;84(6):1867-71. Montagnani M, Montomoli M, Mulinari M, Guzzo G, Scopetani N. Relevance of hydration state of the fat free mass in estimating fat mass by body impedance analysis. Appl Radiat Isot. 1998;49(5/6):499-500. Monteleone GP Jr. Stress fractures in the athlete. Orthop Clin North Am. 1995;26(3):423-32. Nielsen SP. The fallacy of BMD: a critical review of the diagnostic use of dual x-ray absorptiometry. Clin Rheumatol. 2000;19(3):174-83.
28

Nieves JW, Cosman F, Mars C, Lindsay R. Comparative assessment of bone mineral density of the forearm using single photon and dual X-ray absorptiometry. Calcif Tissue Int. 1992;51(5):352-5. Okasora K, Takaya R, Tokuda M, Fukunaga Y, Oguni T, Tanaka H, Knoishi K, Tamai H. Comparison of bioelectrical impedance analysis and dual energy X-ray absorptiometry for assessment of body composition in children. Pediatr Int. 1999;41(2):121-5. Ott K. Osteoporosis and bone densitometry. Radiol Technol. 1998;70(2):129-48. Patel R, Blake GM, Jefferies A, Sautereau-Chandley PM, Fogelman I. A comparison of a peripheral DXA sytem with conventional densitometry of the spine and femur. J Clin Densitom. 1998;1(3):235-44. Peel NFA, Eastell R. Diagnostic value of estimated volumetric bone mineral density of the lumbar spine in osteoporosis. J Bone Miner Res. 1994;9(3):317-20. Pietrobelli A, Want Z, Formica C, Heymsfield SB. Dual-enery x-ray absorptiometry: fat estimation errors due to variation in soft tissue hydration. Am J Physiol. 1998;274 (Endocrinol. Metab. 37):E808-E816. Pritchard JE, Nowson CA, Strauss BJ, Carlson JS, Kaymakci B, Wark JD. Evaluation of dual energy x-ray absorptiometry as a method of measurement of body fat. Eur J Clin Nutr. 1993;47:216-28. Pouilles JM, Bernard J, Tremollieres F, Louvet JP, Ribot C. Femoral bone density in young male adults with stress fractures. Bone. 1989;10(2):105-8. Roubenoff R, Kehayias JJ, Dawson-Hughes B, Heymsfield SB. Use of dual-energy x-ray absorptiometry in body-composition studies: not yet a “gold standard.” Am J Clin Nutr. 1993;58:589-91. Ryan PJ. Overview of role of BMD measurements in managing osteoporosis. Semin Nucl Med. 1997;27(3):197-209. Smith J, Shoukri K. Diagnosis of osteoporosis. Clin Cornerstone. 2000;2(6):22-33. Svendsen OL, Hassager C, Skodt V, Christiansen C. Impact of soft tissue on in-vivo accuracy of bone mineral measurements in the spine, hip, and forearm: a human cadaver study. J Bone Miner Res. 1995;10:868-73. Svendsen OL, Haarbo J, Hassager C, Christiansen C. Accuracy of measurements of body composition by dual-energy x-ray absorptiometry in vivo. Am J Clin Nutr. 1993;57: 605-8.
29

Tabensky AD, Williams J, Deluca B, Brigant E, Seeman E. Bone mass, areal, and volumetric bone density are equally accurate, sensitive, and specific surrogates of the breaking strength of the vertebral body: an in vitro study. J Bone Miner Res. 1996; 11(12):1981-8. Tothill P, Avenell A, Love J, Reid DM. Comparisons between Hologic, Lunar and Norland dual-energy X-ray absorptiometers and other techniques used for whole-body soft tissue measurements. Eur J Clin Nutr. 1994a; 48(11):781-94. Tothill P, Avenell A, Reid DM. Precision and accuracy of measurements of whole-body bone mineral; comparison between Hologic, Lunar and Norland dual-energy x-ray absorptiometers. Br J Radiol. 1994b;67:1210-7. Tothill P, Fenner JA, Reid DM. Comparisons between three dual-energy X-ray absorptiometers used for measuring spine and femur. Br J Radiol. 1995a;68(810): 621-9. Tothill P, Nord RH. Limitations of dual-energy x-ray absorptiometry. Am J Clin Nutr. 1994b; 61(2):398-400.
30

CHAPTER III
RELIABILITY AND VALIDITY OF BONE MINERAL DENSTIY AND BODY
COMPOSITION MEASURES BY DXA
31

Abstract
Reproducibility of measurements by dual-energy X-ray absorptiometry (DXA) is an
important factor in both clinical and research applications using this technique. The reliability
and validity of bone mineral density (BMD) and body composition measures by the QDR-4500A
DXA (Hologic, Inc., Bedford, MA) at Virginia Tech were investigated in this study. A group of
24 young-adult (age=22.7±2.0 years) males (n=14) and females (n=10) completed DXA scans of
the whole body (WB), lumbar spine (LS), total proximal femur (TPF), and total forearm (TF) at
two timepoints. Correlation coefficients and coefficients of variation (CV%) were calculated for
BMD at each region to assess reliability. Significant differences were not found (p>0.05)
between repeat measurements at any site. Correlations ranged from 0.993 to 0.996 (p<0.01), and
CV% for WB, LS, TPF, and TF measures were 0.73%, 0.92%, 0.69%, and 1.09%, respectively.
Body composition values were determined from WB scans to assess the reliability of DXA to
measure percent body fat (%BF), lean body mass (LBM), and fat mass (FM). Significant
differences were not found (p>0.05) between repeat measurements of %BF, LBM, or FM.
Correlations were 0.998 for all measures (p<0.01), and CV% were 1.79%, 1.07%, and 1.75% for
%BF, LBM, and FM, respectively. Validity of %BF by DXA was tested by comparison to single
frequency bioelectrical impedance analysis (BIA). Significant differences in %BF were not
observed between methods. The QDR-4500A DXA at Virginia Tech is reliable and valid for
BMD and body composition measures.
KEY WORDS: BODY COMPOSITION, BONE MINERAL DENSITY, DUAL ENERGY X-
RAY ABSORPTIOMETRY, QDR-4500A DXA, RELIABILITY, VALIDITY
32
Introduction
Dual energy X-ray absorptiometry (DXA) technology has become well established in both
clinical and research settings because of its advantages of high precision, short scan times, and
stable calibration (Fogelman & Blake, 2000; Orwoll & Oviatt, 1991). It is used primarily for
diagnosing the costly and debilitating disease of osteoporosis, as well as for monitoring changes
in bone mineral density (BMD) over time or with therapy. DXA has also been shown to provide
safe and convenient measurements of soft-tissue composition for the assessment of percent body
fat (%BF), lean body mass (LBM), and fat mass (FM) (Pietrobelli et al., 1996; Pritchard et al.,
1993; Wagner & Heyward, 1999).
A key issue in the clinical and/or research application of DXA is reproducibility. Because
changes in BMD are small and gradual, typically 0.5-5.0% per year in a postmenopausal woman
(Davey, 1998; Heilmann et al., 1998), precision of the measurement technique is crucial. A
second issue in application of DXA is validity. As various methods exist to calculate %BF, it is
necessary to validate different tools against one another for cross-comparison of results.
Short-term reproducibility of DXA is excellent both in vitro (assessment of standards or
phantoms), as well as in vivo (Orwoll & Oviatt, 1991). In vitro precision errors, expressed as
coefficients of variation (CV%) typically range from ~0.40-0.55% for spine phantoms, and from
~0.60-1.70% for hip phantoms, depending on the region analyzed (Lilley et al., 1991). In vivo
precision is ~0.5-1.0% for the spine and 2.0-5.0% for the femoral neck, again dependent on the
site analyzed (Adams, 1992).
Body composition has been linked to a number of health conditions, such as cardiovascular
disease, diabetes, certain types of cancers, osteoporosis, and osteoarthritis. Therefore, there is a
clinical need to consistently and precisely measure %BF, distribution of BF, muscle mass, and
33

bone mass (Wagner & Heyward, 1999). Previous studies indicate good reproducibility of body
composition measurements by DXA: a CV% of 0.3-3.9% has been reported for %BF (Tataranni
et al., 1996), 0.6-1.4% for LBM (Chilibeck et al., 1994; Madsen et al., 1997; Pritchard et al.,
1993), and 1.7-2.7% for FM (Chilibeck et al., 1994; Lukaski, 1993; Madsen et al., 1997;
Pritchard et al., 1993).
Although a number of body composition methods are available, such as isotope dilution,
potassium counting, neutron activation analysis, and magnetic resonance imaging, only a few are
sufficiently accurate for quantifying components in the research laboratory. In addition, many of
these methods are costly, time-consuming, inconvenient, require high radiation doses, or lack
precision and/or accuracy, which all compromise their value as instruments in the clinical or
research setting (Haarbo et al., 1991). DXA systems, on the other hand, are practical, require no
active subject involvement, impose minimal risk, and allow for quantification of multiple whole
body and regional components, including bone mineral, fat, and LBM (Pietrobelli et al., 1998).
Many other composition techniques simply measure one phase and extrapolate to the others.
Choice of methodology in a particular clinical setting is often a matter of weighing advantages
and disadvantages; however, it is critical to know that the method of choice is valid and suitable.
Precision studies have not yet established the reproducibility of the QDR-4500A DXA at
Virginia Tech in studies of BMD, nor have they determined the reliability and validity of the
DXA for measures of body composition. Therefore, the purpose of this study was to confirm
both the reliability and validity of BMD and body composition measures by the QDR-4500A
DXA housed in Virginia Tech’s Bone metabolism, Osteoporosis, and Nutrition Evaluation
(BONE) Laboratory.
34
Materials and Methods
Reliability study participants
Fourteen males and ten females (N=24), aged 18 years and older were recruited from the
Virginia Tech campus (Blacksburg, VA, U.S.A.) and surrounding communities to participate in
this study testing the reliability of the QDR-4500A DXA (Hologic Inc., Bedford, MA, U.S.A.)
housed in the BONE Laboratory. Electronic-mail announcements and word-of-mouth were used
as recruitment tools.
This research project was approved by the Institutional Review Board for Research Involving
Human Subjects at Virginia Tech. At least 24 hours in advance, each volunteer was given an
Informed Consent Form and a Health Screening Questionnaire for review. Prior to participating
in any procedure, participants signed an Informed Consent Form (Appendix A) and a Health
Screening Questionnaire (Appendix B). Female subjects were excluded if pregnant, unsure of
pregnancy, or if experiencing irregular menstrual cycles. There were no other exclusion criteria
for males or females.
Procedures for reliability study
On the first day of testing (time 1), all subjects had their heights and weights measured using
a wall-mounted stadiometer, and a digital scale, respectively. Each participant had one whole
body (WB) DXA scan completed, as well as one lumbar spine (LS), one nondominant total
proximal femur (TPF), and one nondominant total forearm (TF) (version 8.25a, 2000, Whole
Body Analysis software, QDR-4500A, Hologic Inc., Bedford, MA, U.S.A.). All DXA scans
were conducted by a Licensed Radiologic Technologist- Limited in the Commonwealth of
Virginia. All scans required each participant to lie on the DXA table in the supine position or,
for the radius scan, to place the forearm flat on the DXA table. All four scans required ~15
35

minutes of time from each participant. Five to seven days later (time 2), each participant had
these same DXA scans (WB, LS, TPF, and TF) repeated, again requiring ~15 minutes of time
from each participant. All DXA scans were completed in the BONE Laboratory (Room 229,
Wallace Hall) on the Virginia Tech campus.
Validity study participants
The same 24 subjects (14 males, 10 females, aged 18 and older) from the DXA reliability
study also participated in a study assessing the validity of body composition measurements by
DXA when compared to single-frequency bioelectrical impedance analysis (BIA). At least 24
hours in advance, each participant was provided with two separate Informed Consent Forms to
review. Prior to participating in any procedure, participants signed both Informed Consent
Forms (Appendices C and D).
Procedures for validity testing
Each participant had one WB DXA scan completed (the same one conducted for the DXA
reliability study). From this scan, LBM, FM, and %BF were calculated. Each participant then
completed single-frequency (50 kHz) BIA assessment (Valhalla, 1990B Fitness Analyzer, San
Diego, CA, U.S.A.). Approximately one week in advance, each participant was given a set of
guidelines to follow in the 24 hours prior to his/her testing session, including: no food for 2-4
hours, no exercise for 8 hours, no caffeine for 12 hours, no caffeine-containing medications for
12 hours, no alcohol for 24 hours, and maintenance of adequate hydration the previous 24 hours.
If a participant believed he/she may have trouble following any of these guidelines, the
participant was asked to expound, and possible solutions (i.e. adjusting appointment time) were
discussed. On the day of testing, each participant was asked to lie flat, without movement, for
~10 minutes. A trained Research Assistant placed four electrodes on each subject, one each on
36

the right wrist, hand, ankle, and foot. Wire leads were then clipped to each electrode.
Participant’s weight, height, gender, and age were entered into the Valhalla BIA device. After 5
minutes, 3 successive measurements for %BF were taken and recorded. After a total of 10
minutes, 3 additional successive measurements for %BF were taken and recorded. The total time
required from each participant for the BIA testing was approximately ~20 minutes.
Statistical analyses
Means and standard deviations (SD) were computed for each variable of interest. Paired
samples t-tests (t), Pearson correlation coefficients (r), coefficients of variation (CV%), and
Bland-Altman analyses were computed to examine the reliability of repeated measurements of
BMD and body composition by DXA. Pearson correlation coefficients, CV%, and Bland-
Altman analyses were used to determine the validity of DXA. Statistical analyses were
completed using the Statistical Package for Social Sciences (SPSS, version 10.0 for windows,
1999, SPSS Inc., Chicago, IL, U.S.A.).
Results
Reliability
Subject characteristics are displayed in Table I. Table II presents BMD values (g/cm2) for all
sites measured at time 1 and time 2. BMD measurements were not statistically significantly
different (p>0.05) at time 1 compared to time 2 (Table III). Correlation coefficients ranged from
0.993 to 0.996 (p<0.01) (Table III and Figures 1, 3, 5, 7), and CV% ranged from 0.692% to
1.094% (Table III). Bland-Altman plots in Figures 2, 4, 6, and 8 illustrate the bias of BMD
measurement at time 2 compared with measurement at time 1 for all sites (WB, LS, TPF, TF),
the 95% confidence interval (95%CI) for the bias, as well as the 95% limits of agreement
37

(95%LofA) between repeat measures (broken red lines), indicating that 95% of the differences
will fall within this range.
Table IV presents data for body composition measurements (%BF, LBM, FM) by DXA at
time 1 and time 2. Differences were not statistically significant (p>0.05) between repeat
measurements (Table V) and CV% ranged from 1.067% to 1.785% (Table V). Correlation
coefficients were 0.998 (p<0.01) for all three components (Figures 9, 11, 13) and Bland-Altman
plots in figures 10, 12, and 14 present the bias of body composition measurement at time 2
compared with measurement at time 1 for %BF, LBM, and FM, respectively, the 95%CI for the
bias, and the 95% LofA between repeat measures.
Validity
Values for %BF by DXA and BIA are presented in Table VI. DXA measurements at time 1
or time 2 were not significantly different from BIA measures (t=0.888 for time 1, t=0.919 for
time 2, both p>0.05). The correlation coefficient between mean %BF by DXA and BIA was
0.937 (p<0.01) (Figure 15). CV% at time 1 and time 2 were 9.86% and 10.10%, respectively.
The Bland-Altman plot in figure 16 depicts the bias of DXA compared with BIA for %BF, the
95%CI for the bias, and the 95% LofA between methods.
Sensitivity
These 24 subjects were divided into 3 subgroups for further analysis: 1) male cyclists (MC),
2) male non-cyclists (MNC), and 3) female non-cyclists (FNC). Tables VII, VIII, and IX present
subject characteristics, as well as all BMD and body composition data for these three subgroups.
Analysis of variance (ANOVA) (Appendix H) and post hoc Scheffe’s tests indicated that
significant differences between groups in age, BMI, LS or TPF BMD did not exist for time 1
(p>0.05) or time 2 (p>0.05). Significant differences (p<0.05) existed between groups in height
38

and weight at time 1, and in WB and TF BMD, %BF, LBM and FM for both time 1 and time 2
as evaluated by Scheffe’s post-hoc tests. FNC were shorter (p<0.01), had higher %BF (p<0.01) ,
and FM (p<0.01), but lower LBM (p<0.01) compared to MC and MNC at time 1 and time 2.
FNC had significantly lower weight (p<0.01), WB (p<0.01), and TF BMD (p<0.01) compared to
MNC, but not compared to MC at time 1 and time 2. Although not statistically significant,
trends were observed among several comparisons. When LS BMD was compared between MC
and MNC, p values were 0.090 and 0.075 for time 1 and time 2, respectively. When TPF BMD
was compared between MNC and FNC, p-values were 0.065 and 0.073 for time 1 and time 2,
respectively. Finally, when TF BMD at time 2 was compared between MC and MNC, the p-
value was 0.090.
39

Table I. Subject characteristics*
Variable Mean ±SD Range
Age (y) 22.7 1.9 18.0-27.0
Height (in) 68.5 4.3 61.0-75.0
Weight (lbs)
BMIa
157.8
23.6
35.4
3.3
116.0-256.0
19.7-32.6
* N=24 a Body Mass Index, [weight (lbs) x 705 + height (in)2]
Table II. Mean bone mineral density (BMD) values (g/cm2) for all sites at time 1 and time 2
BMD site Mean ±SD Range
WBa1 1.205 0.101 1.010-1.433
WB2
LSb1
1.207
1.057
0.104
0.148
1.013-1.455
0.850-1.451
LS2 1.059 0.153 0.838-1.482
TPFc1 1.028 0.121 0.814-1.281
TPF2 1.031 0.126 0.770-1.300
TFd1 0.622 0.080 0.508-0.789
TF2 0.622 0.080 0.517-0.800
N=24 a Whole body b Lumbar spine c Total proximal femur d Total forearm
40

Table III. Correlations and coefficients of variation for repeated measurements of bone mineral density (BMD) by dual energy X-ray absorptiometry
BMD site (g/cm2)
t-valuea Correlation Coefficientb
Coefficient of Variation, CV%
WBc 0.474 0.993 0.734
LSd 0.677 0.996 0.922
TPFe 0.380 0.995 0.692
TFf 0.902 0.993 1.094
N=24 a p>0.05 b Pearson Correlation, p<0.01 c Whole body d Lumbar spine e Total proximal femur f Total forearm
Table IV. Mean percent body fat and soft tissue measurements (kg) by dual energy X-ray absorptiometry at time 1 and time 2
Variable Mean ± SD Range
%BFa1 19.1 7.4 10.7-31.8
%BF2 19.1 7.5 10.2-31.7
LBMb1 56.4 14.7 37.5-95.5
LBM2 56.2 14.7 37.0-95.6
FMc1 13.6 5.4 6.7-27.0
FM2 13.6 5.3 6.4-26.0
N=24 a Percent body fat b Lean body mass c Fat mass
41

Table V. Correlations and coefficients of variation for repeated measurements by dual energy X-ray absorptiometry of percent body fat and soft tissue mass
Variable t-valuea Correlation
Coefficientb Coefficient of
Variation, CV%
%BFc 0.838 0.998 1.785
LBMd 0.312 0.998 1.067
FMe 0.292 0.998 1.748
N=24 a p>0.05 b Pearson correlation, p<0.01 c Percent body fat d Lean body mass e Fat mass
Table VI. Mean percent body fat (%BF) of repeated dual energy X-ray absorptiometry measurements and %BF by bioelectrical impedance analysis
Variable Mean ± SD Range
%BFa1 19.1 7.4 10.7-31.8
%BF2 19.1 7.5 10.2-31.7
BIAb, %BF 19.0 6.1 8.7-30.0
N=24 a Percent body fat b Bioelectrical impedance analysis
42
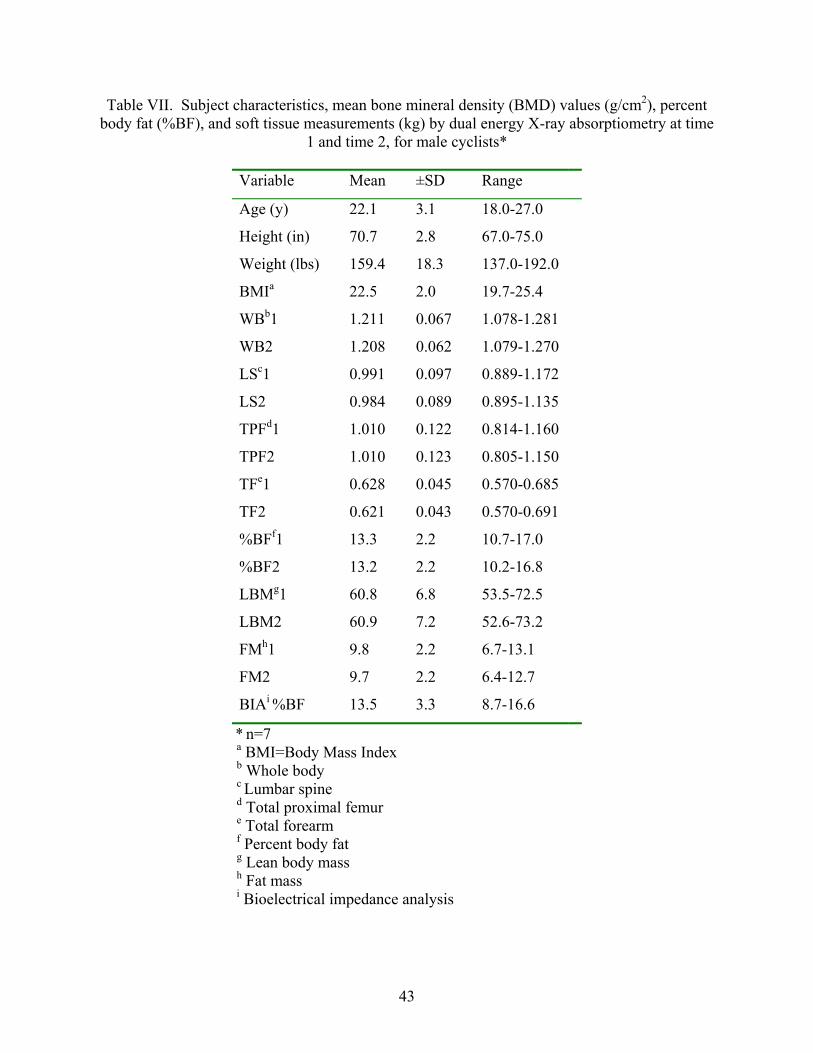
Table VII. Subject characteristics, mean bone mineral density (BMD) values (g/cm2), percent body fat (%BF), and soft tissue measurements (kg) by dual energy X-ray absorptiometry at time
1 and time 2, for male cyclists*
Variable Mean ±SD Range
Age (y) 22.1 3.1 18.0-27.0
Height (in) 70.7 2.8 67.0-75.0
Weight (lbs) 159.4 18.3 137.0-192.0
BMIa 22.5 2.0 19.7-25.4
WBb1 1.211 0.067 1.078-1.281
WB2 1.208 0.062 1.079-1.270
LSc1 0.991 0.097 0.889-1.172
LS2 0.984 0.089 0.895-1.135
TPFd1 1.010 0.122 0.814-1.160
TPF2 1.010 0.123 0.805-1.150
TFe1 0.628 0.045 0.570-0.685
TF2 0.621 0.043 0.570-0.691
%BFf1 13.3 2.2 10.7-17.0
%BF2 13.2 2.2 10.2-16.8
LBMg1 60.8 6.8 53.5-72.5
LBM2 60.9 7.2 52.6-73.2
FMh1 9.8 2.2 6.7-13.1
FM2 9.7 2.2 6.4-12.7
BIAi %BF 13.5 3.3 8.7-16.6
* n=7 a BMI=Body Mass Index b Whole body c Lumbar spine d Total proximal femur e Total forearm f Percent body fat g Lean body mass h Fat mass i Bioelectrical impedance analysis
43

Table VIII. Subject characteristics, mean bone mineral density (BMD) values (g/cm2), percent body fat (%BF), and soft tissue measurements (kg) by dual energy X-ray absorptiometry at time
1 and time 2, for male non-cyclists*
Variable Mean ±SD Range
Age (y) 23.3 0.5 23.0-24.0
Height (in) 71.9 2.4 69.0-75.0
Weight (lbs) 188.3 47.9 148.0-256.0
BMIa 25.3 5.1 20.6-32.6
WBb1 1.284 0.101 1.130-1.430
WB2 1.291 0.108 1.140-1.460
LSc1 1.164 0.189 0.880-1.450
LS2 1.169 0.198 0.890-1.480
TPFd1 1.123 0.108 1.020-1.280
TPF2 1.127 0.111 1.030-1.300
TFe1 0.694 0.093 0.520-0.790
TF2 0.699 0.093 0.530-0.800
%BFf1 14.3 4.4 10.7-22.8
%BF2 14.1 4.3 10.2-22.3
LBMg1 70.3 15.7 56.5-95.5
LBM2 69.5 16.0 54.9-95.6
FMh1 13.0 7.3 7.1-27.0
FM2 12.7 7.0 7.2-26.0
BIAi %BF 16.1 3.5 12.2-21.8
* n=7 a BMI=Body Mass Index b Whole body c Lumbar spine d Total proximal femur e Total forearm f Percent body fat g Lean body mass h Fat mass i Bioelectrical impedance analysis
44

Table IX. Subject characteristics, mean bone mineral density (BMD) values (g/cm2), percent body fat (%BF), and soft tissue measurements (kg) by dual energy X-ray absorptiometry at time
1 and time 2, for female non-cyclists*
Variable Mean ±SD Range
Age (y) 22.8 1.6 21.0-26.0
Height (in) 64.0 2.6 61.0-69.0
Weight (lbs) 135.0 14.0 116.0-162.0
BMIa 23.2 2.1 20.6-27.0
WBb1 1.144 0.092 1.010-1.337
WB2 1.144 0.092 1.013-1.327
LSc1 1.030 0.119 0.850-1.172
LS2 1.034 0.125 0.838-1.181
TPFd1 0.984 0.102 0.816-1.145
TPF2 0.985 0.111 0.770-1.148
TFe1 0.566 0.048 0.508-0.651
TF2 0.568 0.042 0.517-0.644
%BFf1 26.7 4.3 18.0-31.8
%BF2 26.7 4.3 17.5-31.7
LBMg1 43.3 4.2 37.5-51.2
LBM2 43.4 4.4 37.0-51.2
FMh1 16.7 3.7 10.9-22.1
FM2 16.8 3.7 10.7-22.2
BIAi %BF 24.8 3.5 18.5-30.0
* n=9 a BMI=Body Mass Index b Whole body c Lumbar spine d Total proximal femur e Total forearm f Percent body fat g Lean body mass h Fat mass i Bioelectrical impedance analysis
45
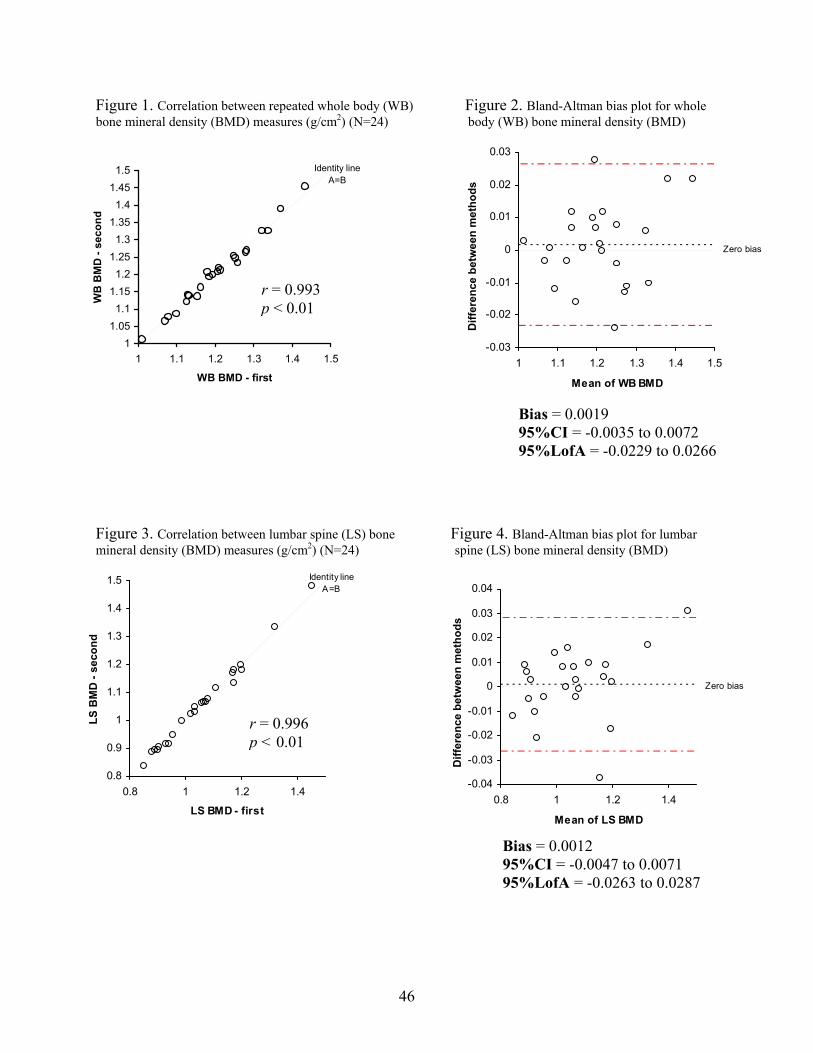
Figure 1. Correlation between repeated whole body (WB) Figure 2. Bland-Altman bias plot for whole bone mineral density (BMD) measures (g/cm2) (N=24) body (WB) bone mineral density (BMD)
Zero bias
-0.03
-0.02
-0.01
0
0.01
0.02
0.03
1 1.1 1.2 1.3 1.4 1.5
Mean of WB BMD
Diff
eren
ce b
etw
een
met
hods
Identity line A=B
11.051.1
1.151.2
1.251.3
1.351.4
1.451.5
1 1.1 1.2 1.3 1.4 1.5
WB BMD - first
WB
BM
D -
seco
nd
r = 0.993 p < 0.01
Bias = 0.0019 95%CI = -0.0035 to 0.0072 95%LofA = -0.0229 to 0.0266
Figure 3. Correlation between lumbar spine (LS) bone Figure 4. Bland-Altman bias plot for lumbar mineral density (BMD) measures (g/cm2) (N=24) spine (LS) bone mineral density (BMD)
Identity line A=B
0.8
0.9
1
1.1
1.2
1.3
1.4
1.5
0.8 1 1.2 1.4
LS BMD - first
LS B
MD
- se
cond
r = 0.996 p < 0.01
Zero bias
-0.04
-0.03
-0.02
-0.01
0
0.01
0.02
0.03
0.04
0.8 1 1.2 1.4
Mean of LS BMD
Diff
eren
ce b
etw
een
met
hods
Bias = 0.0012 95%CI = -0.0047 to 0.0071 95%LofA = -0.0263 to 0.0287
46

Figure 5. Correlation between repeated total proximal femur Figure 6. Bland-Altman bias plot for total (TPF) bone mineral density (BMD) measures (g/cm2) (N=24) proximal femur (TPF) bone mineral density (BMD)
Zero bias
-0.05
-0.04
-0.03
-0.02
-0.01
0
0.01
0.02
0.03
0.7 0.9 1.1 1.3
Mean of TPF BMD
Diff
eren
ce b
etw
een
met
hods
Identity line A=B
0.7
0.8
0.9
1
1.1
1.2
1.3
1.4
0.7 0.9 1.1 1.3
TPF BMD - first
TPF
BM
D -
seco
nd
r = 0.995 p < 0.01
Bias = 0.0025 95%CI = -0.0033 to 0.0083 95%LofA = -0.0243 to 0.0293
Figure 7. Correlation between repeated total forearm (TF) Figure 8. Bland-Altman bias plot for total bone mineral density (BMD) measures (g/cm2) (N=24) forearm (TF) bone mineral density (BMD)
Identity line A=B
0.5
0.55
0.6
0.65
0.7
0.75
0.8
0.85
0.9
0.5 0.6 0.7 0.8 0.9
TF BMD - first
TF B
MD
- se
cond
r = 0.993p
r = 0.993 p < 0.01
< 0.01
Zero bias
-0.03
-0.025
-0.02
-0.015
-0.01
-0.005
0
0.005
0.01
0.015
0.02
0.5 0.6 0.7 0.8 0.9
Mean of TF BMD
Diff
eren
ce b
etw
een
met
hods
Bias = 0.0003 95%CI = -0.0039 to 0.0044 95%LofA= -0.0190 to 0.0195
47

Figure 9. Correlation between repeated % body fat Figure 10. Bland-Altman bias plot for % body measures by dual energy X-ray absorptiometry (N=24) fat by dual energy X-ray absorptiometry
Identity line A=B
10
15
20
25
30
35
10 20 30
%bodyfat - first
%bo
dyfa
t - s
econ
d
r = 0.998 p < 0.01
Zero bias
-1
-0.5
0
0.5
1
1.5
10 20 30
Mean of %bodyfat
Diff
eren
ce b
etw
een
met
hods
Bias = -0.021 95%CI = -0.229 to 0.187 95%LofA = -0.986 to 0.945
Figure 11. Correlation between repeated lean body mass Figure 12. Bland-Altman bias plot for lean (LBM) measures by dual energy X-ray absorptiometry (DXA) body mass (LBM) by dual energy X-ray (N=24) absorptiometry (DXA)
Identity line A=B
30
40
50
60
70
80
90
100
30 50 70 90
LBM - first
LBM
- se
cond
r = 0.998 p < 0.01
Zero bias
-2
-1.5
-1
-0.5
0
0.5
1
1.5
30 50 70 90
Mean of LBM
Diff
eren
ce b
etw
een
met
hods
Bias = -0.180 95%CI = -0.538 to 0.178 95%LofA = -1.842 to 1.483
48
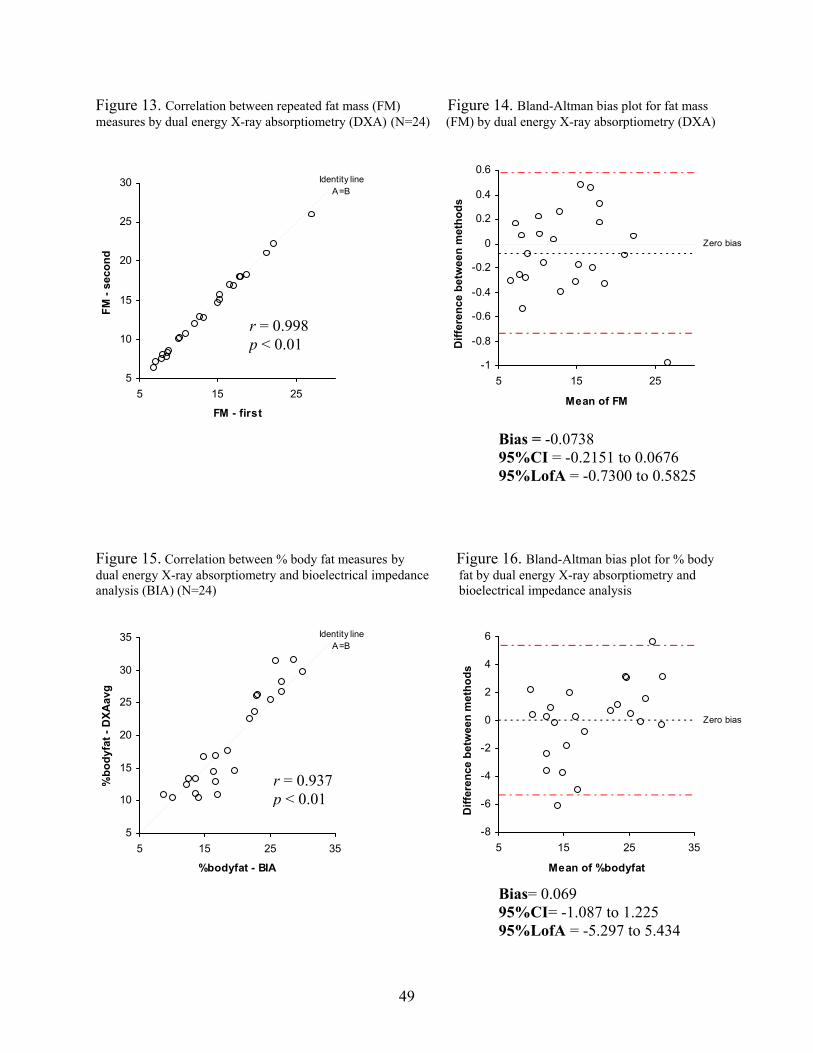
Figure 13. Correlation between repeated fat mass (FM) Figure 14. Bland-Altman bias plot for fat mass ual energy X-ray absorptiometry (DXA) (N=24 energy X-ray absorptiometry (DXA
to 0.0676
igure 15. Correlation between % body fat measures by Figure 16. Bland-Altman bias plot for % body dual energy X-ray absorptiometry and bioelectrical impedance fat by dual energy X-ray absorptiometry and
-5.297 to 5.434
measures by d ) (FM) by dual )
A=B
5
10
15
20
25
5 15 25
FM - first
FM -
seco
nd
Bias = -0.0738
Zero bias
-1
-0.8
-0.6
-0.4
-0.2
0
0.2
0.4
5 15 25
Mean of FM
Diff
eren
ce b
etw
een
met
hods
Identity line 300.6
r = 0.998 p < 0.01
95%CI = -0.2151 95%LofA = -0.7300 to 0.5825
F
analysis (BIA) (N=24) bioelectrical impedance analysis
5
10
15
20
25
30
5 15 25 35
%bodyfat - BIA
%bo
dyfa
t - D
XAav
g
Bias= 0.069 95%CI= -1.087 to 1.225
Zero bias
-8
-6
-4
-2
0
2
4
5 15 25 35
Mean of %bodyfat
Diff
eren
ce b
etw
een
met
hods
Identity line A=B
35 6
r = 0.937 p < 0.01
fA = 95%Lo
49

Discussion
Reproducibility of BMD and body composition measurements by DXA is crucial in any
clinical or research application of the technique. DXA has been previously shown to have good
precision for both procedures (Fogelman & Blake, 2000; Wagner & Heyward, 1999). The
reliability values for repeat measures over 5-7 days obtained from the QDR-4500A DXA at
Virginia Tech are consistent with data reported in the literature.
The anthropomorphic spine phantom (#7316; Hologic, Inc., Bedford, MA, U.S.A.) used for in
vitro calibration procedures in the BONE Laboratory and for this study has a CV% of 0.36%
(N=295 scans). Correlation coefficients for repeat measurements of BMD were high, ranging
from 0.993 to 0.996 (p<0.01) for the various sites analyzed. CV% of 0.73%, 0.92%, 0.69%, and
1.09% for WB, LS, TPF, and TF BMD, respectively, are similar to results obtained by others.
Several authors have reported a CV% for WB BMD of 0.60-1.40% (Herd et al., 1993; Franck &
Munz, 2000). The CV% for LS BMD values is typically <0.50% for in vitro measures (Laskey
et al., 1991), and 1.00-1.10% for in vivo measures (Laskey et al., 1991; Orwoll & Oviatt, 1991).
CV% for TPF BMD range from 1.60-4.70%, depending on the anatomic site analyzed (femoral
neck, trochanteric region, Ward’s triangle); however, a CV% of ~1.50% has been documented
for the TPF (Svendsen et al., 1992). Precision of forearm measures also varies depending on the
region analyzed (ultradistal, mid-distal, or proximal one-third). CV% ranging from 0.55-2.43%
have been reported for these different regions (Hagiwara et al., 1994; Heilmann et al., 1998;
Nieves et al., 1992; Overton & Wheeler, 1992; Ryan et al., 1992); however, a value of 1.50% has
been cited for measures of the TF (Larcos & Wahner, 1991).
High correlations (r=0.998, p < 0.01) were obtained for all repeat measurements of body
composition variables by DXA. Gutin et al. (1996) also reported the reliability of repeat
50

measurements of %BF by DXA to be 0.998 (p≤0.01). CV% of 1.79%, 1.07%, and 1.75% for
%BF, LBM, and FM, respectively found in this study are consistent with values documented in
the literature for body composition assessment by DXA. Typical CV% for %BF measures
reported in the literature are 1.40-1.90% (Pritchard et al., 1993; Tothill et al., 1994; Wagner &
Heyward, 1999). Values for LBM vary to a greater degree, ranging from 0.60-1.47% (Lees &
Stevenson, 1992; Pritchard et al., 1992; Tothill et al., 1994). CV% cited for FM are ~1.80-2.73%
(Chilibeck et al., 1994; Lees & Stevenson, 1992).
Numerous techniques are available for the assessment of body composition; however, there
has been an increasing interest in utilizing DXA for this purpose because of its ability to measure
regional composition. The validity of the QDR-4500A DXA at Virginia Tech for measuring
%BF was established against a single-frequency BIA device. Although not without its own
drawbacks, BIA has been confirmed by others to be a reliable and valid method for evaluation of
human body composition (Heitmann, 1994; Kitano et al., 2001; Lukaski et al., 1985; Lukaski et
al., 1986; Roubenoff, 1996). CV% for %BF between two separate DXA scans and a single BIA
reading were 9.86% and 10.10%, respectively. The correlation between measurements of DXA
and BIA for all subjects was 0.937 (p<0.01). All correlation values between DXA and BIA
found in this study are similar to values reported by others, which are in the range of 0.57-0.987
(p[0.05) (Kitano et al., 2000; Kyle et al., 2001; Levenhagen et al., 1999; Okasora et al., 1999;
Roubenoff, 1996; Sardinha et al., 1998).
To serendipitously examine data of cyclists, non-cyclists, and females, subjects were divided
into three subgroups (MC, MNC, FNC) and differences between them were identified by
analysis of variance (ANOVA). These groups did not differ significantly (p>0.05) in age, BMI,
LS, or TPF BMD at either time 1 or time 2; however, significant differences (p<0.05) were
51

found for height and weight at time 1, and for WB and TF BMD, %BF, LBM, and FM measures
at time 1 and time 2. FNC were significantly shorter and possessed less LBM, but had greater
%BF and FM compared to MC and MNC. FNC were also significantly lower in weight, WB,
and TF BMD than MNC, but not MC. Several comparisons did not reach the a priori level of
statistical significance (p<0.05); however, trends tended to appear among some results. In
comparisons of TPF BMD of MNC and FNC, resulting p-values were 0.065 and 0.073 for time 1
and time 2, respectively. This trend suggests that if a larger sample of males and females were
included, BMD values for the TPF may have been significantly higher among MNC compared to
FNC. When comparisons were made between MC and MNC for values of TF BMD, there were
marked differences in level of significance between time 1 and time 2 (p=0.181, p=0.090,
respectively). Although the value for testing at time 2 may indicate a trend toward MC having
lower TF BMD than MNC, it also suggests that it may be more difficult to attain accuracy in
repeat measurements of the forearm. Comparisons between LS BMD of MC and MNC
produced a p value of 0.090 and 0.075 for time 1 and time 2, respectively. With a larger sample
size and additional repeated measures, this value may have possibly reached statistical
significance, with MC having a lower LS BMD than MNC. To support this notion, several
studies have shown that male cyclists have lower BMD, particularly of the LS, when compared
to controls (Fiore et al., 1996; Rico et al., 1993; Sabo et al., 1996; Stewart & Hannan, 2000).
Thus, data from this study show that in general, FNC and MC appear to have similar BMD
values.
Based on findings from the present study, the QDR-4500A DXA at Virginia Tech is a reliable
and valid device for measuring BMD and body composition in the young-adult population.
Principal advantages of this technique include its independence from assumptions regarding
52

relationships among body components and its use of radiologic principles for the direct
determination of bone and soft tissue composition.
References
Adams, JE. Osteoporosis and bone mineral densitometry. Curr Opin Radiol. 1992; 4(6):11-20. Chilibeck P, Calder A, Sale DB, Webber C. Reproducibility of dual-energy x-ray absorptiometry. Can Assoc Radiol J. 1994;45(4):297-302. Davey DA. Osteoporosis in clinical practice--bone densitometry and fracture risk. S Afr Med J. 1998;88(11):1419-23. Fiore CE, Dieli M, Vintaloro G, Gibilaro M, Giacone G, Cottini E. Body composition and bone mineral density in competitive athletes in different sports. Int J Tissue React. 1996;18 (4-6):121-4. Fogelman I, Blake GM. Different approaches to bone densitometry. J Nucl Med. 2000;41(12): 2015-25. Franck H, Munz M. Total body and regional bone mineral densitometry (BMD) and soft tissue measurements: correlations of BMD parameter to lumbar spine and hip. Calcif Tissue Int. 2000;67:111-5. Gutin B, Litaker M, Islam S, Manos T, Smith C, Treiber F. Body-composition measurement in 9-11-y-old children by dual-energy X-ray absorptiometry, skinfold-thickness measurements, and bioimpedance analysis. Am J Clin Nutr. 1996;63:287-92. Haarbo J, Gotfredsen A, Hassager C, Christiansen C. Validation of body composition by dual energy x-ray absorptiometry (DEXA). Clin Physiol. 1991;11:331-41. Hagiwara S, Engelke K, Yang SO, Dhillon MS, Guglielmi G, Nelson DL, Genant HK. Dual X- ray absorptiometry forearm software: accuracy and intermachine relationship. J Bone Miner Res. 1994;9(9):1425-7. Heilmann P, Wüster C, Prolingheuer C, Götz M, Ziegler R. Measurement of forearm bone mineral density: comparison of precision of five different instruments. Calcif Tissue Int. 1998;62:383-7. Heitmann BL. Impedance: a valid method in assessment of body composition? Eur J Clin Nutr. 1994;48:228-40. Herd RJ, Blake GM, Parker JC, Ryan PJ, Fogelman I. Total body studies in normal British women using dual energy X-ray absorptiometry. Br J Radiol. 1993;66(784):303-8.
53

Kitano T, Kitano N, Inomoto T, Futatsuka M. Evaluation of body composition using dual- energy X-ray absorptiometry, skinfold thickness and bioelectrical impedance analysis in Japanese female college students. J Nutr Sci Vitaminol. 2001;47:122-5. Kyle UG, Genton L, Mentha G, Nicod L, Slosman DO, Pichard C. Reliable bioelectrical impedance analysis estimate of fat-free mass in liver, lung, and heart transplant patients. J Parenter Enteral Nutr. 2001;25(2):45-51. Larcos G, Wahner HW. An evaluation of forearm bone mineral measurement with dual- energy X-ray absorptiometry. J Nucl Med. 1991;32(11):2101-6. Laskey MA, Flaxman ME, Barber RW, Trafford S, Hayball MP, Crisp AJ, Compston JE. Comparative performance in vitro and in vivo of Lunar DPX and Hologic QDR-1000 dual energy X-ray absorptiometers. Br J Radiol. 1991;64:1023-9 Lees B, Stevenson JC. An evaluation of dual-energy X-ray absorptiometry and comparison with dual-photon absorptiometry. Osteoporos Int. 1992;2(3):146-52. Levenhagen DK, Borel MJ, Welch DC, Piasecki JH, Piasecki DP, Chen KY, Flakoll PJ. A comparison of air displacement plethysmography with three other techniques to determine body fat in healthy adults. J Parenter Enteral Nutr. 1999;23(5):293-9. Lilley J, Walters BG, Heath DA, Drolc Z. In vivo and in vitro precision for bone density measured by dual-energy x-ray absorption. Osteoporos Int. 1991;1:141-146. Lukaski HC. Soft tissue composition and bone mineral status: evaluation by dual-energy x-ray absorptiometry. J Nutr. 1993;123:438-443. Lukaski HC, Johnson PE, Bolonchuk WW, Lykken GI. Assessment of fat-free mass using bioelectrical impedance measurements of the human body. Am J Clin Nutr. 1985;41:810-7. Lukaski HC, Bolonchuk WW, Hall CB, Siders WA. Validation of tetrapolar bioelectrical impedance method to assess human body composition. J Appl Physiol. 1986;60(4):1327-32. Madsen OR, Jensen J-EB, Sorensen OH. Validation of a dual energy x-ray absorptiometer: measurement of bone mass and soft tissue composition. Eur J Appl Physiol. 1997;75:554-8. Nieves JW, Cosman F, Mars C, Lindsay R. Comparative assessment of bone mineral density of the forearm using single photon and dual X-ray absorptiometry. Calcif Tissue Int. 1992;51 (5):352-5. Okasora K, Takaya R, Tokuda M, Fukunaga Y, Oguni T, Tanaka H, Konishi K, Tamai H. Comparison of bioelectrical impedance analysis and dual-energy X-ray absorptiometry for assessment of body composition in children. Pediar Int. 1999;41(2):121-5.
54

Orwoll ES, Oviatt SK. Longitudinal precision of dual-energy x-ray absorptiometry in a multi- center study. The Nafarelin/Bone Study Group. J Bone Miner Res. 1991;6(2):191-7. Overton TR, Wheeler GD. Bone mass measurements in the distal forearm using dual-energy X- ray absorptiometry and γ-ray computed tomography: a longitudinal, in vivo comparative study. J Bone Miner Res. 1992;7(4):375-81. Pietrobelli A, Formica C, Wang Z, Heymsfield SB. Dual-energy X-ray absorptiometry body composition model: a review of physical concepts. Am J Physiol. 1996;271 Endocrinol. Metab. 34):E941-E951. Pietrobelli A, Wang Z, Formica C, Heymsfield SB. Dual-energy x-ray absorptiometry: fat estimation errors due to variation in soft tissue hydration. Am J Physiol. 1998;274 (Endocrinol. Metab. 37):E808-E816. Pritchard JE, Nowson CA, Strauss BJ, Carlson JS, Kaymakci B, Wark JD. Evaluation of dual energy x-ray absorptiometry as a method of measurement of body fat. Eur J Clin Nutr. 1993;47:216-28. Rico H, Revilla M, Villa LF, Gomez-Castresana F, Alvarez del Buergo M. Body composition in postpubertal boy cyclists. J Sports Med Phys Fitness. 1993;33(3):278-81. Roubenoff R. Applications of bioelectrical impedance analysis for body composition to epidemiologic studies. Am J Clin Nutr. 1996;64(3 Suppl):459S-462S. Ryan PJ, Blake GM, Fogelman I. Measurement of forearm bone mineral density in normal women by dual-energy X-ray asorptiometry. Br J Radiol. 1992;65(770):127-31. Sabo D, Bernd L, Pfeil J, Reiter A. Bone quality in the lumbar spine in high-performance athletes. Eur Spine J. 1996;5(4):258-63. Sardinha LB, Lohman TG, Teixeira PJ, Guedes DP, Going SB. Comparison of air displacement plethysmography with dual-energy X-ray absorptiometry and 3 field methods for estimating body composition in middle-aged men. Am J Clin Nutr. 1998;68:786-93. Stewart AD, Hannan J. Total and regional bone density in male runners, cyclists, and controls. Med Sci Sports Exerc. 2000;32(8):1373-7. Svendsen OL, Marslew U, Hassager C, Christiansen C. Measurements of bone mineral density of the proximal femur by two commercially available dual energy X-ray absorptiometric systems. Eur J Nucl Med. 1992;19:41-6. Tataranni PA, Pettitt DJ, Ravussin, E. Dual energy X-ray absorptiometry: intermachine variability. Int J Obes Relat Metab Disord. 1996;20(11):1048-50.
55

Tothill P, Avenell A, Love J, Reid DM. Comparisons between Hologic, Lunar and Norland dual-energy X-ray absorptiometers and other techniques used for whole-body soft tissue measurements. Eur J Clin Nutr. 1994;48(11):781-94. Wagner DR, Heyward VH. Techniques of body composition assessment: a review of laboratory and field methods. Res Q Exerc Sport. 1999;70(2):135-49.
56

CHAPTER IV
RELIABILITY AND VALIDITY OF DISTAL TIBIA MEASURES BY DXA
57

Abstract
Regional measurements of bone mineral density (BMD) by dual energy X-ray absorptiometry
(DXA) have not been well established, although measures of the distal tibia (DT), specifically,
may be beneficial for identifying individuals at risk for stress fractures of the lower leg. The
reliability and validity of the QDR-4500A DXA (Hologic Inc., Bedford, MA) at Virginia Tech in
measuring BMD of the DT were investigated in this study. Twenty-three young-adult
(age=22.5±1.8 years) males (n=13) and females (n=10) had DXA scans of the DT completed at
two time-points, 5-7 days apart. Correlation coefficients and coefficients of variation (CV%)
were calculated to assess the reliability of measures. Significant differences were not found
(p>0.05) between repeat measurements. The correlation was 0.804 (p<0.01) and the CV% was
4.63%. Subjects with >5% variability between measurements were excluded as outliers (n=6),
and statistical analyses were re-calculated. The correlation without outliers was 0.971 (p<0.01)
and CV% was 4.29%. The validity of DXA to perform DT measures was also assessed by
comparing whole body (WB) BMD with DT BMD, as subjects with higher WB BMD should
also have higher DT BMD. In two repeated measurements of DT BMD and WB BMD the
correlations were 0.597 and 0.584 (p<0.01). When outliers were excluded, correlations were
0.689 and 0.715 (p<0.01). In conclusion, the QDR-4500A DXA is a reliable and valid technique
for measuring DT BMD in the young-adult population, and may prove useful as an alternative
measurement site in cases of degenerative disease as well as for identifying individuals at risk for
stress fractures.
KEY WORDS: BONE MINERAL DENSITY, DISTAL TIBIA, DUAL ENERGY X-RAY
ABSORPTIOMETRY, RELIABILITY, VALIDITY
58

Introduction
Dual energy X-ray absorptiometry (DXA) technology has been well established for bone
mineral density (BMD) measures of the whole body (WB), lumbar spine, and hip; however, the
reliability of other regional measures, such as the distal tibia (DT), has not been confirmed. Such
measurements may be of interest when BMD and content values are not interpretable at the spine
because of osteoarthritis, scoliosis, or aortic calcification, or at the femur because of
osteoarthritis or hip prostheses. Evaluation of DT BMD could provide information on the
cortical/trabecular ratio in a single weight-bearing bone (Casez et al., 1994).
In addition, there is a body of literature regarding stress fractures of the lower leg among
athletes and military recruits and the potential risk factors that may predispose an individual to
this type of injury. Reliable and valid measures of DT BMD by DXA may prove useful in
helping to identify individuals at risk. Stress fractures are indeed a common overuse injury in
the athletic population, particularly among runners (Bennell et al., 1996; Crossley et al., 1999;
Korpelainen et al., 2001; Monteleone, 1995), and also a costly problem among military recruits
(Beck et al., 2000; Gemmell, 2002; Pester et al., 1992). There are many causes of stress
fractures, including both intrinsic and extrinsic factors (Korpelainen et al., 2001). A multitude of
potential risk factors have been proposed, including: bone geometry, biomechanical variants,
limb length, smaller, weaker muscles (Beck et al., 2000), age, gender, race, hormonal factors,
footwear, arch structure (Korpelainen et al., 2001), excessive training (Bennell et al., 1996),
fitness level (Monteleone, 1995), and low bone density (Bennell et al., 1996; Dugowson et al.,
1991; Lauder et al., 2000; Pouilles et al., 1989).
When comparing groups of males with and without stress fractures, differentiating risk factors
between these groups are typically nonexistent (Bennell et al., 1996; Crossley et al., 1999);
59

therefore, occurrence is difficult to predict. This may imply that other contributory factors not
included in these studies are more important in men. However, several risk factors have been
identified as positive predictors of stress fractures in women, including: later age of menarche,
fewer menses per year since menarche, less lean mass in the lower limb, lower fat diet,
discrepancy in leg length (Bennell et al., 1996; Korpelainen et al., 2001), lower lumbar spine and
foot bone density (Korpelainen et al., 2001), less total body bone mineral content, and lower total
bone density (Bennell et al., 1996; Dugowson et al., 1991; Lauder et al., 2000; Pouilles et al.,
1989).
Although bone density values did not predict stress fracture occurrence in men, (which may
be due to higher regional bone density in men compared with women), the possibility that lower
bone density is a risk factor in male athletes cannot be excluded (Bennell et al., 1996).
Moreover, because low BMD has been cited by several authors as a risk factor for stress
fractures among women (Bennell et al., 1996; Dugowson et al., 1991; Korpelainen et al., 2001;
Lauder et al., 2000; Pouilles et al., 1989), it is essential to establish the reliability and validity of
DXA technology to measure DT BMD. Therefore, the purpose of this study was to investigate
the capabilities of the Hologic QDR-4500A DXA at Virginia Tech for measurement of DT
BMD.
Materials and Methods
Reliability study participants
Thirteen males and ten females (N=23), aged 18 to 26 were recruited from the Virginia Tech
campus (Blacksburg, VA, U.S.A.) and surrounding communities to participate in this study
testing the reliability of DT BMD measures by the QDR-4500A DXA (Hologic Inc., Bedford,
60

MA, U.S.A.) housed in the Bone metabolism, Osteoporosis, and Nutrition Evaluation (BONE)
Laboratory. Electronic-mail announcements and word-of-mouth were used as recruitment tools.
This research project was approved by the Institutional Review Board for Research Involving
Human Subjects at Virginia Tech. Each participant was given an Informed Consent Form and a
Medical History Form (Appendices E and F) to review at least 24 hours in advance of the first
testing session (time 1). Prior to participating in any procedure, participants signed the Informed
Consent Form and completed the Medical History Form. Through this medical history, female
participants who reported pregnancy, were unsure of pregnancy, or had irregular menstrual
cycles were excluded. No other exclusion criteria for males or females existed.
Procedures
All procedures were completed in the BONE Laboratory, Room 229 Wallace Hall. Testing
sessions were conducted at two timepoints: (1) baseline and (2) follow-up (approximately 5 to 7
days after the baseline session). Each testing session required ~15 minutes for completion. Each
testing session involved measurement of body height and weight, using a wall-mounted
stadiometer, and digital scale, respectively. Participants were then appropriately positioned on
the DXA table for completion of one WB DXA scan and one DT DXA scan of the non-dominant
leg (version 8.25a, 2000, Whole Body Analysis software, Hologic, Inc., Bedford, MA, U.S.A).
All procedures were conducted by a Licensed Radiographic Technologist- Limited in the
Commonwealth of Virginia
Statistical analyses
Means and standard deviations (SD) were computed for each variable of interest. Paired
samples t-tests (t), Pearson correlation coefficients (r), coefficients of variation (CV%), and
Bland-Altman analyses were computed to examine the reliability of repeated measurements of
61

DT BMD by DXA. Pearson correlation coefficients were calculated to determine the validity of
DXA by comparison of WB BMD to DT BMD. Statistical analyses were completed using the
Statistical Package for Social Sciences (SPSS, version 10.0 for windows, 1999, SPSS Inc.,
Chicago, IL, U.S.A.).
Results
Subject characteristics are displayed in Table I. Table II presents BMD values (g/cm2) for DT
BMD measurements of all subjects at time 1 and time 2. Differences between repeat
measurements were not statistically significantly different (t=0.072, p>0.05). The correlation
coefficient was 0.804 (p<0.01), and the CV% was 4.63%. Several subjects showed >5%
variability between repeat measurements. These outliers (n=6) were excluded, and statistical
analyses for reliability were repeated (Table III). With outliers excluded, differences between
repeat measurements were not significantly different (t=0.091, p>0.05). The correlation
coefficient was 0.971 (p<0.01), and the CV% was 4.29%. Figures 1 and 3 illustrate the
correlation between DXA measurements of the DT at time 1 and time 2, with all subjects
included and with outliers excluded, respectively. Bland-Altman plots in Figures 2 and 4 display
the bias of measurement two (time 2) compared with measurement one (time 1), the 95%
confidence interval (95%CI) of the bias, and the 95% limits of agreement (95%LofA) between
repeat measures (broken red lines noting that 95% of the differences will fall within this range),
for all subjects and with outliers excluded, respectively.
Validity of DXA was assessed by comparing two repeated measures of WB BMD with DT
BMD, as those with higher measures of WB BMD should correlate with those having higher DT
BMD (Table IV). The relationship between DT and WB BMD for all subjects at time 1 and time
2 was statistically significant (r=0.597, 0.584, respectively, both p<0.01). When repeating these
62

calculations with outliers of the group excluded (see Table V), the relationship was stronger
(r=0.689, 0.715, for time 1 and time 2, respectively, both p<0.01).
63

Table I. Subject characteristics*
Variable Mean ±SD Range
Age (y)
Height (in)
Weight (lbs)
22.5
68.4
158.5
1.8
4.4
36.1
18.0-26.0
61.0-75.0
116.0-256.0
BMIa 23.7 3.3 19.7-32.6
*N=23 a Body Mass Index, [weight (lbs) % 705 + height (in)2]
Table II. Mean distal tibia bone mineral density (BMD) values (g/cm2) for all subjects* at time 1 and time 2
Variable Mean ± SD Range
DTa1 1.111 0.114 0.893-1.345
DT2 1.084 0.097 0.850-1.252
* N=23 a Distal tibia
Table III. Mean distal tibia bone mineral density (BMD) values (g/cm2) with outliers excluded*
at time 1 and time 2
Variable Mean ±SD Range
DTa1 1.072 0.088 0.893-1.238
DT2 1.081 0.079 0.888-1.210
* n=17 a Distal tibia
64

Table IV. Mean distal tibia (DT) and whole body (WB) bone mineral density (BMD) values (g/cm2) for all subjects* at time 1 and time 2
Variable Mean ± SD Range
DTa1 1.111 0.114 0.893-1.345
WBb1 1.205 0.103 1.010-1.433
DT2 1.084 0.097 0.850-1.252
WB2 1.206 0.106 1.013-1.455
* N=23 a Distal tibia b Whole body
Table V. Mean distal tibia (DT) and whole body (WB) bone mineral density (BMD) measures (g/cm2) with outliers excluded* at time 1 and time 2
Variable Mean ± SD Range
DTa1 1.072 0.088 0.893-1.238
WBb1 1.195 0.114 1.010-1.433
DT2 1.081 0.079 0.888-1.210
WB2 1.196 0.118 1.013-1.455
* n=17
a Distal tibia b Whole body
65
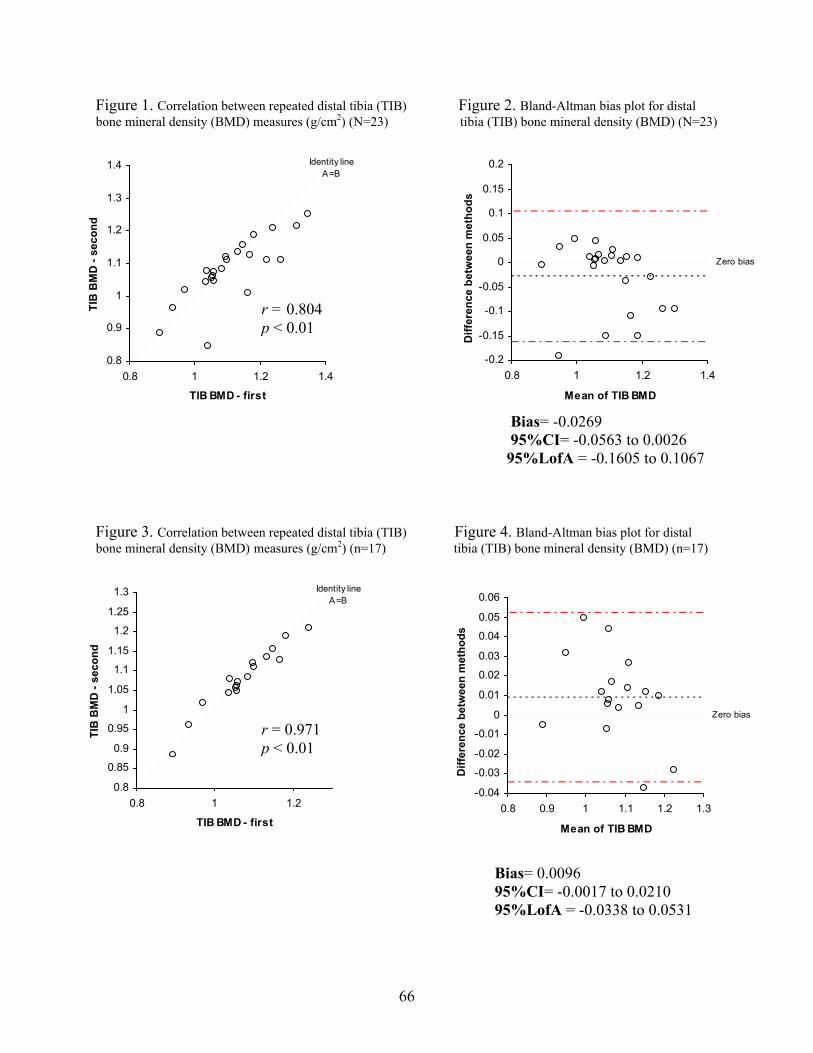
Figure 1. Correlation between repeated distal tibia (TIB) Figure 2. Bland-Altman bias plot for distal bone mineral density (BMD) measures (g/cm2) (N=23) tibia (TIB) bone mineral density (BMD) (N=23)
Identity line A=B
0.8
0.9
1
1.1
1.2
1.3
1.4
0.8 1 1.2 1.4
TIB BMD - first
TIB
BM
D -
seco
nd
r = 0.804 p < 0.01
Zero bias
-0.2
-0.15
-0.1
-0.05
0
0.05
0.1
0.15
0.2
0.8 1 1.2 1.4
Mean of TIB BMD
Diff
eren
ce b
etw
een
met
hods
Bias= -0.0269 95%CI= -0.0563 to 0.0026 95%LofA = -0.1605 to 0.1067
Figure 3. Correlation between repeated distal tibia (TIB) Figure 4. Bland-Altman bias plot for distal bone mineral density (BMD) measures (g/cm2) (n=17) tibia (TIB) bone mineral density (BMD) (n=17)
Identity line A=B
0.8
0.85
0.9
0.95
1
1.05
1.1
1.15
1.2
1.25
1.3
0.8 1 1.2
TIB BMD - first
TIB
BM
D -
seco
nd
r = 0.971 p < 0.01
Zero bias
-0.04
-0.03
-0.02
-0.01
0
0.01
0.02
0.03
0.04
0.05
0.06
0.8 0.9 1 1.1 1.2 1.3
Mean of TIB BMD
Diff
eren
ce b
etw
een
met
hods
Bias= 0.0096 95%CI= -0.0017 to 0.0210 95%LofA = -0.0338 to 0.0531
66

Discussion
Measures of reliability and validity of ti DXA have not been well established;
al
e in
atistical analyses performed on the repeated measures by the QDR-4500A DXA in this
lity among some DT BMD measurements between
a
ore
difficult than for other regions.
bial BMD by
however, evaluation of DT BMD measures may be beneficial in a number of situations. The
tibial diaphysis is comprised of nearly all cortical bone, while the epiphysis contains substanti
amounts of highly active trabecular bone. When BMD values of the spine or hip are not easily
interpreted due to disease or degenerative changes, measurements of DT BMD may provide
valuable information regarding mineral distribution and the ratio of cortical to trabecular bon
a weight-bearing bone. Measurement of DT BMD may also be helpful in the prediction of stress
fracture among high-risk populations, as low BMD may play a causative role in this overuse
injury.
The st
study demonstrate the reliability of this device for measurement of DT BMD. There were no
significant differences between repeat measurements (p>0.05), and the correlation was 0.804
(p<0.01), with a CV% of 4.628%. There is a paucity of published data regarding precision of
tibial BMD measurements. Only one report of mineral distribution along the distal third of the
tibia exists in which CV% of 1.9% for measures of the distal epiphysis, and 2.1% for the
diaphysis are reported (Casez et al., 1994).
After further analysis of data, >5% variabi
time 1 and time 2 existed; therefore, these subjects were excluded as outliers (n=6), and
statistical analyses for reliability were performed again. This new data set, with outliers
excluded, produced a higher correlation between repeat measures (r= 0.971, p<0.01), and
slightly lower CV%. This suggests that obtaining accurate measures of DT BMD may be m
67

One explanation for slightly less accurate analysis of DT BMD by the QDR-4500A DXA
compared to WB measures, for example, is the use of forearm software for the analysis of DT
sis
92;
higher DT
ificant
a Tech is
y be
BMD scans. CV% for repeated measures of the QDR-4500A DXA at Virginia Tech for analy
of forearm measures was 1.094% (Chapter III). Other published data has reported the CV% of
forearm measures by DXA, as ranging from 0.55-2.43% for various regions of the forearm
(ultradistal, mid-distal, proximal one-third) (Eckert et al., 1996; Hagiwara et al., 1994; Heilmann
et al., 1998; Larcos & Wahner, 1991; Lefobb et al., 1992; Nieves et al., 1992; Ryan et al., 19
Weinstein et al., 1991). Therefore, use of forearm software for analysis of DT BMD scans may
produce slightly less accurate results compared to BMD measures of the forearm.
The validity of DT BMD measures by DXA was also assessed by comparing repeated
measures of WB with DT BMD, as those with a higher WB BMD should also have
BMD. Correlations between these two repeated measures in all subjects established a sign
relationship (r=0.597, 0.584, both p<0.01), which was found to be somewhat stronger when
outliers of the group were excluded from the analysis (r=0.689, 0.715, both, p<0.01).
Results from this study have provided novel information regarding the utility of DXA in
regional BMD measurement. It can be concluded that the QDR-4500A DXA at Virgini
a reliable and valid device for the measurement of DT BMD. DXA measures of the tibia ma
beneficial in determining skeletal state in the presence of degenerative disease, as well as in
predicting stress fractures of the lower extremities in athletes, military recruits, and other high-
risk populations.
References
Beck TJ, Ruff CB, Shaffer RA, Betsinger K, Trone DW, Brodine SK. Stress fracture in military recruits; gender differences in muscle and bone susceptibility factors. Bone. 2000;27(3): 437-44.
68
Bennell KL, Malcolm SA, Thomas SA, Re er PD, Ebeling PR, Wark, JD. Risk factors for stress fractures in track and field athletes. A twelve-month prospective study. Am J Sports Med. 1996;24(6):810-8.
-ray absorptiometry in normal women and in patients with vertebral osteoporosis or
es BW. Ground reaction forces, bone characteristics, and tibial stress fracture in male runners. Med Sci Sports Exerc. 1999;31(8):1088-93.
575-9.
ict of legislation. J R Soc Med. 2002;95:23-7.
l X- rptiometry forearm software: accuracy and intermachine relationship. J Bone Miner
Res. 1994;9(9):1425-7.
C, Prolingheuer C, Götz M, Ziegler R. Measurement of forearm bone mineral density: comparison of precision of five different instruments. Calcif Tissue Int.
pakka J, Siira P, Hulkko A. Risk factors for recurrent stress fractures in athletes. Am J Sports Med. 2001;29(3):304-10.
y etry. J Nucl Med. 1991;32(11):2101-6.
een -duty Army women. Arch
Phys Med Rehabil. 2000;81(1):73-9.
nergy x-ray absorptiometry of the forearm: reproducibility and correlation with single-photon absorptiometry. J Bone
athlete. Orthop Clin North Am. 1995;26(3):423-32.
id SJ, Brukn
Casez JP,Troendle A, Lippuner K, Jaeger P. Bone mineral density at distal tibia using dual- energy X primary hyperparathyroidism. J Bone Miner Res. 1994;9(12):1851-7. Crossley K, Bennell KL, Wrigley T, Oak Dugowson CE, Drinkwater BL, Clark JM. Nontraumatic femur fracture in an oligomenorrheic athlete. Med Sci Sports Exerc. 1991;23(12):1323-5. Eckert P, Casez JP, Thiebaud D, Schnyder P, Burckhardt P. Bone densitometry of the forearm: comparison of single-photon and dual-energy x-ray absorptiometry. Bone. 1996;18(6): Gemmell IM. Injuries among female army recruits: a confl Hagiwara S, Engelke K, Yang SO, Dhillon MS, Guglielmi G, Nelson DL, Genanat HK. Dua ray abso Heilmann P, Wüster 1998;62:383-7. Korpelainen R, Orava S, Kar Larcos G, Wahner HW. An evaluation of forearm bone mineral measurement with dual-energ X-ray absorptiom Lauder TD, Dixit S, Pezzin LE, Williams MV, Campbell CS, Davis GD. The relation betw stress fractures and bone mineral density: evidence from active Leboff MS, Fuleihan GE, Angell JE, Chung S, Curtis K. Dual-e Miner Res. 1992;7(7):841-6. Monteleone GP Jr. Stress fractures in the
69

Nieves JW, Cosman F, Mars C, Lindsay R. Comparative assessment of bone mineral density of and dual X-ray absorptiometry. Calcif Tissue Int.
1992;51(5):352-5.
ester S, Smith PC. Stress fractures in the lower extremities of soldiers in basic training. Orthop Rev. 1992;21(3):297-303.
ung ess fractures. Bone. 1989;10(2):105-8.
y absorptiometry. Br J Radiol. 1992;65(770):127-31.
;49(5):313-6.
the forearm using single photon P Pouilles JM, Bernard J, Tremollieres F, Louvet JP, Ribot C. Femoral bone density in yo male adults with str
Ryan PJ, Blake GM, Fogelman women by dual-energy X-ra
I. Measurement of forearm bone mineral density in normal
orptiometry versus single Weinstein RS, New KD, Sappington LJ. Dual-energy X-ray abs photon absorptiometry of the radius. Calcif Tissue Int. 1991
70

CHAPTER V
INFLUENCE OF NAVEL JEWELRY ON BONE MINERAL DENSITY MEASURES OF
THE LUMBAR SPINE
71

Abstract
Metallic jewelry inserted at the navel has the potential to interfere with bone mineral density
(BMD) scans of the lumbar spine (LS). The purpose of this study was to examine the influence
of navel jewelry on analyses of LS BMD measurements conducted by dual energy X-ray
absorptiometry (DXA; QDR-4500A, Hologic, Inc.). DXA scans of the anthropomorphic
phantom spine (PS) were completed with jewelry placements of: (1) PS alone (no jewelry); (2)
PS with navel ring over L4; (3) PS with ring over L3/L4; (4) PS with navel barbell over L4; (5) PS
with barbell over L3/L4. Eleven scans were completed for each placement. One ring and one
barbell, each comprised of titanium plated surgical steel, were used in these scans. Analysis of
variance indicated that the mean LS BMD (g/cm2) values were statistically significantly greater
(p < 0.0001) with the navel ring, despite placement (+4.36% and +4.11% for placements 2 and 3,
respectively) and despite manual adjustment to remove the metal artifact (+1.03% and +0.60%
for placements 2 and 3, respectively) compared to the PS alone. Mean LS BMD values were
statistically significantly greater (p < 0.0001) with the barbell, despite placement (+3.40% and
+3.23% for placements 4 and 5, respectively) and only despite manual adjustment for placement
4 (+0.67%) compared to the PS alone. Navel jewelry interferes with measurement of LS BMD.
Ability to manually adjust analyses for such metal artifacts may depend on the jewelry shape and
placement.
KEY WORDS: BODY PIERCING, BONE MINERAL DENSITY, DUAL ENERGY X-RAY
ABSORPTIOMETRY, METAL ARTIFACTS, NAVEL JEWELRY
72

Introduction
Orthopedic metal prostheses affect measures of body composition including bone mass (Body
Art 1994 Reader Survey). In humans, a titanium femoral implant increased bone mineral density
(BMD) by nearly 27% when placed on the femoral area (Madsen et al., 1999). Among dogs,
BMD was increased by >5% with the addition of a titanium implant on bone specimens (Markel
et al., 1992). Although the addition of these implants did not impact the reliability of BMD
measurements (Markel et al., 1992), absolute BMD values were erroneously altered. Because
the use of orthopedic implants are reserved for individuals with established bone complications,
the likelihood of misinterpretation of BMD scans due to these metal implants is minimal.
However, another type of metal artifact – body piercing – has become more prevalent among
Americans (Hadfield-Law L, 2001), and has the potential to influence BMD results.
Millner and Eichold found that body piercing was prevalent among individuals aged 19
to 55 years (2001). Among respondents to a survey conducted by Body Art magazine, 79% of
individuals with a body piercing were ≥29 years of age (Body Art 1994 Reader Survey). At a
northeastern university, 51% of male and female students who completed surveys had at least
one body piercing (Mayers et al., 2002). Moreover, the prevalence of body piercing among these
young-adult women was higher compared to these men (Mayers et al., 2002). Despite an
individual’s age or gender, metal artifacts from body piercing have the potential to interfere with
accurate measurement of BMD. While a single set of pierced earrings, for example, has little
impact on total body BMD measurements (Hologic, Inc., 1998), a navel ring or barbell spans a
wide area of the lumbar spine (LS) relative to the total amount of bone captured by the scan.
Thus, the purpose of this study was to examine the impact of navel jewelry on analyses of LS
BMD measurements conducted by dual energy X-ray absorptiometry (DXA). It was
73

hypothesized that the presence of navel jewelry in a DXA scan of the LS would interfere with
accurate measurement of BMD at this body site.
Materials and Methods
Materials
Previously completed LS BMD scans by DXA (QDR-4500A, Hologic, Inc., Bedford, MA,
U.S.A.) of individuals with pierced navels were evaluated to locate the most common position of
navel rings and barbells. Pierced navel jewelry appeared solely over the fourth lumbar vertebrae
(L4) in some of these scans and spanned portions of the third lumbar vertebrae (L3) and L4 in the
remaining scans. Thus, two positions for jewelry placement for the current study were
established.
Two common shapes of jewelry used in navel piercing were selected, including a ring (or
loop) and a barbell. These items were purchased at a local novelty store (Spencer Gifts,
Christiansburg, VA, U.S.A.). Both the ring (~½”) and barbell (~¾”) were 14 gauge (14G) in
thickness and comprised of titanium plated surgical steel (Made in China and Korea,
respectively).
The anthropomorphic spine phantom (#7316, Hologic, Inc., Bedford, MA, U.S.A.) was used
for all measurements. The bone area, bone mineral content, and BMD of this phantom spine
(PS) are 52.3 cm2, 51.7 g, and 0.989 g/cm2, respectively, when used with this fan-beam DXA
model.
Procedures
All procedures were carried out in the Bone metabolism, Osteoporosis, and Nutrition
Evaluation (BONE) Laboratory, Virginia Polytechnic Institute and State University (Blacksburg,
VA, U.S.A.). Scans were completed on February 1, 2002. In sequence, five DXA scans of the
74

PS were conducted, including (1) PS alone; (2) PS with ring over L4; (3) PS with ring over L3
and L4; (4) PS with barbell over L4; (5) PS with barbell over L3 and L4 (please see Figure for
jewelry placements). Each of these five scans (1 set) was repeated 11 times for a total of 55
scans. The PS was repositioned 11 times or between each set of scans. Scans were completed
using the AP LS scan selection in “fast array” mode as recommended for human testing in a
clinical setting (7). Standard quality control procedures were completed on the testing day. The
PS has been previously scanned 296 times, producing a coefficient of variation (CV) of 0.36%.
All scans were analyzed using the standard spine protocol (version 8.26f:3, Hologic, Inc.,
Bedford, MA, U.S.A.). For the PS alone scans, no manual adjustments were made during these
analyses. For all remaining scans (placements 2-5 with jewelry), manual editing as
recommended by the QDR-4500A manufacturer (Hologic, Inc., 1998) was completed to remove
the overlying jewelry shape. Scans were completed and analyzed by the same investigator.
Statistical analyses
Means ± standard deviations (SD) were computed for the 11 scans within each of the five
placement groups. In addition, means ± SD were calculated for the manually adjusted scans
(from placements 2-5). Analysis of variance (ANOVA) was conducted to identify differences in
mean BMD (g/cm2) between the two ring placements, two manually adjusted results, and the PS
alone as well as between the two barbell placements, two manually adjusted results, and the PS
alone. Post-hoc tests were completed to further explore statistically significant differences
between groups for each ANOVA. Statistical analyses were completed using the Statistical
Package for Social Sciences (SPSS, version 10.0 for windows, 1999, SPSS Inc., Chicago, IL,
U.S.A.).
75

Results
Tables 1 and 2 present ANOVA results from evaluation of the ring placements and manual
adjustments and from examination of the barbell placements and manual adjustments,
respectively. Means ± SD and confidence intervals for each of the five placements as well as for
the four manually adjusted scan results are included in these tables.
Placement of the ring (over L4 or spanning L3/L4) made no difference in BMD measurements.
Manual adjustment for the ring artifact, despite placement, produced the same BMD values.
Although manual adjustment of the scans produced significantly different results from the scans
with the unadjusted ring artifacts, these adjusted BMD values were still significantly different
from the PS alone. Ring placement over the L4 and spanning L3/L4 produced BMD values that
were 4.36% and 4.11% greater compared to the PS alone. After manual adjustment of these
scans, BMD values were 1.03% and 0.60% greater compared to the PS alone (L4 and L3/L4
placements, respectively).
For the barbell, inclusion of the metal in the scan, regardless of placement, produced similar
results. Manual adjustment for the barbell also yielded similar results, despite placement. While
inclusion of the barbell in the DXA scans produced significantly greater BMD values compared
to the PS alone (+3.40% for L4 placement and +3.23% for L3/L4 placement), manual adjustment
for these BMD values varied by placement compared to the PS alone. Manual adjustment of the
barbell in the L4 placement produced a significantly different mean BMD value (+0.67%)
compared to PS alone, whereas manual adjustment of the barbell in the L3/L4 placement did not
(+0.19%).
76

Discussion
Navel jewelry interferes with measurement of BMD at the LS. Because many individuals,
potentially even persons with compromised BMD status, have pierced navels, these metal
artifacts should be considered when completing BMD scans. Although repeatability of LS DXA
scans were not influenced by navel jewelry, a navel ring or barbell may interfere with a DXA
scan to the degree that LS BMD may be incorrectly interpreted as “normal” when, in fact, it is
not. Even when the scan is manually adjusted to correct for navel jewelry, the adjustment may
still produce inaccurate results, depending on the shape of the jewelry and placement of the
jewelry over the LS area.
While some metal artifacts cannot be removed (Madsen et al., 1999) and some likely do not
interfere with the overall results (Hologic, Inc., 1998), body jewelry at the navel should be
removed before the completion of an AP DXA scan at the LS. Because such jewelry is radio-
opaque, failure to take jewelry out of the scan field may result in inaccurate BMD measures.
Such inaccuracies have implication for clinical and research applications involving DXA scans.
In the clinical or research arenas, the individual with a body piercing, such as a navel ring or
barbell, may be unaware of how to remove this jewelry. The clinician or researcher may also be
unfamiliar with body piercing removal. Rather than reschedule a patient or exclude a research
participant with a pierced navel, practitioners may consider becoming educated or skilled at body
piercing removal.
Limitations to this study existed. Only 14G jewelry comprised of titanium plated surgical
steel in loop and barbell shapes was used. Finer gauges, other metals, and varied jewelry shapes
may have produced different results. The PS was used to ensure uniformity in procedures and to
avoid unnecessary radiation exposure in humans; thus, navel jewelry was analyzed only for its
77

influence on LS BMD. Further research is necessary to determine effects of navel jewelry on
total body BMD and in humans. In the current study, only one piece of jewelry was examined;
the influence of metal from multiple pierced body sites on total body BMD is also unknown. In
conclusion, navel jewelry interferes with measurement of LS BMD. Ability to manually adjust
analyses for such metal artifacts may depend on the jewelry shape and placement.
References
Body Art 1994 Reader survey. Body Art 19:34-36 & 20:39-40. Hadfield-Law L. Body piercing: Issues for A&E nurses. Accid Emerg Nurs. 2001;9:14-19. Hologic, Inc. 1998. QDR4500 Acclaim Series Elite User’s Guide. Hologic, Inc., Waltham, MA. Madsen OR, Egsmose C, Lorentzen JS, Lauridsen UB, Sorensen OH. Influence of orthopaedic metal and high-density detection on body composition as assessed by dual- energy X-ray absorptiometry. Clin Physiol. 1999;19:238-245. Markel MD, Morin RL, Roy RG, Gottsauner-Wolf F, Chao EY. Effect of titanium endoprostheses on bone mineral density measurements, using quantitative computed tomography. Am J Vet Res. 1992;53:2105-2108. Mayers LB, Judelson DA, Moriarty BW, Rundell KW. Prevalence of body art (body piercing and tattooing) in university undergraduates and incidence of medical complications. Mayo Clin Proc. 2002;77:29-34. Millner VS, Eichold BH 2001 Body piercing and tattooing perspectives. Clin Nurs Res. 2001; 10:424-441.
END OF TEXT
Address reprint requests to: Sharon M. Nickols-Richardson, Ph.D., R.D., Bone metabolism,
Osteoporosis, and Nutrition Evaluation Laboratory, 229 Wallace Hall, Department of Human
Nutrition, Foods and Exercise, Virginia Polytechnic Institute and State University, Blacksburg,
VA, USA, 24061-0430.
78

Table 1. Analysis of variance for navel ring comparisons.
Navel jewelry placements and adjustments§
Bone mineral density (g/cm2) mean + SD
95% confidence interval for mean
Phantom spine (PS) 0.9958 + 0.0046 (A) 0.9927 – 0.9989
PS with ring over L4† 1.0392 + 0.0035 (B) 1.0368 – 1.0415
PS with ring split between L3‡ and L4 1.0367 + 0.0029 (B) 1.0348 – 1.0387
Adjusted PS with ring over L4 1.0061 + 0.0031 (C) 1.0040 – 1.0082
Adjusted PS with ring split between L3 and L4 1.0018 + 0.0039 (C) 0.9992 – 1.0044
§N = 11 scans per placement. † L4 = 4th lumbar vertebrae. ‡L3 = 3rd lumbar vertebrae.
Means with different letters are statistically significantly different at p < 0.0001 (Scheffe’s post-
hoc test).
79

Table 2. Analysis of variance for navel barbell comparisons.
Navel jewelry placements and adjustments§
Bone mineral density (g/cm2) mean + SD
95% confidence interval for mean
Phantom spine (PS) 0.9958 + 0.0046 (A) 0.9927 – 0.9989
PS with barbell over L4† 1.0297 + 0.0031 (B) 1.0276 – 1.0318
PS with barbell split between L3‡ and L4 1.0280 + 0.0043 (B) 1.0251 – 1.0309
Adjusted PS with barbell over L4 1.0025 + 0.0042 (C) 0.9996 – 1.0053
Adjusted PS with barbell split between L3 and L4 0.9977 + 0.0040 (A,C) 0.9951 –1.0150
§N = 11 scans per placement. † L4 = 4th lumbar vertebrae. ‡L3 = 3rd lumbar vertebrae.
Means with different letters are statistically significantly different at p < 0.0001 (Scheffe’s post-
hoc test).
80
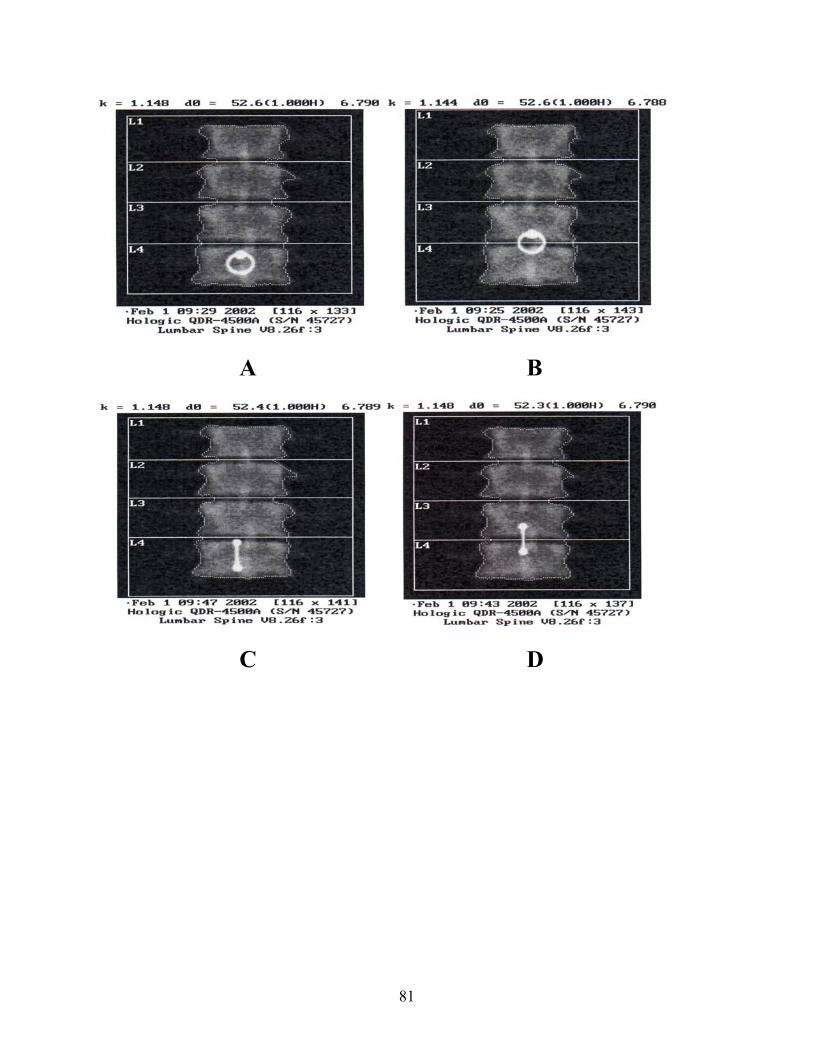
A B
C D
81

Figure. Placement of navel jewelry in phantom spine scan field. Placements 2, 3, 4, and 5 are
presented in A, B, C, and D, respectively.
82

CHAPTER VI
SUMMARY AND FUTURE DIRECTIONS
Reliability and validity of bone mineral density (BMD) and body composition measurements
by the QDR-4500A dual energy X-ray absorptiometer (DXA, Hologic Inc., Bedford, MA) at
Virginia Tech were examined in a group of young-adult males and females (N=24; Chapter III).
Scans of the whole body (WB), lumbar spine (LS), total proximal femur (TPF) and total forearm
(TF) were performed twice, without significant differences between repeated measures. Percent
body fat (%BF), lean body mass (LBM), and fat mass (FM) were determined from whole body
scans and assessed for reliability, while validity for DXA %BF was investigated by comparison
with single frequency bioelectrical impedance analysis (BIA). Significant differences were not
found between repeated body composition measures by DXA. In addition, the validity of DXA
was confirmed as significant differences were not found between %BF measures by DXA and
BIA. A sub-group of male cyclists participating in the study were found to have BMD values
that were generally more similar to female non-cyclists compared to male non-cyclists. This
agrees with other data reporting lower BMD in cyclists and suggests that the mechanical nature
of cycling does not promote gains in BMD.
Reliability and validity of distal tibia (DT) BMD measures by the QDR-4500A DXA at
Virginia Tech were also investigated in a group of 23 young-adult males and females (Chapter
IV). Scans of the DT were performed twice, and significant differences were not found between
repeated measurements. Participants in which >5% variability between DT BMD measures were
observed were excluded (n=6). Statistical analyses were repeated, producing stronger
correlations. In these procedures for DT BMD measurements, forearm software was used, and
although CV% for total forearm measures was <1.1%, the use of such software may have
83

affected the accuracy of DT BMD measures. Validity of DXA in DT measures was established
by comparing WB BMD with DT BMD, as those with higher WB BMD should have higher DT
BMD. Correlations between measures were significant, confirming that the QDR-4500A DXA
is a valid device for measurement of DT BMD.
The influence of navel jewelry on the accuracy of lumbar spine (LS) BMD measures by
DXA, as well as the ability of the operator to correct for errors in LS BMD were analyzed
(Chapter V). The presence of navel jewelry, ring- or bar-shaped, on a spine phantom artificially
and significantly increased BMD of the LS. Manual correction of the scan region by the
operator did not restore LS BMD back to original values in three of four navel jewelry
placements in the LS scan field.
Several overall conclusions may be drawn from these studies. The reliability and validity of
the QDR-4500A DXA at Virginia Tech has been confirmed for the measurement of WB, LS,
TPF, TF, and DT BMD, as well as body composition variables. The accuracy of TF scans was
slightly less than that of other regions. Thus, because DXA uses forearm software for analysis of
DT scans, accuracy of DT BMD measures may also be slightly, but not significantly, impacted.
Development of software for scanning and analyzing DT BMD must be considered. A novel
finding of this study was the effect of metal artifacts on the accuracy of DXA. Specifically, a
navel ring placed on a spine phantom will significantly raise LS BMD, without the possibility of
complete manual correction by the operator. Future studies investigating this matter in human
subjects may provide additional information regarding effects on whole body BMD results.
Furthermore, effects of different gauges or types of metal were not examined in this study and
may have different effects on BMD results. Therefore, future studies are warranted to continue
the investigation of effects of body jewelry on BMD and the possibility of corrections or
84

modifications to DXA software which may correct for errors in BMD measures resulting from
body jewelry.
85

APPENDIX
86

APPENDIX A
“DXA Reliability study”
Informed Consent Form
87
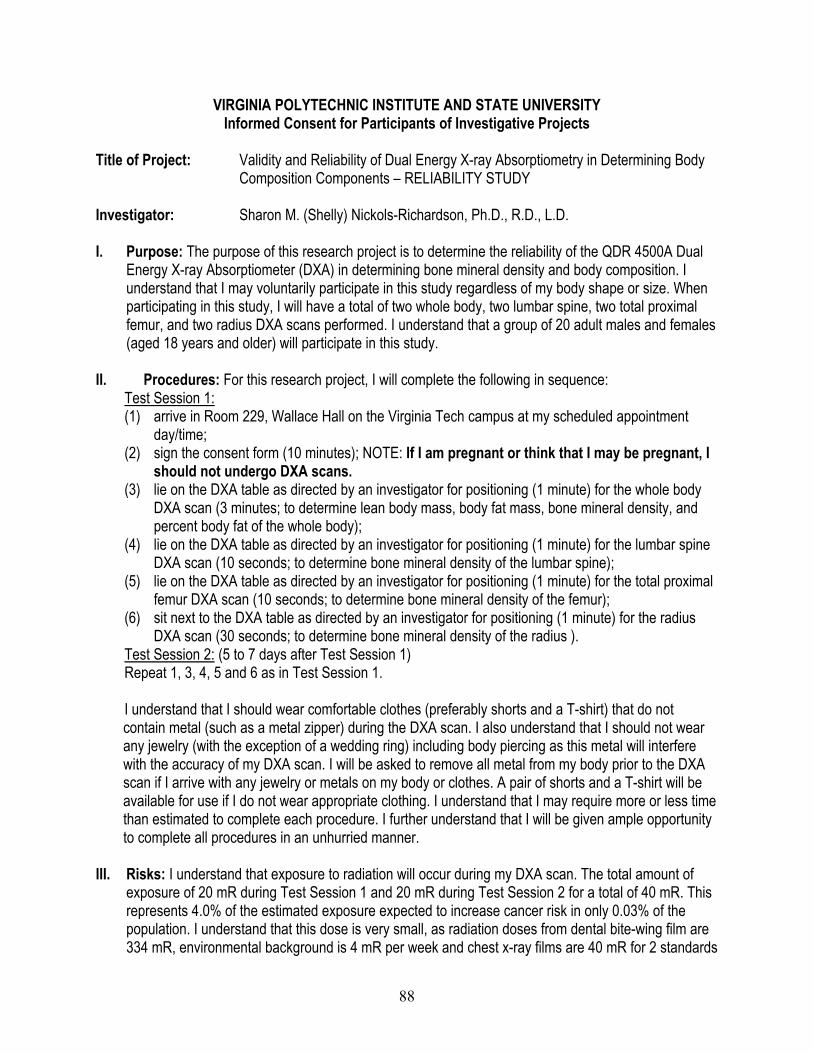
VIRGINIA POLYTECHNIC INSTITUTE AND STATE UNIVERSITY Informed Consent for Participants of Investigative Projects
Title of Project: Validity and Reliability of Dual Energy X-ray Absorptiometry in Determining Body Composition Components – RELIABILITY STUDY Investigator: Sharon M. (Shelly) Nickols-Richardson, Ph.D., R.D., L.D. I. Purpose: The purpose of this research project is to determine the reliability of the QDR 4500A Dual
Energy X-ray Absorptiometer (DXA) in determining bone mineral density and body composition. I understand that I may voluntarily participate in this study regardless of my body shape or size. When participating in this study, I will have a total of two whole body, two lumbar spine, two total proximal femur, and two radius DXA scans performed. I understand that a group of 20 adult males and females (aged 18 years and older) will participate in this study.
II. Procedures: For this research project, I will complete the following in sequence:
Test Session 1: (1) arrive in Room 229, Wallace Hall on the Virginia Tech campus at my scheduled appointment
day/time; (2) sign the consent form (10 minutes); NOTE: If I am pregnant or think that I may be pregnant, I
should not undergo DXA scans. (3) lie on the DXA table as directed by an investigator for positioning (1 minute) for the whole body
DXA scan (3 minutes; to determine lean body mass, body fat mass, bone mineral density, and percent body fat of the whole body);
(4) lie on the DXA table as directed by an investigator for positioning (1 minute) for the lumbar spine DXA scan (10 seconds; to determine bone mineral density of the lumbar spine);
(5) lie on the DXA table as directed by an investigator for positioning (1 minute) for the total proximal femur DXA scan (10 seconds; to determine bone mineral density of the femur);
(6) sit next to the DXA table as directed by an investigator for positioning (1 minute) for the radius DXA scan (30 seconds; to determine bone mineral density of the radius ).
Test Session 2: (5 to 7 days after Test Session 1) Repeat 1, 3, 4, 5 and 6 as in Test Session 1. I understand that I should wear comfortable clothes (preferably shorts and a T-shirt) that do not contain metal (such as a metal zipper) during the DXA scan. I also understand that I should not wear any jewelry (with the exception of a wedding ring) including body piercing as this metal will interfere with the accuracy of my DXA scan. I will be asked to remove all metal from my body prior to the DXA scan if I arrive with any jewelry or metals on my body or clothes. A pair of shorts and a T-shirt will be available for use if I do not wear appropriate clothing. I understand that I may require more or less time than estimated to complete each procedure. I further understand that I will be given ample opportunity to complete all procedures in an unhurried manner.
III. Risks: I understand that exposure to radiation will occur during my DXA scan. The total amount of
exposure of 20 mR during Test Session 1 and 20 mR during Test Session 2 for a total of 40 mR. This represents 4.0% of the estimated exposure expected to increase cancer risk in only 0.03% of the population. I understand that this dose is very small, as radiation doses from dental bite-wing film are 334 mR, environmental background is 4 mR per week and chest x-ray films are 40 mR for 2 standards
88

films. Thus, exposure is slight. I have been informed of this risk and may choose to not complete this DXA scans. If in the event that any scan is unreadable or unusable, a replacement scan will not be conducted to avoid further exposure. I further understand that if I am pregnant or think that I may be pregnant that I should not undergo a DXA scan. My DXA scan will be conducted in the BONE Laboratory, Room 229 Wallace Hall, on the Virginia Tech campus by the Principal Investigator or a Research Assistant who both hold Certification for Limited Licensure in Radiography from the Commonwealth of Virginia.
IV. Benefits of this Project: It is likely that I will benefit from participation in this research by having body composition components of lean body mass, body fat mass, bone mineral density, and percent body fat measured. I will be provided with my individual results from every procedure. I will be referred to an appropriate health care professional, if necessary, based on my individual results. Any and all costs related to such referral will be borne by me and not by Virginia Tech. My individual results will be provided to my Primary Care Physician (PCP) if I so request in writing and by initiating and completing a release of information form from my Primary Care Physician’s office. The general public will benefit from my participation in this research as the reliability of the QDR 4500A DXA housed in the BONE Laboratory will established and utilized in all future studies related to body composition and bone mineral density conducted by the Principal Investigator. I understand that my participation in this research study is voluntary. I have not been promised or guaranteed benefits to encourage my participation in this study. I further understand that there is no promise that I will benefit from this research project.
V. Extension of Anonymity and Confidentiality: Due to the inability to assure anonymity, I understand
that confidentiality of my results will be preserved. I understand that this means that all of my DXA scan results will be kept confidential. A three-digit code number will be assigned to me. I understand that a master list of participants’ code numbers will be kept in a locked filing cabinet separate from completed data that will also be maintained in a locked filing cabinet. I further understand that only the investigator of this study or students of this investigator will be allowed access to any data. However, if I so choose, my individual results will be provided to my Primary Care Physician if I so request in writing by initiating and completing a release of information form from my Primary Care Physician’s office. My individual results released results released to my Primary Care Physician will be identified by my name and not by my code number.
VI. Compensation: I will not be compensated or paid to be in this research project. However, I will
receive my individual results from each procedure that I complete. VII. Freedom to Withdraw: I understand that I can withdraw from this study at any time without penalty. I
am free to not participate in any procedure included in this study without penalty. I understand that there may be circumstances under which the investigator may determine that I should not continue to participate in this project.
VIII. Approval of Research: This research project has been approved, as required, by the Institutional
Review Board for Research Involving Human Subjects at Virginia Polytechnic Institute and State University and by the Department of Human Nutrition, Foods and Exercise.
IX. Subject’s Responsibilities: I voluntarily agree to participate in this study which will involve the
following responsibilities during Test Session 1 and 2: arrive in Room 229, Wallace Hall at my scheduled appointment date and time; read and sign this consent form (in Test Session 1 only);
89

complete a whole body DXA scan; complete a lumbar spine DXA scan; complete a total proximal femur DXA scan; complete a radius DXA scan; wear recommended and appropriate attire; and follow all directions of the investigator as related to this project.
X. Subject’s Permission: I have read and understand the Informed Consent and conditions of this
project. I have had all my questions answered. I hereby acknowledge the above and give my voluntary consent for participation in this project. If I participate, I may withdraw at any time without penalty. I agree to abide by the rules of this project.
Participant’s Signature Date
Investigator’s Signature Date Should you have any questions about this research or its conduct, you may contact: Sharon M. (Shelly) Nickols-Richardson, PhD, RD, Principal Investigator: (540) 231-5104 OR H. T. Hurd, Chair, IRB, Research Division: (540) 231-5281
90

APPENDIX B
“DXA Reliability study”
Health Screening Questionnaire
91
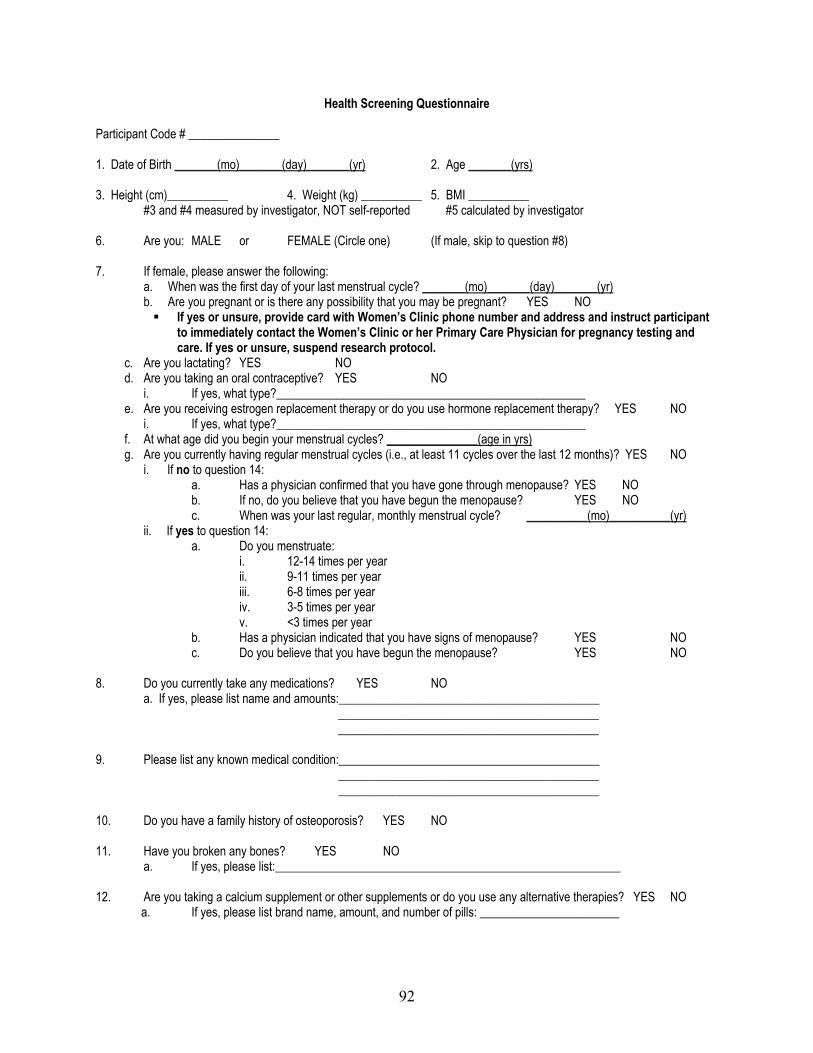
Health Screening Questionnaire Participant Code # _______________ 1. Date of Birth _______(mo)_______(day)_______(yr) 2. Age _______(yrs) 3. Height (cm)__________ 4. Weight (kg) __________ 5. BMI __________ #3 and #4 measured by investigator, NOT self-reported #5 calculated by investigator 6. Are you: MALE or FEMALE (Circle one) (If male, skip to question #8) 7. If female, please answer the following: a. When was the first day of your last menstrual cycle? _______(mo)_______(day)_______(yr) b. Are you pregnant or is there any possibility that you may be pregnant? YES NO
If yes or unsure, provide card with Women’s Clinic phone number and address and instruct participant to immediately contact the Women’s Clinic or her Primary Care Physician for pregnancy testing and care. If yes or unsure, suspend research protocol.
c. Are you lactating? YES NO d. Are you taking an oral contraceptive? YES NO i. If yes, what type?___________________________________________________ e. Are you receiving estrogen replacement therapy or do you use hormone replacement therapy? YES NO i. If yes, what type?___________________________________________________ f. At what age did you begin your menstrual cycles? _______________(age in yrs) g. Are you currently having regular menstrual cycles (i.e., at least 11 cycles over the last 12 months)? YES NO i. If no to question 14: a. Has a physician confirmed that you have gone through menopause? YES NO b. If no, do you believe that you have begun the menopause? YES NO c. When was your last regular, monthly menstrual cycle? __________(mo)__________(yr) ii. If yes to question 14: a. Do you menstruate: i. 12-14 times per year ii. 9-11 times per year iii. 6-8 times per year iv. 3-5 times per year v. <3 times per year b. Has a physician indicated that you have signs of menopause? YES NO c. Do you believe that you have begun the menopause? YES NO
8. Do you currently take any medications? YES NO a. If yes, please list name and amounts:___________________________________________ ___________________________________________ ___________________________________________ 9. Please list any known medical condition:___________________________________________ ___________________________________________ ___________________________________________ 10. Do you have a family history of osteoporosis? YES NO 11. Have you broken any bones? YES NO a. If yes, please list:_________________________________________________________ 12. Are you taking a calcium supplement or other supplements or do you use any alternative therapies? YES NO a. If yes, please list brand name, amount, and number of pills: _______________________
92

APPENDIX C
“DXA Validity study”
Informed Consent Form
93

VIRGINIA POLYTECHNIC INSTITUTE AND STATE UNIVERSITY Informed Consent for Participants of Investigative Projects
Title of Project: Validity and Reliability of Dual Energy X-ray Absorptiometry in Determining Body Composition Components – VALIDATION STUDY Investigator: Sharon M. (Shelly) Nickols-Richardson, Ph.D., R.D., L.D. I. Purpose: The purpose of this research project is to determine the validity of the QDR 4500A Dual
Energy X-ray Absorptiometer (DXA) against Underwater Weighing in determining lean body mass and body fat mass. I understand that I may voluntarily participate in this study regardless of my body shape or size but that I may be excluded from participation in this study if I have a disability that prohibits my ability to independently submerge in water or if I am unwilling to submerge in water. When participating in this study, I will complete a Health Screening Questionnaire, have one whole body DXA scan performed, participate in Underwater Weighing, have my height and weight measured, and provide my date of birth. I understand that a group of 30 adult males and females (aged 18 years and older) will participate in this study.
II. Procedures: You will complete the listed procedures on two separate days:
(1) arrive in Room 229, Wallace Hall on the Virginia Tech campus at your scheduled appointment day/time;
(2) sign the consent form (10 minutes); (3) answer questions included on the Health Screening Questionnaire to determine menstrual,
pregnancy, and lactation status (if I am a female) and general health status regardless of gender (5 minutes); NOTE: If I am pregnant or think that I may be pregnant, I should not undergo DXA scans.
(4) have my height and weight measured by an investigator and provide my date of birth (5 minutes; for the DXA database);
(5) lie on the DXA table as directed by an investigator for positioning (1 minute) for the whole body DXA scan (3 minutes; to determine lean body mass, body fat mass, bone mineral density, and percent body fat of the whole body);
(6) be escorted, by an investigator, to the Exercise Performance Laboratory in War Memorial, Room 230 (5 minutes);
(7) complete Underwater Weighing by sitting in a suspended chair in water, going under water to be immersed in water, blowing out as much air from my lungs as possible while under water, and remaining still for two seconds while by body weight is measured (repeat 8 times; 20 to 30 minutes; to determine lean body mass and body fat mass) and breathe five times into a rubber bag filled with oxygen while seated outside the water tank (10 minutes).
I understand that I should wear comfortable clothes (preferably shorts and a T-shirt) that do not contain metal such as a metal zipper) during the DXA scan. I also understand that I should not wear any jewelry (with the exception of a wedding ring) including body piercing as this metal will interfere with the accuracy of my DXA scan. I will be asked to remove all metal from my body prior to the DXA scan if I arrive with any jewelry or metals on my body or clothes. A pair of shorts and a T-shirt will be available for use if I do not wear appropriate clothing. During Underwater Weighing, I understand that I should wear my own swimming suit. If I do not have appropriate attire for Underwater Weighing, I will
94

be rescheduled and complete Underwater Weighing at another time. I understand that I may require more or less time than estimated to complete each procedure. I further understand that I will be given ample opportunity to complete all procedures in an unhurried manner.
III. Risks: I understand that there are two potential risks from my participation in this study. Exposure to
radiation will occur during by DXA scan. The total amount of exposure of 1 mR. This represents 0.1% of the estimated exposure expected to increase cancer risk in only 0.03% of the population. I understand that this dose is very small, as radiation doses from dental bite-wing film are 334 mR, environmental background is 4 mR per week and chest x-ray films are 40 mR for 2 standards films. Thus, exposure is slight. I have been informed of this risk and may choose to not complete this DXA scan. If in the event that any scan is unreadable or unusable, a replacement scan will not be conducted to avoid further exposure. I further understand that if I am pregnant or think that I may be pregnant that I should not undergo a DXA scan. My DXA scan will be conducted in the BONE Laboratory, Room 229 Wallace Hall, on the Virginia Tech campus by the Principal Investigator or a Research Assistant who both hold Certification for Limited Licensure in Radiography from the Commonwealth of Virginia. Anxiety may occur prior to the Underwater Weighing procedure. I understand that a Research Assistant will fully explain this procedure to me before my first of eight trials. I will also have privacy during Underwater Weighing and during changing into and out of my swimming suit. I may choose to not complete Underwater Weighing if desired.
IV. Benefits of this Project: It is likely that I will benefit from participation in this research by having body
composition components of lean body mass, body fat mass, bone mineral density, and percent body fat measured. I will be provided with my individual results from every procedure. I will be referred to an appropriate health care professional, if necessary, based on my individual results. Any and all costs related to such referral will be borne by me and not by Virginia Tech. My individual results will be provided to my Primary Care Physician (PCP) if I so request in writing and by initiating and completing a release of information form from your Primary Care Physician’s office. The general public will benefit from my participation in this research as the validity of the QDR 4500A DXA housed in the BONE Laboratory will established and utilized in all future studies related to body composition and bone mineral density conducted by the Principal Investigator. I understand that my participation in this research study is voluntary. I have not been promised or guaranteed benefits to encourage my participation in this study. I further understand that there is no promise that I will benefit from this research project.
V. Extension of Anonymity and Confidentialty: Due to the inability to assure anonymity, I understand
that confidentiality of my results will be preserved. I understand that this means that all of my data, including height, weight, date of birth, DXA scan and Underwater Weighing results, will be kept confidential. A three-digit code number will be assigned to me. All data recording sheets will be identified by code number only and not by my name. I understand that a master list of participants’ code numbers will be kept in a locked filing cabinet separate from completed data that will also be maintained in a locked filing cabinet. I further understand that only the investigator of this study or students of this investigator will be allowed access to any data. However, if I so choose, my individual results will be provided to my Primary Care Physician if I so request in writing by initiating and completing a release of information form from my Primary Care Physician’s office. My individual results released results released to my PCP will be identified by my name and not by my code number.
95

VI. Compensation: I will not be compensated or paid to be in this research project. However, I will receive my individual results from each procedure that I complete.
VII. Freedom to Withdraw: I understand that I can withdraw from this study at any time without penalty. I
am free to not participate in any procedure included in this study without penalty. I understand that there may be circumstances under which the investigator may determine that I should not continue to participate in this project.
VIII. Approval of Research: This research project has been approved, as required, by the Institutional
Review Board for Research Involving Human Subjects at Virginia Polytechnic Institute and State University and by the Department of Human Nutrition, Foods and Exercise.
IX. Subject’s Responsibilities: I voluntarily agree to participate in this study which will involve the
following activities: arrive in Room 229, Wallace Hall at my scheduled appointment date and time; read and sign this consent form; truthfully answer questions for the “Health Screening Questionnaire;” have body weight and height measured; complete a whole body DXA scan; be escorted to War Memorial; complete Underwater Weighing; wear recommended and appropriate attire; and follow all directions of the investigator as related to this project.
X. Subject’s Permission: I have read and understand the Informed Consent and conditions of this project. I have had all my questions answered. I hereby acknowledge the above and give my voluntary consent for participation in this project. If I participate, I may withdraw at any time without penalty. I agree to abide by the rules of this project.
Participant’s Signature Date
Investigator’s Signature Date Should you have any questions about this research or its conduct, you may contact: Sharon M. (Shelly) Nickols-Richardson, PhD, RD, Principal Investigator: (540) 231-5104 OR H. T. Hurd, Chair, IRB, Research Division: (540) 231-5281
96

APPENDIX D
“DXA Validity study”
BIA Informed Consent Form, Instructions for testing, Data Sheet
97

VIRGINIA POLYTECHNIC INSTITUTE AND STATE UNIVERSITY Informed Consent Form
Project Title: Body Composition Assessment of Adults by the Bioelectrical Impedance Analysis Method Investigator: Carrie P. Earthman, Ph.D., R.D. I. The Purpose of this Project
The two primary aims of this project are: 1) to assess body composition in individuals across the spectrum of age, gender, ethnicity, and health using the non-invasive bioelectrical impedance analysis (BIA) method and 2) to compare three BIA devices (two single-frequency and one multi-frequency BIA devices) for inter-method agreement. Approximately 800 individuals will participate. If I have a pacemaker or other internally placed electrical medical device, I must not participate in this study.
II. Procedures
If I agree to participate in this study, I will be asked to complete the following: 1. Have my weight and height measured (5 minutes). 2. Have by body composition evaluated by three different bioelectrical impedance analysis devices over a 10
minute. period. Measurements will be taken by three different devices consecutively. I will remove my right sock and shoe, all jewelry and any metal objects on my person, then I will have my hand and foot gently cleaned with an alcohol pad, after which four small wires will be attached to my hand and foot by a sticky pad called an electrode. A small, undetectable electrical signal will be sent through these wires through my body by the bioelectrical impedance analyzer. The resistance of my body to this signal will provide an estimate of my body water, lean mass, and percent body fat. The measurement by each device will last less than 10 seconds in duration, and measurement by all three devices will take approximately 5-10 minutes.
3. Answer brief questions regarding my medical history and current health (5 minutes). 4. Meet the standard protocol conditions for body composition testing, including:
a. Avoiding exercise 8 hours before testing. b. Avoiding alcohol 24 hours before and no caffeine consumption 12 hours before testing. c. Avoiding food intake 2-4 hours before testing. c. Urinating within 30 minutes of testing. e. Avoiding excessive fluid intake within 30 minutes of testing, but being sure to be adequately hydrated
during the 12 hours before testing. f. Informing the technician if I feel I am retaining fluid as a result of menstruation (if I am a female
subject). III. Risks
There are no risks foreseen with participation in this study. The small bioelectrical signal I will be exposed to during bioelectrical impedance analysis measurements is minimal and there is no known risk associated with it.
IV. Benefits of this Project
I have not been promised or guaranteed benefits to encourage my participation in this study. While direct benefits to me cannot be guaranteed, I understand that I will be informed of the results from the measurement of my body composition.
V. Extent of Anonymity and Confidentiality
All information concerning my participation and any results of the various tests done in the study will be kept strictly confidential. I will be assigned a code number which will be recorded on the consent form, as well as any data collection forms used for the study. I understand that my Consent Form and a master list of participants’ names and code numbers will be kept in a locked filing cabinet separate from my data which will also be stored
98

in a locked filing cabinet. Only investigators involved in this study or students of the investigators will be allowed access to the data collected in this study. Should results of this study be reported or published, no individual subjects’ names will be used. All data will be filed according to the number identification coding system.
VI. Compensation
I will not be paid or compensated in any way for participating in this study. VII. Freedom to Withdraw
I am free to withdraw from participation in this study without penalty at any time by simply telling the technician or principal investigator, or by contacting the Chair of the Virginia Tech IRB (listed below).
VIII. Approval of Research
This research project has been approved, as required, by the Institutional Review Board for Research Involving Human Subjects at Virginia Tech, and by the Department of Human Nutrition, Foods and Exercise.
IX. Subject’s Responsibilities
I voluntarily agree to participate in this study. I have the following responsibilities: 1. Report for testing having meet the standard protocol conditions, as outlined under Procedures. 2. Remove my right sock and shoe, jewelry, and metal objects from my person; and then, lie down on a
padded table to have my body composition evaluated by bioelectrical impedance analysis. 3. Answer brief questions regarding my medical history and current health, including questions about any
medications I might be taking, any health problems I currently have, and general health habits. 4. Have my body weight and height measured.
X. Subject’s Permission
I have read and I understand the Informed Consent and conditions of this project. I have had all my questions answered. I hereby acknowledge the above and give my voluntary consent for participation in this project. If I participate, I may withdraw at any time without penalty. I agree to abide by the rules of this project.
Printed Name of Participant Signature of Participant Date
Identification Number (will be assigned) Signature of Investigator Date
Should I have any questions about this research or its conduct, I may contact any of the following individuals: Carrie P. Earthman, Ph.D., R.D. Phone: 231-7421 Principle Investigator David Moore, Ph.D. Phone: 231-4991 Chair, Institutional Review Board Office of Research Compliance Research & Graduate Studies
99

Instructions for Subjects to Follow Before Reporting to the BCM Laboratory (229 Wallace Hall) for Testing
You are scheduled to come to the BCM Laboratory (229 Wallace Hall) on ______________________________ at ____________________ AM/PM On ______________________________ (the day before you come to the BCM Laboratory) No exercise 8 hours before testing. No alcohol 24 hours before and no caffeine or nicotine consumption 12 hours before testing. No food intake 2-4 hours before testing. Urinate within 30 minutes of testing. Avoid excessive fluid intake within 30 minutes of testing, but be sure to be adequately
hydrated during the 12 hours before testing (i.e., urine should be pale in color). Please do not take any medications 12 hours before testing ( i.e. caffeine-containing
medications). Please do not apply any lotions, oils, or creams to the skin.
On ______________________________ (the day you come to the BCM Laboratory) Wear, light-weight, comfortable clothing with no buttons zippers, or other metal/hard plastic.
(For ex. Wearing sweat pants, t-shirt, and sweat shirt would be a good choice). You will be asked to remove all jewelry, coins, keys, etc. from your person for testing.
What to expect while you’re in the BCM Laboratory: 1. You will be requested to go to the restroom to void urine upon arrival to the lab. 2. Your height and weight will be measured. 3. You can expect to be in the BCM Laboratory for approximately 30 minutes.
100

BODY COMPOSITION STUDY (BCM Laboratory) SF-BIA – Valhalla
Initials Date:
TIME: 5 min 10 min
Subject ID #:
WEIGHT without shoes (kg) _____ _____ _____ . _____ _____ HEIGHT without shoes (cm) _____ _____ _____ . _____ _____ AGE (years) _____ _____ TRIAL 1
RESISTANCE (ohms) ____ ____ ____ FAT MASS (kg) ____ ____ . ____
REACTANCE (ohms) ____ ____ ____ PERCENT FAT (%) ____ ____ . ____
IMPEDANCE ____ ____ ____ LEAN BODY MASS (kg) ____ ____ . ____
PHASE ANGLE ____ ____ ____ TOTAL BODY WATER (L) ____ ____ . ____
TOTAL BODY WATER (%) ____ ____ . ____TRIAL 2
RESISTANCE (ohms) ____ ____ ____ FAT MASS (kg) ____ ____ . ____
REACTANCE (ohms) ____ ____ ____ PERCENT FAT (%) ____ ____ . ____
IMPEDANCE ____ ____ ____ LEAN BODY MASS (kg) ____ ____ . ____
PHASE ANGLE ____ ____ ____ TOTAL BODY WATER (L) ____ ____ . ____
TOTAL BODY WATER (%) ____ ____ . ____TRIAL 3
RESISTANCE (ohms) ____ ____ ____ FAT MASS (kg) ____ ____ . ____
REACTANCE (ohms) ____ ____ ____ PERCENT FAT (%) ____ ____ . ____
IMPEDANCE ____ ____ ____ LEAN BODY MASS (kg) ____ ____ . ____
PHASE ANGLE ____ ____ ____ TOTAL BODY WATER (L) ____ ____ . ____
TOTAL BODY WATER (%) ____ ____ . ____
101

APPENDIX E
“Tibial Reliability study”
Informed Consent Form
102
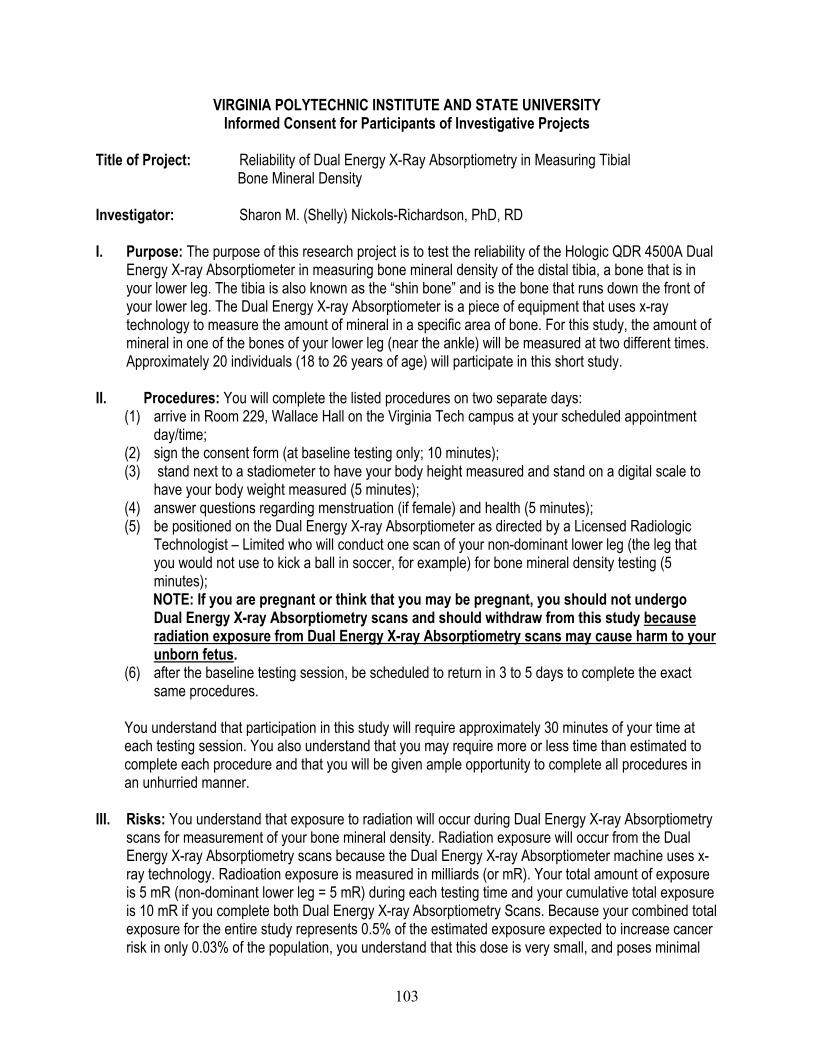
VIRGINIA POLYTECHNIC INSTITUTE AND STATE UNIVERSITY Informed Consent for Participants of Investigative Projects
Title of Project: Reliability of Dual Energy X-Ray Absorptiometry in Measuring Tibial Bone Mineral Density Investigator: Sharon M. (Shelly) Nickols-Richardson, PhD, RD I. Purpose: The purpose of this research project is to test the reliability of the Hologic QDR 4500A Dual
Energy X-ray Absorptiometer in measuring bone mineral density of the distal tibia, a bone that is in your lower leg. The tibia is also known as the “shin bone” and is the bone that runs down the front of your lower leg. The Dual Energy X-ray Absorptiometer is a piece of equipment that uses x-ray technology to measure the amount of mineral in a specific area of bone. For this study, the amount of mineral in one of the bones of your lower leg (near the ankle) will be measured at two different times. Approximately 20 individuals (18 to 26 years of age) will participate in this short study.
II. Procedures: You will complete the listed procedures on two separate days:
(1) arrive in Room 229, Wallace Hall on the Virginia Tech campus at your scheduled appointment day/time;
(2) sign the consent form (at baseline testing only; 10 minutes); (3) stand next to a stadiometer to have your body height measured and stand on a digital scale to
have your body weight measured (5 minutes); (4) answer questions regarding menstruation (if female) and health (5 minutes); (5) be positioned on the Dual Energy X-ray Absorptiometer as directed by a Licensed Radiologic
Technologist – Limited who will conduct one scan of your non-dominant lower leg (the leg that you would not use to kick a ball in soccer, for example) for bone mineral density testing (5 minutes); NOTE: If you are pregnant or think that you may be pregnant, you should not undergo Dual Energy X-ray Absorptiometry scans and should withdraw from this study because radiation exposure from Dual Energy X-ray Absorptiometry scans may cause harm to your unborn fetus.
(6) after the baseline testing session, be scheduled to return in 3 to 5 days to complete the exact same procedures.
You understand that participation in this study will require approximately 30 minutes of your time at each testing session. You also understand that you may require more or less time than estimated to complete each procedure and that you will be given ample opportunity to complete all procedures in an unhurried manner.
III. Risks: You understand that exposure to radiation will occur during Dual Energy X-ray Absorptiometry
scans for measurement of your bone mineral density. Radiation exposure will occur from the Dual Energy X-ray Absorptiometry scans because the Dual Energy X-ray Absorptiometer machine uses x-ray technology. Radioation exposure is measured in milliards (or mR). Your total amount of exposure is 5 mR (non-dominant lower leg = 5 mR) during each testing time and your cumulative total exposure is 10 mR if you complete both Dual Energy X-ray Absorptiometry Scans. Because your combined total exposure for the entire study represents 0.5% of the estimated exposure expected to increase cancer risk in only 0.03% of the population, you understand that this dose is very small, and poses minimal
103

risk compared to radiation doses fro dental bite-wing films (334 mR) and environmental background exposure (100 to 400 mR per year) expected to occur in one 12-month period. The following table lists the radiation limits for an adult research participant according to the National Institutes of Health, Office for Protection from Research Risks (NIH-OPRR), compared to your exposure during this study.
NIH-OPRR Radiation Limits
for an Adult Research Participant Your Exposure During Participation
in this Research Study Lower leg (single dose) = 5,000 mR Distal tibia (single dose) = 5 mR Lower leg (annual cumulative dose) = 15,000 mR Distal tibia (annual cumulative dose) = 10 mR ANNUAL CUMULATIVE EXPOSURE = 10 mR
during 12 months You have been informed of this risk and may choose to not complete these scans. If in the event that any scan is unreadable or unusable, a replacement scan will not be conducted to avoid further exposure. You further understand that if you are pregnant or think that you may be pregnant that you should not undergo Dual Energy X-ray Absorptiometry scans and should withdraw from this study because radiation exposure from Dual Energy X-ray Absorptiometry scans may cause harm to your unborn fetus. These Dual Energy X-ray Absorptiometry scans will be conducted in t he BONE Laboratory, Room 229 Wallace Hall, on the Virginia Tech campus by the Principal Investigator who is a Licensed Radiologic Technologist – Limited in the Commonwealth of Virginia.
IV. Benefits of this Project: You will be provided with your individual results from your Dual Energy X-
ray Absorptiometry scans. You will be referred to an appropriate health care professional, if necessary, based on your individual results. Any and all costs related to such referral will be borne by you and not by Virginia Tech. Your individual results will be provided to your Primary Care Physician (PCP) if you so request in writing and by initiating and completing a release of information form from your PCP’s office. The general public will benefit from your participation in this study as the reliability of the Hologic QDR 4500A Dual Energy X-ray Absorptiometer in measuring bone mineral density of the distal tibia will be established. You understand that your participation in this research study is voluntary. You have not been promised or guaranteed benefits to encourage your participation in this study. You further understand that there is no promise that you will benefit from this research project.
V. Extent of Anonymity and Confidentiality: Due to the inability to assure anonymity, you understand
that confidentiality of your results will be preserved. You understand that this means that all of your data will be kept confidential. A three-digit code number will be assigned to you. All data recording sheets will be identified by code number only and not by your name. You understand that a master list of participants’ code numbers will be kept in a locked filing cabinet separate from completed data that will also be maintained in a locked filing cabinet. You further understand that only the investigator of this study or students of this investigator will be allowed access to any data. However, if you so choose, your individual results will be provided to you PCP if you so request in writing by initiating and completing a release of information form from your PCP’s office. Your individual results released results released to your PCP will be identified by your name and not by your code number.
VI. Compensation: You will not be compensated or paid to be in this research project. However, you will
receive your individual results from each Dual Energy X-ray Absorptiometry scan that you complete.
104

VII. Freedom to Withdraw: You understand that you can withdraw from this study at any time without penalty. You are free to not participate in any procedure included in this study without penalty. You understand that there may be circumstances under which the investigator may determine that you should not continue to participate in this project.
VII. Review of Protocols Involving Human Subjects: This research protocol has been reviewed, as
required, by the Institutional Review Board for Research Involving Human Subjects, by the Department of Human Nutrition, Foods and Exercise, and by the Radiation Safety Committee at Virginia Polytechnic Institute and State University for compliance with federal guidelines related to the safety and protection of human subjects, and has found it to be in compliance. However, while the Institutional Review Board has indicated that the procedures are in compliance with federal requirements, it is still necessary for you to decide for yourself whether you are willing to assume risk(s) associated with participation in the study.
IX. Subject’s Responsibilities: You voluntarily agree to participate in this study which will involve the following activities:
arrive in Room 229, Wallace Hall at your scheduled appointment dates and times; read and sign the consent form; have your body height and weight measured; answer questions regarding menstruation (if female) and medical status; complete Dual Energy X-ray Absorptiometry scans for bone mineral density testing.
You will truthfully answer all questions of the investigator including questions regarding your pregnancy status (if female). During the study, you will follow all directions of the investigator as related to this project.
X. Subject’s Permission: You have read and understand the Informed Consent and conditions of this
project. You have had all your questions answered. You hereby acknowledge the above and give your voluntary consent for participation in this project. If you participate, you may withdraw at any time without penalty. You agree to abide by the rules of this project.
Participant’s Signature Date
Investigator’s Signature Date Should you have any questions about this research or its conduct, you may contact: Sharon M. (Shelly) Nickols-Richardson, PhD, RD, Co-Investigator: (540) 231-5104 OR David M. Moore, PhD, IRB Chair, Assistant Vice Provost for Research Compliance: (540) 231-4991
105

APPENDIX F
“Tibial Reliability study”
Medical History Questionnaire
106
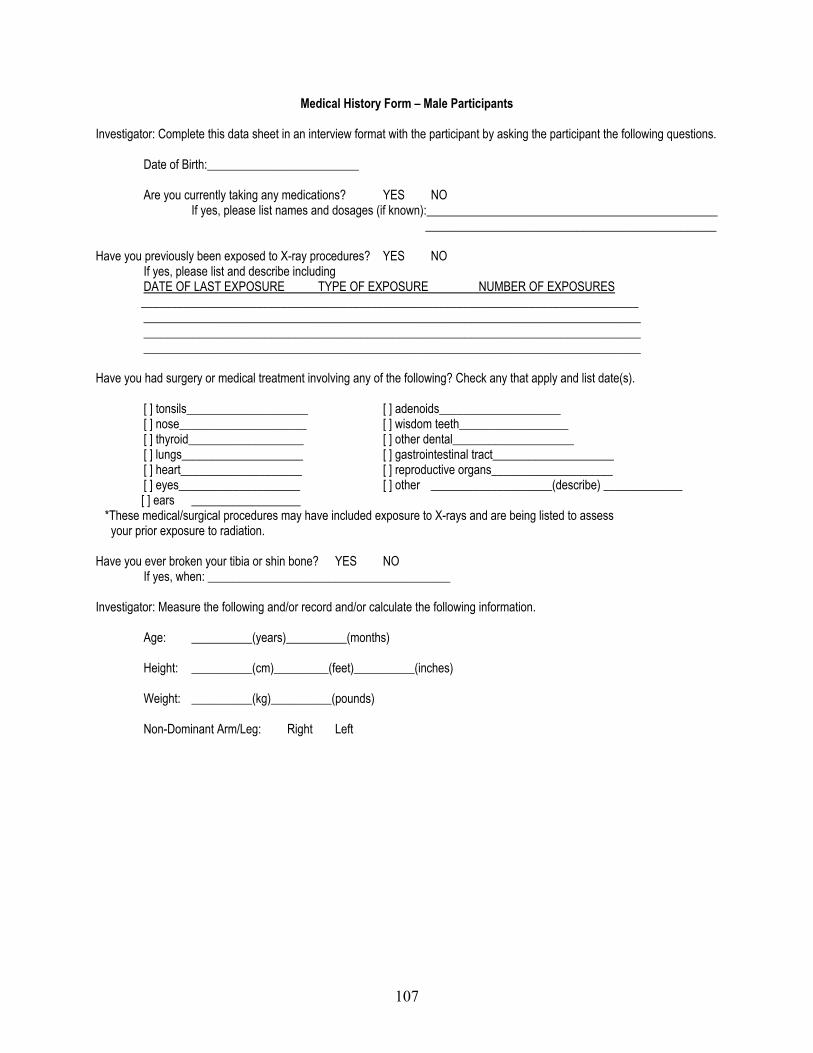
Medical History Form – Male Participants Investigator: Complete this data sheet in an interview format with the participant by asking the participant the following questions.
Date of Birth:_________________________
Are you currently taking any medications? YES NO If yes, please list names and dosages (if known):________________________________________________ ________________________________________________ Have you previously been exposed to X-ray procedures? YES NO If yes, please list and describe including DATE OF LAST EXPOSURE TYPE OF EXPOSURE NUMBER OF EXPOSURES __________________________________________________________________________________ __________________________________________________________________________________ __________________________________________________________________________________ __________________________________________________________________________________ Have you had surgery or medical treatment involving any of the following? Check any that apply and list date(s). [ ] tonsils____________________ [ ] adenoids____________________ [ ] nose_____________________ [ ] wisdom teeth__________________ [ ] thyroid___________________ [ ] other dental____________________ [ ] lungs____________________ [ ] gastrointestinal tract____________________ [ ] heart____________________ [ ] reproductive organs____________________ [ ] eyes____________________ [ ] other ____________________(describe) _____________ [ ] ears __________________ *These medical/surgical procedures may have included exposure to X-rays and are being listed to assess your prior exposure to radiation. Have you ever broken your tibia or shin bone? YES NO If yes, when: ________________________________________ Investigator: Measure the following and/or record and/or calculate the following information. Age: __________(years)__________(months) Height: __________(cm)_________(feet)__________(inches) Weight: __________(kg)__________(pounds) Non-Dominant Arm/Leg: Right Left
107

Medical History Form – Female Participants Investigator: Complete this data sheet in an interview format with the participant by asking the participant the following questions.
Date of Birth: ___________________________________________________________
When was the first day of your last menstrual cycle? __________(date)__________(month)__________(year)
Are you pregnant or is there any possibility that you may be pregnant? YES NO UNSURE Note: If “yes” or “unsure”, provide card with Women’s Clinic phone number and address and instruct participant to immediately contact the Women’s Clinic or her Primary Care Physician for pregnancy testing and care. If yes or unsure, suspend research protocol.
Are you taking an oral contraceptive? YES NO
If yes, what is the brand and dosage (if known):______________________________________________ If yes, for how long have you been taking this oral contraceptive?________________________________
Are you currently having regular menstrual cycles (i.e., at least 11 cycles over the last 12 months)? YES NO If no, please describe and indicate why your menstrual cycles have been rregular:____________________ _____________________________________________________________________________________
______________________________________________________________________________________
If yes, do you menstruate: a. 12-14 times per year b. 9-11 times per year c. 6-8 times per year d. 3-5 times per year
e. <3 times per year
Are you currently taking any medications? YES NO If yes, please list names and dosages (if known): _______________________________________________ _______________________________________________ Have you previously been exposed to X-ray procedures? YES NO If yes, please list and describe including DATE OF LAST EXPOSURE TYPE OF EXPOSURE NUMBER OF EXPOSURES ______________________________________________________________________________________ ______________________________________________________________________________________ ______________________________________________________________________________________ ______________________________________________________________________________________ Have you had surgery or medical treatment involving any of the following? Check any that apply and list date(s). [ ] tonsils____________________ [ ] adenoids____________________ [ ] nose____________________ [ ] wisdom teeth____________________ [ ] thyroid____________________ [ ] other dental____________________ [ ] lungs____________________ [ ] gastrointestinal tract____________________ [ ] heart____________________ [ ] reproductive organs____________________ [ ] eyes____________________ [ ] other____________________(describe) _______________ [ ] ears ____________________ *These medical/surgical procedures may have included exposure to X-rays and are being listed to assess your prior exposure to radiation. Have you ever broken your tibia or shin bone? YES NO If yes, when: ________________________________________
108

Investigator: Measure the following and/or record and/or calculate the following information. Age: __________(years)__________(months) Height: __________(cm)_________(feet)__________(inches) Weight: __________(kg)__________(pounds) Non-Dominant Arm/Leg: Right Left
109
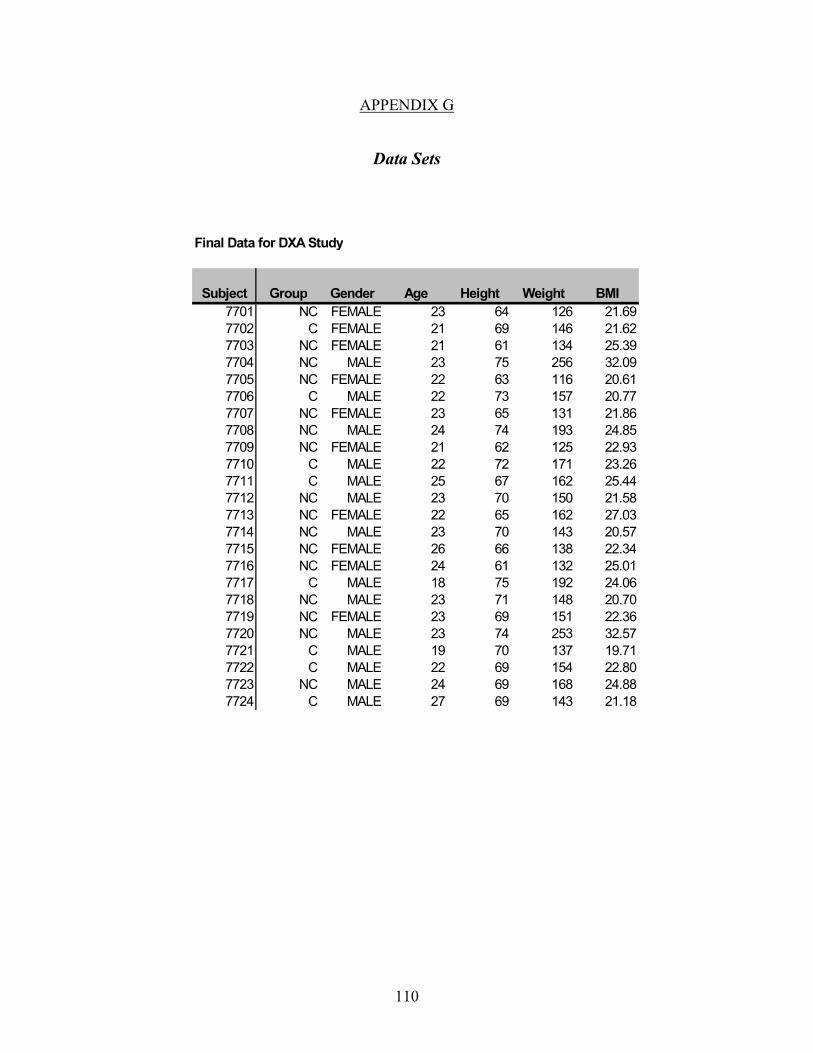
APPENDIX G
Data Sets
Final Data for DXA Study
Subject Group Gender Age Height Weight BMI7701 NC FEMALE 23 64 126 21.697702 C FEMALE 21 69 146 21.627703 NC FEMALE 21 61 134 25.397704 NC MALE 23 75 256 32.097705 NC FEMALE 22 63 116 20.617706 C MALE 22 73 157 20.777707 NC FEMALE 23 65 131 21.867708 NC MALE 24 74 193 24.857709 NC FEMALE 21 62 125 22.937710 C MALE 22 72 171 23.267711 C MALE 25 67 162 25.447712 NC MALE 23 70 150 21.587713 NC FEMALE 22 65 162 27.037714 NC MALE 23 70 143 20.577715 NC FEMALE 26 66 138 22.347716 NC FEMALE 24 61 132 25.017717 C MALE 18 75 192 24.067718 NC MALE 23 71 148 20.707719 NC FEMALE 23 69 151 22.367720 NC MALE 23 74 253 32.577721 C MALE 19 70 137 19.717722 C MALE 22 69 154 22.807723 NC MALE 24 69 168 24.887724 C MALE 27 69 143 21.18
110

Whole Body Lumbar Spine TPF TFfirst second avg BMD first second first second first second
1.153 1.137 1.145 1.080 1.079 0.958 0.978 0.539 0.5511.162 1.163 1.163 1.017 1.025 0.922 0.912 0.571 0.5711.129 1.141 1.135 1.172 1.181 1.025 1.034 0.617 0.6061.433 1.455 1.444 1.451 1.482 1.264 1.264 0.782 0.8001.069 1.066 1.068 0.850 0.838 0.868 0.885 0.554 0.5531.252 1.248 1.250 1.172 1.135 1.068 1.067 0.670 0.6451.337 1.327 1.332 1.167 1.171 1.145 1.148 0.651 0.6441.247 1.255 1.251 1.071 1.067 1.023 1.033 0.729 0.7221.010 1.013 1.012 0.905 0.908 0.816 0.770 0.527 0.5321.208 1.220 1.214 0.987 1.001 1.060 1.080 0.685 0.6911.281 1.270 1.276 1.066 1.069 1.088 1.097 0.617 0.6121.206 1.208 1.207 1.197 1.199 1.045 1.043 0.677 0.6841.179 1.207 1.193 1.033 1.049 1.096 1.095 0.586 0.5841.132 1.139 1.136 0.880 0.889 1.049 1.049 0.522 0.5251.193 1.200 1.197 1.108 1.118 1.012 1.020 0.508 0.5171.099 1.087 1.093 0.901 0.896 0.972 0.974 0.526 0.5321.258 1.234 1.246 0.955 0.951 1.160 1.150 0.603 0.6011.321 1.327 1.324 1.317 1.334 1.131 1.126 0.637 0.6471.125 1.122 1.124 1.057 1.065 0.961 0.965 0.589 0.5921.369 1.391 1.380 1.200 1.183 1.281 1.300 0.789 0.7861.184 1.194 1.189 0.889 0.895 0.890 0.903 0.662 0.6511.078 1.079 1.079 0.928 0.918 0.960 0.963 0.586 0.5701.278 1.265 1.272 1.031 1.031 1.067 1.074 0.719 0.7271.213 1.213 1.213 0.940 0.919 0.814 0.805 0.570 0.579
111

DT %bodyfatfirst second first second avg.bf BIA avDXABIA
1.056 1.049 26.30 25.80 26.05 22.90 25.000.932 0.964 26.40 27.10 26.75 26.80 26.771.039 0.850 30.10 29.40 29.75 30.00 29.831.180 1.190 22.80 22.30 22.55 21.80 22.301.054 1.062 23.50 24.00 23.75 22.60 23.371.166 1.129 10.90 11.00 10.95 8.70 10.201.131 1.136 18.00 17.50 17.75 18.50 18.001.161 1.012 16.90 16.70 16.80 14.80 16.100.893 0.888 31.20 31.70 31.45 25.80 29.571.261 1.111 12.90 12.90 12.90 16.60 14.131.082 1.086 13.30 13.60 13.45 13.60 13.501.310 1.217 11.20 11.10 11.15 13.50 11.931.146 1.158 28.30 28.20 28.25 26.70 27.730.969 1.019 10.70 11.20 10.95 17.00 12.971.034 1.046 25.90 26.50 26.20 23.10 25.171.052 1.058 24.90 26.10 25.50 25.00 25.331.036 1.080 14.70 14.30 14.50 16.30 15.101.219 1.111 12.60 12.40 12.50 12.20 12.401.098 1.112 31.80 31.50 31.65 28.50 30.601.238 1.210 14.70 14.50 14.60 19.50 16.231.057 1.074 10.70 10.20 10.45 10.00 10.301.095 1.122 17.00 16.80 16.90 16.60 16.801.345 1.252 10.90 10.20 10.55 14.10 11.73
. . 13.30 13.50 13.40 12.50 13.10
112

LBM FMfirst second first second
40.54 41.09 15.262 15.08746.95 46.01 17.709 18.03941.19 41.95 18.652 18.32487.86 86.79 26.995 26.01639.14 38.91 12.602 12.86861.70 61.66 7.933 7.99946.58 47.68 10.872 10.71270.57 69.82 14.956 14.63937.50 36.99 17.839 18.01365.29 66.07 10.129 10.20861.98 61.77 9.931 10.15258.53 57.54 7.749 7.49351.18 51.15 21.153 21.06156.48 54.85 7.058 7.22944.94 44.84 16.527 16.98643.99 42.53 15.211 15.69872.54 73.16 13.129 12.73656.81 55.77 8.599 8.31945.04 45.87 22.136 22.19495.53 95.56 17.029 16.82553.50 54.03 6.735 6.42856.12 57.10 11.953 11.98666.01 66.09 8.385 7.85154.24 52.64 8.681 8.592
Key 1. Units of Measure Variable Units Height Inches Weight PoundsBMD g/cm2
Key 2. Abbreviations Abbreviation Meaning NC Non-cyclist C Cyclist BMI Body Mass Index TPF Total proximal femur TF Total forearm DT Distal tibia BIA Bioelectrical impedance analysisavDXABIA LBM
Average of DXA&BIA Lean body mass
FM Fat mass
113

APPENDIX H
Statistics
ANOVA Data for 3 Subgroups
114

ANOVA
4.594 2 2.297 .575 .57279.841 20 3.99284.435 22
295.366 2 147.683 21.995 .000134.286 20 6.714429.652 22
11186.075 2 5593.037 6.454 .00717333.143 20 866.65728519.217 22
30.896 2 15.448 1.430 .263215.981 20 10.799246.877 22
7.726E-02 2 3.863E-02 4.960 .018.156 20 7.788E-03.233 22
8.507E-02 2 4.253E-02 5.287 .014.161 20 8.045E-03.246 22.117 2 5.836E-02 3.034 .071.385 20 1.924E-02.501 22.130 2 6.509E-02 3.206 .062.406 20 2.030E-02.536 22
8.363E-02 2 4.182E-02 3.439 .052.243 20 1.216E-02.327 22
8.596E-02 2 4.298E-02 3.262 .059.264 20 1.318E-02.350 22
6.390E-02 2 3.195E-02 7.803 .0038.189E-02 20 4.095E-03
.146 226.746E-02 2 3.373E-02 8.731 .0027.727E-02 20 3.863E-03
.145 22916.484 2 458.242 31.085 .000294.834 20 14.742
1211.318 22946.089 2 473.044 32.770 .000288.708 20 14.435
1234.797 22571.321 2 285.660 24.596 .000232.277 20 11.614803.598 22
3006.886 2 1503.443 15.864 .0001895.464 20 94.7734902.350 222850.528 2 1425.264 14.251 .0002000.188 20 100.0094850.715 22190.440 2 95.220 4.149 .031458.999 20 22.950649.439 22199.786 2 99.893 4.661 .022428.671 20 21.434628.457 22
Between GroupsWithin GroupsTotalBetween GroupsWithin GroupsTotalBetween GroupsWithin GroupsTotalBetween GroupsWithin GroupsTotalBetween GroupsWithin GroupsTotalBetween GroupsWithin GroupsTotalBetween GroupsWithin GroupsTotalBetween GroupsWithin GroupsTotalBetween GroupsWithin GroupsTotalBetween GroupsWithin GroupsTotalBetween GroupsWithin GroupsTotalBetween GroupsWithin GroupsTotalBetween GroupsWithin GroupsTotalBetween GroupsWithin GroupsTotalBetween GroupsWithin GroupsTotalBetween GroupsWithin GroupsTotalBetween GroupsWithin GroupsTotalBetween GroupsWithin GroupsTotalBetween GroupsWithin GroupsTotal
AGE
HEIGHT
WEIGHT
BMI
WBBMD1
WBBMD2
LSBMD1
LSBMD2
TPFBMD1
TPFBMD2
TFBMD1
TFBMD2
BF1
BF2
BIA
LBM1
LBM2
FTMASS1
FTMASS2
Sum ofSquares df Mean Square F Sig.
115

APPENDIX I
Navel Jewelry Data
Group scan # BMD Normal 1 0.989 Normal 2 0.995 Normal 3 0.997 Normal 4 0.993 Normal 5 0.991 Normal 6 0.998 Normal 7 0.996 normal 8 0.993 normal 9 1.004 normal 10 1.003 normal 11 0.995 ring 1 1 1.038 ring 1 2 1.04 ring 1 3 1.04 ring 1 4 1.039 ring 1 5 1.041 ring 1 6 1.046 ring 1 7 1.042 ring 1 8 1.039 ring 1 9 1.037 ring 1 10 1.037 ring 1 11 1.032
cor.rg* 1 1 1.001 cor.rg 1 2 1.008 cor.rg 1 3 1.007 cor.rg 1 4 1.008 cor.rg 1 5 1.006 cor.rg 1 6 1.011 cor.rg 1 7 1.007 cor.rg 1 8 1.006 cor.rg 1 9 1.006 cor.rg 1 10 1.007 cor.rg 1 11 1 ring 2 1 1.034 ring 2 2 1.035 ring 2 3 1.041 ring 2 4 1.036 ring 2 5 1.039 ring 2 6 1.036 ring 2 7 1.031 ring 2 8 1.04 ring 2 9 1.036 ring 2 10 1.039
116

ring 2 11 1.037 cor.rg** 2 1 0.995 cor.rg 2 2 1.002 cor.rg 2 3 1.008 cor.rg 2 4 0.997 cor.rg 2 5 1.003 cor.rg 2 6 1.001 cor.rg 2 7 1 cor.rg 2 8 1.006 cor.rg 2 9 1 cor.rg 2 10 1.006 cor.rg 2 11 1.002 bar 1 1 1.037 bar 1 2 1.029 bar 1 3 1.03 bar 1 4 1.031 bar 1 5 1.03 bar 1 6 1.029 bar 1 7 1.03 bar 1 8 1.027 bar 1 9 1.026 bar 1 10 1.026 bar 1 11 1.032
cor.bar† 1 1 1.01 cor.bar 1 2 1.008 cor.bar 1 3 0.999 cor.bar 1 4 0.999 cor.bar 1 5 1.002 cor.bar 1 6 0.997 cor.bar 1 7 1.003 cor.bar 1 8 1.001 cor.bar 1 9 1.007 cor.bar 1 10 0.999 cor.bar 1 11 1.002
bar 2 1 1.03 bar 2 2 1.029 bar 2 3 1.031 bar 2 4 1.033 bar 2 5 1.028 bar 2 6 1.028 bar 2 7 1.026 bar 2 8 1.026 bar 2 9 1.028 bar 2 10 1.017 bar 2 11 1.032
cor.bar‡ 2 1 0.999 cor.bar 2 2 1 cor.bar 2 3 0.997 cor.bar 2 4 1.005
117

cor.bar 2 5 0.999 cor.bar 2 6 1 cor.bar 2 7 0.995 cor.bar 2 8 0.996 cor.bar 2 9 0.994 cor.bar 2 10 0.99 cor.bar 2 11 1
* corrected ring, L4
** corrected ring, L3/L4 †corrected barbell, L4
‡ corrected barbell, L3/L4
118

APPENDIX J
Sample DXA Scans
(Whole body, Lumbar spine, Total proximal femur, Total forearm, Distal tibia)
119

120

121
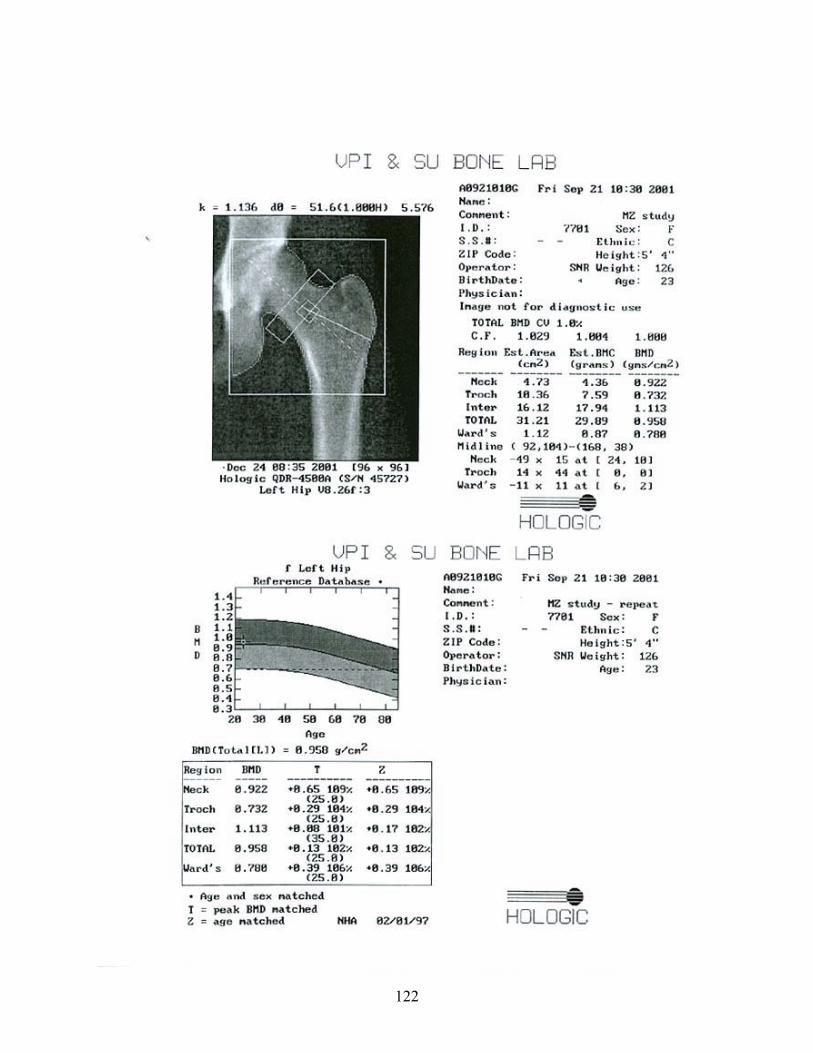
122

123

124
125
VITA
Melissa Kareen Zack, daughter of Russell and Bonnie Wood, was born on July 19, 1977 in
Camp Hill, Pennsylvania. Melissa received a Bachelor of Art degree in Sport and Exercise
Science from Messiah College, Grantham, Pa. in May 1999. During her time at Virginia
Polytechnic Institute and State University, she has been funded by a grant from the United States
Army Medical Research and Materiel Command (DAMD17-00-1-0114). After Melissa receives
her Master’s degree in Sports Nutrition and Chronic Disease from VPI&SU, she and her husband
plan to return to Pa., where she will continue with coursework and apply for a Dietetic
Internship.