dsa project – planning reform regional competitiveness in the snnpr– the preliminary study...
TRANSCRIPT
DSA
Pro
ject
– P
lannin
g
Refo
rm
Regional Competitiveness in the SNNPR– the preliminary study
Regional Economic Policy Review
Perran PenroseDecember 2004

2D
SA
Pro
ject
– P
lannin
g
Refo
rmDSA Project
• The DSA project has been working with the SNNPRS Bureau of Finance and Economic Development for several years to support the development of a modern budget system‘transaction reforms’ to reform the
budget and accounting system‘planning reforms’ to strengthen the way
budgetary allocations are made

3D
SA
Pro
ject
– P
lannin
g
Refo
rmREPR
• In August 2004 the DSA Project undertook a Regional Economic Policy Review in the Southern Region of Ethiopia
•To put a spotlight on economic growth, and consider how the Region can enhance its competitiveness in order to stimulate growth
• The role of BOFED coordinating economic development and the budget in growth strategy
Objective Focus

4D
SA
Pro
ject
– P
lannin
g
Refo
rm
Background and objectives of this presentation
• SNNPR is in a ‘low-level equilibrium trap’, with stagnating per capita GDP, volatile growth, little evidence of growth impetus in the economy, and little sign that small scale industry is making a material contribution
• Greater realisation that increasing competitiveness should be a core goal of developing countries
Background Key consideration
• Discuss the role of the SNNPR in contributing to Ethiopia’s growth through greater competitiveness
Objective of this presentation …

5D
SA
Pro
ject
– P
lannin
g
Refo
rm
Regional Gross Domestic Product
What do the data tell us?
6D
SA
Pro
ject
– P
lannin
g
Refo
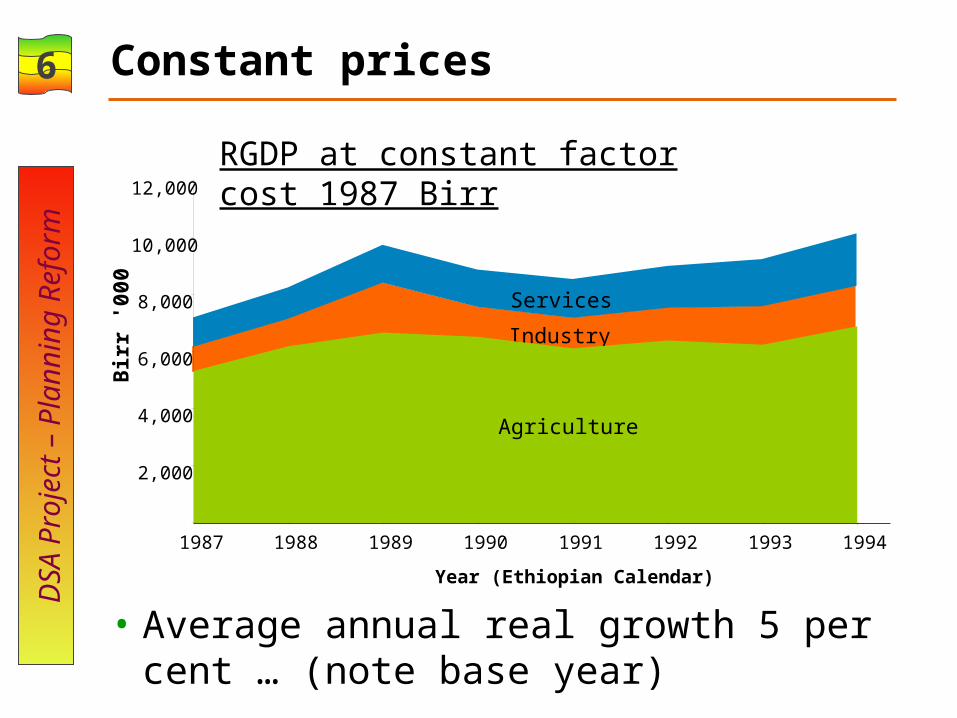
rmConstant prices
RGDP at constant factor cost 1987 Birr
Industry
Services
• Average annual real growth 5 per cent … (note base year)
Agriculture
2,000
4,000
6,000
8,000
10,000
12,000
Bir
r '0
00
1987 1988 1989 1990 1991 1992 1993 1994
Year (Ethiopian Calendar)

7D
SA
Pro
ject
– P
lannin
g
Refo
rmCurrent prices
1988 1989 1990 1991 1992 1993 1994
Year (Ethiopian Calendar)
2,000
4,000
6,000
8,000
10,000
12,000
1987
Bir
r '0
00
Agriculture
Industry
Services
RGDP at current factor cost
• Average annual nominal growth 4 per cent … (note base year)

8D
SA
Pro
ject
– P
lannin
g
Refo
rmPer capita RGDP trends
• But per capita output is stagnant (choice of base year does not make much difference!!)
100
200
300
400
500
600
700
800
900
1987 1988 1989 1990 1991 1992 1993 1994
Per capita RGDP at constant 1987 pricesPer capita RGDP at current prices

9D
SA
Pro
ject
– P
lannin
g
Refo
rmTrend of sectoral shares
10%
20%
30%
40%
50%
60%
70%
80%
90%
100%
1987 1994 Constant
Agr
icu
ltu
re
Industry
Services
Agr
icu
ltu
re
Industry
Services
• Apparent shift of shares away from agriculture – but main factor has been the movement in relative prices
1994 Current
Agr
icu
ltu
re
Industry
Services

10D
SA
Pro
ject
– P
lannin
g
Refo
rmSub-sector shares in RGDP
• Urbanisation & growth in service sectors not underpinned by primary & secondary sectors
0.6 0.4 Health
2.9 2.2 Education
2.2 1.8 Public Administration
4.9 3.5 Real estates & dwellings
6.5 1.1 Transport & communications
23.514.2Services, of which selected sub-components:
9.5 7.7 Construction
2.7 2.1 Cottage & handicraft
0.8 0.7 Small
0.3 0.3 Large and medium
3.8 3.1 Manufacturing, of which
15.212.4Industry, of which selected sub-components:
19941987
5.7
4.4
?

11D
SA
Pro
ject
– P
lannin
g
Refo
rmSummary of RGDP analysis
• Stagnant trend (output barely exceeds population growth)
• Poor performance in agriculture, considerable volatility in agriculture outputimpact of climate and coffee price dominant
• Pattern of growth (expansion of service sectors not underpinned by manufacturing sector growth) not sustainable in the longer run
• It follows that there has been a very limited impact of government development programmes

12D
SA
Pro
ject
– P
lannin
g
Refo
rm
Current targets & policy conclusions• Current growth targets are not realistic
Target = double RGDP in 5 years
• Agriculture accounts for over 60 per cent of RGDP,but a realistic projection would be that agriculture
will not grow much faster than the population (little possibility of increasing teff productivity) – say average 3% pa. 4 – 5 per cent agriculture growth per year would be a significant achievement (ie higher than population growth)
• To achieve 15 - 20 per cent RGDP growth per year would require dynamic sectors to grow at 30 – 40 per cent. This is not realistic.

13D
SA
Pro
ject
– P
lannin
g
Refo
rmWhere will growth come from?
• Agriculture growthincrease yields of existing cropsintroduce new cropsinnovations in on and off-farm post
harvest processing
• Small scale and cottage industry, services related to agriculture
• Industrial production for extra-regional markets; tourism
• We will discuss some of these later.

14D
SA
Pro
ject
– P
lannin
g
Refo
rm
Regional Competitiveness
some general principles & approaches
15D
SA
Pro
ject
– P
lannin
g
Refo
rmSome terms …
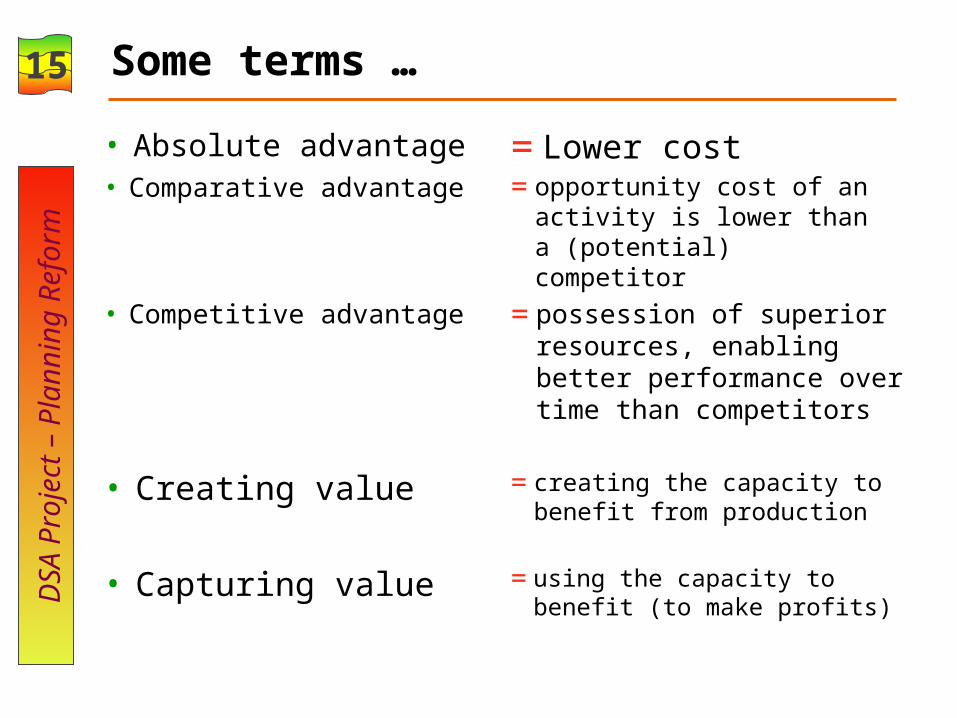
• Absolute advantage =Lower cost=opportunity cost of an
activity is lower than a (potential) competitor
• Comparative advantage
• Competitive advantage =possession of superior resources, enabling better performance over time than competitors
• Creating value =creating the capacity to benefit from production
• Capturing value =using the capacity to benefit (to make profits)

16D
SA
Pro
ject
– P
lannin
g
Refo
rm
ASSESSMENT
Country
Competitiveness
Drivers
Industry/Sectoral Competitiveness
Company/Product Competitiveness
•What are the country’s natural comparative advantages?
•What are the prioritized industries and their objectives?
•What are the companies’ strategies and their unique value propositions in relation to domestic and international competitors?
Overview of competitiveness framework & key questions
Regional Competitiveness•What are the priorities of a region
Source: Adapted from A.T.Kearney
•What roles can the public sector play to improve and sustain industry competitiveness?
•What discretion does the region have over its competitiveness drivers?
•What are some of the country’s relative disadvantages when assessed for investment opportunities?
•What are the critical factors to support the nation’s strategy to international competitiveness and how can these be improved?

17D
SA
Pro
ject
– P
lannin
g
Refo
rm
What is required for SNNPR competitiveness & growth?
• Innovation to improve the value of output
• Roads• Water
Innovation Physical Infrastructure
• Small scale industry & agriculture services
• Industrial production for extra-regional markets
• Tourism
Industry
• increase yields of existing crops
• introduce new crops• post harvest processing
(on & off farm)
Agriculture
• Credit• Skills
Human & financial infrastructure
+

18D
SA
Pro
ject
– P
lannin
g
Refo
rm
Infrastructure
Unit cost economics
Human resources
Technology & innovation
Productivity – Value
Wealth
The productivity – competitiveness wheel
Source: Christos Pitelis, Judge Management Institute, Cambridge
19D
SA
Pro
ject
– P
lannin
g
Refo
rm
CompetitivenessCompetitiveness
FDI AttractionFDI AttractionDevelopment of Development of
Physical and Physical and ICT ICT
InfrastructureInfrastructure
Political Political Stability & Stability &
Gov’t Roles & Gov’t Roles & SupportSupport
InnovationInnovation
Specific Human Specific Human Capital- Skills Capital- Skills
& Price& Price
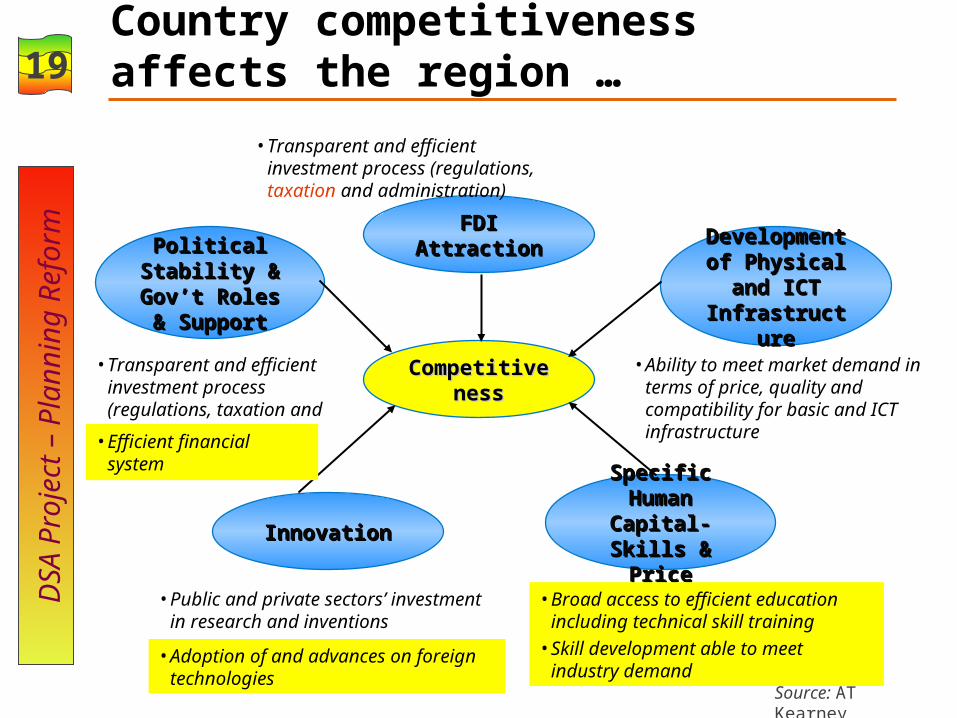
• Ability to meet market demand in terms of price, quality and compatibility for basic and ICT infrastructure
• Transparent and efficient investment process (regulations, taxation and administration)
• Broad access to efficient education including technical skill training
• Skill development able to meet industry demand
• Public and private sectors’ investment in research and inventions
• Transparent and efficient investment process (regulations, taxation and administration)
Country competitiveness affects the region …
Source: AT Kearney
• Efficient financial system
• Adoption of and advances on foreign technologies

20D
SA
Pro
ject
– P
lannin
g
Refo
rm
SNNPR & Competitiveness

21D
SA
Pro
ject
– P
lannin
g
Refo
rm
• AnalysisComparative advantage
competitive advantageDifferentiation & focusLinkages, clusters, innovationOwnership structure
• Action plans linked to resource allocation & selected strategic targets
SNNPR & competitiveness / growth

22D
SA
Pro
ject
– P
lannin
g
Refo
rm
Comparative advantage, differentiation, focus
• Comparative advantage in (‘commercial’) agriculturecoffeespiceshides & skinsdairy
• Action plan – how to turn these advantages to competitive advantage?Development of a regional policyRoads, irrigation, local processing capacityFocus on innovation rather than ‘across the
board’ extensionFarmer support institutions

23D
SA
Pro
ject
– P
lannin
g
Refo
rm
Comparative advantage, differentiation, focus
• Comparative advantages in tourismEco tourismWild life (birds, game reserves)Sport (fishing, rafting)Ethnic groups
• How to create ‘destination competitiveness’?Infrastructure (roads, accommodation)Price competition (high costs of travel)Ancillary services (tour operators, car rental)Tax incentives (import duties for tour
operators)Public private partnerships
24D
SA
Pro
ject
– P
lannin
g
Refo
rm
Comparative advantage, differentiation, focus
•Comparative advantage in manufacturing …Large scale manufacturing not regionally
based, loss making / low quality SOEs run from Addis Ababa, skilled but disempowered local management
•Creation of local linkages textiles and local cotton, coffee production and processingdairy(chat?)
25D
SA
Pro
ject
– P
lannin
g
Refo
rmClusters
• Raise productivity by allowing access to specialised inputs and employees, information, institutions and public goods (education, security)
• Increase capacity for innovation by more rapid diffusion of technology and innovation
• Stimulate higher rates of business formation• Cooperatives are a form of cluster
• Next step – to undertake an ‘audit’ of stakeholders along selected value chains together with strengthening existing coordinating body or creating a new one

26D
SA
Pro
ject
– P
lannin
g
Refo
rm
Growth & Agriculture
27D
SA
Pro
ject
– P
lannin
g
Refo
rmImportance of agriculture
• The ideas of competitive advantage may be most applicable to commercialised agriculture and agriculture processing
• The region also needs to address the constraints on small-scale peasant agriculture
• Some recent government policy changes are positiveEncouragement to expand exportsCooperatives seen as essential for marketing
commodities‘Non-peasant’ commercial farms encouraged
through land allocation and infrastructure development

28D
SA
Pro
ject
– P
lannin
g
Refo
rmRegional policy
• The Region does not have its own distinctive policy for agriculture although it has its own characteristics and wide diversity

29D
SA
Pro
ject
– P
lannin
g
Refo
rm
Why a regional agriculture policy?• Decisions on effective measures to
increase value added are best made as locally as possible
• Current extension methods (assisting individual farmers and groups of farmers) may not be the best use of public money, and more detailed area analysis is needed leading to more targeted resources. This involves classification of the full set of potential instruments available at each level.

30D
SA
Pro
ject
– P
lannin
g
Refo
rm
Development of a regional policy
•federal policies and legislation (eg land holding, marketing systems, financial institutions, grades & standards, cooperatives)
•federal institutions (eg DPPC)•federal development programmes across
regions•marketing chains extending beyond regional
boundaries
• Dialogue required with various stakeholders in order to deal with constraints …
Constraints on development of a distinct regional policy

31D
SA
Pro
ject
– P
lannin
g
Refo
rm
Increasing the value of farm output• Agriculture growth normally measured at
constant prices to assess physical output• Price increases bring greater benefits to
producer households, but may have adverse effects on food security
• Increase the weight or volume of existing crops
• Raise unit values of existing crops• Substitution of one crop for another
Three ways of increasing value of farm output

32D
SA
Pro
ject
– P
lannin
g
Refo
rm
1. Increase output of existing crops
• Increased use of inputspresent extremely low
use of purchased inputs – 4.4% of gross value of production in 1992; only 14,000 tons in region (12 tons on coffee in Gedeo!); little use of improved seed.
Low availability of inputs, low rural savings, inflexible publicly planned
marketing systems …
• improved storage (at present about 30% wastage)
• irrigation – in SNNPR 21,000 ha irrigated out of 1.4 million ha cultivated (1.4 per cent)
• adding a crop cycle
• inter-planting
Increased yield per area Increased planted area

33D
SA
Pro
ject
– P
lannin
g
Refo
rm2. Raising producer prices
• improves storage• improved
efficiency in marketing & processing (lowering net margins and shifting benefit to producer)
Increase in price for a particular
quality • improved pest & disease control
• post-harvest technology improvement (threshing of teff, drying of coffee)
• Investment (solid threshing floors, unwashed coffee drying tables)
Produce and sell higher qualities

34D
SA
Pro
ject
– P
lannin
g
Refo
rm3. Switching between crops
• Over the long term introduction of new crops has been the main source of agriculture output growth in sub-Saharan Africa
• Only evidence (apart from chat) of switching in SNNPR is to coffee (not through innovation but through government policy)Only innovations have been washed
processing & organisation in cooperatives

35D
SA
Pro
ject
– P
lannin
g
Refo
rm
Agriculture: Some policy activities …

36D
SA
Pro
ject
– P
lannin
g
Refo
rmInnovation & infrastructure
• Need for innovation to improve the value of output should be the focus for extensionSome reorientation of regional budget policies
(in particular a better focus on expenditures that stimulate agriculture growth
• Strong government support for infrastructure (particularly roads and water)
• Sequential development of lowlands and a better balance between high / mid altitude zones and lowlands

37D
SA
Pro
ject
– P
lannin
g
Refo
rmPost-harvest technology
• large scale destruction of value through physical losses deterioration in quality
• fear of losses increases intensity of market gluts leading to low prices
Improved post-harvest technologies
and storage • communal storage facilities and grain banks
• micro-finance institutions lending for investment in post-harvest technologies
• household subsidies for materials for improved on-farm post harvest infrastructure
Financial support could be provided for:
-
38D
SA
Pro
ject
– P
lannin
g
Refo
rm
What is required? Milk production & marketing
• Cow milk and butter account for one third of the region’s agriculture GDP, with double the value added of cereals and three times the value added of coffee. Even if overestimated, dairy products are important to the region
• Region is not a significant exporter of dairy productsRegion imports powdered milk
• Development of milk marketing & processing would lead to a switch out of indigenous breeds to higher producing cattle & a significant impact on RGDP

39D
SA
Pro
ject
– P
lannin
g
Refo
rmCoffee
• 10 year Coffee Development & Marketing Plan could have an adverse affect on the SNNPR because of the switch from unwashed to washed processing – SNNPR the only region in which most coffee is washedReduced premia on washed coffee Increase in over-capacity in primary processing in
the region, raising unit costs and reducing producer prices
Increased processing in cooperatives could raise costs vs maintaining the trend towards private sector processing
Large scale washed processing methods may not be in the region’s interest – small scale semi-washed processing reduces pollution & would increase value in some areas

40D
SA
Pro
ject
– P
lannin
g
Refo
rmCoffee
• Regional Inspection and Quality Certification Centres (RIQCCs) will create greater market efficiencyincreased incentives to improve qualityprocessors will gain confidence in the quality of
the cherry they have bought and enter into forward contracts
regional coffee would be sold by sample at the Addis Ababa auctions, obviating the long delays and trucking journeys
• Regional government must be fully involved in the planning and siting of the RIQCCs

41D
SA
Pro
ject
– P
lannin
g
Refo
rm
Public Finance Management for Competitiveness
and Growth

42D
SA
Pro
ject
– P
lannin
g
Refo
rmDecentralised?
• Can regions change federal policies?• Can regions adapt federal policies?• What public finance management
discretion does a region have?• Need for strong federal – regional
dialogue• Therefore need to clarify which growth
policy instruments …are under federal government discretionare under regional government discretioncan be transferred from federal to regional
government

43D
SA
Pro
ject
– P
lannin
g
Refo
rmTargets
• Little point in presenting detailed year on year growth targetsMuch projected growth autonomous &
unpredictable, andit is unclear who is responsible
• Set indicative medium term targets for broad aggregates, but be clear where accountability / discretion lies
• BOFED needs to play a more creative role on top of routine allocation activities

44D
SA
Pro
ject
– P
lannin
g
Refo
rmCapital budget
• Most significant & direct impact on growth within government discretion is the capital budget
• Main issue is the composition of the capital budget, which may be influenced more by ‘capacity building’ than growth considerationshave public sector interventions leading to
economic growth been neglected? region arguably has little real discretion on
major investments from its ‘own’ budget, hence creating a potentially serious constraint on using the public sector for growth
offset system still requires reform

45D
SA
Pro
ject
– P
lannin
g
Refo
rm
Investment planning – what needs to be done?
• Identify strategic interventions with the objective of raising growth and competitiveness, coupled with selective indicators
• More technical analysis of the relative returns to different types of investment – this is a serious deficiency in Ethiopian public investment planning
• Is infrastructure spending sufficient?

46D
SA
Pro
ject
– P
lannin
g
Refo
rmInvestment planning …
• What types of analysis do we need? An example if analysis underpinning priorities in Viet Nam … Similar analysis lacking in Ethiopia?

47D
SA
Pro
ject
– P
lannin
g
Refo
rm
Recurrent budget and strategic intervention
• Subsidies (distribution of economic rent)selection of potential incentives
• Identify performance criteria for key regional ‘growth’ bureausneed to identify innovation opportunities
• Better scrutiny of sectoral allocations to increase allocative efficiency

48D
SA
Pro
ject
– P
lannin
g
Refo
rm
Next steps

49D
SA
Pro
ject
– P
lannin
g
Refo
rm
Operationalise the REPR – ‘commercial’ sectors• What can be included in the 1998 - 2000 PEP?
First step
policy commitment from BOFED / regional cabinet
Second step
identification of key production and marketing opportunities, leading to active clustering policies
• identification of key production and marketing opportunities, leading to active clustering policies
• agriculture – milk, high value crops, coffee innovation, …
• tourism & manufacturing
• infrastructure• …. ?