drug-related deaths in the uk
TRANSCRIPT
Drug-related deaths in the UK
Hamid Ghodse John Corkery Hugh Claridge Christine Goodair Fabrizio Schifano
National Programme on Substance Abuse Deaths (np-SAD) International Centre for Drug Policy (ICDP) St George’s,
University of London, UK
Annual Report 2012

np-SAD
International Centre for Drug Policy
i
National Programme on Substance Abuse Deaths (np-SAD)
Drug-related deaths reported by Coroners in England, Wales, Northern Ireland, Guernsey, Jersey and the Isle of
Man; Police forces in Scotland; & the Northern Ireland Statistics and Research Agency
Annual Report January-December 2011
Hamid Ghodse John Corkery Hugh Claridge
Christine Goodair Fabrizio Schifano
np-SAD
International Centre for Drug Policy
ii
International Centre for Drug Policy St George’s, University of London Cranmer Terrace, London SW17 0RE Telephone +44 (0)20 8725 5522 & Fax +44 (0)20 8725 3538 E-mail: [email protected] Website: http://www.sgul.ac.uk/research/projects/icdp
© 2013 International Centre for Drug Policy All rights reserved. No part of this publication may be reproduced, stored in a retrieval system, or transmitted in any form, without the written permission of the publisher.
ISBN: 978 1 897778 79 1

np-SAD
International Centre for Drug Policy
iii
Contents Preface v Acknowledgements vi
Annual Report for January-December 2011 Executive summary 1 Introduction 4 Chapter 1 Drug-related deaths in England using the np-SAD definition 5
Profile of np-SAD cases
Psychoactive Substances implicated in death
Drug abuse/dependence
Changes between 2010 – 2011
Deaths per 100,000 population by area
Commentary
Chapter 2 “Drug misuse” deaths in England using the Drug Strategy definition 35
Profile of Drug Strategy cases
Psychoactive Substances implicated in death
Drug abuse/dependence
Other issues
Changes between 2010 and 2011
Ten year trends in death 2002 – 2011
Deaths per 100,000 population by area
Breakdown for English regions
Commentary
Chapter 3 Drug-related deaths in Wales 69
Demography
Substances implicated in death
Regional data
Commentary Chapter 4 Drug-related deaths in Northern Ireland 75
Demography
Substances implicated in death
Commentary Chapter 5 Drug-related deaths in Scotland 79
Demography
Substances implicated in death
Regional data
Commentary Chapter 6 Drug-related deaths in the Islands (Guernsey, Jersey and the Isle of Man) 85
Demography
Substances implicated in death
Commentary

np-SAD
International Centre for Drug Policy
iv
Chapter 7 Drug-related deaths in the UK 91
Number of deaths reported
Demography
Substances implicated in death
Commentary Chapter 8 Commentary & Emerging Themes 99
General patterns
Emerging issues o Opioid-related deaths o Novel psychoactive substances
Conclusions Select Bibliography on Novel Psychoactive Substances 105 References 108
Appendices
1: The national programme on Substance Abuse Deaths 112 2: Definitions of drug-related death 115
np-SAD definition
“Drug misuse” definition
Definition used by SCDEA 3: Coroners’ jurisdictions/police force areas reporting 117 drug-related deaths, United Kingdom & Islands 4: np-SAD data collection form 124
np-SAD
International Centre for Drug Policy
v
Preface It is with sadness that I dedicate the 13
th np-SAD annual report to the memory of Professor
Ghodse, (1938-2012) who led in establishing this national programme to report on drug-related mortality. In 1978 he wrote, with others, a paper for the British Medical Journal on Mortality among drug addicts in London. His research interest in this area grew along with the belief that monitoring drug mortality data would contribute to the prevention and treatment of addiction, as well as informing policy, and as he stated in a press release in 1998: “Information on drug-related deaths is suspected to be greatly under-reported in the United Kingdom. Factors which contribute to the under-reporting may include: the illicit nature of substance use, lack of training in recognising the problem, lack of resource and expertise in systematic data collection. In recognition of this the Department of Addictive Behaviour, based at St George’s Hospital Medical School, established a programme on Substance Abuse Deaths (np-SAD), with the intention of gathering information from various sources to inform clinicians and policy makers on risks associated with premature death due to substance misuse” This report presents information on drug-related deaths, both of addicts and non–addicts, that occurred during 2011 and for which coronial inquests and similar formal investigations have been completed. Its main purpose is to provide an analytical summary of data received and provide high-quality and consistent surveillance, and to detect and identify emerging trends and issues in respect of this phenomenon. In this way, it contributes to the reduction and prevention of drug-related deaths in the UK due to the misuse of both licit and illicit drugs The Programme could not achieve its goals and objectives without the invaluable voluntary collaboration and co-operation of Coroners and their officers across England, Wales, Northern Ireland, Guernsey, Jersey, and the Isle of Man. Scottish drug–related deaths data are provided by the Scottish Crime and Drug Enforcement Agency. Additional data is provided by the Northern Ireland Statistics and Research Agency on drug-related poisonings from the General Mortality Register. The contributions from all these sources are important as it enables the Programme to maintain a UK-wide reporting and surveillance system. We thank them all for their active participation and support. The findings show a decrease in the number of deaths in 2011 reported directly to np-SAD by Coroners from England, Wales, Northern Ireland and the Islands when compared to the number reported in last year’s report. Death notifications recorded by the Scottish Police also decreased. Part of the fall in Coroners’ notifications may be attributed to a slightly lower notification rate, and partly to a fall in actual fatalities. The latter would be in line with official statistics which showed a fall in deaths registered in 2011. As in the previous fifteen years, the statistics in this report are intended to inform authorities at the local, regional and national levels, as well as health professionals and the general public, about the serious consequences of drug abuse, especially polydrug use. The report also provides a number of indications of changes in patterns of drug abuse, trends over time, and emerging issues from our surveillance activities so that appropriate and timely action can be taken. This programme owes its existence to the commitment and dedication that Professor Ghodse demonstrated, and we can only hope and trust that this excellent work continues as a memorial to him. Professor Fabrizio Schifano Acting Director International Centre for Drug Policy St George’s, University of London
np-SAD
International Centre for Drug Policy
vi
Acknowledgements We are grateful to the Coroners listed below, their deputies, officers and assistants, for providing the information in this report. We apologise if we have inadvertently omitted anyone. In some areas, the Coroners do not have the resources to provide information but have kindly permitted others that collate such information to pass this on to us on their behalf; we thank those individuals who have contributed information in this way. We are also indebted to the Scottish Crime and Drug Enforcement Agency and the Northern Ireland Statistics and Research Agency for the provision of data relating to their respective countries. We would like to thank Dr Sarah White, Biostatistician at St George’s University of London, for her input and review of the report. J R H Adeley, Preston & West Lancashire R J Allen, Wolverhampton E Armstrong, North Tyneside, South Northumberland W J Armstrong, Greater Norfolk/County of Norfolk I Arrow, Torbay & South, Plymouth & South
West, Isles of Scilly P Bedford, Berkshire D T Bowen, Gwent A M Bradley, Hampshire - North East T Brown, North Northumberland P L Brunton, Ceredigion M J C Burgess, the Queen’s Household E E Carlyon, Cornwall T Carney, Gateshead & South Tyneside M Casey, Nottinghamshire R M Cobb, North East Kent A K Cotter, Birmingham and Solihull A R Craze, East Sussex A C Crickmore, Gloucestershire P de Gruchy, Jersey C W M Donnelly, Hartlepool C P Dorries, South Yorkshire – Western K M Dowding, Great Yarmouth E A Earland, Exeter and Greater Devon J P Ellery, Mid & North West Shropshire,
Telford & Wrekin S P G Fisher, Louth & Spilsby, West
Lincolnshire District N G Gardiner, Oxfordshire A A Haigh, South Staffordshire D M Halpern, Herefordshire V Hamilton-Deeley, Brighton & Hove P Harding, Mid Kent & Medway A. Harris, London - Inner South M E Hassell, Cardiff & Vale of Glamorgan R Hatch, North West Kent D Hinchliff, West Yorkshire – Eastern A V Hind, Blackpool & the Fylde E S Hooper, South Yorkshire – Eastern D C Horsley, Portsmouth & South East
Hampshire J B Hughes, North East Wales R A Hulett, Buckinghamshire R. Hunter, Derby & South Derbyshire, North
Derbyshire C Inyama, Eastern London
C W Johnson, Wirral M C Johnston, Western Dorset P Kelly, North Lincolnshire & Grimsby T.H. Kirkman, Rutland & North Leicestershire J.M Layton, Pembrokeshire & Carmarthenshire J Leckey, Northern Ireland J Leeming, Greater Manchester - West P Maddox, Bridgend & Glamorgan Valleys,
Powys C Mason, Leicester City & South Leicestershire J A Matthews, Isle of Wight P B Matthews, City of London N Meadows, Greater Manchester, Central D Mitford, Newcastle upon Tyne D S Morris, Bedfordshire & Luton N Mundy, South Yorkshire - Eastern J Needham, Isle of Man S R Nelson, Greater Manchester, North M D Oakley, North Yorkshire - Eastern T Osborne, Milton Keynes R N Palmer, South London S Payne, Bournemouth, Poole & East Dorset A Pember, Northamptonshire J S Pollard, Greater Manchester, South D Pritchard-Jones, North West Wales A J A Rebello, Liverpool A S Reid, London - Inner North N L Rheinberg, Cheshire, Halton &
Warrington D Ridley, Wiltshire & Swindon D Roberts, North & West Cumbria P Robey, Guernsey P Rogers Neath Port Talbot & Swansea M R Rose, West Somerset G S Ryall, Peterborough J C Sampson, London - Inner South G M Saul, East Riding & Hull P A Schofield, West Sussex M J F Sheffield, Teesside B Sherrard, Northern Ireland G A Short, Hampshire Central M J H Singleton, Blackburn, Hyndburn &
Ribble Valley I Smith, South & East Cumbria I S Smith, Stoke on Trent & North Staffordshire
np-SAD
vii
C K Sumner, Knowsley, St Helens & Sefton J C Taylor, North & West Cumbria M Taylor, Boston & Spalding R G Taylor, East Lancashire R Travers, Surrey E G Thomas, Hertfordshire A M Thompson, West London R Turnbull North Yorkshire-Western
A Tweddle, Northern District of Darlington & South Durham, North Durham A Walker, North London R L I Whittaker, West Yorkshire- Western F Wilcox. London –Inner West G U Williams, Worcestershire T Williams, Eastern Somerset D Winter, Sunderland K S Wiseman, Southampton & New Forest
We would like to thank Barbara Loi for her contribution to data analysis and to the funders of her fellowship at St George’s which is supported by grant no. CRP_17596 from Regione Autonoma della Sardegna (L.R. 7 agosto 2007, n. 7). We also thank Dr Salvatore Casula for his contribution to data analysis and to his funders the Clinica Psichiatrica dell' Azienda Ospedaliero-Universitaria di Sassari. We would like to thank Jess Holley, Mirella Genziani, Samir Pathan and Jon Ettey for their assistance in data preparation. We would like to give special thanks to Vinesha Flaminio for her proofreading and editorial guidance. Thanks are also owed to members of the np-SAD National Steering Group: Alan MacFarlane, Chair of the National Steering Group Judith Bernstein, Ministry of Justice Peter Burkinshaw, National Treatment Agency Michael Burgess, H.M. Coroner for Surrey & The Queen’s Household David Chater, Department for Education Tommy Crombie, Scottish Crime & Drugs Enforcement Agency Dr Paul Dargan, St Thomas’ Hospital London Michael Dobson, SOCA Frank Dixon, General Register Office for Scotland Dr Karin Sehmer, Forensic Medical Examiner & H.M. Deputy Coroner for Surrey Karen Eveleigh, Welsh Assembly Government James Grieve, National Drug Users Network Glenda Daniels, National Drug Users Network Michelle Judge, National Treatment Agency
Alan Lewis, Welsh Assembly Government John McCracken, Department of Health Kieron Moore, Northern Ireland Statistics & Research Agency Naomi O’Neill, Northern Ireland Statistics & Research Agency Maureen McCartney, Policy Development Branch, DHSSPSNI Dr Mark Prunty, Department of Health Steve Ream, Chair of Re-Solv Dave Richards, Coroner’s Officers Association Dr Roy Robertson, Chair of National Forum on Drug Related Deaths in Scotland Graham Stevens, Co-ordinator of Brighton & Hove DAAT Jennifer Stoddart, Scottish Government Steve Taylor, National Treatment Agency Claudia Wells, Office for National Statistics David Whitmore, London Ambulance Service Steve Easton, Association of Chief Police Officers
The Programme would like to express their thanks to the Department of Health and the National Treatment Agency for their support for this very important programme.

np-SAD
International Centre for Drug Policy 1
Executive summary
This thirteenth annual report from the national programme on Substance Abuse Deaths (np-SAD) presents information on drug-related deaths that occurred during 2011 and for which coronial inquests and similar formal investigations have been completed. The Programme’s principal function is to provide high-quality and consistent surveillance, and to detect and identify emerging trends and issues in respect of this phenomenon. In this way, it contributes to the reduction and prevention of drug-related deaths in the UK due to the misuse of both licit and illicit drugs. The data and analysis in this report is intended to inform government, and relevant bodies, such as the Advisory Council on the Misuse of Drugs, and authorities at the local, regional, and national country levels, as well as health professionals and the general public, about the serious consequences of drug abuse. Key findings for the UK and Islands There were 1,757 notifications of drug-related deaths occurring in 2011 in the UK and Islands. This represents a decrease of 126 (6.7%) over the same reporting period in 2010. Data were provided by 98 of the 114 Coroners’ jurisdictions in England & Wales; a response rate of about 86%. The highest rates of drug-related deaths per 100,000 population aged 16 and over in 2011 were in the following areas: City of Manchester (14.86); Blackburn, Hyndburn & Ribble Valley (13.35); Liverpool (11.37); and Blackpool & the Fylde (11.10). The principal demographic characteristics of the decedents have remained consistent with previous reports. The majority of cases were males (72%), under the age of 45 years (66%), and White (97%). Most deaths (78%) occurred at a private residential address. The main underlying cause(s) of death were: accidental poisoning (70%); intentional self-poisoning (13%); and poisoning of undetermined intent (9%). This pattern represents an increase in accidental overdoses compared to the previous year with consequent falls in other types of overdose deaths. Accidental poisoning still remains the most frequent underlying cause of death amongst all age-groups, and older females are more likely to die of intentional self-poisoning than males. The overall pattern in the types of psychoactive drugs implicated in death has remained similar to previous years. Heroin/morphine continues to be the principal substance implicated in death in the UK and Islands. However, the proportion of deaths involving this substance has fallen from 53% in 2009 to 41% in 2010, and to 32% in 2011. The proportion of cases involving methadone rose by 4%, and that for other opiates/opioid analgesics rose by 6%. The proportion of cases in which hypnotics/sedatives (mainly the benzodiazepines diazepam and temazepam) remained stable, whilst cases involving alcohol-in-combination with other substances fell by 3%. The involvement of multiple substances in death demonstrated in this report for England, a trend found across the UK as a whole, underlines the risks associated with the co-ingestion of substances, especially central nervous system depressants such as opiates/opioid analgesics, alcohol and benzodiazepines. The decline in deaths reported in 2010 from stimulants appears to have reversed slightly for cocaine, amphetamines and ecstasy-type substances. The number of deaths involving piperazines appears to have declined further, whilst GBL/GHB cases fell compared to 2010. As in 2010, there was a substantial number of deaths reported involving novel psychoactive substances such as mephedrone and other methcathinones, and the benzodiazepine phenazepam.

np-SAD
2
Regional key findings England – np-SAD definition A total of 1,263 deaths were reported for 2011 (1358 in 2010). The demographic and drug profiles remained stable. However, there was a significant fall in the proportion of deaths involving heroin/morphine and a modest increase in the proportion involving methadone. The most common prescribed medications implicated in death were anti-depressants followed by hypnotics/sedatives. England – Drug Strategy definition (“drug misuse”) A total of 904 deaths were reported for 2011 (968 in 2010). There was a substantial reduction in the proportion of deaths attributed to heroin/morphine in 2011 compared to 2010. Despite this, heroin/morphine remained the most frequently implicated substance in “drug misuse” cases. The number of deaths due to accidental poisoning rose from 75.1% in 2010 to 78.4% in 2011, whilst deaths attributed to intentional self-poisoning increased by 2.6%, from 10.1% to 12.6%. Wales (np-SAD) Notifications of 81 deaths were reported for 2011 (81 in 2010). There were increases in the proportions of males and those unemployed and those living with others. There were modest increases in the proportions of deaths involving methadone, other opiates/opioid analgesics, anti-depressants, and hypnotics/sedatives. Scotland (np-SAD) The number of deaths reported to police in Scotland fell in 2011 to 336 (365 in 2010). Opiates play a larger role in Scottish deaths than in other regions; this may be due in part to the different definition used by the police. Alcohol-in-combination with other substances and hypnotics/sedatives (mostly diazepam and temazepam) also featured prominently. There were falls in the proportions of deaths involving heroin/morphine and alcohol-in-combination, but increases for those involving methadone, other opiates/opioid analgesics and hypnotics/sedatives. Northern Ireland (np-SAD) The number of cases reported in 2011 was 70 (72 in 2010). The drug profile remained similar to recent years; heroin/morphine and methadone are less prominent than elsewhere. There was an increase in the proportion of female deaths. The Islands (np-SAD) Two deaths occurred on Jersey, two on the Isle of Man, and three on Guernsey during 2011. The general demographic profile of cases in the Islands is in line with the pattern in the UK as a whole. There were proportionately fewer deaths involving cocaine and methadone. Key messages The main changes noted in 2011 are a further overall fall in the proportion of deaths involving heroin/morphine but an increase in the contribution played by methadone. Whilst opiates and opioids continue to dominate, towards the end of 2009 there was a noticeable decline in the number and proportion of cases involving stimulants. To some extent these changes appear to have been reversed slightly for amphetamines, cocaine and ecstasy-type drugs. Substances such as piperazines, ketamine and GBL which at the time of the 2009 report were ‘legal highs’ but became controlled drugs, continue to be present in post-mortem toxicology reports - although declining in the case of piperazines and GHB/GBL. Towards the end of 2009 new substances, chiefly
np-SAD
International Centre for Drug Policy 3
methcathinones such as mephedrone started to appear in reports to np-SAD. These increased during 2010 and 2011. The speed with which these and other new substances are continuing to replace established recreational drugs means it is important that surveillance and monitoring of the situation continues.

np-SAD
4
Introduction This thirteenth annual report continues the series of reports published by the national programme on Substance Abuse Deaths (np-SAD). It covers deaths occurring between January and December 2011 reported to the Programme, as well as presenting information on emerging trends, and seeking to identify future potential issues that need monitoring. There is a chapter for each constituent part of the UK (England, Wales, Scotland, Northern Ireland and Guernsey, Jersey and Isle of Man) with data tables. Chapter 1 provides a substantive description of the situation regarding drug-related deaths in England during 2011 meeting the np-SAD case definition, including data tables for a detailed breakdown of areas within England. Chapter 2 looks at deaths in England meeting the definition used for the Drug Strategy. Chapters 3 to 6 cover the other parts of the UK and Islands, with Chapter 7 presenting findings for the UK as a whole. A commentary on emerging issues is given in Chapter 8. The appendices provide information on the Programme (Appendix 1), drug-related death definitions (Appendix 2), the areas reporting, (Appendix 3), and the Programme’s data collection form (Appendix 4). Quality Assurance of Data The Programme has given consideration as to how it can ensure the quality, accuracy and comprehensiveness of the data collected in order to improve both the quality of information collected and to establish if all relevant cases are being identified and notified. Following a pilot phase in 2008-9, a continuous rolling programme of visits to a sample of geographically representative Coroners’ areas in England and Wales was undertaken in 2009-10. Such surveys help to establish the extent to which cases are being correctly identified. This makes it possible to extrapolate from the deaths notified by participating areas to the expected number of cases if all Coroners were reporting all cases, thereby providing a much more precise estimate of drug-related deaths (DRDs) for policy and intervention planning.
This activity also provides insights into the quality and accuracy of the information submitted to the Programme, and has provided a firm basis for a process of audit in the future, thereby ensuring the consistent validation of the Programme’s surveillance work. This work also facilitates the drawing up of detailed guidance for Coroners and their staff in identifying and reporting relevant cases to np-SAD. The methodology used for this study was to select and examine completed inquests for deaths, available in Coroners’ offices, occurring in 2008. A statistically representative sample of 150 DRDs reported to the Programme was drawn for the quality assurance aspect based on cases reported by Coroners in England and Wales. To ascertain the accuracy of case identification and reporting, a 10% sample of records was drawn randomly from files for all completed inquests (for whatever reason) for each selected Coroner’s area. A total of 375 such completed inquests on all types of death in 2008 were examined. Geographical representativeness was based on selecting one Coroner’s area in each of the ten Strategic Health Authority (SHA) areas in England and two in Wales. For England there was a two-stage sampling process. In the first stage, three Coroners’ areas from each SHA area was selected on the basis of the highest number of inquests completed. The second stage consisted of randomly selecting one of these three areas for investigation. The key findings from this survey show that the information received by the Programme from Coroners is consistent with the coronial inquest file papers. This exercise did not identify any ‘false positives’ i.e. any over-reporting. In 2008 five cases, where one or more controlled drugs or psychoactive substances were mentioned, were not reported to np-SAD. An extrapolation of these five cases projects an increase of 50 in the number of reported cases from Coroners in England and Wales in 2008. The degree of under reporting in both the 2007 and 2008 cases is comparable (3.9% and 3.3% respectively). This underlines the consistency in reporting.

np-SAD
International Centre for Drug Policy 5
Chapter 1: Drug-related deaths in England using the np-SAD definition This chapter examines drug-related deaths which occurred in England in 2011 - reported voluntarily by Coroners - and also examines trends over the past decade for illicit substances and prescribed medications implicated in death. Responses were received from a total of 89 out of 101 Coroners' jurisdictions in England, giving a total coverage rate of 88.1%. The first section in this chapter examines the overall demographics of drug-related deaths reported
to np-SAD; examines cases that capture a range of psychoactive drugs; and covers the history of drug use irrespective of the cause of death. Included within this section is a comparison of those with a history of drug use against those without. This section highlights any changes made between 2010 and 2011 including figures for the Coroners’ jurisdictions and a breakdown for the English regions.
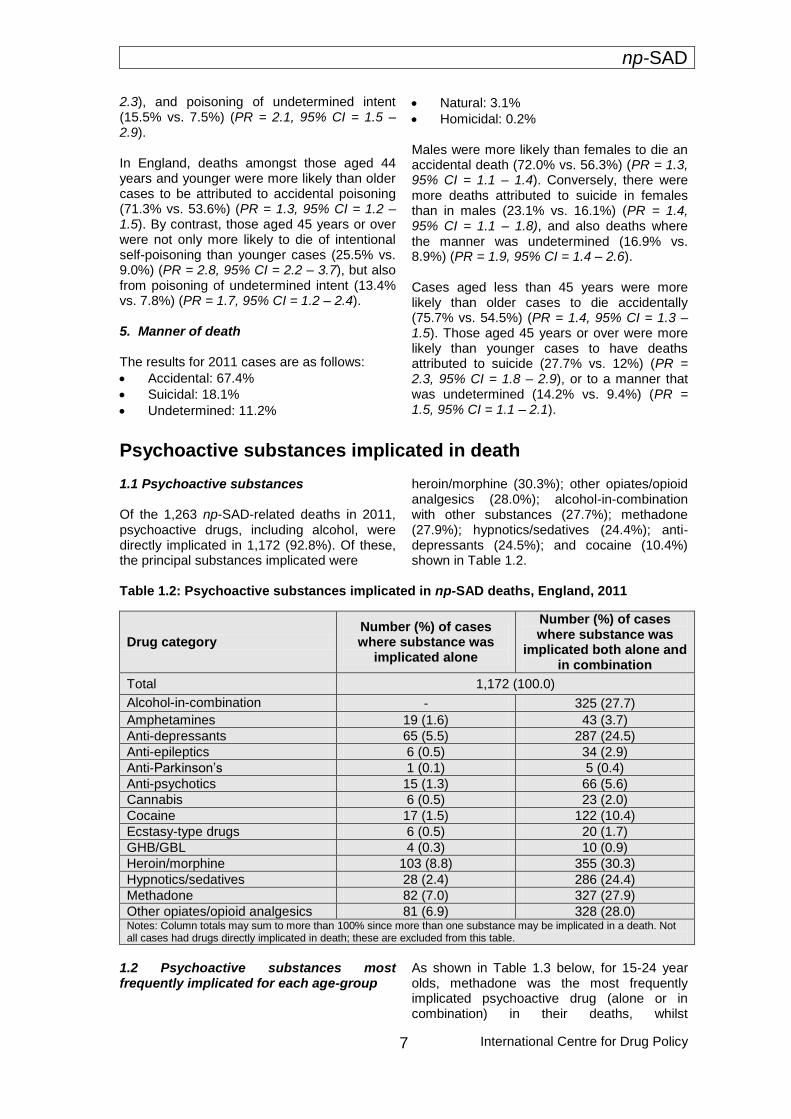
Profile of np-SAD cases 1. Demography In 2011, there were 1,263 np-SAD drug-related deaths reported to the Programme. Male cases accounted for 70.5%, whilst 29.5% were female (Table 1.1 and Figure 1.2). Half (50.6%) were unemployed. Over sixty per cent
(60.9%) of deaths occurred for those less than 45 years old. 44.1% lived alone, 42.5% lived with others, and 2.1% were of no fixed abode. Where ethnicity was known (n = 894), the vast majority were White (95.4%); with the remainder Asian (1.9%); Black (1.6%); and Chinese and other ethnicities (1.1%).
Table 1.1: Demographic variables for np-SAD drug-related deaths, England, 2011
2. Age
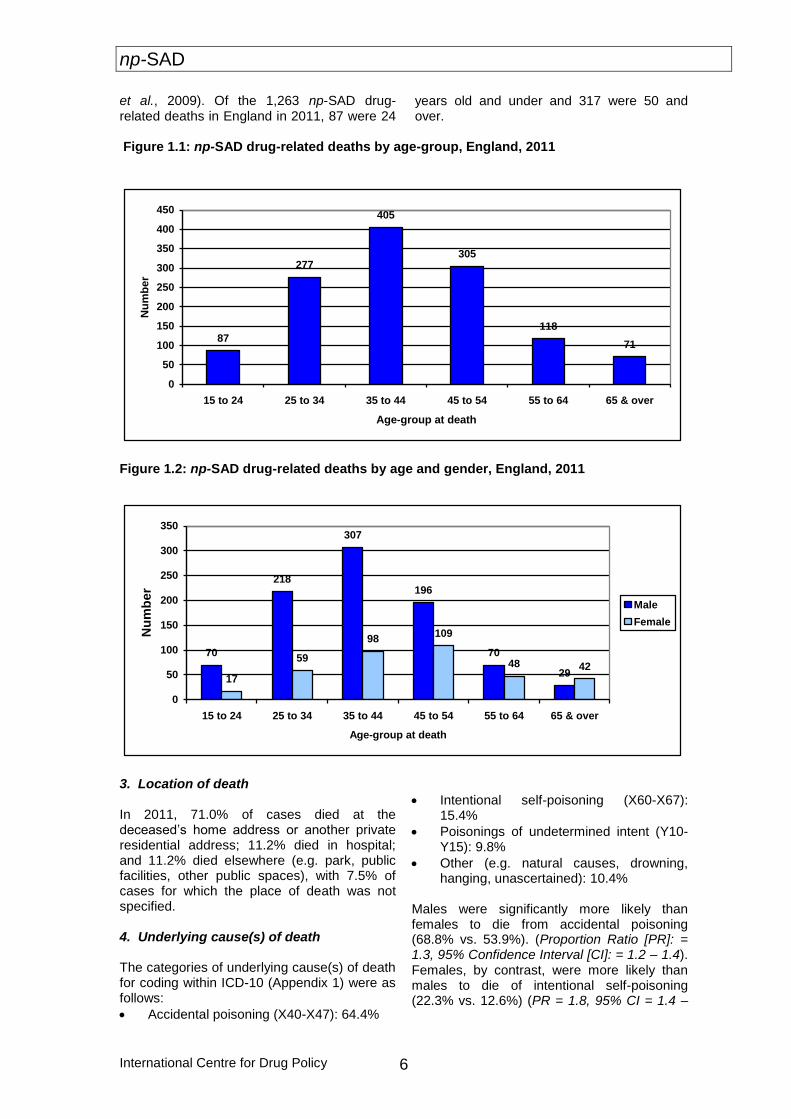
Most np-SAD drug-related deaths in England during 2011 occurred amongst those aged 35 years and over (71.2%), with 21.9% aged 25-34, and only 6.9% being 15-24 years old
(Figure 1.1). The median age at death was 41.9 years (interquartile range = 16.4). Older male, White drug users are at most risk of drug-related deaths (Bird et al., 2003; Ghodse
Variable Category Number (%)
Total
1263 (100.0)
Gender Male 890 (70.5)
Female 373 (29.5)
Employment status
Unemployed 639 (50.6)
Employed 350 (27.7)
Childcare/house-person 30 (2.4)
Student 21 (1.7)
Retired/sickness/invalidity 116 (9.2)
Other 11 (0.9)
Not known 96 (7.6)
Living arrangements
Alone 557 (44.1)
With others 537 (42.5)
No fixed abode 26 (2.1)
Other 58 (4.6)
Not known 85 (6.7)
Ethnicity
Asian 17 (1.3)
Black 14 (1.1)
Chinese and other 10 (0.8)
White 853 (67.5)
Not known 369 (29.2)
np-SAD
International Centre for Drug Policy 6
et al., 2009). Of the 1,263 np-SAD drug-related deaths in England in 2011, 87 were 24
years old and under and 317 were 50 and over.
Figure 1.1: np-SAD drug-related deaths by age-group, England, 2011
87
277
405
305
118
71
0
50
100
150
200
250
300
350
400
450
15 to 24 25 to 34 35 to 44 45 to 54 55 to 64 65 & over
Age-group at death
Nu
mb
er
Figure 1.2: np-SAD drug-related deaths by age and gender, England, 2011
70
218
307
196
70
2917
59
98109
48 42
0
50
100
150
200
250
300
350
15 to 24 25 to 34 35 to 44 45 to 54 55 to 64 65 & over
Age-group at death
Nu
mb
er
Male
Female
3. Location of death In 2011, 71.0% of cases died at the deceased’s home address or another private residential address; 11.2% died in hospital; and 11.2% died elsewhere (e.g. park, public facilities, other public spaces), with 7.5% of cases for which the place of death was not specified. 4. Underlying cause(s) of death The categories of underlying cause(s) of death for coding within ICD-10 (Appendix 1) were as follows:
Accidental poisoning (X40-X47): 64.4%
Intentional self-poisoning (X60-X67): 15.4%
Poisonings of undetermined intent (Y10-Y15): 9.8%
Other (e.g. natural causes, drowning, hanging, unascertained): 10.4%
Males were significantly more likely than females to die from accidental poisoning (68.8% vs. 53.9%). (Proportion Ratio [PR]: = 1.3, 95% Confidence Interval [CI]: = 1.2 – 1.4). Females, by contrast, were more likely than males to die of intentional self-poisoning (22.3% vs. 12.6%) (PR = 1.8, 95% CI = 1.4 –
np-SAD
International Centre for Drug Policy
7
2.3), and poisoning of undetermined intent (15.5% vs. 7.5%) (PR = 2.1, 95% CI = 1.5 – 2.9). In England, deaths amongst those aged 44 years and younger were more likely than older cases to be attributed to accidental poisoning (71.3% vs. 53.6%) (PR = 1.3, 95% CI = 1.2 – 1.5). By contrast, those aged 45 years or over were not only more likely to die of intentional self-poisoning than younger cases (25.5% vs. 9.0%) (PR = 2.8, 95% CI = 2.2 – 3.7), but also from poisoning of undetermined intent (13.4% vs. 7.8%) (PR = 1.7, 95% CI = 1.2 – 2.4). 5. Manner of death The results for 2011 cases are as follows:
Accidental: 67.4%
Suicidal: 18.1%
Undetermined: 11.2%
Natural: 3.1%
Homicidal: 0.2% Males were more likely than females to die an accidental death (72.0% vs. 56.3%) (PR = 1.3, 95% CI = 1.1 – 1.4). Conversely, there were more deaths attributed to suicide in females than in males (23.1% vs. 16.1%) (PR = 1.4, 95% CI = 1.1 – 1.8), and also deaths where the manner was undetermined (16.9% vs. 8.9%) (PR = 1.9, 95% CI = 1.4 – 2.6). Cases aged less than 45 years were more likely than older cases to die accidentally (75.7% vs. 54.5%) (PR = 1.4, 95% CI = 1.3 – 1.5). Those aged 45 years or over were more likely than younger cases to have deaths attributed to suicide (27.7% vs. 12%) (PR = 2.3, 95% CI = 1.8 – 2.9), or to a manner that was undetermined (14.2% vs. 9.4%) (PR = 1.5, 95% CI = 1.1 – 2.1).
Psychoactive substances implicated in death
1.1 Psychoactive substances Of the 1,263 np-SAD-related deaths in 2011, psychoactive drugs, including alcohol, were directly implicated in 1,172 (92.8%). Of these, the principal substances implicated were
heroin/morphine (30.3%); other opiates/opioid analgesics (28.0%); alcohol-in-combination with other substances (27.7%); methadone (27.9%); hypnotics/sedatives (24.4%); anti-depressants (24.5%); and cocaine (10.4%) shown in Table 1.2.
Table 1.2: Psychoactive substances implicated in np-SAD deaths, England, 2011
Drug category Number (%) of cases where substance was
implicated alone
Number (%) of cases where substance was
implicated both alone and in combination
Total 1,172 (100.0)
Alcohol-in-combination - 325 (27.7)
Amphetamines 19 (1.6) 43 (3.7)
Anti-depressants 65 (5.5) 287 (24.5)
Anti-epileptics 6 (0.5) 34 (2.9)
Anti-Parkinson’s 1 (0.1) 5 (0.4)
Anti-psychotics 15 (1.3) 66 (5.6)
Cannabis 6 (0.5) 23 (2.0)
Cocaine 17 (1.5) 122 (10.4)
Ecstasy-type drugs 6 (0.5) 20 (1.7)
GHB/GBL 4 (0.3) 10 (0.9)
Heroin/morphine 103 (8.8) 355 (30.3)
Hypnotics/sedatives 28 (2.4) 286 (24.4)
Methadone 82 (7.0) 327 (27.9)
Other opiates/opioid analgesics 81 (6.9) 328 (28.0) Notes: Column totals may sum to more than 100% since more than one substance may be implicated in a death. Not all cases had drugs directly implicated in death; these are excluded from this table.
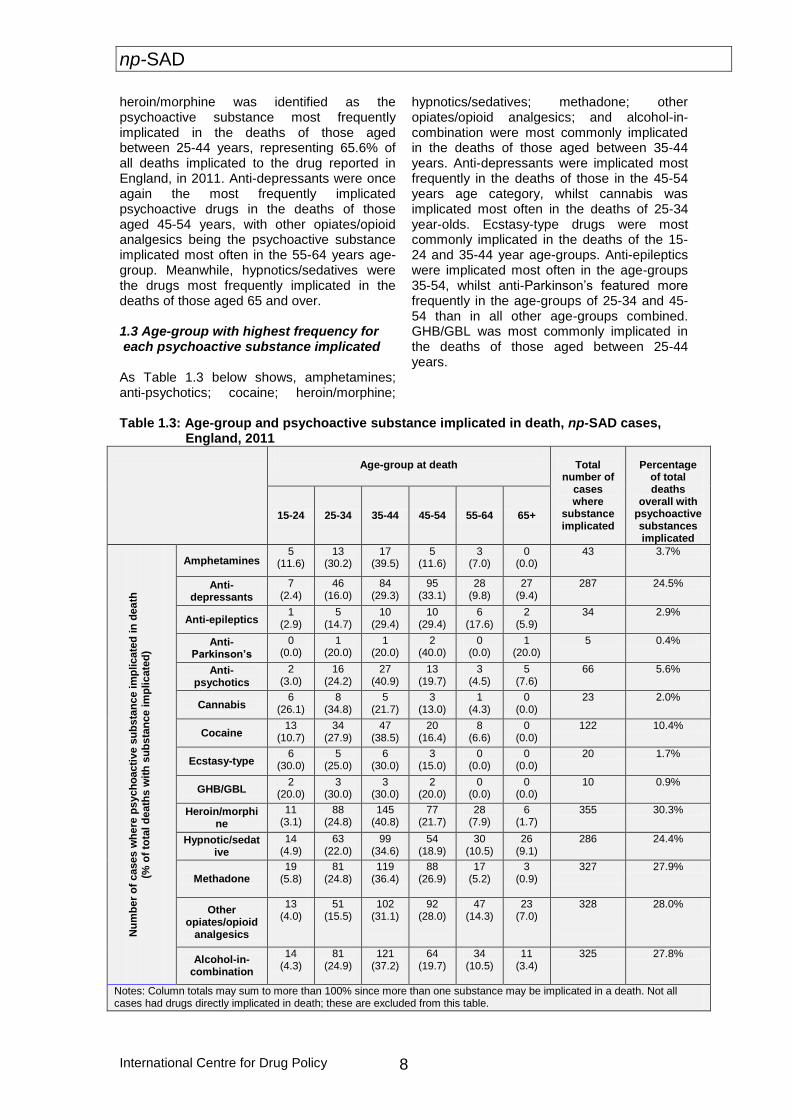
1.2 Psychoactive substances most frequently implicated for each age-group
As shown in Table 1.3 below, for 15-24 year olds, methadone was the most frequently implicated psychoactive drug (alone or in combination) in their deaths, whilst
np-SAD
International Centre for Drug Policy 8
heroin/morphine was identified as the psychoactive substance most frequently implicated in the deaths of those aged between 25-44 years, representing 65.6% of all deaths implicated to the drug reported in England, in 2011. Anti-depressants were once again the most frequently implicated psychoactive drugs in the deaths of those aged 45-54 years, with other opiates/opioid analgesics being the psychoactive substance implicated most often in the 55-64 years age-group. Meanwhile, hypnotics/sedatives were the drugs most frequently implicated in the deaths of those aged 65 and over. 1.3 Age-group with highest frequency for each psychoactive substance implicated As Table 1.3 below shows, amphetamines; anti-psychotics; cocaine; heroin/morphine;
hypnotics/sedatives; methadone; other opiates/opioid analgesics; and alcohol-in-combination were most commonly implicated in the deaths of those aged between 35-44 years. Anti-depressants were implicated most frequently in the deaths of those in the 45-54 years age category, whilst cannabis was implicated most often in the deaths of 25-34 year-olds. Ecstasy-type drugs were most commonly implicated in the deaths of the 15-24 and 35-44 year age-groups. Anti-epileptics were implicated most often in the age-groups 35-54, whilst anti-Parkinson’s featured more frequently in the age-groups of 25-34 and 45-54 than in all other age-groups combined. GHB/GBL was most commonly implicated in the deaths of those aged between 25-44 years.
Table 1.3: Age-group and psychoactive substance implicated in death, np-SAD cases,
England, 2011
Age-group at death
Total number of
cases where
substance implicated
Percentage
of total deaths
overall with psychoactive substances implicated
15-24 25-34 35-44 45-54 55-64 65+
Nu
mb
er
of
cases w
he
re p
sych
oacti
ve s
ub
sta
nc
e im
plicate
d in
dea
th
(% o
f to
tal d
eath
s w
ith
su
bs
tan
ce im
plicate
d)
Amphetamines 5
(11.6) 13
(30.2) 17
(39.5) 5
(11.6) 3
(7.0) 0
(0.0) 43 3.7%
Anti-depressants
7 (2.4)
46 (16.0)
84 (29.3)
95 (33.1)
28 (9.8)
27 (9.4)
287 24.5%
Anti-epileptics 1
(2.9) 5
(14.7) 10
(29.4) 10
(29.4) 6
(17.6) 2
(5.9) 34 2.9%
Anti-Parkinson’s
0 (0.0)
1 (20.0)
1 (20.0)
2 (40.0)
0 (0.0)
1 (20.0)
5 0.4%
Anti-psychotics
2 (3.0)
16 (24.2)
27 (40.9)
13 (19.7)
3 (4.5)
5 (7.6)
66 5.6%
Cannabis 6
(26.1) 8
(34.8) 5
(21.7) 3
(13.0) 1
(4.3) 0
(0.0) 23 2.0%
Cocaine 13
(10.7) 34
(27.9) 47
(38.5) 20
(16.4) 8
(6.6) 0
(0.0) 122 10.4%
Ecstasy-type 6
(30.0) 5
(25.0) 6
(30.0) 3
(15.0) 0
(0.0) 0
(0.0) 20 1.7%
GHB/GBL 2
(20.0) 3
(30.0) 3
(30.0) 2
(20.0) 0
(0.0) 0
(0.0) 10 0.9%
Heroin/morphine
11 (3.1)
88 (24.8)
145 (40.8)
77 (21.7)
28 (7.9)
6 (1.7)
355 30.3%
Hypnotic/sedative
14 (4.9)
63 (22.0)
99 (34.6)
54 (18.9)
30 (10.5)
26 (9.1)
286 24.4%
Methadone 19
(5.8)
81 (24.8)
119 (36.4)
88 (26.9)
17 (5.2)
3 (0.9)
327
27.9%
Other opiates/opioid
analgesics
13 (4.0)
51 (15.5)
102 (31.1)
92 (28.0)
47 (14.3)
23 (7.0)
328
28.0%
Alcohol-in-combination
14 (4.3)
81 (24.9)
121 (37.2)
64 (19.7)
34 (10.5)
11 (3.4)
325 27.8%
Notes: Column totals may sum to more than 100% since more than one substance may be implicated in a death. Not all cases had drugs directly implicated in death; these are excluded from this table.
np-SAD
International Centre for Drug Policy
9
1.4 Gender and implicated psychoactive substance
The type of psychoactive substances implicated in fatalities is somewhat different between male and female cases. Among males, the top five substances most frequently implicated alone or in combination, presented in numerical order were:
1. Heroin/morphine (34.2%) 2. Alcohol-in-combination (29.9%) 3. Methadone (29.9%) 4. Other opiates/opioid analgesics
(25.3%) 5. Hypnotics/sedatives (24.6%).
Amongst female cases, the substances most frequently implicated alone or in combination were:
1. Anti-depressants (42.7%) 2. Other opiates/ opioid analgesics
(34.5%) 3. Hypnotics/sedatives (24.0%) 4. Methadone (23.1%) 5. Alcohol-in-combination (23.1%)
Comparing the type of psychoactive substances implicated in the deaths of males and females reveals that there is a higher proportion of male deaths compared to female deaths involving heroin/morphine; alcohol-in-combination; methadone; hypnotics/sedatives; cocaine; GHB/GBL; cannabis; and ecstasy-type drugs. Females, compared to males, show a greater proportion of deaths implicating anti-depressants; other opiates/opioid analgesics; anti-psychotics; anti-epileptics; anti-Parkinson’s drugs; and amphetamines. 2. Polysubstances In 2011, 10.2% of the 1,172 psychoactive substance-related deaths reported to np-SAD involved heroin/morphine in combination with alcohol. 7.0% of cases involved hypnotics/sedatives with anti-depressants; 6.8% of cases involved other opiates/opioid analgesics combined with alcohol; whilst 6.2% of deaths involved heroin/morphine and other opiates/ opioid analgesics combined. The combination of heroin/morphine and other opiates/opioid analgesics fluctuated between 4% and 9% over the past ten years, with a general downward trend. Over the last decade alcohol-in-combination with two other stimulants constantly featured. Combinations
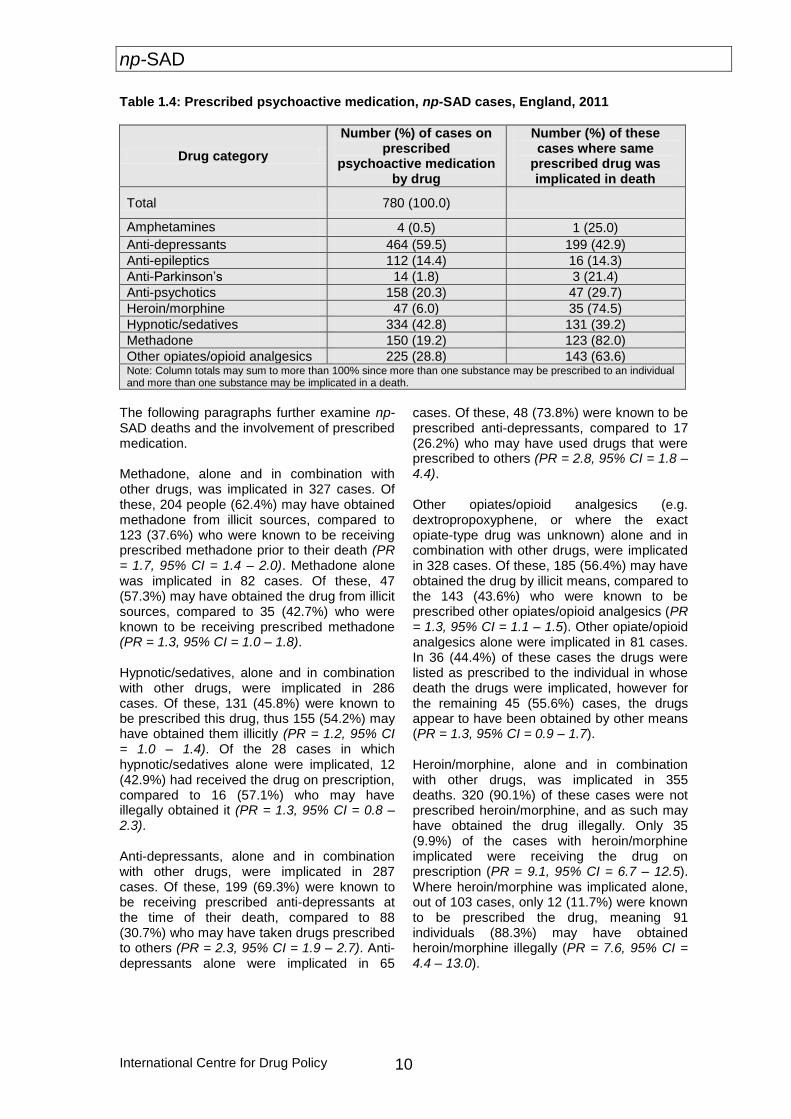
of drugs, with or without alcohol, pose greater risks for mortality (Ghodse et al., 2010). Hypnotics/sedatives in combination with other opiates/opioid analgesics accounted for 8.5% of cases in 2002 compared to 8.1% in 2011. In 2011, several different substance types, when implicated in combination, often featured with alcohol. Alcohol was implicated in 33.5% of deaths involving heroin/morphine, 35.2% involving cocaine, 34.8% of deaths involving cannabis, 30.0% of GHB/GBL deaths and 27.8% of deaths in which methadone was implicated. 3. Single substances In 2011, there were 433 (36.9%) psychoactive substance deaths in which only one of the following substances was implicated. Of these 433 deaths from single substances, heroin/morphine accounted for 23.8% of deaths; methadone for 18.9%; other opiates/opioid analgesics – 18.7%; anti-depressants – 15.0%; cocaine – 3.9%; hypnotics/sedatives – 6.5%; amphetamines – 4.4%; anti-psychotics – 3.5%; cannabis – 1.4%; ecstasy-type drugs – 1.4%; anti-epileptics – 1.4%; GHB/GBL – 0.9%; and anti-Parkinson’s – 0.2%. 4. Prescribed psychoactive drugs In total, 780/1263 cases (61.8%) were reported to be receiving prescribed psychoactive drugs at the time of their death in 2011 (Table 1.4). Within this group, prescribed drugs reported were: anti-depressants (59.5%); hypnotic/sedatives (42.8%); other opiate/opioid analgesics (28.9%); anti-psychotics (20.3%); methadone (19.3%); anti-epileptics (14.3%); heroin/morphine (6.1%); anti-Parkinson’s (1.8%); and amphetamines (0.5%). ‘Polypharmacy’, i.e. multiple prescriptions of psychoactive drugs, occurred in 67.3% (525/780) of these cases. Age appeared to be related to whether the cases were on prescribed psychoactive medication or not when prescribing history was known at the time of death, with 21.8% of 15-24 year olds prescribed psychoactive medication; 51.3% for 25-34; 35-44 (63.5%); 45-54 (71.1%); 55-64 (75.4%); and 65 and over (78.9%).
np-SAD
International Centre for Drug Policy 10
Table 1.4: Prescribed psychoactive medication, np-SAD cases, England, 2011
Drug category
Number (%) of cases on prescribed
psychoactive medication by drug
Number (%) of these cases where same
prescribed drug was implicated in death
Total 780 (100.0)
Amphetamines 4 (0.5) 1 (25.0)
Anti-depressants 464 (59.5) 199 (42.9)
Anti-epileptics 112 (14.4) 16 (14.3)
Anti-Parkinson’s 14 (1.8) 3 (21.4)
Anti-psychotics 158 (20.3) 47 (29.7)
Heroin/morphine 47 (6.0) 35 (74.5)
Hypnotic/sedatives 334 (42.8) 131 (39.2)
Methadone 150 (19.2) 123 (82.0)
Other opiates/opioid analgesics 225 (28.8) 143 (63.6) Note: Column totals may sum to more than 100% since more than one substance may be prescribed to an individual and more than one substance may be implicated in a death.
The following paragraphs further examine np-SAD deaths and the involvement of prescribed medication. Methadone, alone and in combination with other drugs, was implicated in 327 cases. Of these, 204 people (62.4%) may have obtained methadone from illicit sources, compared to 123 (37.6%) who were known to be receiving prescribed methadone prior to their death (PR = 1.7, 95% CI = 1.4 – 2.0). Methadone alone was implicated in 82 cases. Of these, 47 (57.3%) may have obtained the drug from illicit sources, compared to 35 (42.7%) who were known to be receiving prescribed methadone (PR = 1.3, 95% CI = 1.0 – 1.8). Hypnotic/sedatives, alone and in combination with other drugs, were implicated in 286 cases. Of these, 131 (45.8%) were known to be prescribed this drug, thus 155 (54.2%) may have obtained them illicitly (PR = 1.2, 95% CI = 1.0 – 1.4). Of the 28 cases in which hypnotic/sedatives alone were implicated, 12 (42.9%) had received the drug on prescription, compared to 16 (57.1%) who may have illegally obtained it (PR = 1.3, 95% CI = 0.8 – 2.3). Anti-depressants, alone and in combination with other drugs, were implicated in 287 cases. Of these, 199 (69.3%) were known to be receiving prescribed anti-depressants at the time of their death, compared to 88 (30.7%) who may have taken drugs prescribed to others (PR = 2.3, 95% CI = 1.9 – 2.7). Anti-depressants alone were implicated in 65
cases. Of these, 48 (73.8%) were known to be prescribed anti-depressants, compared to 17 (26.2%) who may have used drugs that were prescribed to others (PR = 2.8, 95% CI = 1.8 – 4.4). Other opiates/opioid analgesics (e.g. dextropropoxyphene, or where the exact opiate-type drug was unknown) alone and in combination with other drugs, were implicated in 328 cases. Of these, 185 (56.4%) may have obtained the drug by illicit means, compared to the 143 (43.6%) who were known to be prescribed other opiates/opioid analgesics (PR = 1.3, 95% CI = 1.1 – 1.5). Other opiate/opioid analgesics alone were implicated in 81 cases. In 36 (44.4%) of these cases the drugs were listed as prescribed to the individual in whose death the drugs were implicated, however for the remaining 45 (55.6%) cases, the drugs appear to have been obtained by other means (PR = 1.3, 95% CI = 0.9 – 1.7). Heroin/morphine, alone and in combination with other drugs, was implicated in 355 deaths. 320 (90.1%) of these cases were not prescribed heroin/morphine, and as such may have obtained the drug illegally. Only 35 (9.9%) of the cases with heroin/morphine implicated were receiving the drug on prescription (PR = 9.1, 95% CI = 6.7 – 12.5). Where heroin/morphine was implicated alone, out of 103 cases, only 12 (11.7%) were known to be prescribed the drug, meaning 91 individuals (88.3%) may have obtained heroin/morphine illegally (PR = 7.6, 95% CI = 4.4 – 13.0).
np-SAD
International Centre for Drug Policy
11
Drug abuse/dependence Information was available for 946/1263 individuals on their past or current history of drug abuse/dependence. Those with such a history (DAs) accounted for 64.2% (n = 607/946). Those without such a history - non drug abusers (NDAs) - accounted for 35.8% (339/946). Out of the total number of np-SAD cases reported for 2011, 25.1% (317/1263) were reported as “not known” with respect to known history of drug abuse/dependence. These cases were excluded from further analysis. 1. Demography Those with a history of drug abuse (DA) were more likely to be male than those without such a history (NDA) (78.7% vs. 56.6%) (PR = 1.4, 95% CI = 1.3 – 1.5) and 44 years and younger (71.5% compared to 42.2%) (PR = 1.7, 95% CI = 1.5 – 1.9). The median age at death for DAs was 38.9 years (interquartile range = 13.2), while that for NDAs was 47.2 years (interquartile range = 20.0) (Mann-Whitney U = 66,385.0 p <0.001). 2. Location of death When location of death was known, there was no difference between the two groups with respect to dying at home or at a private residential address, with DAs (76.5%) and NDAs (76.5%). Indeed, hospital deaths also
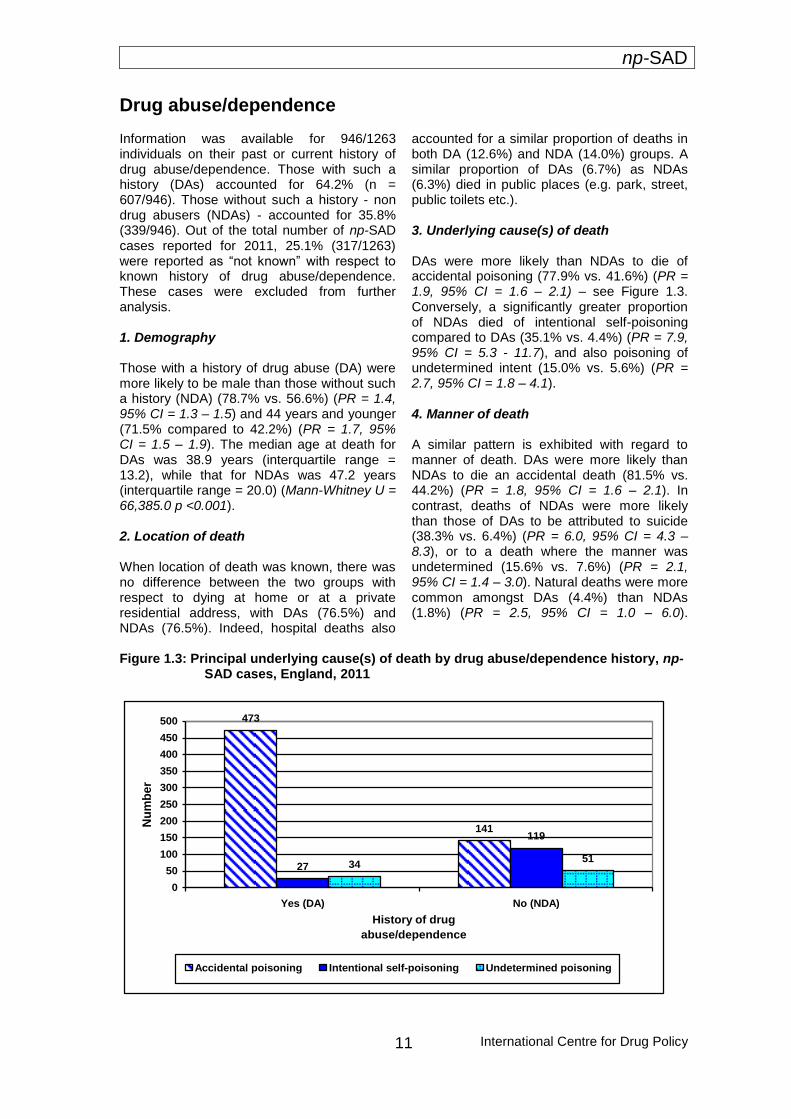
accounted for a similar proportion of deaths in both DA (12.6%) and NDA (14.0%) groups. A similar proportion of DAs (6.7%) as NDAs (6.3%) died in public places (e.g. park, street, public toilets etc.). 3. Underlying cause(s) of death DAs were more likely than NDAs to die of accidental poisoning (77.9% vs. 41.6%) (PR = 1.9, 95% CI = 1.6 – 2.1) – see Figure 1.3. Conversely, a significantly greater proportion of NDAs died of intentional self-poisoning compared to DAs (35.1% vs. 4.4%) (PR = 7.9, 95% CI = 5.3 - 11.7), and also poisoning of undetermined intent (15.0% vs. 5.6%) (PR = 2.7, 95% CI = 1.8 – 4.1). 4. Manner of death A similar pattern is exhibited with regard to manner of death. DAs were more likely than NDAs to die an accidental death (81.5% vs. 44.2%) (PR = 1.8, 95% CI = 1.6 – 2.1). In contrast, deaths of NDAs were more likely than those of DAs to be attributed to suicide (38.3% vs. 6.4%) (PR = 6.0, 95% CI = 4.3 – 8.3), or to a death where the manner was undetermined (15.6% vs. 7.6%) (PR = 2.1, 95% CI = 1.4 – 3.0). Natural deaths were more common amongst DAs (4.4%) than NDAs (1.8%) (PR = 2.5, 95% CI = 1.0 – 6.0).
Figure 1.3: Principal underlying cause(s) of death by drug abuse/dependence history, np-
SAD cases, England, 2011
473
141
27
119
3451
0
50
100
150
200
250
300
350
400
450
500
Yes (DA) No (NDA)
History of drug
abuse/dependence
Nu
mb
er
Accidental poisoning Intentional self-poisoning Undetermined poisoning
np-SAD
International Centre for Drug Policy 12
Changes between 2010 and 2011
The following section compares deaths in 2011 with those that occurred in 2010. Deaths in 2011 are reported as 1,263, whereas in 2010, 1,358 cases were reported. This is a decrease in reported np-SAD deaths of 7.0% for 2011. These figures for 2011 (and 2010, to a lesser extent) can be expected to increase as further inquests on drug-related deaths of those who died in these calendar years are finally completed (some inquests do happen in the same calendar year) and reported to the Programme. 1. Demography There were small changes between 2010 and 2011 in the demographic profile of cases. There was a slight reduction in the number of male deaths, from 72.1% to 70.5%, with a 0.5% drop in the number of deaths amongst White cases. Deaths amongst those aged between 15-34 years fell 6.3% (35.1% in 2010 to 28.8%), whilst a rise was seen in deaths of those aged 35 years and over (64.6% to 71.2%). Those listed as living with others rose 3.9%, and those with no fixed abode fell 1.1%. Decreases were also observed in the proportion of deaths occurring at a defined residential address (from 75.2% to 70.1%), and those occurring in hospital (from 14.1% to 11.2%). A 4.4% fall was seen in the number of people listed as drug addicts/abusers when history was known. 2. Underlying cause(s) of death The proportion of deaths attributed to accidental drug poisoning rose to 64.4% in 2011 (59.9% in 2010), with intentional self-poisoning deaths also increasing from 14.0% in 2010 to 15.4% in 2011. Deaths from other causes dropped from 16.0% to 10.4%, whilst poisonings of undetermined intent remained relatively stable at 9.8% in 2011 (10.1% in 2010).
3. Manner of death The patterns observed for manner of death in 2011 remained relatively stable with those seen in 2010 – deaths attributed to accidents increased by 0.7%. This is consistent with the rise seen in accidental poisonings and the
sharp drop in other accidental causes, such as drowning, RTA etc. A 0.1% reduction was witnessed in the number of deaths attributed to suicide. 4. Psychoactive substances implicated in death
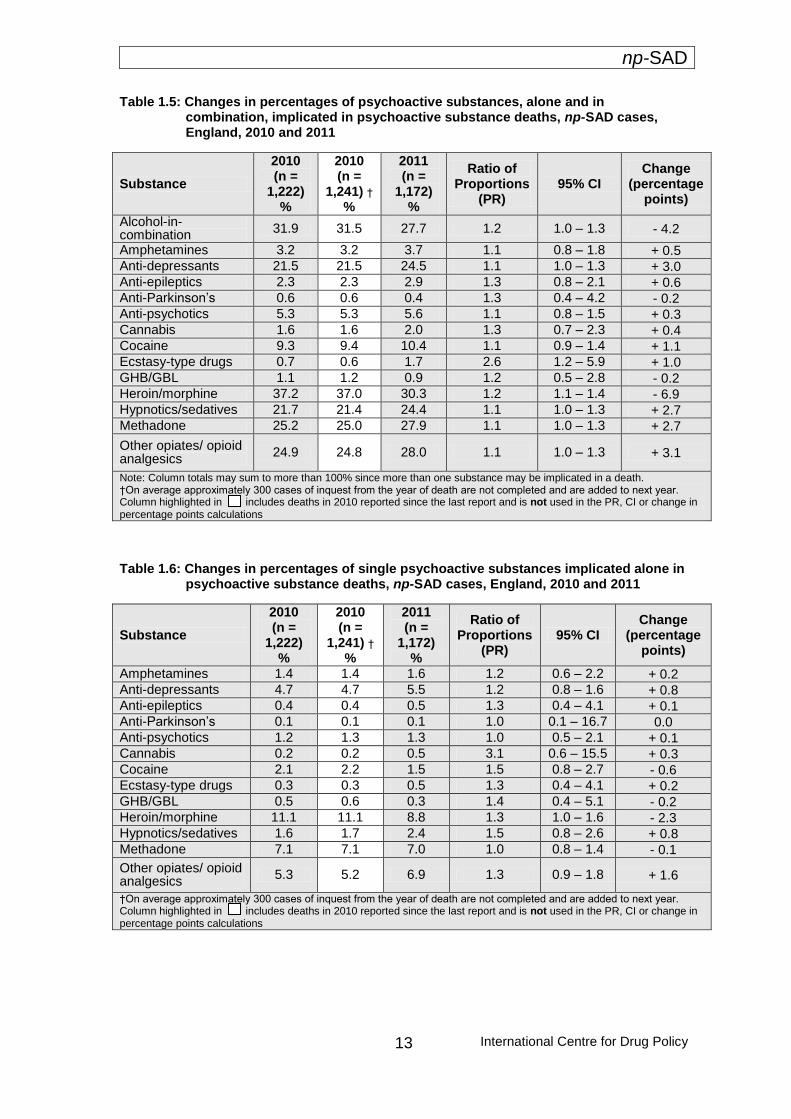
In 2011 there were 1,172/1,263 deaths that involved psychoactive substances; 91 cases were therefore excluded from the following analyses as they did not involve psychoactive substances. In 2010, 1,222/1,358 cases involved psychoactive substances
4.1 Psychoactive substances, both alone and in combination There were both absolute and proportional increases in deaths involving the following substances both alone and in combination: amphetamines; anti-depressants; anti-epileptics; anti-psychotics; cannabis; cocaine; ecstasy-type drugs; hypnotics/sedatives; methadone; and other opiates/opioid analgesics (Table 1.5). Despite heroin/morphine once again being the most frequently implicated drug, both alone and in combination, a significant drop of 6.9% was seen between the years (37.2% in 2010 down to 30.3% in 2011). Drops were also seen in deaths involving alcohol-in combination; anti-Parkinson’s; and GHB/GBL when implicated both alone and in combination. 4.2 Single substance There were slight changes between 2010 and 2011 in terms of the proportions accounted for by deaths involving a single psychoactive substance. For substances implicated alone, there were absolute and proportional increases in deaths attributed to amphetamines; anti-depressants; anti-epileptics; cannabis; ecstasy-type drugs; hypnotics/sedatives; and other opiates/opioid analgesics (Table 1.6). Anti-psychotics meanwhile were implicated in just 0.1% more single substance deaths in 2011 than 2010. There were decreases in the proportions accounted for by the following substances when implicated alone: cocaine; GHB/GBL; heroin/morphine; and methadone.
np-SAD
International Centre for Drug Policy
13
Table 1.5: Changes in percentages of psychoactive substances, alone and in combination, implicated in psychoactive substance deaths, np-SAD cases, England, 2010 and 2011
Substance
2010 (n =
1,222) %
2010 (n =
1,241) †
%
2011 (n =
1,172) %
Ratio of Proportions
(PR) 95% CI
Change (percentage
points)
Alcohol-in-combination
31.9 31.5 27.7 1.2 1.0 – 1.3 - 4.2
Amphetamines 3.2 3.2 3.7 1.1 0.8 – 1.8 + 0.5 Anti-depressants 21.5 21.5 24.5 1.1 1.0 – 1.3 + 3.0 Anti-epileptics 2.3 2.3 2.9 1.3 0.8 – 2.1 + 0.6 Anti-Parkinson’s 0.6 0.6 0.4 1.3 0.4 – 4.2 - 0.2 Anti-psychotics 5.3 5.3 5.6 1.1 0.8 – 1.5 + 0.3 Cannabis 1.6 1.6 2.0 1.3 0.7 – 2.3 + 0.4 Cocaine 9.3 9.4 10.4 1.1 0.9 – 1.4 + 1.1 Ecstasy-type drugs 0.7 0.6 1.7 2.6 1.2 – 5.9 + 1.0 GHB/GBL 1.1 1.2 0.9 1.2 0.5 – 2.8 - 0.2 Heroin/morphine 37.2 37.0 30.3 1.2 1.1 – 1.4 - 6.9 Hypnotics/sedatives 21.7 21.4 24.4 1.1 1.0 – 1.3 + 2.7 Methadone 25.2 25.0 27.9 1.1 1.0 – 1.3 + 2.7
Other opiates/ opioid analgesics
24.9 24.8 28.0 1.1 1.0 – 1.3 + 3.1
Note: Column totals may sum to more than 100% since more than one substance may be implicated in a death. †On average approximately 300 cases of inquest from the year of death are not completed and are added to next year. Column highlighted in includes deaths in 2010 reported since the last report and is not used in the PR, CI or change in percentage points calculations
Table 1.6: Changes in percentages of single psychoactive substances implicated alone in psychoactive substance deaths, np-SAD cases, England, 2010 and 2011
Substance
2010 (n =
1,222) %
2010 (n =
1,241) †
%
2011 (n =
1,172) %
Ratio of Proportions
(PR) 95% CI
Change (percentage
points)
Amphetamines 1.4 1.4 1.6 1.2 0.6 – 2.2 + 0.2 Anti-depressants 4.7 4.7 5.5 1.2 0.8 – 1.6 + 0.8 Anti-epileptics 0.4 0.4 0.5 1.3 0.4 – 4.1 + 0.1 Anti-Parkinson’s 0.1 0.1 0.1 1.0 0.1 – 16.7 0.0 Anti-psychotics 1.2 1.3 1.3 1.0 0.5 – 2.1 + 0.1 Cannabis 0.2 0.2 0.5 3.1 0.6 – 15.5 + 0.3 Cocaine 2.1 2.2 1.5 1.5 0.8 – 2.7 - 0.6 Ecstasy-type drugs 0.3 0.3 0.5 1.3 0.4 – 4.1 + 0.2 GHB/GBL 0.5 0.6 0.3 1.4 0.4 – 5.1 - 0.2 Heroin/morphine 11.1 11.1 8.8 1.3 1.0 – 1.6 - 2.3 Hypnotics/sedatives 1.6 1.7 2.4 1.5 0.8 – 2.6 + 0.8 Methadone 7.1 7.1 7.0 1.0 0.8 – 1.4 - 0.1
Other opiates/ opioid analgesics
5.3 5.2 6.9 1.3 0.9 – 1.8 + 1.6
†On average approximately 300 cases of inquest from the year of death are not completed and are added to next year. Column highlighted in includes deaths in 2010 reported since the last report and is not used in the PR, CI or change in percentage points calculations
np-SAD
International Centre for Drug Policy 14
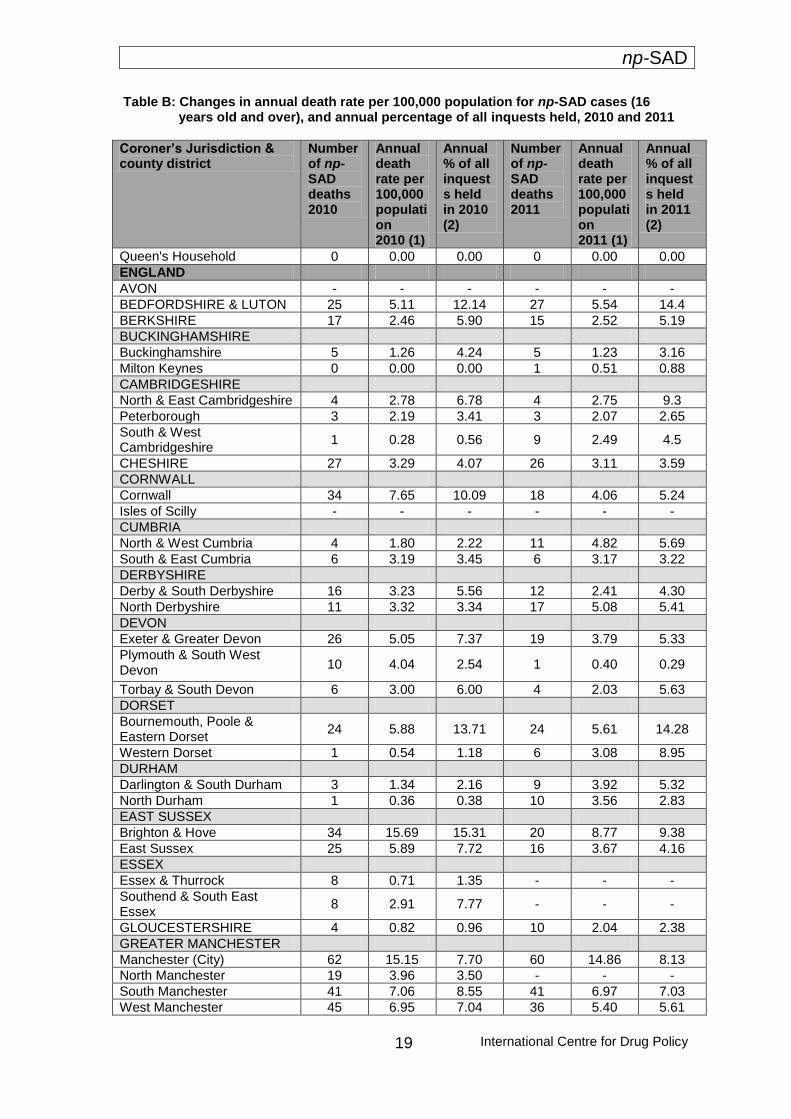
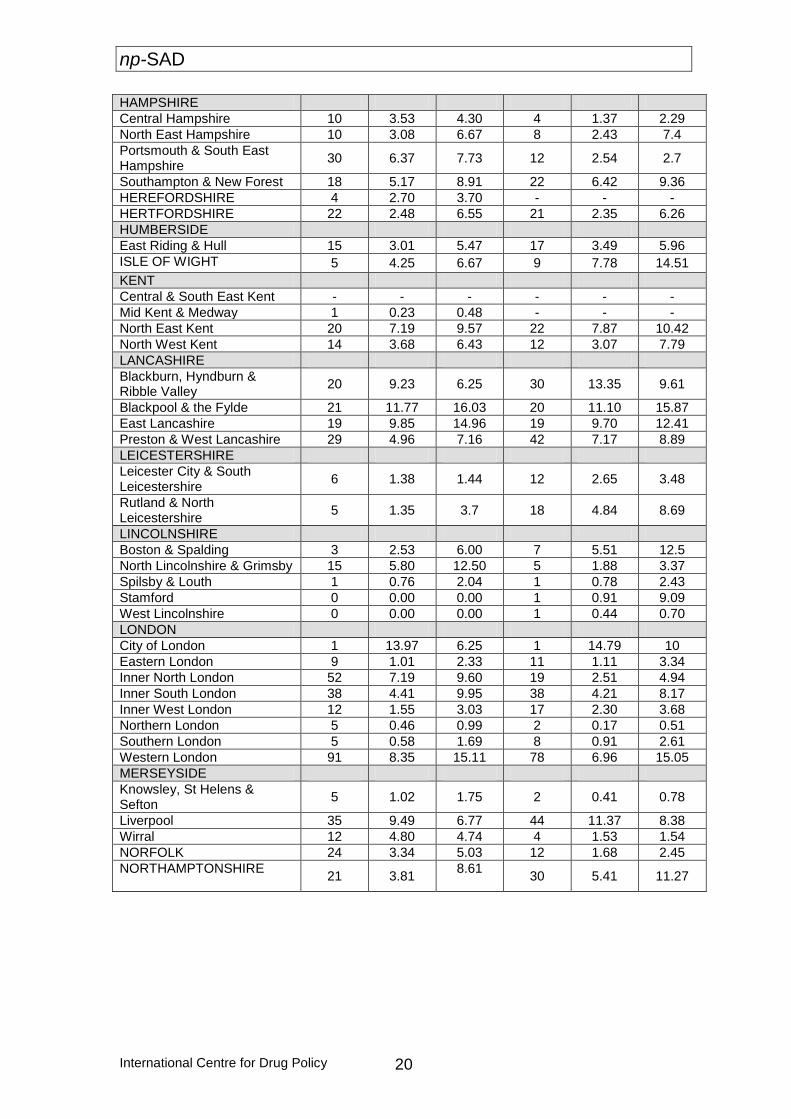
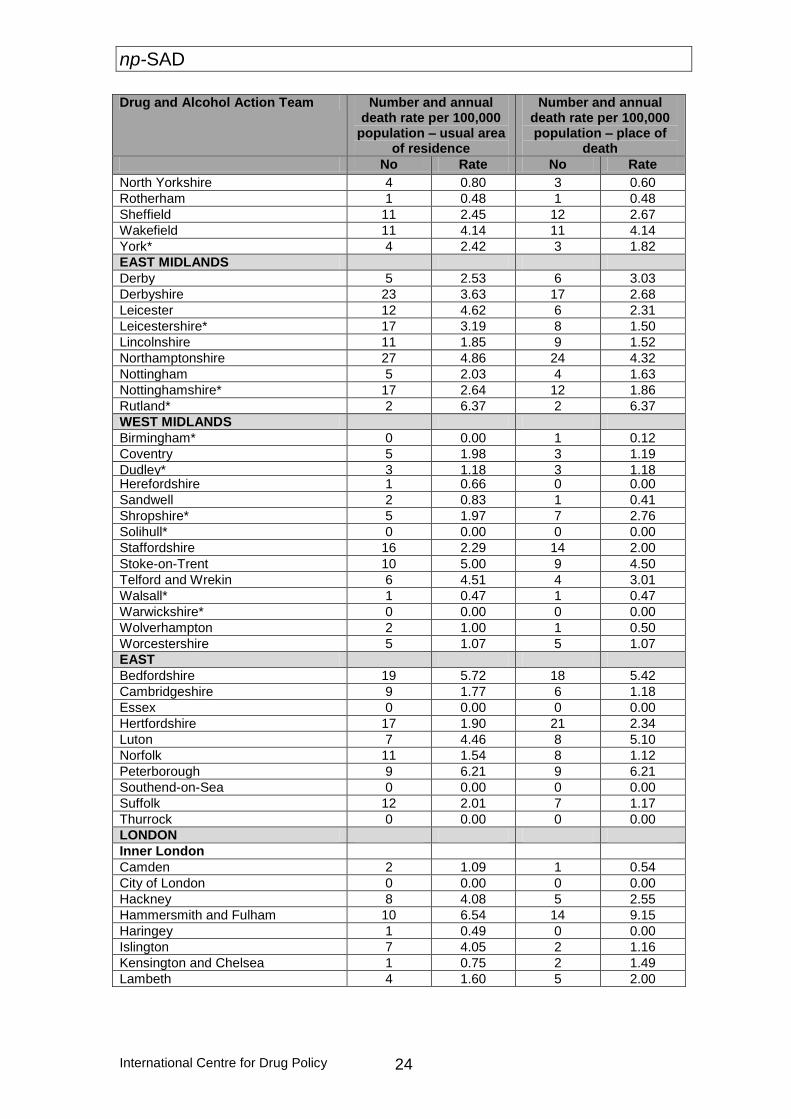
Deaths per 100,000 population by area
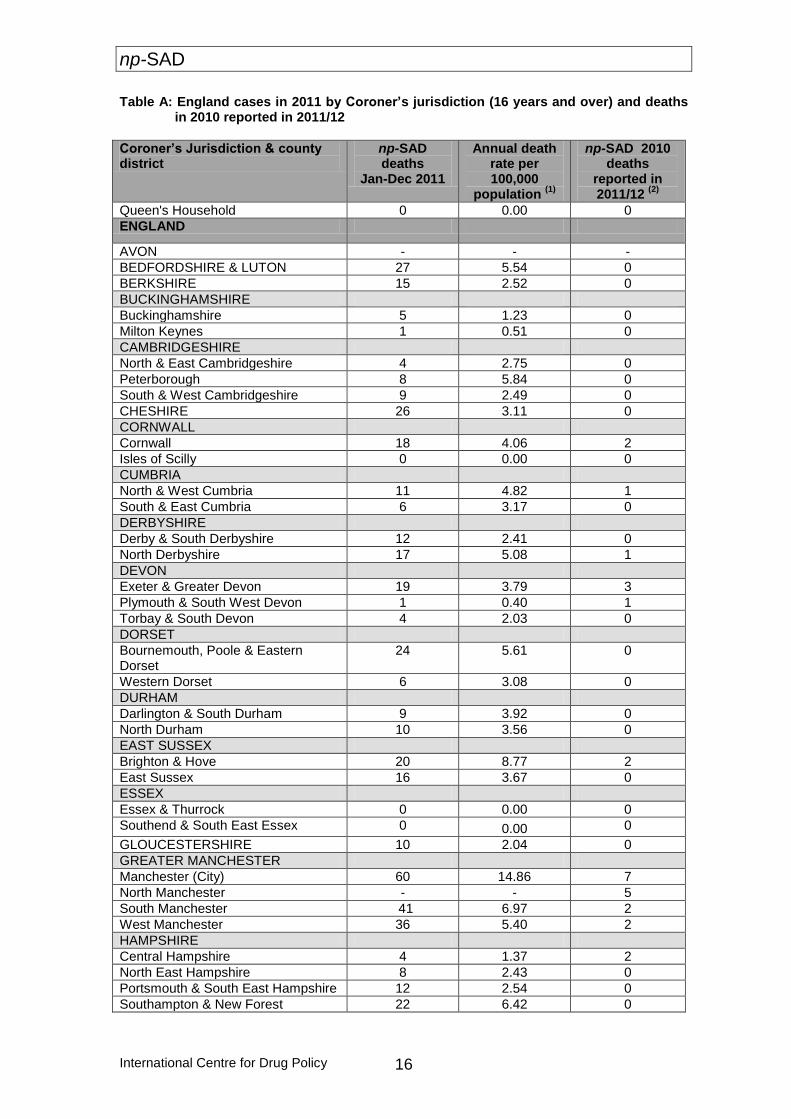
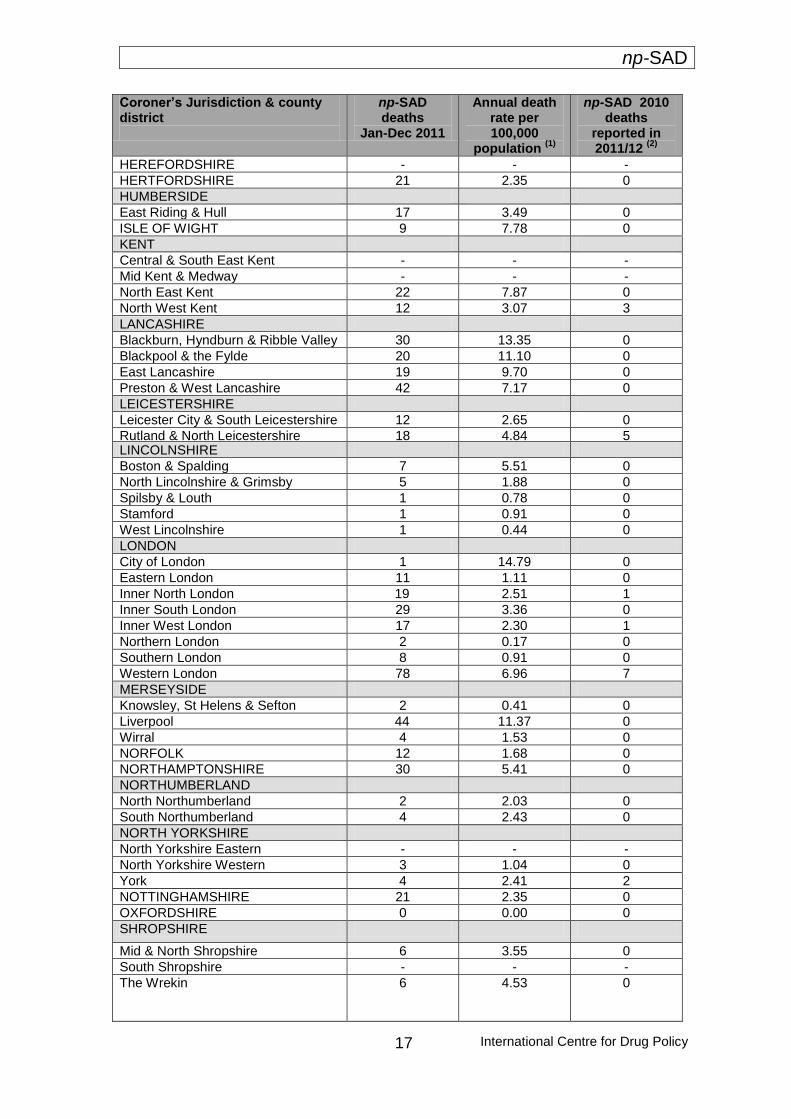
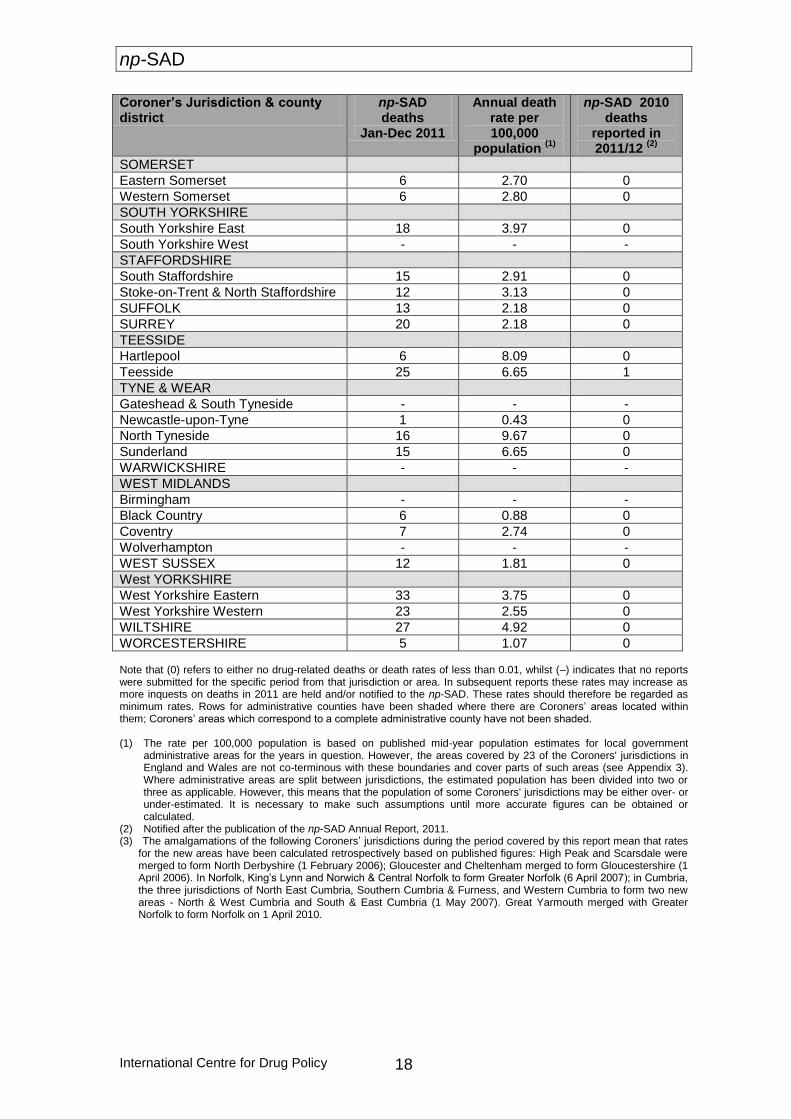
This section provides a break-down of information by different geographical units for deaths of those aged 16 years and older. Table A provides information on rates per 100,000 population by Coroners’ jurisdiction for 2011; Table B shows the rates per 100,000 for both 2010 and 2011 by Coroners’ jurisdiction to allow for comparison between the two years; Tables C and E provide breakdowns by Drug and Alcohol Action Team (DAAT) and Primary Care Trust (PCT) areas respectively; and Table D gives detailed breakdowns by DAAT area for key aspects, such as key demographic details and primary drugs implicated. Coroners’ jurisdictions with highest and lowest rates in 2011 The following Coroner’s jurisdictions in England reported annual drug-related death rates higher than 10/100,000 population in 2011: City of Manchester (14.86); Blackburn, Hyndburn & Ribble Valley (13.35); Liverpool (11.37); and Blackpool & the Fylde (11.10). The following Coroner’s jurisdictions reported drug-related death rates for 2011 below 1/100,000 population: Stamford (0.91); Southern London (0.91); Black Country (0.88); Spilsby & Louth (0.78); Milton Keynes (0.51); West Lincolnshire (0.44); Newcastle-upon-Tyne (0.43); Knowsley, St Helens & Sefton (0.41); Plymouth & South West Devon (0.40); and Northern London (0.17). The following areas reported that there had been no relevant cases: The Queen’s household and the Isles of Scilly. Further information for each jurisdiction and its associated rate per 100,000 can be found in Table A.
Changes in death rates from 2010 to 2011 by Coroners’ jurisdiction The following jurisdictions reported notable increases (>2.5/100,000) in annual drug-related death rates by 100,000 population from 2010 to 2011: North Tyneside (3.68 to 9.67); Blackburn, Hyndburn & Ribble Valley (9.23 to 13.35); Hartlepool (4.09 to 8.09); Rutland & North Leicestershire (1.35 to 4.84); North & West Cumbria (1.80 to 4.82); Boston & Spalding (2.53 to 5.51); Wiltshire (2.25 to 4.92); Darlington & South Durham (1.34 to 3.92); and Western Dorset (0.54 to 3.08). The following jurisdictions reported notable decreases (>2.5/100,000) in annual drug-related death rates by 100,000 population from 2010 to 2011: Brighton & Hove (15.69 to 8.77); Inner North London (7.19 to 2.51); North Lincolnshire & Grimsby (5.80 to 1.88); Portsmouth & South East Hampshire (6.37 to 2.54); Plymouth & South West Devon (4.04 to 0.40); Cornwall (7.65 to 4.06); Teeside (10.24 to 6.65); and Wirral (4.80 to 1.53). Further information for each jurisdiction and its associated rate per 100,000 for 2010 and 2011 can be found in Table B. Brighton and Hove, as highlighted above, witnessed a drop in np-SAD deaths of 6.92/100,000 population from 2010 to 2011. This continues the apparent steep downward trend in the number of such deaths for this jurisdiction, with a total drop in np-SAD-relevant deaths of 14.59/100,000 from 2009 to 2011 (from 23.36 to 8.77).
Commentary The demographic profile of drug-related deaths in England meeting the np-SAD case criteria for 2011 remains generally consistent with previous reports: a higher proportion of males to females; majority of White ethnicity; with the majority aged less than 45 years. Deaths amongst those aged 15-24 appear to have dropped over the past ten years by about 60%. The number and proportion of deaths of known drug users aged more than 45 years at the time of death notified to the Programme
also increased over the past decade: from 141 (13.1%) to 183 (27.9%) cases. As found in previous years, accidental poisoning still remains the most frequent underlying cause of death across all age-groups. However, when compared with females and males of younger age-groups, older females exhibit higher rates of deaths attributed to intentional self-poisoning.

np-SAD
International Centre for Drug Policy
15
Heroin/morphine was the drug most frequently implicated in the deaths of males, closely followed by methadone. In contrast, for females it was anti-depressants, closely followed by other opiates/opioid analgesics. The drug-related deaths in England reported to the Programme for 2011 show that there have been increases in involvement at death of amphetamines; anti-depressants; anti-epileptics; anti-psychotics; cannabis; cocaine; ecstasy-type drugs; hypnotics/sedatives; methadone; and other opiates/opioid analgesics. Meanwhile, deaths involving heroin/morphine; alcohol-in-combination; anti-Parkinson’s; and GHB/GBL have decreased. This trend is similar to that as found in “drug misuse” cases. The decline in monovalent deaths noted in last year’s report appears to be faltering, with a
slight increase back to 2009 levels of around 37%, as in 2010 they accounted for 36% of cases. With regards polysubstance deaths, heroin/morphine combined with alcohol remains the most frequent polysubstance combination over the past ten years, followed by anti-depressants combined with hypnotics/sedatives. The most commonly prescribed medications implicated in death were anti-depressants, followed by hypnotics/sedatives. From information available on individuals’ prescribed medication status, it would appear that upwards of 54% of hypnotics/sedatives, other opiates/opioid analgesics and methadone-related deaths were sourced either illegally, or through other means.
np-SAD
International Centre for Drug Policy 16
Table A: England cases in 2011 by Coroner’s jurisdiction (16 years and over) and deaths in 2010 reported in 2011/12
Coroner’s Jurisdiction & county district
np-SAD deaths
Jan-Dec 2011
Annual death rate per 100,000
population (1)
np-SAD 2010 deaths
reported in 2011/12
(2)
Queen's Household 0 0.00 0
ENGLAND
AVON - - -
BEDFORDSHIRE & LUTON 27 5.54 0
BERKSHIRE 15 2.52 0
BUCKINGHAMSHIRE
Buckinghamshire 5 1.23 0
Milton Keynes 1 0.51 0
CAMBRIDGESHIRE
North & East Cambridgeshire 4 2.75 0
Peterborough 8 5.84 0
South & West Cambridgeshire 9 2.49 0
CHESHIRE 26 3.11 0
CORNWALL
Cornwall 18 4.06 2
Isles of Scilly 0 0.00 0
CUMBRIA
North & West Cumbria 11 4.82 1
South & East Cumbria 6 3.17 0
DERBYSHIRE
Derby & South Derbyshire 12 2.41 0
North Derbyshire 17 5.08 1
DEVON
Exeter & Greater Devon 19 3.79 3
Plymouth & South West Devon 1 0.40 1
Torbay & South Devon 4 2.03 0
DORSET
Bournemouth, Poole & Eastern Dorset
24 5.61 0
Western Dorset 6 3.08 0
DURHAM
Darlington & South Durham 9 3.92 0
North Durham 10 3.56 0
EAST SUSSEX
Brighton & Hove 20 8.77 2
East Sussex 16 3.67 0
ESSEX
Essex & Thurrock 0 0.00 0
Southend & South East Essex 0 0.00 0
GLOUCESTERSHIRE 10 2.04 0
GREATER MANCHESTER
Manchester (City) 60 14.86 7
North Manchester - - 5
South Manchester 41 6.97 2
West Manchester 36 5.40 2
HAMPSHIRE
Central Hampshire 4 1.37 2
North East Hampshire 8 2.43 0
Portsmouth & South East Hampshire 12 2.54 0
Southampton & New Forest 22 6.42 0
np-SAD
International Centre for Drug Policy
17
Coroner’s Jurisdiction & county district
np-SAD deaths
Jan-Dec 2011
Annual death rate per 100,000
population (1)
np-SAD 2010 deaths
reported in 2011/12
(2)
HEREFORDSHIRE - - -
HERTFORDSHIRE 21 2.35 0
HUMBERSIDE
East Riding & Hull 17 3.49 0
ISLE OF WIGHT 9 7.78 0
KENT
Central & South East Kent - - -
Mid Kent & Medway - - -
North East Kent 22 7.87 0
North West Kent 12 3.07 3
LANCASHIRE
Blackburn, Hyndburn & Ribble Valley 30 13.35 0
Blackpool & the Fylde 20 11.10 0
East Lancashire 19 9.70 0
Preston & West Lancashire 42 7.17 0
LEICESTERSHIRE
Leicester City & South Leicestershire 12 2.65 0
Rutland & North Leicestershire
18 4.84 5 LINCOLNSHIRE
Boston & Spalding 7 5.51 0
North Lincolnshire & Grimsby 5 1.88 0
Spilsby & Louth 1 0.78 0
Stamford 1 0.91 0
West Lincolnshire 1 0.44 0
LONDON
City of London 1 14.79 0
Eastern London 11 1.11 0
Inner North London 19 2.51 1
Inner South London 29 3.36 0
Inner West London 17 2.30 1
Northern London 2 0.17 0
Southern London 8 0.91 0
Western London 78 6.96 7
MERSEYSIDE
Knowsley, St Helens & Sefton 2 0.41 0
Liverpool 44 11.37 0
Wirral 4 1.53 0
NORFOLK 12 1.68 0
NORTHAMPTONSHIRE 30 5.41 0
NORTHUMBERLAND
North Northumberland 2 2.03 0
South Northumberland 4 2.43 0
NORTH YORKSHIRE
North Yorkshire Eastern - - -
North Yorkshire Western 3 1.04 0
York 4 2.41 2
NOTTINGHAMSHIRE 21 2.35 0
OXFORDSHIRE 0 0.00 0
SHROPSHIRE
Mid & North Shropshire 6 3.55 0
South Shropshire - - -
The Wrekin 6 4.53 0
np-SAD
International Centre for Drug Policy 18
Coroner’s Jurisdiction & county district
np-SAD deaths
Jan-Dec 2011
Annual death rate per 100,000
population (1)
np-SAD 2010 deaths
reported in 2011/12
(2)
SOMERSET
Eastern Somerset 6 2.70 0
Western Somerset 6 2.80 0
SOUTH YORKSHIRE
South Yorkshire East 18 3.97 0
South Yorkshire West - - -
STAFFORDSHIRE
South Staffordshire 15 2.91 0
Stoke-on-Trent & North Staffordshire 12 3.13 0
SUFFOLK 13 2.18 0
SURREY 20 2.18 0
TEESSIDE
Hartlepool 6 8.09 0
Teesside 25 6.65 1
TYNE & WEAR
Gateshead & South Tyneside - - -
Newcastle-upon-Tyne 1 0.43 0
North Tyneside 16 9.67 0
Sunderland 15 6.65 0
WARWICKSHIRE - - -
WEST MIDLANDS
Birmingham - - -
Black Country 6 0.88 0
Coventry 7 2.74 0
Wolverhampton - - -
WEST SUSSEX 12 1.81 0
West YORKSHIRE
West Yorkshire Eastern 33 3.75 0
West Yorkshire Western 23 2.55 0
WILTSHIRE 27 4.92 0
WORCESTERSHIRE 5 1.07 0 Note that (0) refers to either no drug-related deaths or death rates of less than 0.01, whilst (–) indicates that no reports were submitted for the specific period from that jurisdiction or area. In subsequent reports these rates may increase as more inquests on deaths in 2011 are held and/or notified to the np-SAD. These rates should therefore be regarded as minimum rates. Rows for administrative counties have been shaded where there are Coroners’ areas located within them; Coroners’ areas which correspond to a complete administrative county have not been shaded. (1) The rate per 100,000 population is based on published mid-year population estimates for local government
administrative areas for the years in question. However, the areas covered by 23 of the Coroners' jurisdictions in England and Wales are not co-terminous with these boundaries and cover parts of such areas (see Appendix 3). Where administrative areas are split between jurisdictions, the estimated population has been divided into two or three as applicable. However, this means that the population of some Coroners' jurisdictions may be either over- or under-estimated. It is necessary to make such assumptions until more accurate figures can be obtained or calculated.
(2) Notified after the publication of the np-SAD Annual Report, 2011. (3) The amalgamations of the following Coroners’ jurisdictions during the period covered by this report mean that rates
for the new areas have been calculated retrospectively based on published figures: High Peak and Scarsdale were merged to form North Derbyshire (1 February 2006); Gloucester and Cheltenham merged to form Gloucestershire (1 April 2006). In Norfolk, King’s Lynn and Norwich & Central Norfolk to form Greater Norfolk (6 April 2007); in Cumbria, the three jurisdictions of North East Cumbria, Southern Cumbria & Furness, and Western Cumbria to form two new areas - North & West Cumbria and South & East Cumbria (1 May 2007). Great Yarmouth merged with Greater Norfolk to form Norfolk on 1 April 2010.
np-SAD
International Centre for Drug Policy
19
Table B: Changes in annual death rate per 100,000 population for np-SAD cases (16 years old and over), and annual percentage of all inquests held, 2010 and 2011
Coroner’s Jurisdiction & county district
Number of np-SAD deaths 2010
Annual death rate per 100,000 population 2010 (1)
Annual % of all inquests held in 2010 (2)
Number of np-SAD deaths 2011
Annual death rate per 100,000 population 2011 (1)
Annual % of all inquests held in 2011 (2)
Queen's Household 0 0.00 0.00 0 0.00 0.00
ENGLAND
AVON - - - - - -
BEDFORDSHIRE & LUTON 25 5.11 12.14 27 5.54 14.4
BERKSHIRE 17 2.46 5.90 15 2.52 5.19
BUCKINGHAMSHIRE
Buckinghamshire 5 1.26 4.24 5 1.23 3.16
Milton Keynes 0 0.00 0.00 1 0.51 0.88
CAMBRIDGESHIRE
North & East Cambridgeshire 4 2.78 6.78 4 2.75 9.3
Peterborough 3 2.19 3.41 3 2.07 2.65
South & West Cambridgeshire
1 0.28 0.56 9 2.49 4.5
CHESHIRE 27 3.29 4.07 26 3.11 3.59
CORNWALL
Cornwall 34 7.65 10.09 18 4.06 5.24
Isles of Scilly - - - - - -
CUMBRIA
North & West Cumbria 4 1.80 2.22 11 4.82 5.69
South & East Cumbria 6 3.19 3.45 6 3.17 3.22
DERBYSHIRE
Derby & South Derbyshire 16 3.23 5.56 12 2.41 4.30
North Derbyshire 11 3.32 3.34 17 5.08 5.41
DEVON
Exeter & Greater Devon 26 5.05 7.37 19 3.79 5.33
Plymouth & South West Devon
10 4.04 2.54 1 0.40 0.29
Torbay & South Devon 6 3.00 6.00 4 2.03 5.63
DORSET
Bournemouth, Poole & Eastern Dorset
24 5.88 13.71 24 5.61 14.28
Western Dorset 1 0.54 1.18 6 3.08 8.95
DURHAM
Darlington & South Durham 3 1.34 2.16 9 3.92 5.32
North Durham 1 0.36 0.38 10 3.56 2.83
EAST SUSSEX
Brighton & Hove 34 15.69 15.31 20 8.77 9.38
East Sussex 25 5.89 7.72 16 3.67 4.16
ESSEX
Essex & Thurrock 8 0.71 1.35 - - -
Southend & South East Essex
8 2.91 7.77 - - -
GLOUCESTERSHIRE 4 0.82 0.96 10 2.04 2.38
GREATER MANCHESTER
Manchester (City) 62 15.15 7.70 60 14.86 8.13
North Manchester 19 3.96 3.50 - - -
South Manchester 41 7.06 8.55 41 6.97 7.03
West Manchester 45 6.95 7.04 36 5.40 5.61
np-SAD
International Centre for Drug Policy 20
HAMPSHIRE
Central Hampshire 10 3.53 4.30 4 1.37 2.29
North East Hampshire 10 3.08 6.67 8 2.43 7.4
Portsmouth & South East Hampshire
30 6.37 7.73 12 2.54 2.7
Southampton & New Forest 18 5.17 8.91 22 6.42 9.36
HEREFORDSHIRE 4 2.70 3.70 - - -
HERTFORDSHIRE 22 2.48 6.55 21 2.35 6.26
HUMBERSIDE
East Riding & Hull 15 3.01 5.47 17 3.49 5.96
ISLE OF WIGHT 5 4.25 6.67 9 7.78 14.51
KENT
Central & South East Kent - - - - - -
Mid Kent & Medway 1 0.23 0.48 - - -
North East Kent 20 7.19 9.57 22 7.87 10.42
North West Kent 14 3.68 6.43 12 3.07 7.79
LANCASHIRE
Blackburn, Hyndburn & Ribble Valley
20 9.23 6.25 30 13.35 9.61
Blackpool & the Fylde 21 11.77 16.03 20 11.10 15.87
East Lancashire 19 9.85 14.96 19 9.70 12.41
Preston & West Lancashire 29 4.96 7.16 42 7.17 8.89
LEICESTERSHIRE
Leicester City & South Leicestershire
6 1.38 1.44 12 2.65 3.48
Rutland & North Leicestershire
5 1.35 3.7 18 4.84 8.69
LINCOLNSHIRE
Boston & Spalding 3 2.53 6.00 7 5.51 12.5
North Lincolnshire & Grimsby 15 5.80 12.50 5 1.88 3.37
Spilsby & Louth 1 0.76 2.04 1 0.78 2.43
Stamford 0 0.00 0.00 1 0.91 9.09
West Lincolnshire 0 0.00 0.00 1 0.44 0.70
LONDON
City of London 1 13.97 6.25 1 14.79 10
Eastern London 9 1.01 2.33 11 1.11 3.34
Inner North London 52 7.19 9.60 19 2.51 4.94
Inner South London 38 4.41 9.95 38 4.21 8.17
Inner West London 12 1.55 3.03 17 2.30 3.68
Northern London 5 0.46 0.99 2 0.17 0.51
Southern London 5 0.58 1.69 8 0.91 2.61
Western London 91 8.35 15.11 78 6.96 15.05
MERSEYSIDE
Knowsley, St Helens & Sefton
5 1.02 1.75 2 0.41 0.78
Liverpool 35 9.49 6.77 44 11.37 8.38
Wirral 12 4.80 4.74 4 1.53 1.54
NORFOLK 24 3.34 5.03 12 1.68 2.45
NORTHAMPTONSHIRE 21 3.81
8.61
30 5.41 11.27

np-SAD
International Centre for Drug Policy
21
Coroner’s Jurisdiction & county district
Number of np-SAD deaths 2010
Annual death rate per 100,000 population 2010 (1)
Annual % of all inquests held in 2010 (2)
Number of np-SAD deaths 2011
Annual death rate per 100,000 population 2011 (1)
Annual % of all inquests held in 2011 (2)
NORTHUMBERLAND
North Northumberland 0 0.00 0.00 2 2.03 1.62
South Northumberland 7 4.33 7.00 4 2.43 4.49
NORTH YORKSHIRE
North Yorkshire Eastern 2 0.96 1.55 - - -
North Yorkshire Western 1 0.35 0.79 3 1.04 2.47
York 2 1.17 1.5 4 2.41 3.53
NOTTINGHAMSHIRE 2 0.22 0.50 21 2.35 5.18
OXFORDSHIRE 9 1.71 3.18 - - -
SHROPSHIRE
Mid & North Shropshire 6 3.74 6.90 6 3.55 8.1
South Shropshire - - - - - -
The Wrekin 6 4.64 6.74 6 4.53 8.69
SOMERSET
Eastern Somerset 6 2.75 4.20 6 2.70 4.19
Western Somerset 9 4.25 7.32 6 2.80 6.00
SOUTH YORKSHIRE
South Yorkshire East 13 2.95 4.50 18 3.97 5.32
South Yorkshire West 12 1.86 3.16 12 1.86 2.51
STAFFORDSHIRE
South Staffordshire 18 3.62 5.81 15 2.91 4.13
Stoke-on-Trent & North Staffordshire
14 3.72 2.95 12 3.13 2.71
SUFFOLK 15 2.55 5.45 13 2.18 4.74
SURREY 30 3.30 7.61 20 2.18 6.38
TEESSIDE
Hartlepool 3 4.09 5.26 6 8.09 13.04
Teesside 39 10.24 13.29 25 6.65 8.8
TYNE & WEAR
Gateshead & South Tyneside 7 2.45 3.11 - - -
Newcastle-upon-Tyne 2 0.82 0.63 1 0.43 0.28
North Tyneside 6 3.68 2.65 16 9.67 7.8
Sunderland 18 7.68 3.95 15 6.65 4.02
WARWICKSHIRE - - - - - -
WEST MIDLANDS
Birmingham 12 1.23 1.19 - - -
Black Country - - - - - -
Coventry 2 0.79 1.18 7 2.74 3.58
Wolverhampton 0 0.00 0.00 - 0.00 0.00
WEST SUSSEX 16 2.45 5.73 12 1.81 4.59
West YORKSHIRE
West Yorkshire Eastern 40 4.31 7.42 33 3.75 6.8
West Yorkshire Western 42 4.75 9.15 23 2.55 5.06
WILTSHIRE 12 2.25 2.88 27 4.92 8.08
WORCESTERSHIRE 3 0.66 0.84 5 1.07 1.52
Note that (0) refers to either no drug-related deaths or death rates of less than 0.01, whilst (–) indicates that no reports were submitted for the specific period from that jurisdiction or area. In subsequent reports these rates may increase as more inquests on deaths in 2011 are held and/or notified to the np-SAD. These rates should therefore be regarded as
np-SAD
International Centre for Drug Policy 22
minimum rates. Rows for administrative counties have been shaded where there are Coroners’ areas located within them; Coroners’ areas which correspond to a complete administrative county have not been shaded. (1) The rate per 100,000 population is based on published mid-year population estimates for local government
administrative areas for the years in question. However, the areas covered by 23 of the Coroners' jurisdictions in England and Wales are not co-terminous with these boundaries and cover parts of such areas (see Appendix 3). Where administrative areas are split between jurisdictions, the estimated population has been divided into two or three as applicable. However, this means that the population of some Coroners' jurisdictions may be either over- or under-estimated. It is necessary to make such assumptions until more accurate figures can be obtained or calculated.
(2) Inquests held on all ages. (3) The amalgamations of the following Coroners’ jurisdictions during the period covered by this report mean that rates
for the new areas have been calculated retrospectively based on published figures: High Peak and Scarsdale were merged to form North Derbyshire (1 February 2006); Gloucester and Cheltenham merged to form Gloucestershire (1 April 2006). In Norfolk, King’s Lynn and Norwich & Central Norfolk to form Greater Norfolk (6 April 2007); in Cumbria, the three jurisdictions of North East Cumbria, Southern Cumbria & Furness, and Western Cumbria to form two new areas - North & West Cumbria and South & East Cumbria (1 May 2007). Great Yarmouth merged with Greater Norfolk to form Norfolk on 1 April 2010.

np-SAD
International Centre for Drug Policy
23
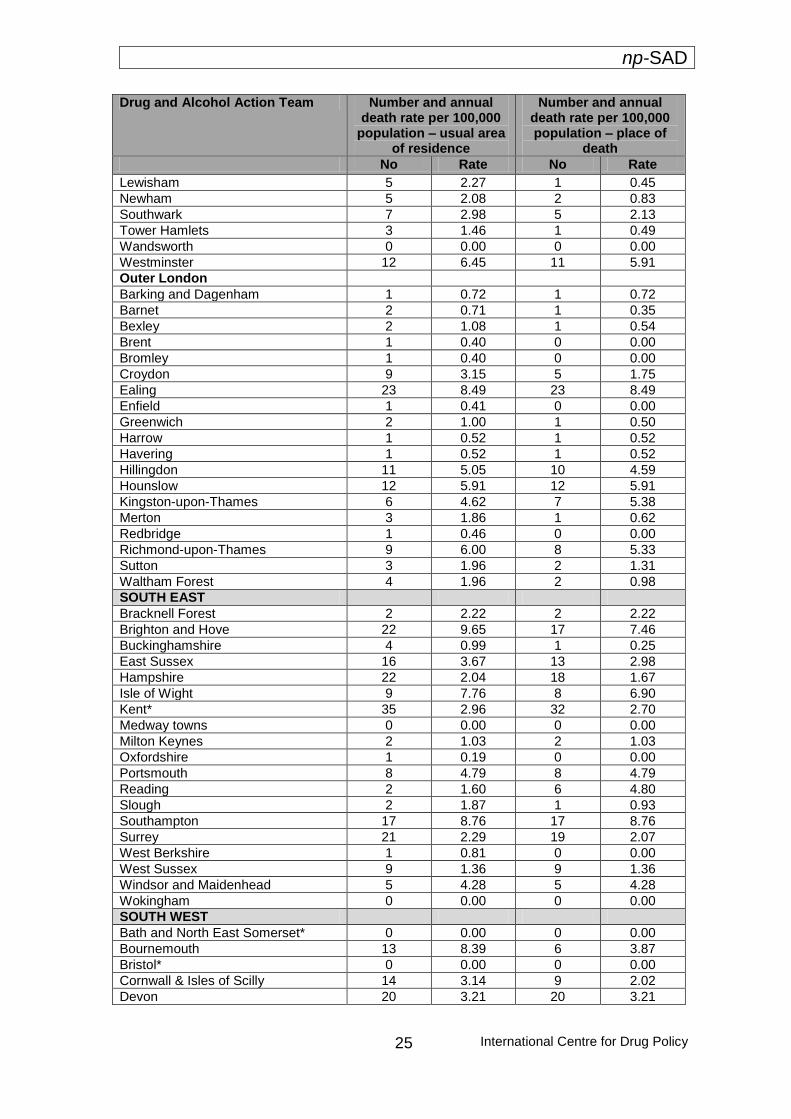
Table C: np-SAD cases in 2011 by Drug and Alcohol Action Team area (16 years and over) – number and rate per 100,000 population
Drug and Alcohol Action Team Number and annual death rate per 100,000
population – usual area of residence
Number and annual death rate per 100,000 population – place of
death
No Rate No Rate
ENGLAND
NORTH EAST
County Durham 16 3.77 6 1.42
Darlington 4 4.65 3 3.49
Gateshead 0 0.00 0 0.00
Hartlepool 8 10.81 6 8.11
Middlesbrough 11 10.00 6 5.45
Newcastle upon Tyne 3 1.30 2 0.87
North Tyneside* 12 7.23 13 7.83
Northumberland 8 3.04 7 2.66
Redcar and Cleveland 4 3.60 5 4.50
South Tyneside 0 0.00 0 0.00
Stockton on Tees 8 5.19 10 6.49
Sunderland 14 6.17 14 6.17
NORTH WEST
Blackburn with Darwen 16 14.04 13 11.40
Blackpool 17 14.53 15 12.82
Bolton 12 5.45 12 5.45
Bury 0 0.00 0 0.00
Cheshire* 14 2.43 12 2.08
Cumbria 15 3.60 13 3.12
Halton 2 1.98 0 0.00
Knowsley 2 1.71 1 0.85
Lancashire 74 7.73 65 6.79
Liverpool 35 9.04 33 8.53
Manchester 49 12.16 45 11.17
Oldham 2 1.14 1 0.57
Rochdale 3 1.80 3 1.80
Salford 22 11.64 20 10.58
Sefton 7 3.08 2 0.88
St Helens 0 0.00 0 0.00
Stockport 13 5.65 10 4.35
Tameside 17 9.60 14 7.91
Trafford 6 3.31 7 3.87
Warrington 11 6.71 9 5.49
Wigan 10 3.88 10 3.88
Wirral 4 1.53 0 0.00
YORKSHIRE AND HUMBER
Barnsley 0 0.00 0 0.00
Bradford 14 3.49 10 2.49
Calderdale 0 0.00 0 0.00
Doncaster 4 1.63 3 1.22
East Riding of Yorkshire 4 1.43 4 1.43
Kingston upon Hull 13 6.28 13 6.28
Kirklees 9 2.67 8 2.37
Leeds 24 3.92 24 3.92
North East Lincolnshire 3 2.33 1 0.78
North Lincolnshire 2 1.47 1 0.74
np-SAD
International Centre for Drug Policy 24
Drug and Alcohol Action Team Number and annual death rate per 100,000
population – usual area of residence
Number and annual death rate per 100,000 population – place of
death
No Rate No Rate
North Yorkshire 4 0.80 3 0.60
Rotherham 1 0.48 1 0.48
Sheffield 11 2.45 12 2.67
Wakefield 11 4.14 11 4.14
York* 4 2.42 3 1.82
EAST MIDLANDS
Derby 5 2.53 6 3.03
Derbyshire 23 3.63 17 2.68
Leicester 12 4.62 6 2.31
Leicestershire* 17 3.19 8 1.50
Lincolnshire 11 1.85 9 1.52
Northamptonshire 27 4.86 24 4.32
Nottingham 5 2.03 4 1.63
Nottinghamshire* 17 2.64 12 1.86
Rutland* 2 6.37 2 6.37
WEST MIDLANDS
Birmingham* 0 0.00 1 0.12
Coventry 5 1.98 3 1.19
Dudley* 3 1.18 3 1.18 Herefordshire 1 0.66 0 0.00
Sandwell 2 0.83 1 0.41
Shropshire* 5 1.97 7 2.76
Solihull* 0 0.00 0 0.00
Staffordshire 16 2.29 14 2.00
Stoke-on-Trent 10 5.00 9 4.50
Telford and Wrekin 6 4.51 4 3.01
Walsall* 1 0.47 1 0.47
Warwickshire* 0 0.00 0 0.00
Wolverhampton 2 1.00 1 0.50
Worcestershire 5 1.07 5 1.07
EAST
Bedfordshire 19 5.72 18 5.42
Cambridgeshire 9 1.77 6 1.18
Essex 0 0.00 0 0.00
Hertfordshire 17 1.90 21 2.34
Luton 7 4.46 8 5.10
Norfolk 11 1.54 8 1.12
Peterborough 9 6.21 9 6.21
Southend-on-Sea 0 0.00 0 0.00
Suffolk 12 2.01 7 1.17
Thurrock 0 0.00 0 0.00
LONDON
Inner London
Camden 2 1.09 1 0.54
City of London 0 0.00 0 0.00
Hackney 8 4.08 5 2.55
Hammersmith and Fulham 10 6.54 14 9.15
Haringey 1 0.49 0 0.00
Islington 7 4.05 2 1.16
Kensington and Chelsea 1 0.75 2 1.49
Lambeth 4 1.60 5 2.00
np-SAD
International Centre for Drug Policy
25
Drug and Alcohol Action Team Number and annual death rate per 100,000
population – usual area of residence
Number and annual death rate per 100,000 population – place of
death
No Rate No Rate
Lewisham 5 2.27 1 0.45
Newham 5 2.08 2 0.83
Southwark 7 2.98 5 2.13
Tower Hamlets 3 1.46 1 0.49
Wandsworth 0 0.00 0 0.00
Westminster 12 6.45 11 5.91
Outer London
Barking and Dagenham 1 0.72 1 0.72
Barnet 2 0.71 1 0.35
Bexley 2 1.08 1 0.54
Brent 1 0.40 0 0.00
Bromley 1 0.40 0 0.00
Croydon 9 3.15 5 1.75
Ealing 23 8.49 23 8.49
Enfield 1 0.41 0 0.00
Greenwich 2 1.00 1 0.50
Harrow 1 0.52 1 0.52
Havering 1 0.52 1 0.52
Hillingdon 11 5.05 10 4.59
Hounslow 12 5.91 12 5.91
Kingston-upon-Thames 6 4.62 7 5.38
Merton 3 1.86 1 0.62
Redbridge 1 0.46 0 0.00
Richmond-upon-Thames 9 6.00 8 5.33
Sutton 3 1.96 2 1.31
Waltham Forest 4 1.96 2 0.98
SOUTH EAST
Bracknell Forest 2 2.22 2 2.22
Brighton and Hove 22 9.65 17 7.46
Buckinghamshire 4 0.99 1 0.25
East Sussex 16 3.67 13 2.98
Hampshire 22 2.04 18 1.67
Isle of Wight 9 7.76 8 6.90
Kent* 35 2.96 32 2.70
Medway towns 0 0.00 0 0.00
Milton Keynes 2 1.03 2 1.03
Oxfordshire 1 0.19 0 0.00
Portsmouth 8 4.79 8 4.79
Reading 2 1.60 6 4.80
Slough 2 1.87 1 0.93
Southampton 17 8.76 17 8.76
Surrey 21 2.29 19 2.07
West Berkshire 1 0.81 0 0.00
West Sussex 9 1.36 9 1.36
Windsor and Maidenhead 5 4.28 5 4.28
Wokingham 0 0.00 0 0.00
SOUTH WEST
Bath and North East Somerset* 0 0.00 0 0.00
Bournemouth 13 8.39 6 3.87
Bristol* 0 0.00 0 0.00
Cornwall & Isles of Scilly 14 3.14 9 2.02
Devon 20 3.21 20 3.21
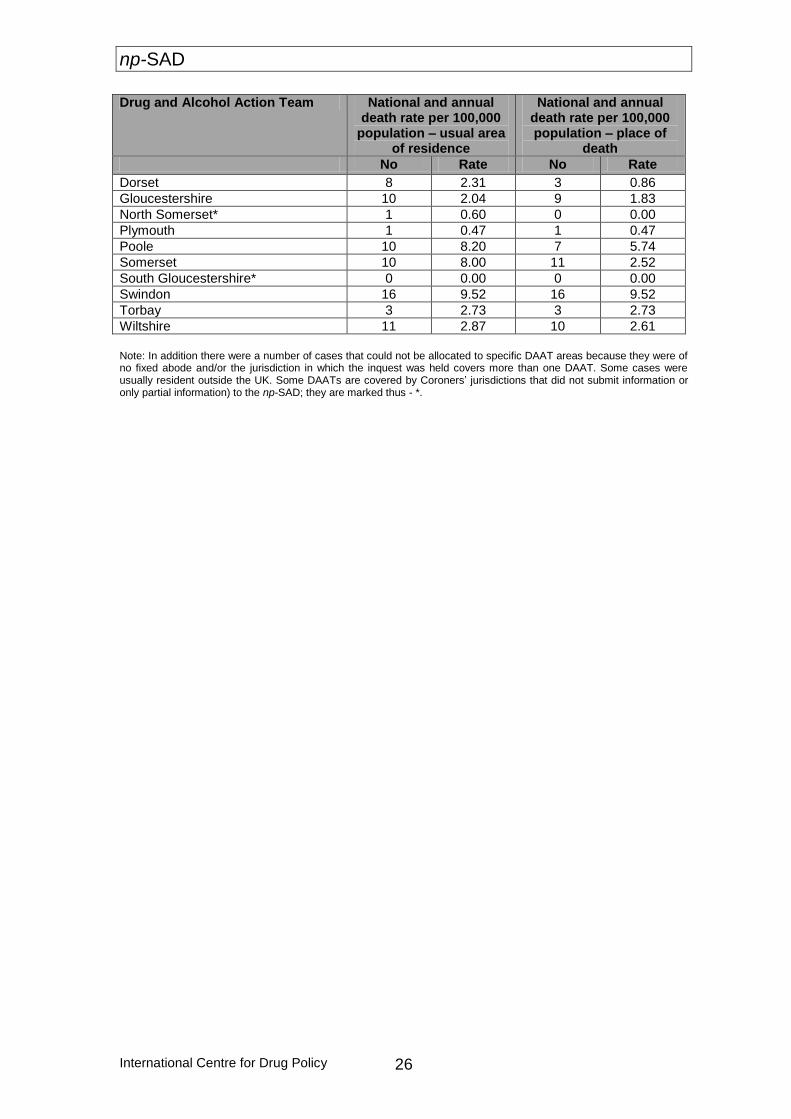
np-SAD
International Centre for Drug Policy 26
Drug and Alcohol Action Team National and annual death rate per 100,000
population – usual area of residence
National and annual death rate per 100,000 population – place of
death
No Rate No Rate
Dorset 8 2.31 3 0.86
Gloucestershire 10 2.04 9 1.83
North Somerset* 1 0.60 0 0.00
Plymouth 1 0.47 1 0.47
Poole 10 8.20 7 5.74
Somerset 10 8.00 11 2.52
South Gloucestershire* 0 0.00 0 0.00
Swindon 16 9.52 16 9.52
Torbay 3 2.73 3 2.73
Wiltshire 11 2.87 10 2.61
Note: In addition there were a number of cases that could not be allocated to specific DAAT areas because they were of no fixed abode and/or the jurisdiction in which the inquest was held covers more than one DAAT. Some cases were usually resident outside the UK. Some DAATs are covered by Coroners’ jurisdictions that did not submit information or only partial information) to the np-SAD; they are marked thus - *.
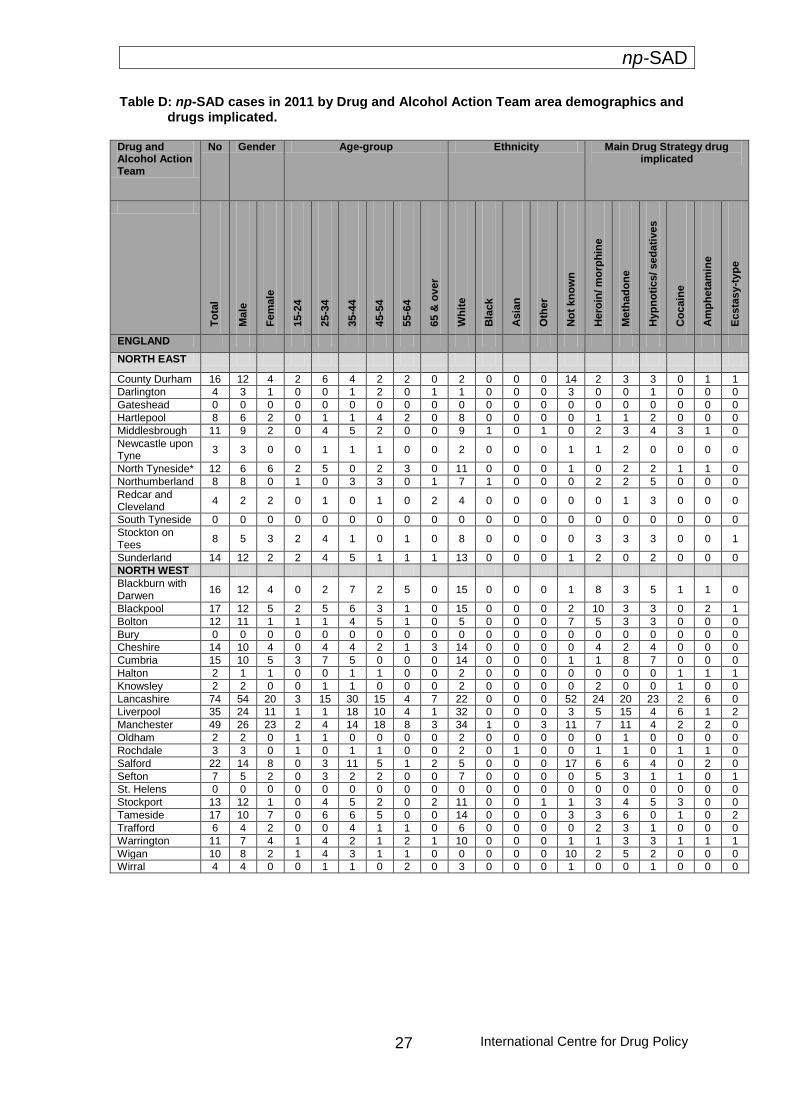
np-SAD
International Centre for Drug Policy
27
Table D: np-SAD cases in 2011 by Drug and Alcohol Action Team area demographics and drugs implicated. Drug and Alcohol Action Team
No Gender Age-group Ethnicity Main Drug Strategy drug implicated
T
ota
l
Ma
le
Fe
male
15-2
4
25-3
4
35-4
4
45-5
4
55-6
4
65 &
ov
er
Wh
ite
Bla
ck
Asia
n
Oth
er
No
t kn
ow
n
Hero
in/ m
orp
hin
e
Me
tha
do
ne
Hyp
no
tics/ sed
ati
ves
Co
cain
e
Am
ph
eta
min
e
Ecsta
sy-t
yp
e
ENGLAND
NORTH EAST
County Durham 16 12 4 2 6 4 2 2 0 2 0 0 0 14 2 3 3 0 1 1
Darlington 4 3 1 0 0 1 2 0 1 1 0 0 0 3 0 0 1 0 0 0
Gateshead 0 0 0 0 0 0 0 0 0 0 0 0 0 0 0 0 0 0 0 0
Hartlepool 8 6 2 0 1 1 4 2 0 8 0 0 0 0 1 1 2 0 0 0
Middlesbrough 11 9 2 0 4 5 2 0 0 9 1 0 1 0 2 3 4 3 1 0
Newcastle upon Tyne
3 3 0 0 1 1 1 0 0 2 0 0 0 1 1 2 0 0 0 0
North Tyneside* 12 6 6 2 5 0 2 3 0 11 0 0 0 1 0 2 2 1 1 0
Northumberland 8 8 0 1 0 3 3 0 1 7 1 0 0 0 2 2 5 0 0 0
Redcar and Cleveland
4 2 2 0 1 0 1 0 2 4 0 0 0 0 0 1 3 0 0 0
South Tyneside 0 0 0 0 0 0 0 0 0 0 0 0 0 0 0 0 0 0 0 0
Stockton on Tees
8 5 3 2 4 1 0 1 0 8 0 0 0 0 3 3 3 0 0 1
Sunderland 14 12 2 2 4 5 1 1 1 13 0 0 0 1 2 0 2 0 0 0
NORTH WEST
Blackburn with Darwen
16 12 4 0 2 7 2 5 0 15 0 0 0 1 8 3 5 1 1 0
Blackpool 17 12 5 2 5 6 3 1 0 15 0 0 0 2 10 3 3 0 2 1
Bolton 12 11 1 1 1 4 5 1 0 5 0 0 0 7 5 3 3 0 0 0
Bury 0 0 0 0 0 0 0 0 0 0 0 0 0 0 0 0 0 0 0 0
Cheshire 14 10 4 0 4 4 2 1 3 14 0 0 0 0 4 2 4 0 0 0
Cumbria 15 10 5 3 7 5 0 0 0 14 0 0 0 1 1 8 7 0 0 0
Halton 2 1 1 0 0 1 1 0 0 2 0 0 0 0 0 0 0 1 1 1
Knowsley 2 2 0 0 1 1 0 0 0 2 0 0 0 0 2 0 0 1 0 0
Lancashire 74 54 20 3 15 30 15 4 7 22 0 0 0 52 24 20 23 2 6 0
Liverpool 35 24 11 1 1 18 10 4 1 32 0 0 0 3 5 15 4 6 1 2
Manchester 49 26 23 2 4 14 18 8 3 34 1 0 3 11 7 11 4 2 2 0
Oldham 2 2 0 1 1 0 0 0 0 2 0 0 0 0 0 1 0 0 0 0
Rochdale 3 3 0 1 0 1 1 0 0 2 0 1 0 0 1 1 0 1 1 0
Salford 22 14 8 0 3 11 5 1 2 5 0 0 0 17 6 6 4 0 2 0
Sefton 7 5 2 0 3 2 2 0 0 7 0 0 0 0 5 3 1 1 0 1
St. Helens 0 0 0 0 0 0 0 0 0 0 0 0 0 0 0 0 0 0 0 0
Stockport 13 12 1 0 4 5 2 0 2 11 0 0 1 1 3 4 5 3 0 0
Tameside 17 10 7 0 6 6 5 0 0 14 0 0 0 3 3 6 0 1 0 2
Trafford 6 4 2 0 0 4 1 1 0 6 0 0 0 0 2 3 1 0 0 0
Warrington 11 7 4 1 4 2 1 2 1 10 0 0 0 1 1 3 3 1 1 1
Wigan 10 8 2 1 4 3 1 1 0 0 0 0 0 10 2 5 2 0 0 0
Wirral 4 4 0 0 1 1 0 2 0 3 0 0 0 1 0 0 1 0 0 0
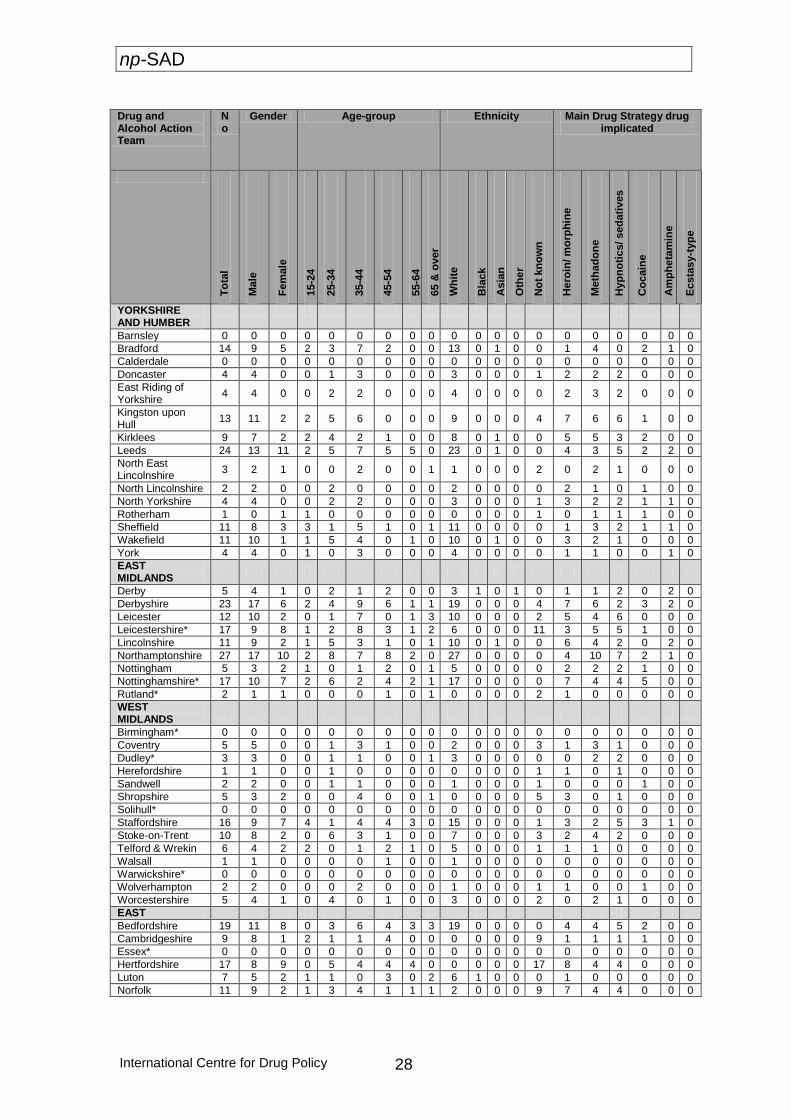
np-SAD
International Centre for Drug Policy 28
Drug and Alcohol Action Team
No
Gender Age-group Ethnicity Main Drug Strategy drug implicated
To
tal
Ma
le
Fe
male
15-2
4
25-3
4
35-4
4
45-5
4
55-6
4
65 &
ov
er
Wh
ite
Bla
ck
Asia
n
Oth
er
No
t kn
ow
n
Hero
in/ m
orp
hin
e
Me
tha
do
ne
Hyp
no
tics/ sed
ati
ves
Co
cain
e
Am
ph
eta
min
e
Ecsta
sy-t
yp
e
YORKSHIRE AND HUMBER
Barnsley 0 0 0 0 0 0 0 0 0 0 0 0 0 0 0 0 0 0 0 0
Bradford 14 9 5 2 3 7 2 0 0 13 0 1 0 0 1 4 0 2 1 0
Calderdale 0 0 0 0 0 0 0 0 0 0 0 0 0 0 0 0 0 0 0 0
Doncaster 4 4 0 0 1 3 0 0 0 3 0 0 0 1 2 2 2 0 0 0
East Riding of Yorkshire
4 4 0 0 2 2 0 0 0 4 0 0 0 0 2 3 2 0 0 0
Kingston upon Hull
13 11 2 2 5 6 0 0 0 9 0 0 0 4 7 6 6 1 0 0
Kirklees 9 7 2 2 4 2 1 0 0 8 0 1 0 0 5 5 3 2 0 0
Leeds 24 13 11 2 5 7 5 5 0 23 0 1 0 0 4 3 5 2 2 0
North East Lincolnshire
3 2 1 0 0 2 0 0 1 1 0 0 0 2 0 2 1 0 0 0
North Lincolnshire 2 2 0 0 2 0 0 0 0 2 0 0 0 0 2 1 0 1 0 0
North Yorkshire 4 4 0 0 2 2 0 0 0 3 0 0 0 1 3 2 2 1 1 0
Rotherham 1 0 1 1 0 0 0 0 0 0 0 0 0 1 0 1 1 1 0 0
Sheffield 11 8 3 3 1 5 1 0 1 11 0 0 0 0 1 3 2 1 1 0
Wakefield 11 10 1 1 5 4 0 1 0 10 0 1 0 0 3 2 1 0 0 0
York 4 4 0 1 0 3 0 0 0 4 0 0 0 0 1 1 0 0 1 0
EAST MIDLANDS
Derby 5 4 1 0 2 1 2 0 0 3 1 0 1 0 1 1 2 0 2 0
Derbyshire 23 17 6 2 4 9 6 1 1 19 0 0 0 4 7 6 2 3 2 0
Leicester 12 10 2 0 1 7 0 1 3 10 0 0 0 2 5 4 6 0 0 0
Leicestershire* 17 9 8 1 2 8 3 1 2 6 0 0 0 11 3 5 5 1 0 0
Lincolnshire 11 9 2 1 5 3 1 0 1 10 0 1 0 0 6 4 2 0 2 0
Northamptonshire 27 17 10 2 8 7 8 2 0 27 0 0 0 0 4 10 7 2 1 0
Nottingham 5 3 2 1 0 1 2 0 1 5 0 0 0 0 2 2 2 1 0 0
Nottinghamshire* 17 10 7 2 6 2 4 2 1 17 0 0 0 0 7 4 4 5 0 0
Rutland* 2 1 1 0 0 0 1 0 1 0 0 0 0 2 1 0 0 0 0 0
WEST MIDLANDS
Birmingham* 0 0 0 0 0 0 0 0 0 0 0 0 0 0 0 0 0 0 0 0
Coventry 5 5 0 0 1 3 1 0 0 2 0 0 0 3 1 3 1 0 0 0
Dudley* 3 3 0 0 1 1 0 0 1 3 0 0 0 0 0 2 2 0 0 0
Herefordshire 1 1 0 0 1 0 0 0 0 0 0 0 0 1 1 0 1 0 0 0
Sandwell 2 2 0 0 1 1 0 0 0 1 0 0 0 1 0 0 0 1 0 0
Shropshire 5 3 2 0 0 4 0 0 1 0 0 0 0 5 3 0 1 0 0 0
Solihull* 0 0 0 0 0 0 0 0 0 0 0 0 0 0 0 0 0 0 0 0
Staffordshire 16 9 7 4 1 4 4 3 0 15 0 0 0 1 3 2 5 3 1 0
Stoke-on-Trent 10 8 2 0 6 3 1 0 0 7 0 0 0 3 2 4 2 0 0 0
Telford & Wrekin 6 4 2 2 0 1 2 1 0 5 0 0 0 1 1 1 0 0 0 0
Walsall 1 1 0 0 0 0 1 0 0 1 0 0 0 0 0 0 0 0 0 0
Warwickshire* 0 0 0 0 0 0 0 0 0 0 0 0 0 0 0 0 0 0 0 0
Wolverhampton 2 2 0 0 0 2 0 0 0 1 0 0 0 1 1 0 0 1 0 0
Worcestershire 5 4 1 0 4 0 1 0 0 3 0 0 0 2 0 2 1 0 0 0
EAST
Bedfordshire 19 11 8 0 3 6 4 3 3 19 0 0 0 0 4 4 5 2 0 0
Cambridgeshire 9 8 1 2 1 1 4 0 0 0 0 0 0 9 1 1 1 1 0 0
Essex* 0 0 0 0 0 0 0 0 0 0 0 0 0 0 0 0 0 0 0 0
Hertfordshire 17 8 9 0 5 4 4 4 0 0 0 0 0 17 8 4 4 0 0 0
Luton 7 5 2 1 1 0 3 0 2 6 1 0 0 0 1 0 0 0 0 0
Norfolk 11 9 2 1 3 4 1 1 1 2 0 0 0 9 7 4 4 0 0 0
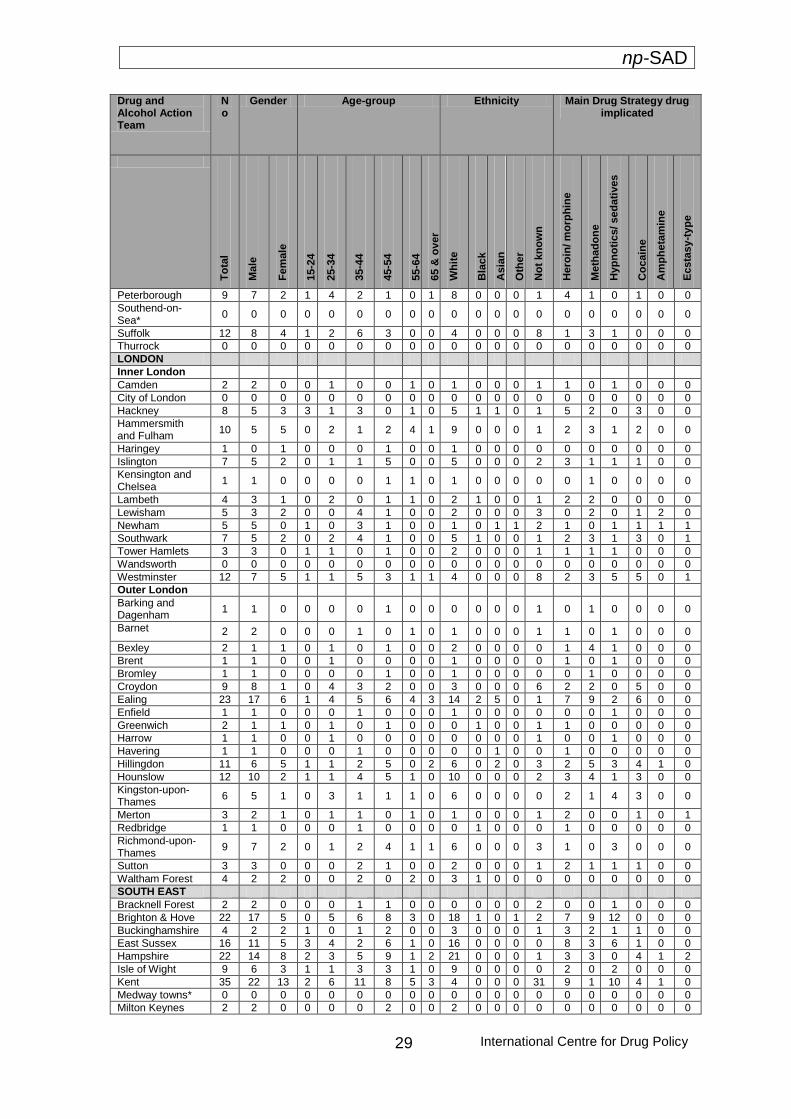
np-SAD
International Centre for Drug Policy
29
Drug and Alcohol Action Team
No
Gender Age-group Ethnicity Main Drug Strategy drug implicated
To
tal
Ma
le
Fe
male
15-2
4
25-3
4
35-4
4
45-5
4
55-6
4
65 &
ov
er
Wh
ite
Bla
ck
Asia
n
Oth
er
No
t kn
ow
n
Hero
in/ m
orp
hin
e
Me
tha
do
ne
Hyp
no
tics/ sed
ati
ves
Co
cain
e
Am
ph
eta
min
e
Ecsta
sy-t
yp
e
Peterborough 9 7 2 1 4 2 1 0 1 8 0 0 0 1 4 1 0 1 0 0
Southend-on-Sea*
0 0 0 0 0 0 0 0 0 0 0 0 0 0 0 0 0 0 0 0
Suffolk 12 8 4 1 2 6 3 0 0 4 0 0 0 8 1 3 1 0 0 0
Thurrock 0 0 0 0 0 0 0 0 0 0 0 0 0 0 0 0 0 0 0 0
LONDON
Inner London
Camden 2 2 0 0 1 0 0 1 0 1 0 0 0 1 1 0 1 0 0 0
City of London 0 0 0 0 0 0 0 0 0 0 0 0 0 0 0 0 0 0 0 0
Hackney 8 5 3 3 1 3 0 1 0 5 1 1 0 1 5 2 0 3 0 0
Hammersmith and Fulham
10 5 5 0 2 1 2 4 1 9 0 0 0 1 2 3 1 2 0 0
Haringey 1 0 1 0 0 0 1 0 0 1 0 0 0 0 0 0 0 0 0 0
Islington 7 5 2 0 1 1 5 0 0 5 0 0 0 2 3 1 1 1 0 0
Kensington and Chelsea
1 1 0 0 0 0 1 1 0 1 0 0 0 0 0 1 0 0 0 0
Lambeth 4 3 1 0 2 0 1 1 0 2 1 0 0 1 2 2 0 0 0 0
Lewisham 5 3 2 0 0 4 1 0 0 2 0 0 0 3 0 2 0 1 2 0
Newham 5 5 0 1 0 3 1 0 0 1 0 1 1 2 1 0 1 1 1 1
Southwark 7 5 2 0 2 4 1 0 0 5 1 0 0 1 2 3 1 3 0 1
Tower Hamlets 3 3 0 1 1 0 1 0 0 2 0 0 0 1 1 1 1 0 0 0
Wandsworth 0 0 0 0 0 0 0 0 0 0 0 0 0 0 0 0 0 0 0 0
Westminster 12 7 5 1 1 5 3 1 1 4 0 0 0 8 2 3 5 5 0 1
Outer London
Barking and Dagenham
1 1 0 0 0 0 1 0 0 0 0 0 0 1 0 1 0 0 0 0
Barnet 2 2 0 0 0 1 0 1 0 1 0 0 0 1 1 0 1 0 0 0
Bexley 2 1 1 0 1 0 1 0 0 2 0 0 0 0 1 4 1 0 0 0
Brent 1 1 0 0 1 0 0 0 0 1 0 0 0 0 1 0 1 0 0 0
Bromley 1 1 0 0 0 0 1 0 0 1 0 0 0 0 0 1 0 0 0 0
Croydon 9 8 1 0 4 3 2 0 0 3 0 0 0 6 2 2 0 5 0 0
Ealing 23 17 6 1 4 5 6 4 3 14 2 5 0 1 7 9 2 6 0 0
Enfield 1 1 0 0 0 1 0 0 0 1 0 0 0 0 0 0 1 0 0 0
Greenwich 2 1 1 0 1 0 1 0 0 0 1 0 0 1 1 0 0 0 0 0
Harrow 1 1 0 0 1 0 0 0 0 0 0 0 0 1 0 0 1 0 0 0
Havering 1 1 0 0 0 1 0 0 0 0 0 1 0 0 1 0 0 0 0 0
Hillingdon 11 6 5 1 1 2 5 0 2 6 0 2 0 3 2 5 3 4 1 0
Hounslow 12 10 2 1 1 4 5 1 0 10 0 0 0 2 3 4 1 3 0 0
Kingston-upon-Thames
6 5 1 0 3 1 1 1 0 6 0 0 0 0 2 1 4 3 0 0
Merton 3 2 1 0 1 1 0 1 0 1 0 0 0 1 2 0 0 1 0 1
Redbridge 1 1 0 0 0 1 0 0 0 0 1 0 0 0 1 0 0 0 0 0
Richmond-upon-Thames
9 7 2 0 1 2 4 1 1 6 0 0 0 3 1 0 3 0 0 0
Sutton 3 3 0 0 0 2 1 0 0 2 0 0 0 1 2 1 1 1 0 0
Waltham Forest 4 2 2 0 0 2 0 2 0 3 1 0 0 0 0 0 0 0 0 0
SOUTH EAST
Bracknell Forest 2 2 0 0 0 1 1 0 0 0 0 0 0 2 0 0 1 0 0 0
Brighton & Hove 22 17 5 0 5 6 8 3 0 18 1 0 1 2 7 9 12 0 0 0
Buckinghamshire 4 2 2 1 0 1 2 0 0 3 0 0 0 1 3 2 1 1 0 0
East Sussex 16 11 5 3 4 2 6 1 0 16 0 0 0 0 8 3 6 1 0 0
Hampshire 22 14 8 2 3 5 9 1 2 21 0 0 0 1 3 3 0 4 1 2
Isle of Wight 9 6 3 1 1 3 3 1 0 9 0 0 0 0 2 0 2 0 0 0
Kent 35 22 13 2 6 11 8 5 3 4 0 0 0 31 9 1 10 4 1 0
Medway towns* 0 0 0 0 0 0 0 0 0 0 0 0 0 0 0 0 0 0 0 0
Milton Keynes 2 2 0 0 0 0 2 0 0 2 0 0 0 0 0 0 0 0 0 0

np-SAD
International Centre for Drug Policy 30
Drug and Alcohol Action Team
No
Gender Age-group Ethnicity Main Drug Strategy drug implicated
To
tal
Ma
le
Fe
male
15-2
4
25-3
4
35-4
4
45-5
4
55-6
4
65 &
ov
er
Wh
ite
Bla
ck
Asia
n
Oth
er
No
t kn
ow
n
Hero
in/ m
orp
hin
e
Me
tha
do
ne
Hyp
no
tics/ sed
ati
ves
Co
cain
e
Am
ph
eta
min
e
Ecsta
sy-t
yp
e
Oxfordshire 1 0 1 0 0 0 0 0 1 1 0 0 0 0 0 0 0 0 0 0
Portsmouth 8 6 2 0 1 3 3 1 0 7 0 0 0 1 5 1 2 1 0 0
Reading 2 2 0 0 0 1 0 1 0 0 0 0 0 2 0 1 0 0 0 0
Slough 2 1 1 1 0 1 0 0 0 1 0 0 0 1 1 0 0 0 0 0
Southampton 17 13 4 3 1 4 5 3 1 15 0 0 0 2 2 3 0 2 0 1
Surrey 21 16 5 1 4 9 5 0 2 5 0 0 0 16 6 3 6 3 1 1
West Berkshire 1 0 1 0 1 0 0 0 0 0 0 0 0 1 0 0 0 0 0 0
West Sussex 9 5 4 0 2 0 4 1 2 3 0 0 0 6 1 1 2 1 0 0
Windsor and Maidenhead
5 4 1 0 0 4 0 1 0 0 0 0 0 5 2 0 3 0 0 0
Wokingham* 0 0 0 0 0 0 0 0 0 0 0 0 0 0 0 0 0 0 0 0
SOUTH WEST
Bath and North East Somerset*
0 0 0 0 0 0 0 0 0 0 0 0 0 0 0 0 0 0 0 0
Bournemouth 13 11 2 0 3 4 5 1 0 13 0 0 0 0 5 11 3 1 0 0
Bristol* 0 0 0 0 0 0 0 0 0 0 0 0 0 0 0 0 0 0 0 0
Cornwall & Isles of Scilly
14 10 4 0 2 4 5 2 1 8 0 0 0 6 0 2 3 0 0 0
Devon 20 13 7 0 5 4 4 4 3 2 0 0 0 18 3 2 4 0 0 0
Dorset 8 7 1 1 3 1 2 1 0 7 0 0 0 1 6 2 2 0 0 0
Gloucestershire 10 2 8 0 1 3 6 0 0 10 0 0 0 0 3 2 3 0 0 0
North Somerset* 1 1 0 0 0 1 0 0 0 1 0 0 0 0 1 0 1 0 0 0
Plymouth 1 1 0 1 0 0 0 0 0 1 0 0 0 0 0 0 0 0 0 0
Poole 10 8 2 0 4 3 1 1 1 9 0 1 0 0 3 3 1 0 0 0
Somerset 10 7 3 1 2 1 4 1 1 8 0 0 0 2 3 1 2 0 1 0
South Gloucestershire*
0 0 0 0 0 0 0 0 0 0 0 0 0 0 0 0 0 0 0 0
Swindon 16 12 4 0 6 3 7 0 0 15 0 0 0 1 5 7 2 2 0 0
Torbay 3 1 2 0 0 2 0 1 0 3 0 0 0 0 2 1 2 1 1 0
Wiltshire 11 4 7 0 1 2 3 4 1 11 0 0 0 0 3 1 2 0 0 0
Note: In addition there were a number of cases that could not be allocated to specific DAAT areas because they were of no fixed abode and/or the jurisdiction in which the inquest was held covers more than one DAAT. Some cases were usually resident outside the UK. Some DAATs are covered by coroner’s jurisdictions that did not submit information (or only partial information) to the np-SAD; they are marked thus - *.
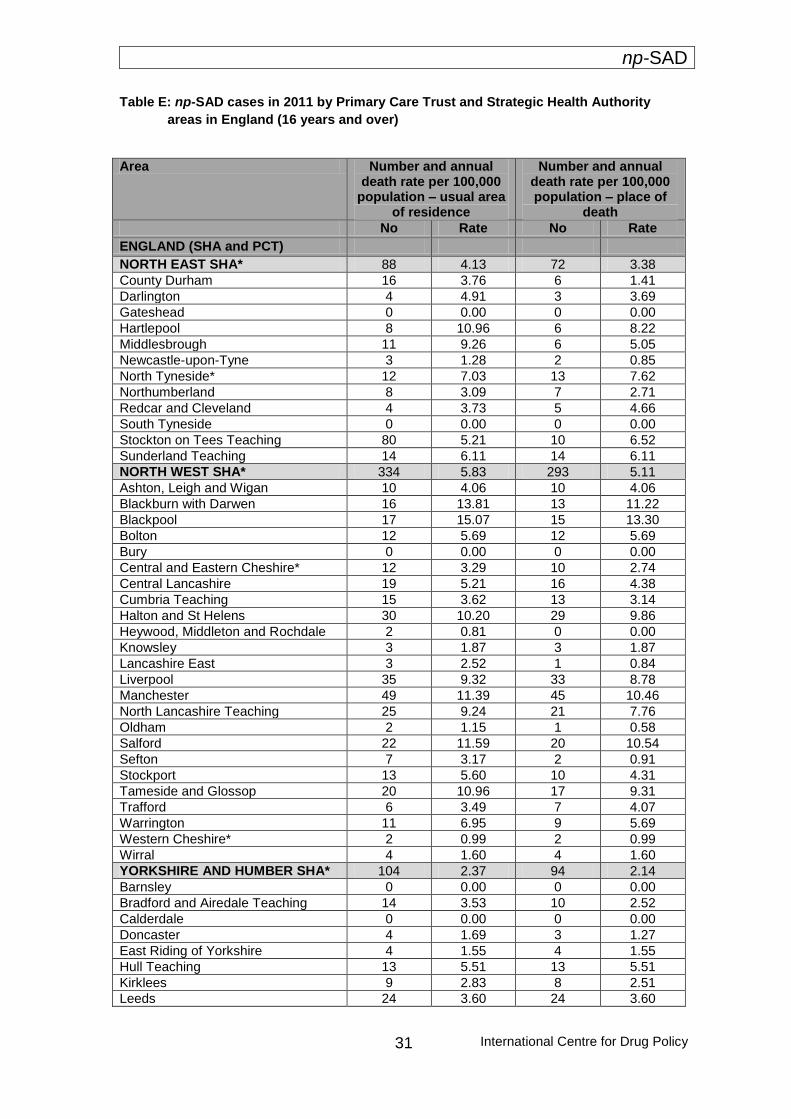
np-SAD
International Centre for Drug Policy
31
Table E: np-SAD cases in 2011 by Primary Care Trust and Strategic Health Authority
areas in England (16 years and over)
Area Number and annual death rate per 100,000
population – usual area of residence
Number and annual death rate per 100,000 population – place of
death
No Rate No Rate
ENGLAND (SHA and PCT)
NORTH EAST SHA* 88 4.13 72 3.38
County Durham 16 3.76 6 1.41
Darlington 4 4.91 3 3.69
Gateshead 0 0.00 0 0.00
Hartlepool 8 10.96 6 8.22
Middlesbrough 11 9.26 6 5.05
Newcastle-upon-Tyne 3 1.28 2 0.85
North Tyneside* 12 7.03 13 7.62
Northumberland 8 3.09 7 2.71
Redcar and Cleveland 4 3.73 5 4.66
South Tyneside 0 0.00 0 0.00
Stockton on Tees Teaching 80 5.21 10 6.52
Sunderland Teaching 14 6.11 14 6.11
NORTH WEST SHA* 334 5.83 293 5.11
Ashton, Leigh and Wigan 10 4.06 10 4.06
Blackburn with Darwen 16 13.81 13 11.22
Blackpool 17 15.07 15 13.30
Bolton 12 5.69 12 5.69
Bury 0 0.00 0 0.00
Central and Eastern Cheshire* 12 3.29 10 2.74
Central Lancashire 19 5.21 16 4.38
Cumbria Teaching 15 3.62 13 3.14
Halton and St Helens 30 10.20 29 9.86
Heywood, Middleton and Rochdale 2 0.81 0 0.00
Knowsley 3 1.87 3 1.87
Lancashire East 3 2.52 1 0.84
Liverpool 35 9.32 33 8.78
Manchester 49 11.39 45 10.46
North Lancashire Teaching 25 9.24 21 7.76
Oldham 2 1.15 1 0.58
Salford 22 11.59 20 10.54
Sefton 7 3.17 2 0.91
Stockport 13 5.60 10 4.31
Tameside and Glossop 20 10.96 17 9.31
Trafford 6 3.49 7 4.07
Warrington 11 6.95 9 5.69
Western Cheshire* 2 0.99 2 0.99
Wirral 4 1.60 4 1.60
YORKSHIRE AND HUMBER SHA* 104 2.37 94 2.14
Barnsley 0 0.00 0 0.00
Bradford and Airedale Teaching 14 3.53 10 2.52
Calderdale 0 0.00 0 0.00
Doncaster 4 1.69 3 1.27
East Riding of Yorkshire 4 1.55 4 1.55
Hull Teaching 13 5.51 13 5.51
Kirklees 9 2.83 8 2.51
Leeds 24 3.60 24 3.60

np-SAD
International Centre for Drug Policy 32
Area Number and annual death rate per 100,000
population – usual area of residence
Number and annual death rate per 100,000 population – place of
death
No Rate No Rate
North East Lincolnshire
3 2.28 1 0.76
North Lincolnshire 2 1.54 1 0.77
North Yorkshire and York* 8 1.24 6 0.93
Rotherham 1 0.51 1 0.51
Sheffield 11 2.37 12 2.59
Wakefield District 11 4.00 11 4.00
EAST MIDLANDS SHA* 116 3.17 85 2.32
Bassetlaw* 4 4.57 2 2.28
Derby City 5 2.20 6 2.64
Derbyshire 20 3.49 14 2.44
Leicester City 12 4.70 5 1.96
Leicestershire County and Rutland* 19 3.55 11 2.06
NHS Lincolnshire 11 1.88 9 1.54
NHS Northamptonshire 27 5.03 24 4.47
Nottingham City 5 1.85 4 1.48
Nottinghamshire County Teaching* 13 2.45 10 1.89
WEST MIDLANDS SHA* 56 1.24 49 1.09
Birmingham East and North* 0 0.00 0 0.00
Coventry Teaching 5 1.86 3 1.11
Dudley* 3 1.22 3 1.22 Heart of Birmingham Teaching* 0 0.00 0 0.00
Herefordshire 1 0.69 0 0.00
North Staffordshire 2 1.18 2 1.18
Sandwell 2 0.82 1 0.41
Shropshire County* 5 2.13 7 2.98
Solihull* 0 0.00 0 0.00
South Birmingham* 0 0.00 1 0.35
South Staffordshire 14 2.90 12 2.49
Stoke-on-Trent 10 4.76 9 4.28
Telford and Wrekin 6 4.65 4 3.10
Walsall Teaching* 1 0.51 1 0.51
Warwickshire* 0 0.00 0 0.00
Wolverhampton City 2 1.04 1 0.52
Worcestershire 5 1.12 5 1.12
EAST OF ENGLAND SHA 84 1.77 77 1.62
Bedfordshire 19 5.62 18 5.33
Cambridgeshire 9 1.84 6 1.23
Hertfordshire 17 1.88 21 2.33
Great Yarmouth and Waveney 4 2.15 3 1.61
Luton 7 4.62 8 5.28
Mid Essex 0 0.00 0 0.00
Norfolk 9 1.45 6 0.97
North East Essex 0 0.00 0 0.00
Peterborough 9 7.20 9 7.20
South East Essex 0 0.00 0 0.00
South West Essex 0 0.00 0 0.00
Suffolk 10 2.05 6 1.23
West Essex
0 0.00 0 0.00
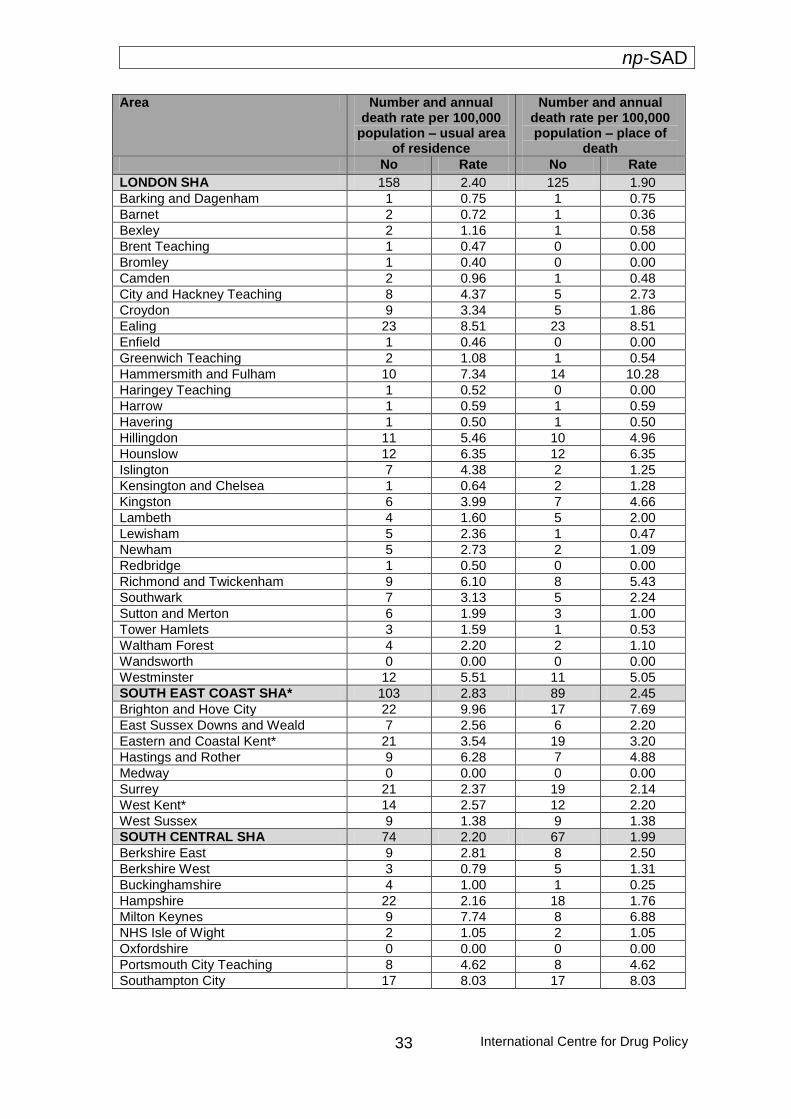
np-SAD
International Centre for Drug Policy
33
Area Number and annual death rate per 100,000
population – usual area of residence
Number and annual death rate per 100,000 population – place of
death
No Rate No Rate
LONDON SHA 158 2.40 125 1.90
Barking and Dagenham 1 0.75 1 0.75
Barnet 2 0.72 1 0.36
Bexley 2 1.16 1 0.58
Brent Teaching 1 0.47 0 0.00
Bromley 1 0.40 0 0.00
Camden 2 0.96 1 0.48
City and Hackney Teaching 8 4.37 5 2.73
Croydon 9 3.34 5 1.86
Ealing 23 8.51 23 8.51
Enfield 1 0.46 0 0.00
Greenwich Teaching 2 1.08 1 0.54
Hammersmith and Fulham 10 7.34 14 10.28
Haringey Teaching 1 0.52 0 0.00
Harrow 1 0.59 1 0.59
Havering 1 0.50 1 0.50
Hillingdon 11 5.46 10 4.96
Hounslow 12 6.35 12 6.35
Islington 7 4.38 2 1.25
Kensington and Chelsea 1 0.64 2 1.28
Kingston 6 3.99 7 4.66
Lambeth 4 1.60 5 2.00
Lewisham 5 2.36 1 0.47
Newham 5 2.73 2 1.09
Redbridge 1 0.50 0 0.00
Richmond and Twickenham 9 6.10 8 5.43
Southwark 7 3.13 5 2.24
Sutton and Merton 6 1.99 3 1.00
Tower Hamlets 3 1.59 1 0.53
Waltham Forest 4 2.20 2 1.10
Wandsworth 0 0.00 0 0.00
Westminster 12 5.51 11 5.05
SOUTH EAST COAST SHA* 103 2.83 89 2.45
Brighton and Hove City 22 9.96 17 7.69
East Sussex Downs and Weald 7 2.56 6 2.20
Eastern and Coastal Kent* 21 3.54 19 3.20
Hastings and Rother 9 6.28 7 4.88
Medway 0 0.00 0 0.00
Surrey 21 2.37 19 2.14
West Kent* 14 2.57 12 2.20
West Sussex 9 1.38 9 1.38
SOUTH CENTRAL SHA 74 2.20 67 1.99
Berkshire East 9 2.81 8 2.50
Berkshire West 3 0.79 5 1.31
Buckinghamshire 4 1.00 1 0.25
Hampshire 22 2.16 18 1.76
Milton Keynes 9 7.74 8 6.88
NHS Isle of Wight 2 1.05 2 1.05
Oxfordshire 0 0.00 0 0.00
Portsmouth City Teaching 8 4.62 8 4.62
Southampton City 17 8.03 17 8.03
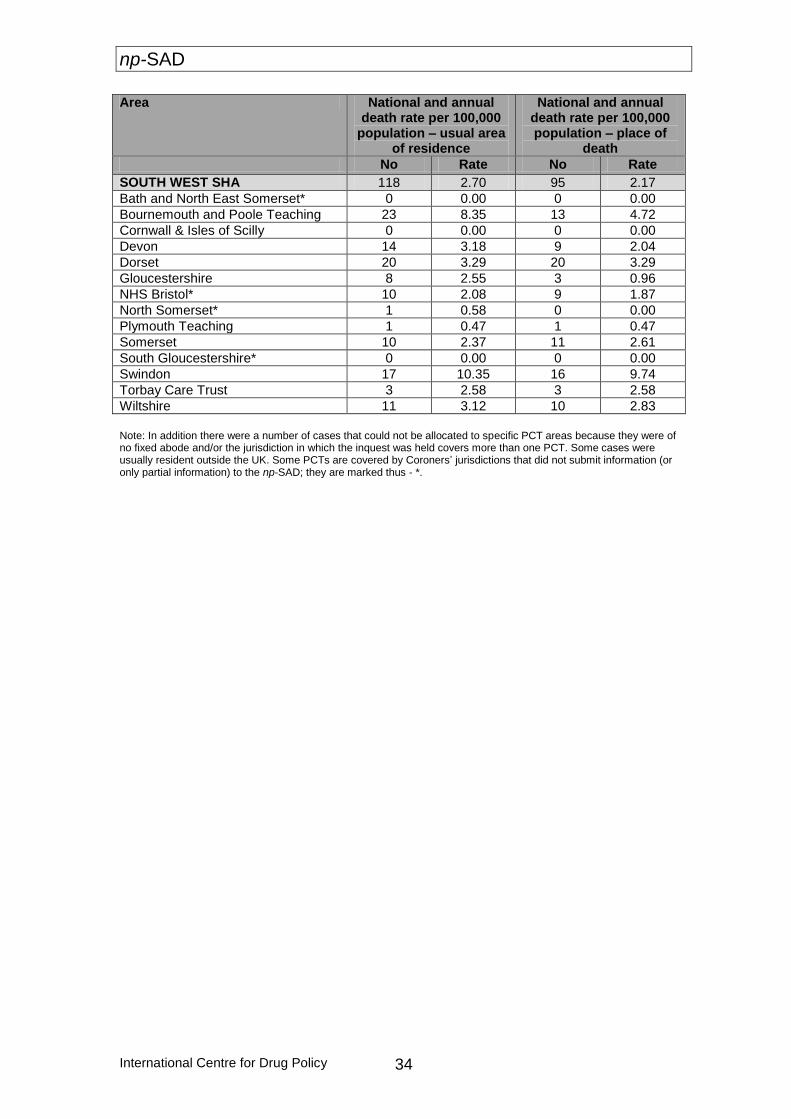
np-SAD
International Centre for Drug Policy 34
Area National and annual death rate per 100,000
population – usual area of residence
National and annual death rate per 100,000 population – place of
death
No Rate No Rate
SOUTH WEST SHA 118 2.70 95 2.17
Bath and North East Somerset* 0 0.00 0 0.00
Bournemouth and Poole Teaching 23 8.35 13 4.72
Cornwall & Isles of Scilly 0 0.00 0 0.00
Devon 14 3.18 9 2.04
Dorset 20 3.29 20 3.29
Gloucestershire 8 2.55 3 0.96
NHS Bristol* 10 2.08 9 1.87
North Somerset* 1 0.58 0 0.00
Plymouth Teaching 1 0.47 1 0.47
Somerset 10 2.37 11 2.61
South Gloucestershire* 0 0.00 0 0.00
Swindon 17 10.35 16 9.74
Torbay Care Trust 3 2.58 3 2.58
Wiltshire 11 3.12 10 2.83
Note: In addition there were a number of cases that could not be allocated to specific PCT areas because they were of no fixed abode and/or the jurisdiction in which the inquest was held covers more than one PCT. Some cases were usually resident outside the UK. Some PCTs are covered by Coroners’ jurisdictions that did not submit information (or only partial information) to the np-SAD; they are marked thus - *.
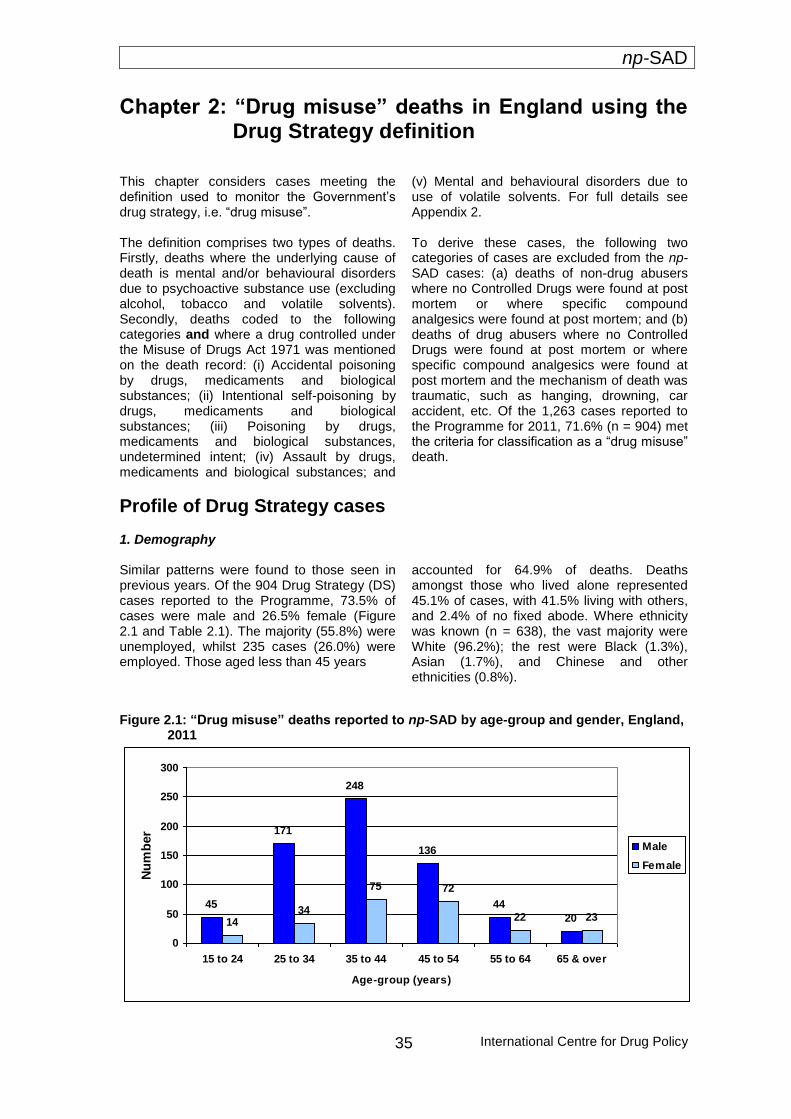
np-SAD
International Centre for Drug Policy
35
Chapter 2: “Drug misuse” deaths in England using the Drug Strategy definition
This chapter considers cases meeting the definition used to monitor the Government’s drug strategy, i.e. “drug misuse”. The definition comprises two types of deaths. Firstly, deaths where the underlying cause of death is mental and/or behavioural disorders due to psychoactive substance use (excluding alcohol, tobacco and volatile solvents). Secondly, deaths coded to the following categories and where a drug controlled under the Misuse of Drugs Act 1971 was mentioned on the death record: (i) Accidental poisoning by drugs, medicaments and biological substances; (ii) Intentional self-poisoning by drugs, medicaments and biological substances; (iii) Poisoning by drugs, medicaments and biological substances, undetermined intent; (iv) Assault by drugs, medicaments and biological substances; and
(v) Mental and behavioural disorders due to use of volatile solvents. For full details see Appendix 2. To derive these cases, the following two categories of cases are excluded from the np-SAD cases: (a) deaths of non-drug abusers where no Controlled Drugs were found at post mortem or where specific compound analgesics were found at post mortem; and (b) deaths of drug abusers where no Controlled Drugs were found at post mortem or where specific compound analgesics were found at post mortem and the mechanism of death was traumatic, such as hanging, drowning, car accident, etc. Of the 1,263 cases reported to the Programme for 2011, 71.6% (n = 904) met the criteria for classification as a “drug misuse” death.
Profile of Drug Strategy cases 1. Demography Similar patterns were found to those seen in previous years. Of the 904 Drug Strategy (DS) cases reported to the Programme, 73.5% of cases were male and 26.5% female (Figure 2.1 and Table 2.1). The majority (55.8%) were unemployed, whilst 235 cases (26.0%) were employed. Those aged less than 45 years
accounted for 64.9% of deaths. Deaths amongst those who lived alone represented 45.1% of cases, with 41.5% living with others, and 2.4% of no fixed abode. Where ethnicity was known (n = 638), the vast majority were White (96.2%); the rest were Black (1.3%), Asian (1.7%), and Chinese and other ethnicities (0.8%).
Figure 2.1: “Drug misuse” deaths reported to np-SAD by age-group and gender, England, 2011
45
171
248
136
44
201434
75 72
22 23
0
50
100
150
200
250
300
15 to 24 25 to 34 35 to 44 45 to 54 55 to 64 65 & over
Age-group (years)
Nu
mb
er
Male
Female
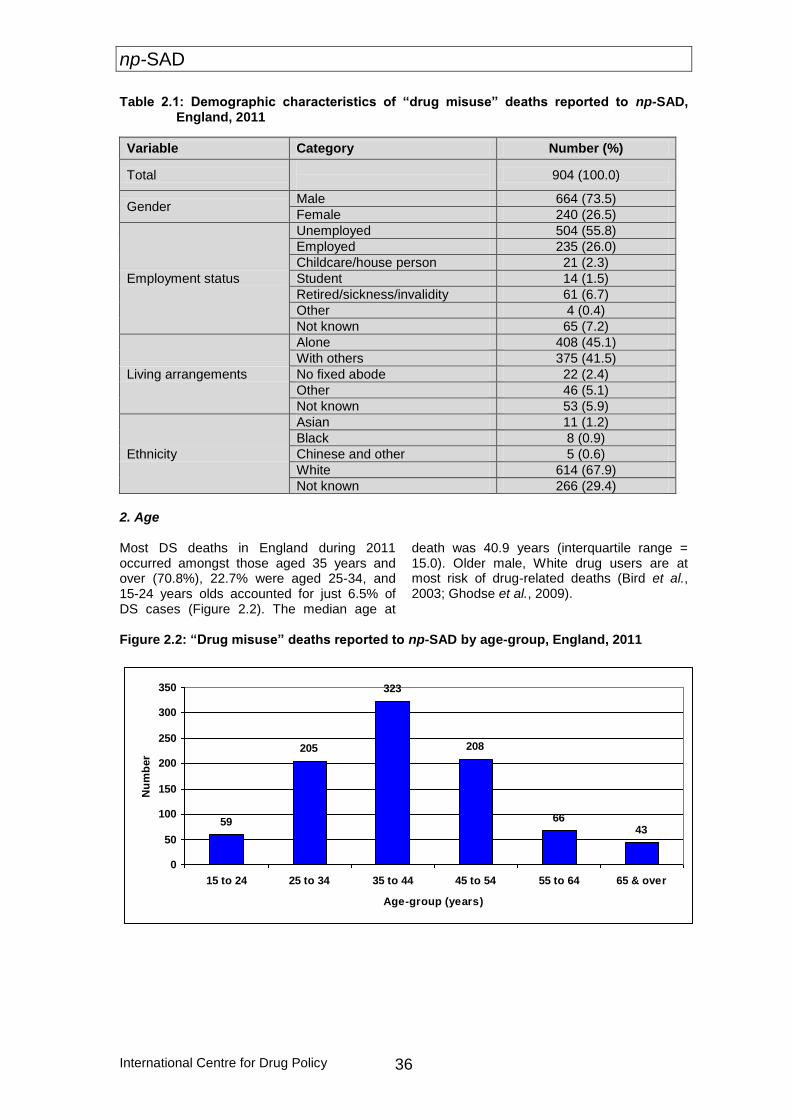
np-SAD
International Centre for Drug Policy 36
Table 2.1: Demographic characteristics of “drug misuse” deaths reported to np-SAD, England, 2011
Variable Category Number (%)
Total
904 (100.0)
Gender Male 664 (73.5)
Female 240 (26.5)
Employment status
Unemployed 504 (55.8)
Employed 235 (26.0)
Childcare/house person 21 (2.3)
Student 14 (1.5)
Retired/sickness/invalidity 61 (6.7)
Other 4 (0.4)
Not known 65 (7.2)
Living arrangements
Alone 408 (45.1)
With others 375 (41.5)
No fixed abode 22 (2.4)
Other 46 (5.1)
Not known 53 (5.9)
Ethnicity
Asian 11 (1.2)
Black 8 (0.9)
Chinese and other 5 (0.6)
White 614 (67.9)
Not known 266 (29.4)
2. Age Most DS deaths in England during 2011 occurred amongst those aged 35 years and over (70.8%), 22.7% were aged 25-34, and 15-24 years olds accounted for just 6.5% of DS cases (Figure 2.2). The median age at
death was 40.9 years (interquartile range = 15.0). Older male, White drug users are at most risk of drug-related deaths (Bird et al., 2003; Ghodse et al., 2009).
Figure 2.2: “Drug misuse” deaths reported to np-SAD by age-group, England, 2011
59
205
323
208
6643
0
50
100
150
200
250
300
350
15 to 24 25 to 34 35 to 44 45 to 54 55 to 64 65 & over
Age-group (years)
Nu
mb
er
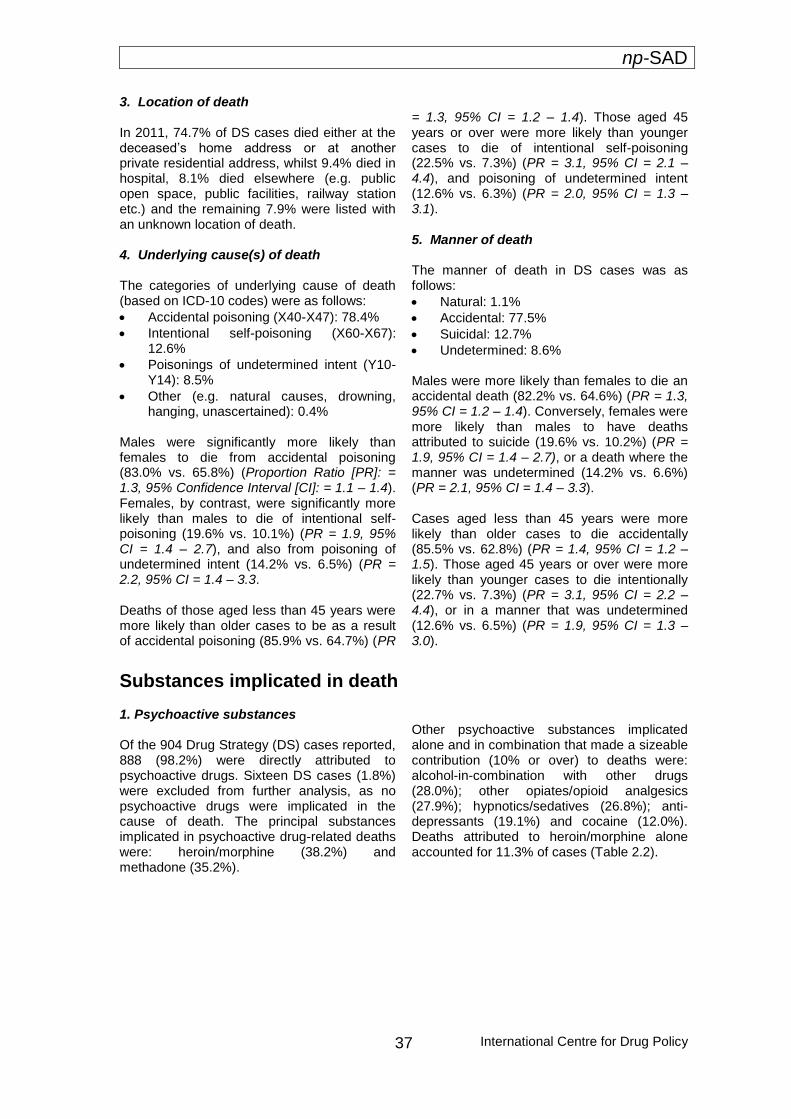
np-SAD
International Centre for Drug Policy
37
3. Location of death In 2011, 74.7% of DS cases died either at the deceased’s home address or at another private residential address, whilst 9.4% died in hospital, 8.1% died elsewhere (e.g. public open space, public facilities, railway station etc.) and the remaining 7.9% were listed with an unknown location of death. 4. Underlying cause(s) of death The categories of underlying cause of death (based on ICD-10 codes) were as follows:
Accidental poisoning (X40-X47): 78.4%
Intentional self-poisoning (X60-X67): 12.6%
Poisonings of undetermined intent (Y10-Y14): 8.5%
Other (e.g. natural causes, drowning, hanging, unascertained): 0.4%
Males were significantly more likely than females to die from accidental poisoning (83.0% vs. 65.8%) (Proportion Ratio [PR]: = 1.3, 95% Confidence Interval [CI]: = 1.1 – 1.4). Females, by contrast, were significantly more likely than males to die of intentional self-poisoning (19.6% vs. 10.1%) (PR = 1.9, 95% CI = 1.4 – 2.7), and also from poisoning of undetermined intent (14.2% vs. 6.5%) (PR = 2.2, 95% CI = 1.4 – 3.3. Deaths of those aged less than 45 years were more likely than older cases to be as a result of accidental poisoning (85.9% vs. 64.7%) (PR
= 1.3, 95% CI = 1.2 – 1.4). Those aged 45 years or over were more likely than younger cases to die of intentional self-poisoning (22.5% vs. 7.3%) (PR = 3.1, 95% CI = 2.1 – 4.4), and poisoning of undetermined intent (12.6% vs. 6.3%) (PR = 2.0, 95% CI = 1.3 – 3.1). 5. Manner of death The manner of death in DS cases was as follows:
Natural: 1.1%
Accidental: 77.5%
Suicidal: 12.7%
Undetermined: 8.6%
Males were more likely than females to die an accidental death (82.2% vs. 64.6%) (PR = 1.3, 95% CI = 1.2 – 1.4). Conversely, females were more likely than males to have deaths attributed to suicide (19.6% vs. 10.2%) (PR = 1.9, 95% CI = 1.4 – 2.7), or a death where the manner was undetermined (14.2% vs. 6.6%) (PR = 2.1, 95% CI = 1.4 – 3.3). Cases aged less than 45 years were more likely than older cases to die accidentally (85.5% vs. 62.8%) (PR = 1.4, 95% CI = 1.2 – 1.5). Those aged 45 years or over were more likely than younger cases to die intentionally (22.7% vs. 7.3%) (PR = 3.1, 95% CI = 2.2 – 4.4), or in a manner that was undetermined (12.6% vs. 6.5%) (PR = 1.9, 95% CI = 1.3 – 3.0).
Substances implicated in death
1. Psychoactive substances Of the 904 Drug Strategy (DS) cases reported, 888 (98.2%) were directly attributed to psychoactive drugs. Sixteen DS cases (1.8%) were excluded from further analysis, as no psychoactive drugs were implicated in the cause of death. The principal substances implicated in psychoactive drug-related deaths were: heroin/morphine (38.2%) and methadone (35.2%).
Other psychoactive substances implicated alone and in combination that made a sizeable contribution (10% or over) to deaths were: alcohol-in-combination with other drugs (28.0%); other opiates/opioid analgesics (27.9%); hypnotics/sedatives (26.8%); anti-depressants (19.1%) and cocaine (12.0%). Deaths attributed to heroin/morphine alone accounted for 11.3% of cases (Table 2.2).
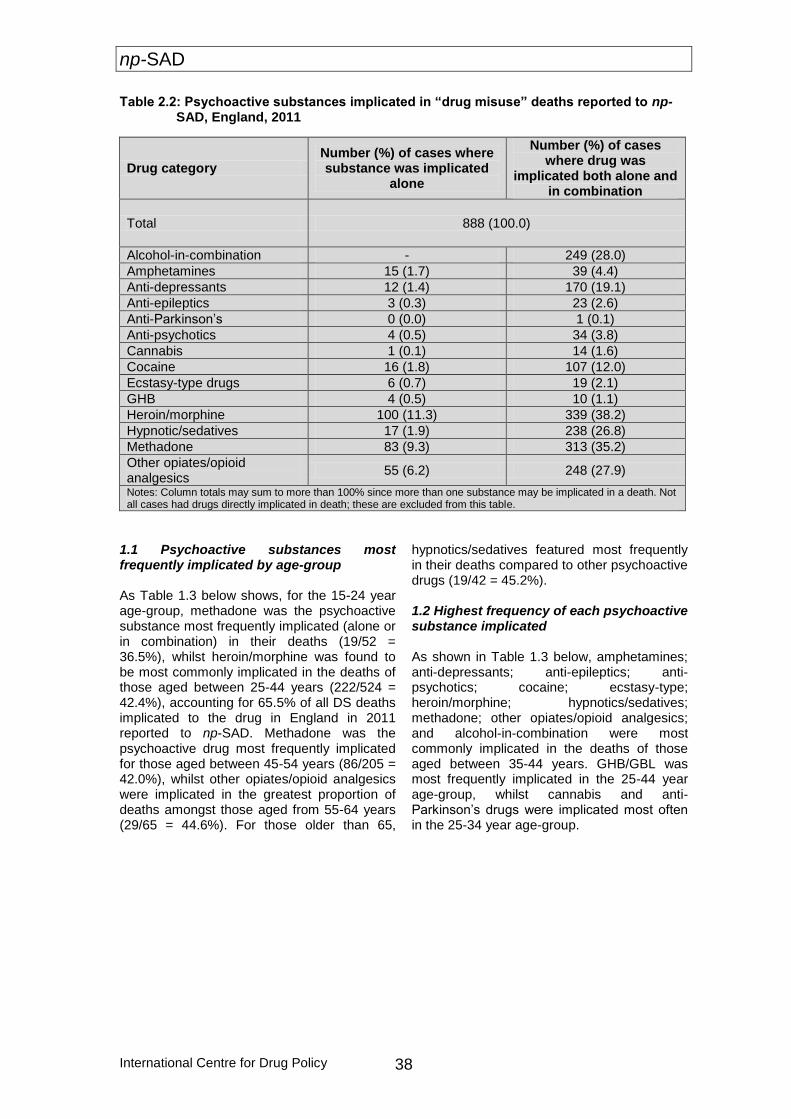
np-SAD
International Centre for Drug Policy 38
Table 2.2: Psychoactive substances implicated in “drug misuse” deaths reported to np-SAD, England, 2011
Drug category Number (%) of cases where substance was implicated
alone
Number (%) of cases where drug was
implicated both alone and in combination
Total 888 (100.0)
Alcohol-in-combination - 249 (28.0)
Amphetamines 15 (1.7) 39 (4.4)
Anti-depressants 12 (1.4) 170 (19.1)
Anti-epileptics 3 (0.3) 23 (2.6)
Anti-Parkinson’s 0 (0.0) 1 (0.1)
Anti-psychotics 4 (0.5) 34 (3.8)
Cannabis 1 (0.1) 14 (1.6)
Cocaine 16 (1.8) 107 (12.0)
Ecstasy-type drugs 6 (0.7) 19 (2.1)
GHB 4 (0.5) 10 (1.1)
Heroin/morphine 100 (11.3) 339 (38.2)
Hypnotic/sedatives 17 (1.9) 238 (26.8)
Methadone 83 (9.3) 313 (35.2)
Other opiates/opioid analgesics
55 (6.2) 248 (27.9)
Notes: Column totals may sum to more than 100% since more than one substance may be implicated in a death. Not all cases had drugs directly implicated in death; these are excluded from this table.
1.1 Psychoactive substances most frequently implicated by age-group As Table 1.3 below shows, for the 15-24 year age-group, methadone was the psychoactive substance most frequently implicated (alone or in combination) in their deaths (19/52 = 36.5%), whilst heroin/morphine was found to be most commonly implicated in the deaths of those aged between 25-44 years (222/524 = 42.4%), accounting for 65.5% of all DS deaths implicated to the drug in England in 2011 reported to np-SAD. Methadone was the psychoactive drug most frequently implicated for those aged between 45-54 years (86/205 = 42.0%), whilst other opiates/opioid analgesics were implicated in the greatest proportion of deaths amongst those aged from 55-64 years (29/65 = 44.6%). For those older than 65,
hypnotics/sedatives featured most frequently in their deaths compared to other psychoactive drugs (19/42 = 45.2%). 1.2 Highest frequency of each psychoactive substance implicated As shown in Table 1.3 below, amphetamines; anti-depressants; anti-epileptics; anti-psychotics; cocaine; ecstasy-type; heroin/morphine; hypnotics/sedatives; methadone; other opiates/opioid analgesics; and alcohol-in-combination were most commonly implicated in the deaths of those aged between 35-44 years. GHB/GBL was most frequently implicated in the 25-44 year age-group, whilst cannabis and anti-Parkinson’s drugs were implicated most often in the 25-34 year age-group.
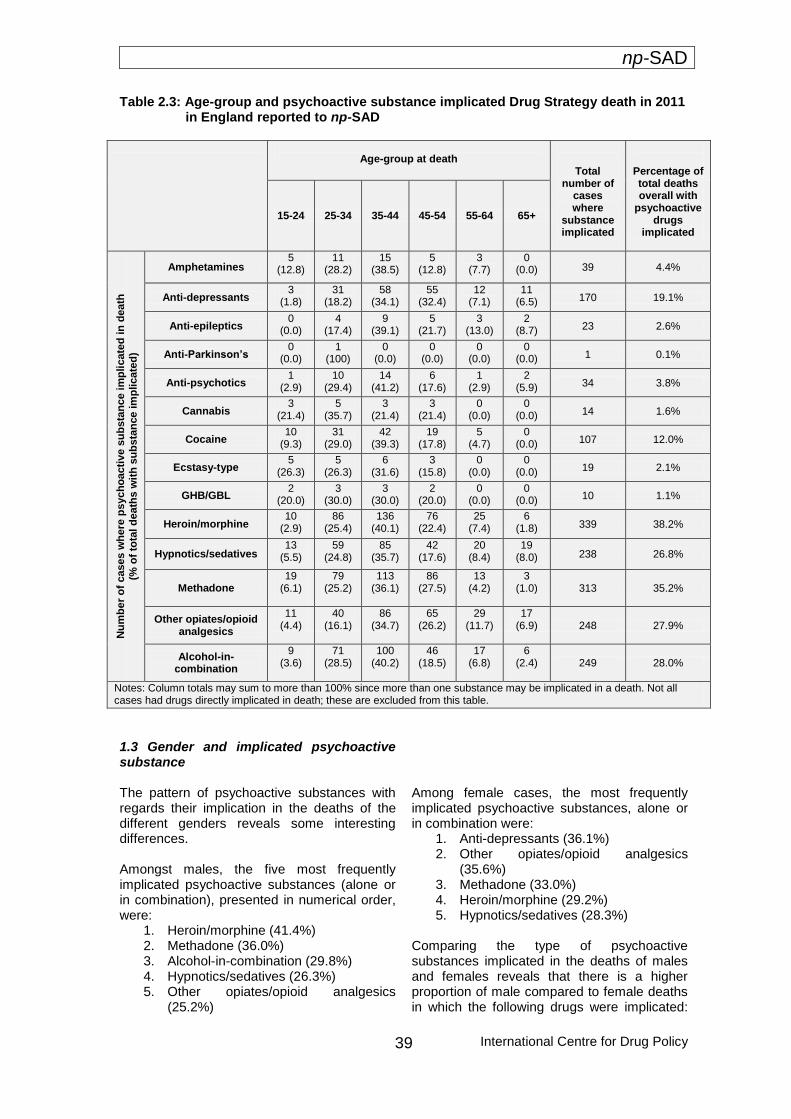
np-SAD
International Centre for Drug Policy
39
Table 2.3: Age-group and psychoactive substance implicated Drug Strategy death in 2011 in England reported to np-SAD
Age-group at death
Total number of
cases where
substance implicated
Percentage of total deaths overall with
psychoactive drugs
implicated
15-24 25-34 35-44 45-54 55-64 65+
Nu
mb
er
of
cases w
he
re p
sych
oacti
ve s
ub
sta
nc
e im
pli
cate
d in
death
(% o
f to
tal d
eath
s w
ith
su
bs
tan
ce im
plicate
d)
Amphetamines 5
(12.8) 11
(28.2) 15
(38.5) 5
(12.8) 3
(7.7) 0
(0.0) 39 4.4%
Anti-depressants 3
(1.8) 31
(18.2) 58
(34.1) 55
(32.4) 12
(7.1) 11
(6.5) 170 19.1%
Anti-epileptics 0
(0.0) 4
(17.4) 9
(39.1) 5
(21.7) 3
(13.0) 2
(8.7) 23 2.6%
Anti-Parkinson’s 0
(0.0) 1
(100) 0
(0.0) 0
(0.0) 0
(0.0) 0
(0.0) 1 0.1%
Anti-psychotics 1
(2.9) 10
(29.4) 14
(41.2) 6
(17.6) 1
(2.9) 2
(5.9) 34 3.8%
Cannabis 3
(21.4) 5
(35.7) 3
(21.4) 3
(21.4) 0
(0.0) 0
(0.0) 14 1.6%
Cocaine 10
(9.3) 31
(29.0) 42
(39.3) 19
(17.8) 5
(4.7) 0
(0.0) 107 12.0%
Ecstasy-type 5
(26.3) 5
(26.3) 6
(31.6) 3
(15.8) 0
(0.0) 0
(0.0) 19 2.1%
GHB/GBL 2
(20.0) 3
(30.0) 3
(30.0) 2
(20.0) 0
(0.0) 0
(0.0) 10 1.1%
Heroin/morphine 10
(2.9) 86
(25.4) 136
(40.1) 76
(22.4) 25
(7.4) 6
(1.8) 339 38.2%
Hypnotics/sedatives 13
(5.5) 59
(24.8) 85
(35.7) 42
(17.6) 20
(8.4) 19
(8.0) 238 26.8%
Methadone 19
(6.1)
79 (25.2)
113 (36.1)
86 (27.5)
13 (4.2)
3 (1.0) 313 35.2%
Other opiates/opioid analgesics
11 (4.4)
40 (16.1)
86 (34.7)
65 (26.2)
29 (11.7)
17 (6.9) 248 27.9%
Alcohol-in-combination
9 (3.6)
71 (28.5)
100 (40.2)
46 (18.5)
17 (6.8)
6 (2.4)
249 28.0%
Notes: Column totals may sum to more than 100% since more than one substance may be implicated in a death. Not all cases had drugs directly implicated in death; these are excluded from this table.
1.3 Gender and implicated psychoactive substance
The pattern of psychoactive substances with regards their implication in the deaths of the different genders reveals some interesting differences. Amongst males, the five most frequently implicated psychoactive substances (alone or in combination), presented in numerical order, were:
1. Heroin/morphine (41.4%) 2. Methadone (36.0%) 3. Alcohol-in-combination (29.8%) 4. Hypnotics/sedatives (26.3%) 5. Other opiates/opioid analgesics
(25.2%)
Among female cases, the most frequently implicated psychoactive substances, alone or in combination were:
1. Anti-depressants (36.1%) 2. Other opiates/opioid analgesics
(35.6%) 3. Methadone (33.0%) 4. Heroin/morphine (29.2%) 5. Hypnotics/sedatives (28.3%)
Comparing the type of psychoactive substances implicated in the deaths of males and females reveals that there is a higher proportion of male compared to female deaths in which the following drugs were implicated:
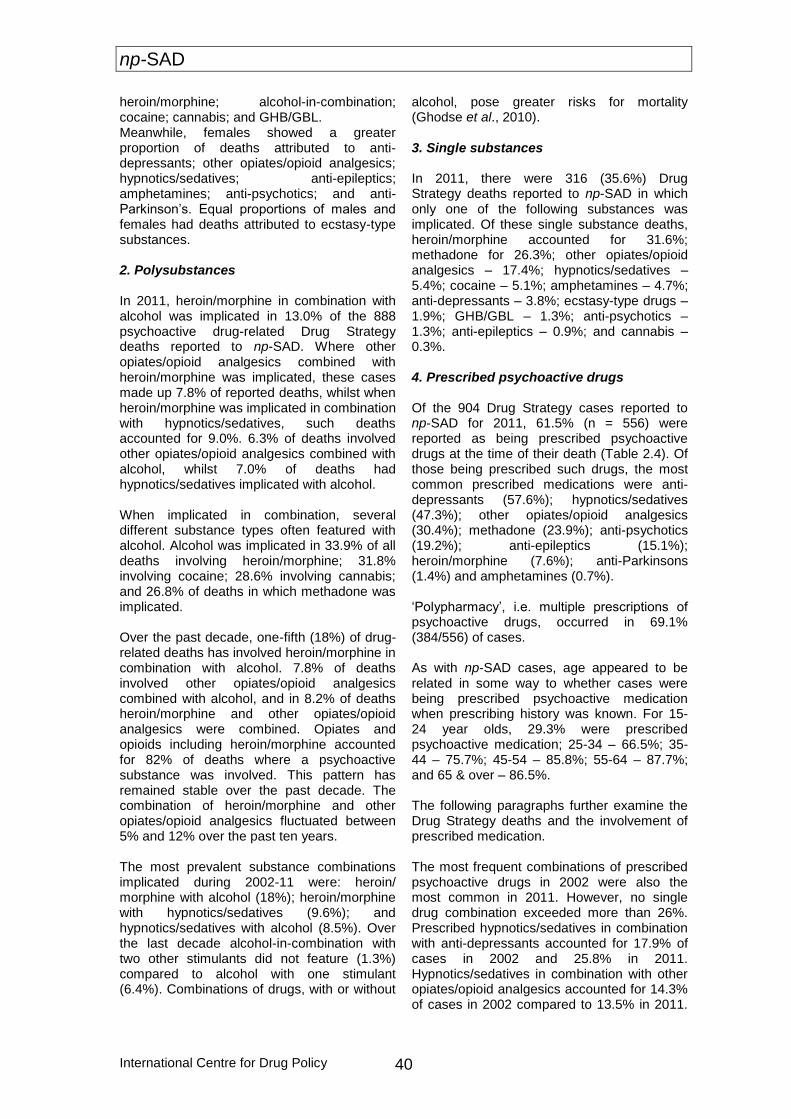
np-SAD
International Centre for Drug Policy 40
heroin/morphine; alcohol-in-combination; cocaine; cannabis; and GHB/GBL. Meanwhile, females showed a greater proportion of deaths attributed to anti-depressants; other opiates/opioid analgesics; hypnotics/sedatives; anti-epileptics; amphetamines; anti-psychotics; and anti-Parkinson’s. Equal proportions of males and females had deaths attributed to ecstasy-type substances. 2. Polysubstances In 2011, heroin/morphine in combination with alcohol was implicated in 13.0% of the 888 psychoactive drug-related Drug Strategy deaths reported to np-SAD. Where other opiates/opioid analgesics combined with heroin/morphine was implicated, these cases made up 7.8% of reported deaths, whilst when heroin/morphine was implicated in combination with hypnotics/sedatives, such deaths accounted for 9.0%. 6.3% of deaths involved other opiates/opioid analgesics combined with alcohol, whilst 7.0% of deaths had hypnotics/sedatives implicated with alcohol. When implicated in combination, several different substance types often featured with alcohol. Alcohol was implicated in 33.9% of all deaths involving heroin/morphine; 31.8% involving cocaine; 28.6% involving cannabis; and 26.8% of deaths in which methadone was implicated. Over the past decade, one-fifth (18%) of drug-related deaths has involved heroin/morphine in combination with alcohol. 7.8% of deaths involved other opiates/opioid analgesics combined with alcohol, and in 8.2% of deaths heroin/morphine and other opiates/opioid analgesics were combined. Opiates and opioids including heroin/morphine accounted for 82% of deaths where a psychoactive substance was involved. This pattern has remained stable over the past decade. The combination of heroin/morphine and other opiates/opioid analgesics fluctuated between 5% and 12% over the past ten years. The most prevalent substance combinations implicated during 2002-11 were: heroin/ morphine with alcohol (18%); heroin/morphine with hypnotics/sedatives (9.6%); and hypnotics/sedatives with alcohol (8.5%). Over the last decade alcohol-in-combination with two other stimulants did not feature (1.3%) compared to alcohol with one stimulant (6.4%). Combinations of drugs, with or without
alcohol, pose greater risks for mortality (Ghodse et al., 2010). 3. Single substances In 2011, there were 316 (35.6%) Drug Strategy deaths reported to np-SAD in which only one of the following substances was implicated. Of these single substance deaths, heroin/morphine accounted for 31.6%; methadone for 26.3%; other opiates/opioid analgesics – 17.4%; hypnotics/sedatives – 5.4%; cocaine – 5.1%; amphetamines – 4.7%; anti-depressants – 3.8%; ecstasy-type drugs – 1.9%; GHB/GBL – 1.3%; anti-psychotics – 1.3%; anti-epileptics – 0.9%; and cannabis – 0.3%. 4. Prescribed psychoactive drugs Of the 904 Drug Strategy cases reported to np-SAD for 2011, 61.5% (n = 556) were reported as being prescribed psychoactive drugs at the time of their death (Table 2.4). Of those being prescribed such drugs, the most common prescribed medications were anti-depressants (57.6%); hypnotics/sedatives (47.3%); other opiates/opioid analgesics (30.4%); methadone (23.9%); anti-psychotics (19.2%); anti-epileptics (15.1%); heroin/morphine (7.6%); anti-Parkinsons (1.4%) and amphetamines (0.7%). ‘Polypharmacy’, i.e. multiple prescriptions of psychoactive drugs, occurred in 69.1% (384/556) of cases. As with np-SAD cases, age appeared to be related in some way to whether cases were being prescribed psychoactive medication when prescribing history was known. For 15-24 year olds, 29.3% were prescribed psychoactive medication; 25-34 – 66.5%; 35-44 – 75.7%; 45-54 – 85.8%; 55-64 – 87.7%; and 65 & over – 86.5%. The following paragraphs further examine the Drug Strategy deaths and the involvement of prescribed medication. The most frequent combinations of prescribed psychoactive drugs in 2002 were also the most common in 2011. However, no single drug combination exceeded more than 26%. Prescribed hypnotics/sedatives in combination with anti-depressants accounted for 17.9% of cases in 2002 and 25.8% in 2011. Hypnotics/sedatives in combination with other opiates/opioid analgesics accounted for 14.3% of cases in 2002 compared to 13.5% in 2011.
np-SAD
International Centre for Drug Policy
41
Hypnotics/sedatives together with anti-psychotics accounted for 8.5% in 2002 and 11.5% of cases in 2011. Methadone and hypnotics/sedatives accounted for 4.6% of cases in 2002 and 8.5% in 2011. There was also a slight increase in the proportion of cases involving both methadone and anti-depressants from 1.9% in 2002 to 7.7% in 2011. In 2011, methadone alone and in combination with other drugs, was implicated in 313 cases.
Of these, 62.9% may have obtained methadone from illicit sources, compared to 37.1% who were known to be receiving prescribed methadone prior to their death (PR = 1.7, 95% CI = 1.4 – 2.0). Methadone alone was implicated in 83 cases. Of these, 59.0% may have obtained the drug from illicit sources, compared to 41.0% who were known to be receiving prescribed methadone (PR = 1.4, 95% CI = 1.1 – 2.0).
Table 2.4: Prescribed psychoactive medication, “drug misuse” deaths reported to np-SAD, England, 2011
Drug category
Number (%) of cases on prescribed
psychoactive medication by drug
Number (%) of these cases where same
prescribed drug was implicated in death
Total 556 (100.0)
Amphetamines 4 (0.7) 1 (25.0)
Anti-depressants 320 (57.6) 114 (35.6)
Anti-epileptics 84 (15.1) 9 (10.7)
Anti-Parkinson’s 8 (1.4) 0 (0.0)
Anti-psychotics 107 (19.2) 22 (20.6)
Heroin/morphine 42 (7.6) 33 (78.6)
Hypnotics/sedatives 263 (47.3) 108 (41.1)
Methadone 133 (23.9) 116 (87.2)
Other opiates/opioid analgesics 169 (30.4) 111 (65.7) Note: Column totals may sum to more than 100% since more than one substance may be prescribed to an individual and more than one substance may be implicated in a death.
Hypnotics/sedatives, alone and in combination with other drugs, were implicated in 238 cases. Of these, 54.6% may have obtained them illicitly, compared to the 45.4% who were known to be receiving a prescription for this drug (PR = 1.2, 95% CI = 1.0 – 1.4). Seventeen cases had hypnotics/sedatives alone implicated in their death, of whom 9 (52.9%) had received the drug on prescription, compared to 8 (47.1%) who may have obtained it illicitly (PR = 1.1, 95% CI = 0.6 – 2.2). Anti-depressants, alone and in combination with other drugs, were implicated in 170 cases. Of these, 67.1% were known to be receiving prescribed anti-depressants at the time of their death, compared to 32.9% who may have used drugs prescribed for others (PR = 2.0, 95% CI = 1.6 – 2.9). Anti-depressants alone were implicated in 12 cases. Of these, 10 (83.3%) were known to be receiving prescribed anti-depressants, compared to 2 (16.7%) who may have used
drugs prescribed for others (PR = 5.0, 95% CI = 1.4 – 18.2). Other opiates/opioid analgesics (e.g. dihydrocodeine, dextropropoxyphene) alone and in combination with other drugs, were implicated in 248 cases. Of these, 55.2% may have obtained the drug by other means, compared to the 44.8% who were known to be receiving prescribed opiate/opioid analgesics prior to their death (PR = 1.2, 95% CI = 1.0 – 1.5). Other opiate/opioid analgesics alone were implicated in 55 cases. Of these, the drugs were prescribed in 47.3% of cases, compared to 52.7% apparently being obtained by other means (PR = 1.1, 95% CI = 0.8 – 1.6). Heroin/morphine, alone and in combination with other drugs, was implicated in 339 deaths. The majority (90.3%) of these cases were not prescribed heroin/morphine, and as such may have obtained the drug illegally. Only 9.7% of the cases with heroin/morphine implicated were receiving the drug on
np-SAD
International Centre for Drug Policy 42
prescription (PR = 9.3, 95% CI = 6.7 – 12.8). Where heroin/morphine was implicated alone, out of 100 cases, only 11.0% of these were they known to be prescribed the drug,
meaning 89.0% may have obtained heroin/morphine illegally (PR = 8.1, 95% CI = 4.6 – 14.2).
Drug abuse/dependence No information was available for 211/904 cases with regards past or current history of drug abuse/dependence, but those with such a history (DAs) accounted for 71.3% of cases where history was known (n = 494/693). Individuals listed as non-drug abusers (NDAs) accounted for 28.7% (n = 199/693). The 211 cases where such history was not known were excluded from the following analyses. 1. Demography Those with a history of drug abuse/dependence (DA) were more likely than those without such a history (NDA) to be male (79.1% vs. 62.3%) (PR = 1.3, 95% CI = 1.1 – 1.4) and less than 45 years of age (72.9% compared to 48.2%) (PR = 1.5, 95% CI = 1.3 – 1.8). The median age at death for DAs was 39.1 years (interquartile range = 12.8), while that for NDAs was 45.6 years (interquartile range = 20.0) (Mann-Whitney U = 34,722.5 p < 0.001). Where ethnicity was known, there was a similar proportion of cases recorded as belonging to a White ethnic group for NDA and DA cases (96.4% vs. 96.3% White) (PR = 1.0, 95% CI = 1.0 – 1.0). DA cases were more likely to live alone (47.6% vs. 45.2%) (PR = 1.1, 95% CI = 0.9 – 1.3) or be of no fixed abode than NDAs (3.0% vs. 0.0%). The latter group however, were more likely to live with others, 50.8% vs. 36.8%, (PR = 1.4, 95% CI = 1.2 – 1.6). DA cases were more likely to be unemployed, 64.2% vs. 36.2%, (PR = 1.8, 95% CI = 1.5 – 2.2). NDA cases were more likely to be employed, 33.7% compared to 23.9%, (PR =
1.4, 95% CI = 1.1 – 1.8) or to be retired/receiving invalidity benefits: 18.6% compared to 1.8%, (PR = 10.2, 95% CI = 5.0 – 20.8), or carrying-out childcare, 4.5% vs. 1.8% (PR = 2.5, 95% CI = 1.0 – 6.2). 2. Location of death With respect to the location of death for DAs and NDAs, in both groups the majority died at home or in a defined residential address (74.1% of DAs and 72.9% of NDAs) (PR = 1.0, 95% CI = 0.9 – 1.1). Hospital deaths accounted for a slightly greater proportion of NDA (12.1%) than DA (9.1%) deaths (PR = 1.3 95% CI = 0.8 – 2.1). 3. Underlying cause(s) of death DAs were more likely than NDAs to die from accidental poisoning, (89.5% vs. 51.8%) (PR = 1.7, 95% CI = 1.5 – 2.0) – see Figure 2.3. NDAs, by contrast, were more likely than DAs to die of intentional self-poisoning (36.2% vs. 3.4%: PR = 10.5, 95% CI = 6.4 – 17.4), and poisoning of undetermined intent (12.1% vs. 6.3%: PR = 1.9, 95% CI = 1.2 – 3.2). 4. Manner of death A similar pattern is exhibited with regard to manner of death. DAs were more likely than NDAs to die as the result of an accident (88.3% vs. 51.8%: PR = 1.7, 95% CI = 1.5 – 2.0). Conversely, NDAs were more likely than DAs to suffer deaths attributed to suicide (36.2% vs. 3.4%: PR = 10.5, 95% CI = 6.4 – 17.4), or a death where the manner was undetermined (11.6% vs. 6.9%: PR = 1.7, 95% CI = 1.0 – 2.8).
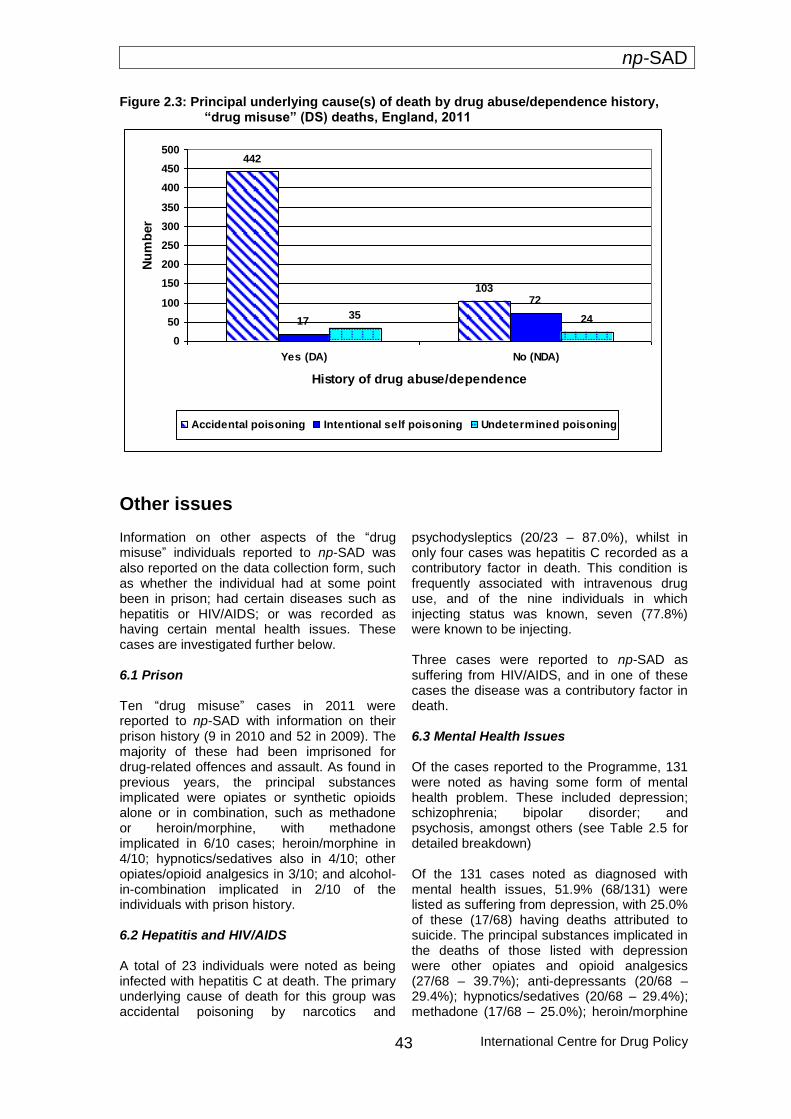
np-SAD
International Centre for Drug Policy
43
Figure 2.3: Principal underlying cause(s) of death by drug abuse/dependence history, “drug misuse” (DS) deaths, England, 2011
442
103
17
72
35 24
0
50
100
150
200
250
300
350
400
450
500
Yes (DA) No (NDA)
History of drug abuse/dependence
Nu
mb
er
Accidental poisoning Intentional self poisoning Undetermined poisoning
Other issues Information on other aspects of the “drug misuse” individuals reported to np-SAD was also reported on the data collection form, such as whether the individual had at some point been in prison; had certain diseases such as hepatitis or HIV/AIDS; or was recorded as having certain mental health issues. These cases are investigated further below. 6.1 Prison Ten “drug misuse” cases in 2011 were reported to np-SAD with information on their prison history (9 in 2010 and 52 in 2009). The majority of these had been imprisoned for drug-related offences and assault. As found in previous years, the principal substances implicated were opiates or synthetic opioids alone or in combination, such as methadone or heroin/morphine, with methadone implicated in 6/10 cases; heroin/morphine in 4/10; hypnotics/sedatives also in 4/10; other opiates/opioid analgesics in 3/10; and alcohol-in-combination implicated in 2/10 of the individuals with prison history. 6.2 Hepatitis and HIV/AIDS A total of 23 individuals were noted as being infected with hepatitis C at death. The primary underlying cause of death for this group was accidental poisoning by narcotics and
psychodysleptics (20/23 – 87.0%), whilst in only four cases was hepatitis C recorded as a contributory factor in death. This condition is frequently associated with intravenous drug use, and of the nine individuals in which injecting status was known, seven (77.8%) were known to be injecting. Three cases were reported to np-SAD as suffering from HIV/AIDS, and in one of these cases the disease was a contributory factor in death. 6.3 Mental Health Issues Of the cases reported to the Programme, 131 were noted as having some form of mental health problem. These included depression; schizophrenia; bipolar disorder; and psychosis, amongst others (see Table 2.5 for detailed breakdown) Of the 131 cases noted as diagnosed with mental health issues, 51.9% (68/131) were listed as suffering from depression, with 25.0% of these (17/68) having deaths attributed to suicide. The principal substances implicated in the deaths of those listed with depression were other opiates and opioid analgesics (27/68 – 39.7%); anti-depressants (20/68 – 29.4%); hypnotics/sedatives (20/68 – 29.4%); methadone (17/68 – 25.0%); heroin/morphine

np-SAD
International Centre for Drug Policy 44
(16/68 – 23.5%); and alcohol-in-combination (14/68 – 20.6%). Thirteen individuals were reported as being schizophrenic (13/131 – 9.9%), with the principal implicated substance being heroin/morphine (5/13 – 38.5%), with anti-psychotics, anti-depressants, methadone and hypnotics/sedatives each being implicated
equally in 30.8% (4/13) of cases. Amongst those listed as diagnosed with schizophrenia, 76.9% (10/13) died as the result of an accident, whilst 23.1% (3/13) committed suicide.
Table 2.5: Psychoactive substances implicated alone and in combination in percentage of cases diagnosed with specific mental health problems
Mental health problem
Psychoactive substance implicated alone and in combination
Depression n = 68 (%)
Schizophrenia
n = 13 (%)
Bipolar disorder n = 7 (%)
Anxiety
n = 8 (%)
Psychosis n = 6 (%)
Behavioural and
personality disorders n = 8 (%)
Mental issues n = 26
(%)
Alcohol-in-combination
20.6 15.4 14.3 25.0 16.7 25.0 26.9
Amphetamines 1.5 0.0 0.0 0.0 16.7 0.0 0.0
Anti-depressants 29.4 30.8 14.3 25.0 33.4 25.0 34.6
Anti-epileptics 1.5 0.0 14.3 0.0 16.7 0.0 7.6
Anti-Parkinson’s 0.0 0.0 0.0 0.0 0.0 0.0 0.0
Anti-psychotics 4.4 15.4 14.3 0.0 16.7 12.5 19.2
Cannabis 0.0 0.0 0.0 0.0 0.0 0.0 3.8
Cocaine 11.7 15.4 0.0 0.0 33.3 0.0 7.7
Ecstasy-type drug 1.5 0.0 0.0 0.0 0.0 0.0 0.0
GHB/GBL 0.0 0.0 0.0 0.0 16.7 0.0 0.0
Heroin/morphine 23.6 38.5 28.6 12.5 16.7 0.0 26.9
Hypnotics/sedatives 29.4 30.8 28.6 12.5 33.3 12.5 38.4
Methadone 25.0 30.8 28.6 12.5 16.7 37.5 26.9
Other opiates/ opioid analgesics
39.7 23.1 42.9 50.0 16.7 37.5 34.6
Note: Column totals may sum to more than 100% since more than one substance may be implicated in a death. The case total sums to greater than the total number of cases of 131 since an individual may have more than one disorder. Cells highlighted in indicate the drug most frequently implicated for each mental health problem

np-SAD
International Centre for Drug Policy
45
Changes between 2010 and 2011 The following section compares deaths in 2011 with those that occurred in 2010. Drug Strategy (DS) deaths in 2011 are reported as 904, whereas in 2010, 968 cases were reported. This is a decrease in reported DS deaths of 6.6% in 2011. Figures for 2011 (and 2010, to a lesser extent) can be expected to increase as further inquests on drug-related deaths are completed and reported to the Programme. 1. Demography There were changes between 2010 and 2011 in terms of the demographic profile of cases. Whilst ethnicity, gender, living arrangements and employment status remained relatively stable, there were marked changes in other aspects. The median age at death rose from 38.5 to 40.9 years, with the number of deaths amongst those aged 35 years and over rising from 62.0% to 70.8%. The number of individuals listed as having a history of drug abuse/addiction when such information was given fell by 5.0%, from 76.3% to 71.3%, whilst a drop of 4.3% was also observed in the number of deaths occurring at the deceased’s home or other private residential address (from 79.0% to 74.7%), and also in hospital deaths (from 14.0% to 9.4%). 2. Underlying cause(s) of death The number of deaths due to accidental poisoning rose from 75.1% in 2010 to 78.4% in 2011 whilst deaths attributed to intentional self-poisoning increased by 2.5%, from 10.1% to 12.6%. Meanwhile, there was a reduction in poisonings of undetermined intent, from 10.3% to 8.5%, and deaths from other causes dropped from 4.5% to 0.4%. 3. Manner of death There was a slight decrease in accidental deaths between 2010 and 2011 from 78.2% to 77.5% and an increase in suicides from 10.5% to 12.7%. Cases in which the manner of death was undetermined showed a small decrease, from 10.0% in 2010 to 8.6% in 2011.
4. Psychoactive substances implicated in death
In 2011 there were 888/904 Drug Strategy deaths that involved psychoactive substances; 16 cases were therefore excluded from the following analyses due to their not involving psychoactive substances. In 2010, 955 of the 968 DS cases reported involved psychoactive drugs.
4.1 Psychoactive substances, both alone and in combination There was a substantial reduction in the proportion of deaths attributed to heroin/morphine in 2011 compared to 2010 (46.2% down to 38.2% of deaths). Despite this, heroin/morphine remained the most frequently implicated substance in deaths of DS cases. A reduction was also seen in the proportion of cases in which alcohol was implicated in combination with other psychoactive substances (from 32.5% to 28.0%), and also in deaths involving GHB/GBL (1.4% to 1.1%). Significant increases were seen in the proportion of cases in which anti-depressants, ecstasy-type drugs, hypnotics/sedatives and methadone were implicated. Non-significant increases were found in the number of cases in which the following drugs were implicated: amphetamines; anti-epileptics; anti-psychotics; cannabis; cocaine; and other opiates/opioid analgesics (Table 2.6). 4.2 Single substance A significant increase in deaths in which other opiates/opioid analgesics were implicated alone was seen, shown by a 1.8% rise from 2010 to 2011 (4.4% to 6.2%), whilst deaths involving heroin/morphine as the sole drug dropped significantly by 2.5% (from 13.8% to 11.3%). Other non-significant rises were seen in the number of deaths involving the following drugs when implicated alone: amphetamines; anti-depressants; anti-epileptics; ecstasy-type drugs; hypnotics/sedatives; and methadone. Non-significant decreases were seen in the number of deaths in which GHB/GBL and Cocaine were implicated alone (Table 2.7).
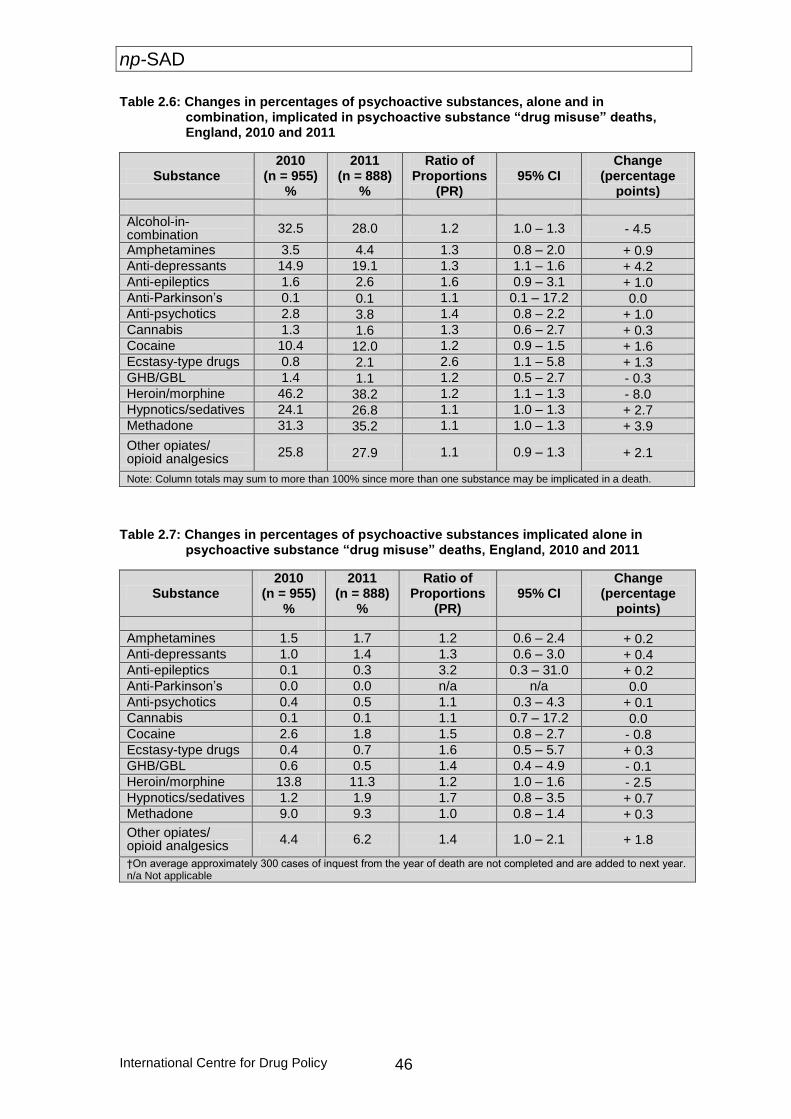
np-SAD
International Centre for Drug Policy 46
Table 2.6: Changes in percentages of psychoactive substances, alone and in combination, implicated in psychoactive substance “drug misuse” deaths, England, 2010 and 2011
Substance 2010
(n = 955) %
2011 (n = 888)
%
Ratio of Proportions
(PR) 95% CI
Change (percentage
points)
Alcohol-in-combination
32.5 28.0 1.2 1.0 – 1.3 - 4.5
Amphetamines 3.5 4.4 1.3 0.8 – 2.0 + 0.9 Anti-depressants 14.9 19.1 1.3 1.1 – 1.6 + 4.2 Anti-epileptics 1.6 2.6 1.6 0.9 – 3.1 + 1.0 Anti-Parkinson’s 0.1 0.1 1.1 0.1 – 17.2 0.0 Anti-psychotics 2.8 3.8 1.4 0.8 – 2.2 + 1.0 Cannabis 1.3 1.6 1.3 0.6 – 2.7 + 0.3 Cocaine 10.4 12.0 1.2 0.9 – 1.5 + 1.6 Ecstasy-type drugs 0.8 2.1 2.6 1.1 – 5.8 + 1.3 GHB/GBL 1.4 1.1 1.2 0.5 – 2.7 - 0.3 Heroin/morphine 46.2 38.2 1.2 1.1 – 1.3 - 8.0 Hypnotics/sedatives 24.1 26.8 1.1 1.0 – 1.3 + 2.7 Methadone 31.3 35.2 1.1 1.0 – 1.3 + 3.9
Other opiates/ opioid analgesics
25.8 27.9 1.1 0.9 – 1.3 + 2.1
Note: Column totals may sum to more than 100% since more than one substance may be implicated in a death.
Table 2.7: Changes in percentages of psychoactive substances implicated alone in psychoactive substance “drug misuse” deaths, England, 2010 and 2011
Substance 2010
(n = 955) %
2011 (n = 888)
%
Ratio of Proportions
(PR) 95% CI
Change (percentage
points)
Amphetamines 1.5 1.7 1.2 0.6 – 2.4 + 0.2 Anti-depressants 1.0 1.4 1.3 0.6 – 3.0 + 0.4 Anti-epileptics 0.1 0.3 3.2 0.3 – 31.0 + 0.2 Anti-Parkinson’s 0.0 0.0 n/a n/a 0.0 Anti-psychotics 0.4 0.5 1.1 0.3 – 4.3 + 0.1 Cannabis 0.1 0.1 1.1 0.7 – 17.2 0.0 Cocaine 2.6 1.8 1.5 0.8 – 2.7 - 0.8 Ecstasy-type drugs 0.4 0.7 1.6 0.5 – 5.7 + 0.3 GHB/GBL 0.6 0.5 1.4 0.4 – 4.9 - 0.1 Heroin/morphine 13.8 11.3 1.2 1.0 – 1.6 - 2.5 Hypnotics/sedatives 1.2 1.9 1.7 0.8 – 3.5 + 0.7 Methadone 9.0 9.3 1.0 0.8 – 1.4 + 0.3
Other opiates/ opioid analgesics
4.4 6.2 1.4 1.0 – 2.1 + 1.8
†On average approximately 300 cases of inquest from the year of death are not completed and are added to next year. n/a Not applicable
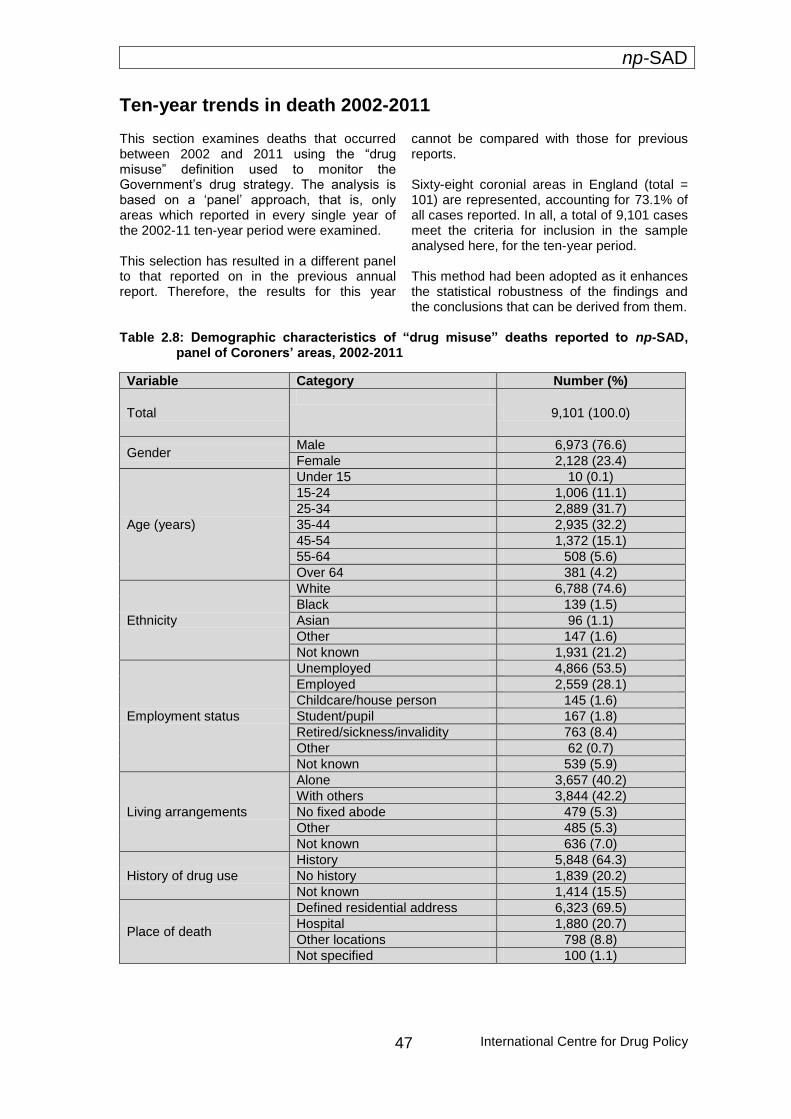
np-SAD
International Centre for Drug Policy
47
Ten-year trends in death 2002-2011 This section examines deaths that occurred between 2002 and 2011 using the “drug misuse” definition used to monitor the Government’s drug strategy. The analysis is based on a ‘panel’ approach, that is, only areas which reported in every single year of the 2002-11 ten-year period were examined. This selection has resulted in a different panel to that reported on in the previous annual report. Therefore, the results for this year
cannot be compared with those for previous reports. Sixty-eight coronial areas in England (total = 101) are represented, accounting for 73.1% of all cases reported. In all, a total of 9,101 cases meet the criteria for inclusion in the sample analysed here, for the ten-year period. This method had been adopted as it enhances the statistical robustness of the findings and the conclusions that can be derived from them.
Table 2.8: Demographic characteristics of “drug misuse” deaths reported to np-SAD,
panel of Coroners’ areas, 2002-2011
Variable Category Number (%)
Total
9,101 (100.0)
Gender Male 6,973 (76.6)
Female 2,128 (23.4)
Age (years)
Under 15 10 (0.1)
15-24 1,006 (11.1)
25-34 2,889 (31.7)
35-44 2,935 (32.2)
45-54 1,372 (15.1)
55-64 508 (5.6)
Over 64 381 (4.2)
Ethnicity
White 6,788 (74.6)
Black 139 (1.5)
Asian 96 (1.1)
Other 147 (1.6)
Not known 1,931 (21.2)
Employment status
Unemployed 4,866 (53.5)
Employed 2,559 (28.1)
Childcare/house person 145 (1.6)
Student/pupil 167 (1.8)
Retired/sickness/invalidity 763 (8.4)
Other 62 (0.7)
Not known 539 (5.9)
Living arrangements
Alone 3,657 (40.2)
With others 3,844 (42.2)
No fixed abode 479 (5.3)
Other 485 (5.3)
Not known 636 (7.0)
History of drug use
History 5,848 (64.3)
No history 1,839 (20.2)
Not known 1,414 (15.5)
Place of death
Defined residential address 6,323 (69.5)
Hospital 1,880 (20.7)
Other locations 798 (8.8)
Not specified 100 (1.1)
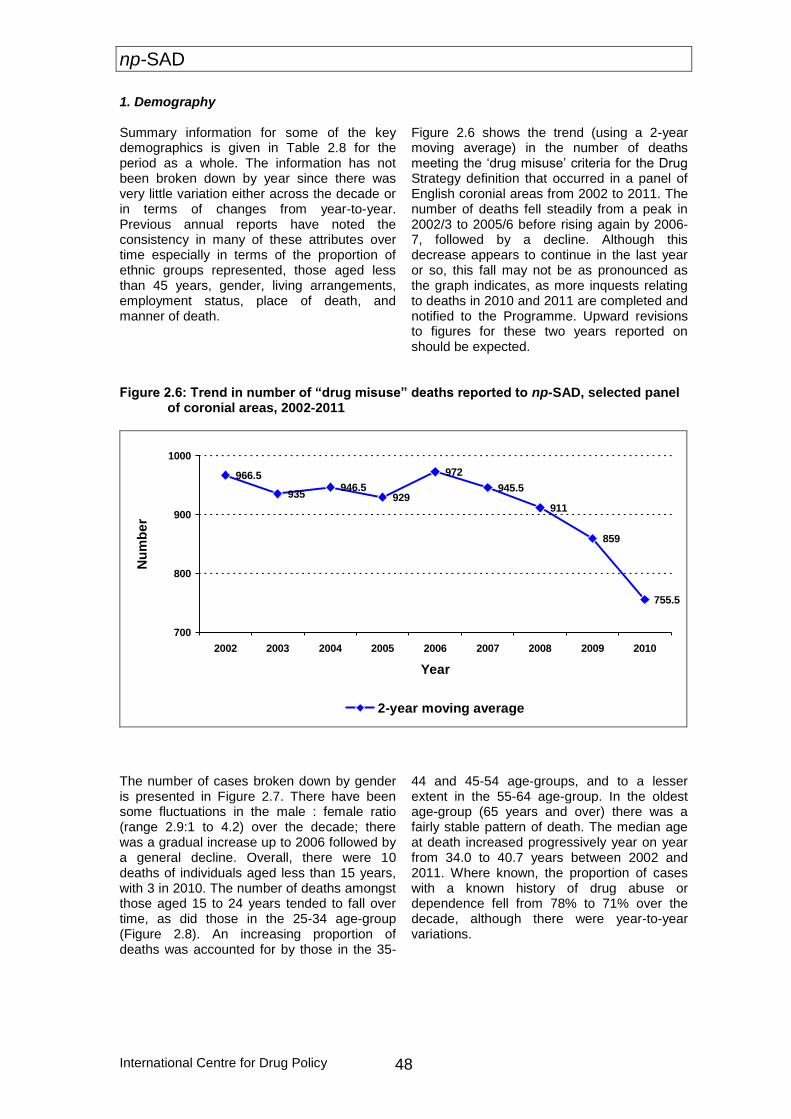
np-SAD
International Centre for Drug Policy 48
1. Demography Summary information for some of the key demographics is given in Table 2.8 for the period as a whole. The information has not been broken down by year since there was very little variation either across the decade or in terms of changes from year-to-year. Previous annual reports have noted the consistency in many of these attributes over time especially in terms of the proportion of ethnic groups represented, those aged less than 45 years, gender, living arrangements, employment status, place of death, and manner of death.
Figure 2.6 shows the trend (using a 2-year moving average) in the number of deaths meeting the ‘drug misuse’ criteria for the Drug Strategy definition that occurred in a panel of English coronial areas from 2002 to 2011. The number of deaths fell steadily from a peak in 2002/3 to 2005/6 before rising again by 2006-7, followed by a decline. Although this decrease appears to continue in the last year or so, this fall may not be as pronounced as the graph indicates, as more inquests relating to deaths in 2010 and 2011 are completed and notified to the Programme. Upward revisions to figures for these two years reported on should be expected.
Figure 2.6: Trend in number of “drug misuse” deaths reported to np-SAD, selected panel
of coronial areas, 2002-2011
966.5
935946.5
929
972
945.5
911
859
755.5
700
800
900
1000
2002 2003 2004 2005 2006 2007 2008 2009 2010
Year
Nu
mb
er
2-year moving average
The number of cases broken down by gender is presented in Figure 2.7. There have been some fluctuations in the male : female ratio (range 2.9:1 to 4.2) over the decade; there was a gradual increase up to 2006 followed by a general decline. Overall, there were 10 deaths of individuals aged less than 15 years, with 3 in 2010. The number of deaths amongst those aged 15 to 24 years tended to fall over time, as did those in the 25-34 age-group (Figure 2.8). An increasing proportion of deaths was accounted for by those in the 35-
44 and 45-54 age-groups, and to a lesser extent in the 55-64 age-group. In the oldest age-group (65 years and over) there was a fairly stable pattern of death. The median age at death increased progressively year on year from 34.0 to 40.7 years between 2002 and 2011. Where known, the proportion of cases with a known history of drug abuse or dependence fell from 78% to 71% over the decade, although there were year-to-year variations.
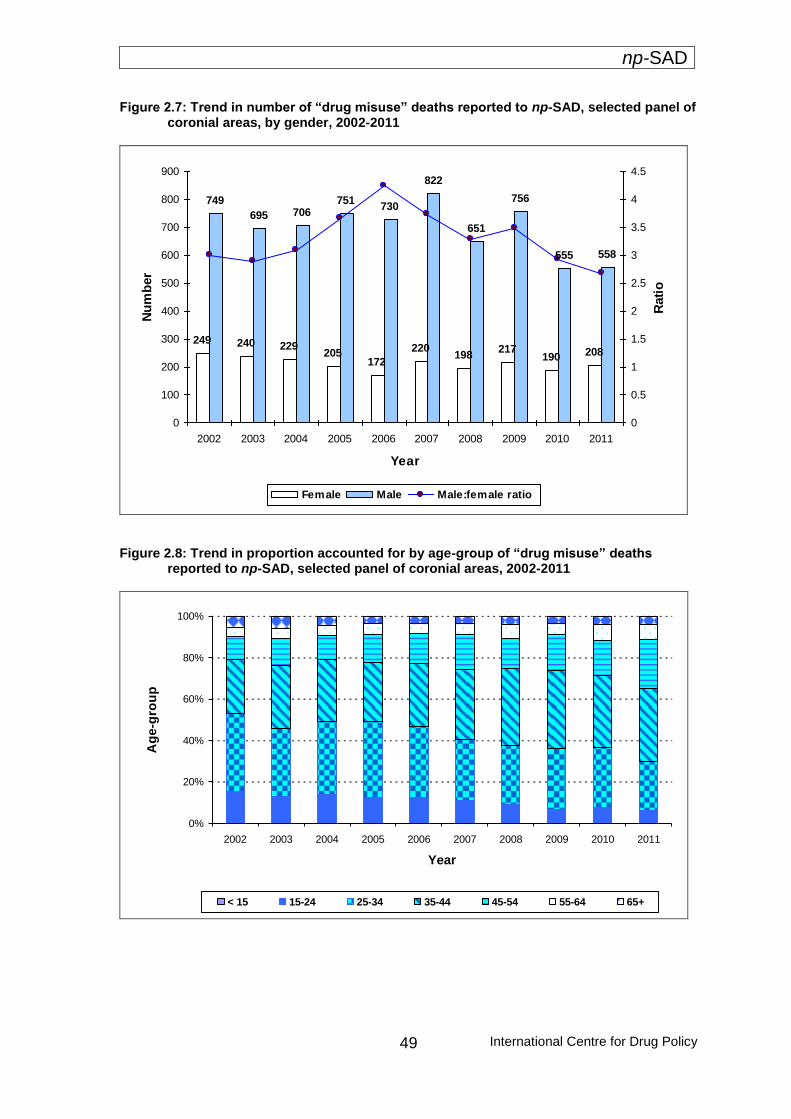
np-SAD
International Centre for Drug Policy
49
Figure 2.7: Trend in number of “drug misuse” deaths reported to np-SAD, selected panel of coronial areas, by gender, 2002-2011
249 240 229205
172
220198
217190 208
749
695 706751
730
822
651
756
555 558
0
100
200
300
400
500
600
700
800
900
2002 2003 2004 2005 2006 2007 2008 2009 2010 2011
Year
Nu
mb
er
0
0.5
1
1.5
2
2.5
3
3.5
4
4.5
Rati
o
Female Male Male:female ratio
Figure 2.8: Trend in proportion accounted for by age-group of “drug misuse” deaths
reported to np-SAD, selected panel of coronial areas, 2002-2011
0%
20%
40%
60%
80%
100%
2002 2003 2004 2005 2006 2007 2008 2009 2010 2011
Year
Ag
e-g
rou
p
< 15 15-24 25-34 35-44 45-54 55-64 65+

np-SAD
International Centre for Drug Policy 50
2. Substances implicated in death Figure 2.9 shows the substances most commonly implicated, whether alone or in combination, in death. The figure indicates the proportion of selected substances implicated in death rather than the proportion of cases in which the substances is involved. Overall, heroin/morphine (27.9%) accounted for the largest proportion of these selected substances, followed by alcohol-in-
combination (18.0%); other opiates/opioid analgesics (13.2%); and hypnotics/sedatives (12.1%). The other most frequently implicated drugs were methadone (11.3%); cocaine (7.7%); anti-depressants (7.5%); and amphetamines (2.3%). These proportions did not change dramatically over time, although there appears to have been a recent decline in the contribution made by amphetamine-type substances, and an increasing presence of methadone.
Figure 2.9: Trend in substances implicated in “drug misuse” deaths reported to np-SAD,
selected panel of coronial areas in England, 2002-2011
0%
20%
40%
60%
80%
100%
2002 2003 2004 2005 2006 2007 2008 2009 2010 2011
Year
Heroin/morphine Alcohol in combination Other opiates Hypnotics/sedatives
Cocaine Methadone Anti-depressants Amphetamine-type
np-SAD
International Centre for Drug Policy
51
Breakdowns for English regions This section provides information by different geographical units for “drug misuse” deaths reported to np-SAD. Tables F and H provide rates by Drug and Alcohol Action Team (DAAT) and Primary Care Trust (PCT) areas respectively per 100,000 population; and G gives detailed breakdowns by key aspects (gender, age, ethnicity, drug implicated) by DAAT area. Tables I to L provide a profile of cases in the English regions which are the same as the Clusters used since autumn 2011 for Strategic Health Authorities. The annual rate of “drug misuse” deaths per 100,000 population ranged from 0.91 in the West Midlands to 4.31 in the North West. [The rates in most English regions are affected by partial geographical coverage, and thus these rates should be regarded as the minimum]. The proportion of males ranged from 68.0% in the South East Coast to 85.4% in the West Midlands. The North East, South Central and Yorkshire and Humber showed proportionately more deaths in the 15-24 year age-group than other regions. Where ethnicity is known, most deaths amongst minority communities appear to occur in the following regions: London;
Yorkshire and Humber; and the South East Coast. However, numbers are low. The proportion of cases with a known history of drug use or addiction ranges from 44.9% in South Central England to 64.6% in the East Midlands. In each region, the overall profile of drugs commonly implicated in death is consistent with the national picture. However, there appear to be some drugs with a higher presence in some regions compared to others. For example, in the East of England heroin/morphine was implicated in 43.6% of cases, whilst in the North East the same drugs accounted for just 26.0% of cases. London exhibited the highest proportion of cocaine-related deaths (30.5%), which is in stark contrast to the South West in which cocaine was implicated in 3.7% of relevant deaths. Meanwhile, hypnotics/sedatives were implicated in 48.0% of deaths in the North East compared to just 20.3% in London. Deaths attributed to suicide accounted for 20.4% of deaths in South Central England, compared to 6.8% in London. Further information on such aspects for each English region can be found in Tables I to L.
Commentary The demographic profile of “drug misuse” deaths in England remains generally consistent with previous reports: a higher proportion (73.5%) of males to females, White, with the majority under 45 years of age. “Drug misuse” deaths reported to the Programme amongst those aged 15-24 appear to have dropped over the past ten years by nearly 70%; the median age increased over the period by nearly seven years. Accidental poisoning, as noted in previous years, still remains the most frequent underlying cause of death across all age-groups. However, in comparison with females and males of younger age-groups, older females show a greater proportion of deaths attributed to intentional self-poisoning. As was found in np-SAD cases, heroin/morphine followed by methadone were the most frequently implicated drug in deaths of males, whilst in females it was anti-depressants, closely followed by other opiates/ opioid analgesics.
“Drug misuse” deaths reported to the Programme for 2011 suggest that the involvement in death of amphetamines, anti-depressants, anti-epileptics, cocaine, ecstasy-type drugs, hypnotics/sedatives, methadone and other opiates/opioid analgesics have increased, whilst deaths in which heroin/morphine and alcohol-in-combination with other drugs have decreased. The patterns seen here are similar to those found in np-SAD cases in respect of controlled drugs. The decline in monovalent deaths noted in last year’s report appears to have plateaued somewhat: in 2011 they accounted for 36% of cases – the same rate as in 2010, whilst in 2009 they represented 37%. Heroin/morphine combined with alcohol remains the most frequently implicated polysubstance combination over the past ten years, followed by heroin/morphine combined with hypnotics/sedatives, and then hypnotics/sedatives with alcohol.
np-SAD
International Centre for Drug Policy 52
The most commonly prescribed medications implicated in death were methadone; anti-depressants; other opiates/opioid analgesics; followed by hypnotics/sedatives. From information on the prescribed drugs of cases, it appears that upwards of 54% of hypnotics/sedatives, other opiates/opioid analgesics, methadone and heroin/morphine-related deaths are more likely to involve drugs obtained by illicit rather than legal means. It has to be acknowledged that there are some distinct differences between the definition of drug-related death used by np-SAD and that of “drug misuse” employed by Government departments to monitor trends in the effectiveness of drug strategies.
Whilst the main source of information for the Office for National Statistics is the medical certificate of death, supplemented by part V of the Coroner’s Inquisition form, the np-SAD receives detailed information from inquests with reports from various sources (including toxicology) to the Coroner to determine the cause of death and thus the verdict. Both sets of data are of value and complementary. The detailed data from Coroners allows for the Programme to contribute to early warning monitoring systems, providing information on the epidemiology of Novel Psychoactive Substances (including “legal highs”), as well as on prescribing history, risk factors, etc. Both sources of data are needed to obtain a fuller understanding of the nature of drug-related mortality in England, and the UK as a whole.
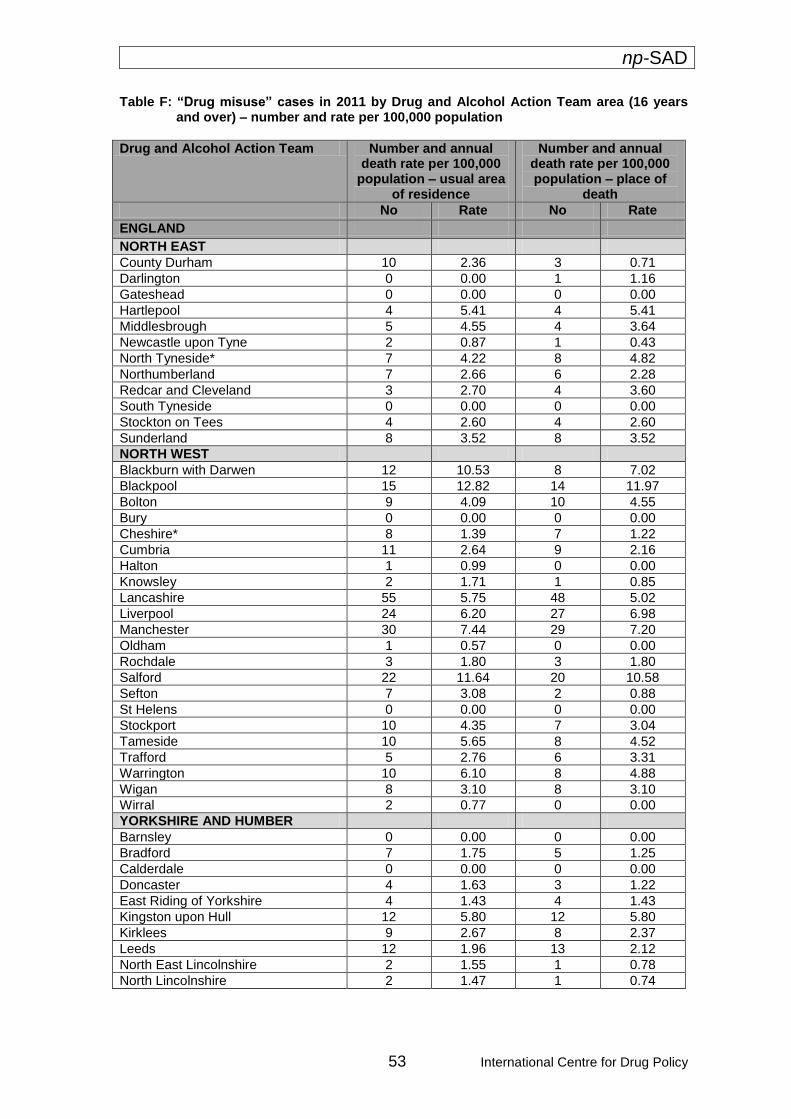
np-SAD
53 International Centre for Drug Policy
Table F: “Drug misuse” cases in 2011 by Drug and Alcohol Action Team area (16 years and over) – number and rate per 100,000 population
Drug and Alcohol Action Team Number and annual death rate per 100,000
population – usual area of residence
Number and annual death rate per 100,000 population – place of
death
No Rate No Rate
ENGLAND
NORTH EAST
County Durham 10 2.36 3 0.71
Darlington 0 0.00 1 1.16
Gateshead 0 0.00 0 0.00
Hartlepool 4 5.41 4 5.41
Middlesbrough 5 4.55 4 3.64
Newcastle upon Tyne 2 0.87 1 0.43
North Tyneside* 7 4.22 8 4.82
Northumberland 7 2.66 6 2.28
Redcar and Cleveland 3 2.70 4 3.60
South Tyneside 0 0.00 0 0.00
Stockton on Tees 4 2.60 4 2.60
Sunderland 8 3.52 8 3.52
NORTH WEST
Blackburn with Darwen 12 10.53 8 7.02
Blackpool 15 12.82 14 11.97
Bolton 9 4.09 10 4.55
Bury 0 0.00 0 0.00
Cheshire* 8 1.39 7 1.22
Cumbria 11 2.64 9 2.16
Halton 1 0.99 0 0.00
Knowsley 2 1.71 1 0.85
Lancashire 55 5.75 48 5.02
Liverpool 24 6.20 27 6.98
Manchester 30 7.44 29 7.20
Oldham 1 0.57 0 0.00
Rochdale 3 1.80 3 1.80
Salford 22 11.64 20 10.58
Sefton 7 3.08 2 0.88
St Helens 0 0.00 0 0.00
Stockport 10 4.35 7 3.04
Tameside 10 5.65 8 4.52
Trafford 5 2.76 6 3.31
Warrington 10 6.10 8 4.88
Wigan 8 3.10 8 3.10
Wirral 2 0.77 0 0.00
YORKSHIRE AND HUMBER
Barnsley 0 0.00 0 0.00
Bradford 7 1.75 5 1.25
Calderdale 0 0.00 0 0.00
Doncaster 4 1.63 3 1.22
East Riding of Yorkshire 4 1.43 4 1.43
Kingston upon Hull 12 5.80 12 5.80
Kirklees 9 2.67 8 2.37
Leeds 12 1.96 13 2.12
North East Lincolnshire 2 1.55 1 0.78
North Lincolnshire 2 1.47 1 0.74

np-SAD
International Centre for Drug Policy 54
Drug and Alcohol Action Team Number and annual death rate per 100,000
population – usual area of residence
Number and annual death rate per 100,000 population – place of
death
No Rate No Rate
North Yorkshire 4 0.80 3 0.60
Rotherham 1 0.48 1 0.48
Sheffield 6 1.34 6 1.34
Wakefield 6 2.26 6 2.26
York 2 1.21 1 0.61
EAST MIDLANDS
Derby 3 1.52 4 2.02
Derbyshire 20 3.15 16 2.52
Leicester 12 4.62 6 2.31
Leicestershire* 14 2.63 5 0.94
Lincolnshire 10 1.69 8 1.35
Northamptonshire 19 3.42 18 3.24
Nottingham 5 2.03 4 1.63
Nottinghamshire* 9 1.40 8 1.24
Rutland* 1 3.18 1 3.18
WEST MIDLANDS
Birmingham* 0 0.00 1 0.12
Coventry 4 1.58 2 0.79
Dudley 3 1.18 3 1.18 Herefordshire 1 0.66 0 0.00
Sandwell 1 0.41 1 0.41
Shropshire 5 1.97 7 2.76
Solihull* 0 0.00 0 0.00
Staffordshire 11 1.57 9 1.29
Stoke-on-Trent 6 3.00 7 3.50
Telford and Wrekin 3 2.26 1 0.75
Walsall* 1 0.47 1 0.47
Warwickshire* 0 0.00 0 0.00
Wolverhampton 2 1.00 1 0.50
Worcestershire 4 0.86 4 0.86
EAST
Bedfordshire 9 2.71 8 2.41
Cambridgeshire 4 0.79 1 0.20
Essex 0 0.00 0 0.00
Hertfordshire 15 1.67 18 2.01
Luton 3 1.91 4 2.55
Norfolk 9 1.26 7 0.98
Peterborough 7 4.83 7 4.83
Southend-on-Sea 0 0.00 0 0.00
Suffolk 8 1.34 5 0.84
Thurrock 0 0.00 0 0.00
LONDON
Inner London
Camden 1 0.54 0 0.00
City of London 0 0.00 0 0.00
Hackney 7 3.57 4 2.04
Hammersmith and Fulham 7 4.58 12 7.84
Haringey 1 0.49 0 0.00
Islington 6 3.47 1 0.58
Kensington and Chelsea 1 0.75 2 1.49
Lambeth 3 1.20 3 1.20
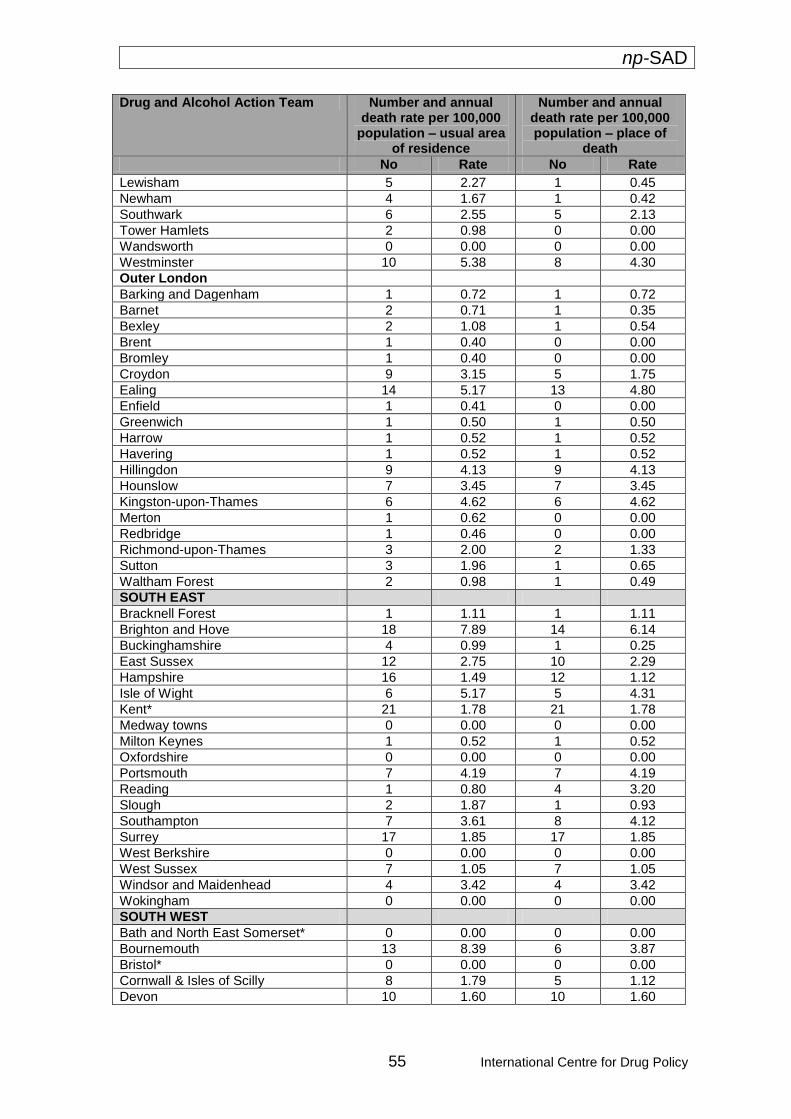
np-SAD
55 International Centre for Drug Policy
Drug and Alcohol Action Team Number and annual death rate per 100,000
population – usual area of residence
Number and annual death rate per 100,000 population – place of
death
No Rate No Rate
Lewisham 5 2.27 1 0.45
Newham 4 1.67 1 0.42
Southwark 6 2.55 5 2.13
Tower Hamlets 2 0.98 0 0.00
Wandsworth 0 0.00 0 0.00
Westminster 10 5.38 8 4.30
Outer London
Barking and Dagenham 1 0.72 1 0.72
Barnet 2 0.71 1 0.35
Bexley 2 1.08 1 0.54
Brent 1 0.40 0 0.00
Bromley 1 0.40 0 0.00
Croydon 9 3.15 5 1.75
Ealing 14 5.17 13 4.80
Enfield 1 0.41 0 0.00
Greenwich 1 0.50 1 0.50
Harrow 1 0.52 1 0.52
Havering 1 0.52 1 0.52
Hillingdon 9 4.13 9 4.13
Hounslow 7 3.45 7 3.45
Kingston-upon-Thames 6 4.62 6 4.62
Merton 1 0.62 0 0.00
Redbridge 1 0.46 0 0.00
Richmond-upon-Thames 3 2.00 2 1.33
Sutton 3 1.96 1 0.65
Waltham Forest 2 0.98 1 0.49
SOUTH EAST
Bracknell Forest 1 1.11 1 1.11
Brighton and Hove 18 7.89 14 6.14
Buckinghamshire 4 0.99 1 0.25
East Sussex 12 2.75 10 2.29
Hampshire 16 1.49 12 1.12
Isle of Wight 6 5.17 5 4.31
Kent* 21 1.78 21 1.78
Medway towns 0 0.00 0 0.00
Milton Keynes 1 0.52 1 0.52
Oxfordshire 0 0.00 0 0.00
Portsmouth 7 4.19 7 4.19
Reading 1 0.80 4 3.20
Slough 2 1.87 1 0.93
Southampton 7 3.61 8 4.12
Surrey 17 1.85 17 1.85
West Berkshire 0 0.00 0 0.00
West Sussex 7 1.05 7 1.05
Windsor and Maidenhead 4 3.42 4 3.42
Wokingham 0 0.00 0 0.00
SOUTH WEST
Bath and North East Somerset* 0 0.00 0 0.00
Bournemouth 13 8.39 6 3.87
Bristol* 0 0.00 0 0.00
Cornwall & Isles of Scilly 8 1.79 5 1.12
Devon 10 1.60 10 1.60

np-SAD
International Centre for Drug Policy 56
Drug and Alcohol Action Team National and annual death rate per 100,000
population – usual area of residence
National and annual death rate per 100,000 population – place of
death
No Rate No Rate
Dorset 7 2.02 3 0.86
Gloucestershire 7 1.43 7 1.43
North Somerset* 1 0.60 0 0.00
Plymouth 1 0.47 1 0.47
Poole 7 5.74 6 4.92
Somerset 6 8.00 7 1.60
South Gloucestershire* 0 0.00 0 0.00
Swindon 13 7.74 12 7.14
Torbay 2 1.82 2 1.82
Wiltshire 6 1.57 6 1.57
Note: In addition there were a number of cases that could not be allocated to specific DAAT areas because they were of no fixed abode and/or the jurisdiction in which the inquest was held covers more than one DAAT. Some cases were usually resident outside the UK. Some DAATs are covered by Coroners’ jurisdictions that did not submit information or only partial information) to the np-SAD; they are marked thus - *.
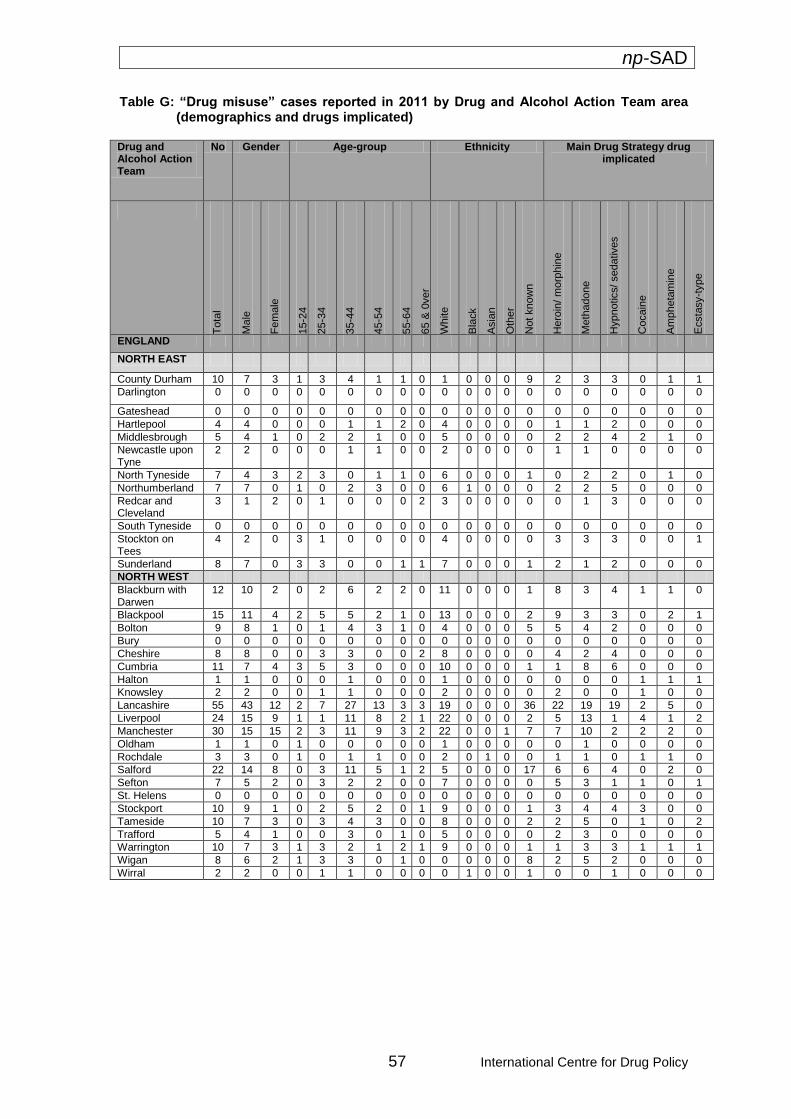
np-SAD
57 International Centre for Drug Policy
Table G: “Drug misuse” cases reported in 2011 by Drug and Alcohol Action Team area (demographics and drugs implicated)
Drug and Alcohol Action Team
No Gender Age-group Ethnicity Main Drug Strategy drug implicated
T
ota
l
Ma
le
Fe
male
15-2
4
25-3
4
35-4
4
45-5
4
55-6
4
65 &
0ver
White
Bla
ck
Asia
n
Oth
er
Not
know
n
Hero
in/
mo
rphin
e
Me
thadone
Hypnotics/ sedatives
Cocain
e
Am
pheta
min
e
Ecsta
sy-t
ype
ENGLAND
NORTH EAST
County Durham 10 7 3 1 3 4 1 1 0 1 0 0 0 9 2 3 3 0 1 1
Darlington 0 0 0 0 0 0 0 0 0 0 0 0 0 0 0 0 0 0 0 0
Gateshead 0 0 0 0 0 0 0 0 0 0 0 0 0 0 0 0 0 0 0 0
Hartlepool 4 4 0 0 0 1 1 2 0 4 0 0 0 0 1 1 2 0 0 0
Middlesbrough 5 4 1 0 2 2 1 0 0 5 0 0 0 0 2 2 4 2 1 0
Newcastle upon Tyne
2 2 0 0 0 1 1 0 0 2 0 0 0 0 1 1 0 0 0 0
North Tyneside 7 4 3 2 3 0 1 1 0 6 0 0 0 1 0 2 2 0 1 0
Northumberland 7 7 0 1 0 2 3 0 0 6 1 0 0 0 2 2 5 0 0 0
Redcar and Cleveland
3 1 2 0 1 0 0 0 2 3 0 0 0 0 0 1 3 0 0 0
South Tyneside 0 0 0 0 0 0 0 0 0 0 0 0 0 0 0 0 0 0 0 0
Stockton on Tees
4 2 0 3 1 0 0 0 0 4 0 0 0 0 3 3 3 0 0 1
Sunderland 8 7 0 3 3 0 0 1 1 7 0 0 0 1 2 1 2 0 0 0
NORTH WEST
Blackburn with Darwen
12 10 2 0 2 6 2 2 0 11 0 0 0 1 8 3 4 1 1 0
Blackpool 15 11 4 2 5 5 2 1 0 13 0 0 0 2 9 3 3 0 2 1
Bolton 9 8 1 0 1 4 3 1 0 4 0 0 0 5 5 4 2 0 0 0
Bury 0 0 0 0 0 0 0 0 0 0 0 0 0 0 0 0 0 0 0 0
Cheshire 8 8 0 0 3 3 0 0 2 8 0 0 0 0 4 2 4 0 0 0
Cumbria 11 7 4 3 5 3 0 0 0 10 0 0 0 1 1 8 6 0 0 0
Halton 1 1 0 0 0 1 0 0 0 1 0 0 0 0 0 0 0 1 1 1
Knowsley 2 2 0 0 1 1 0 0 0 2 0 0 0 0 2 0 0 1 0 0
Lancashire 55 43 12 2 7 27 13 3 3 19 0 0 0 36 22 19 19 2 5 0
Liverpool 24 15 9 1 1 11 8 2 1 22 0 0 0 2 5 13 1 4 1 2
Manchester 30 15 15 2 3 11 9 3 2 22 0 0 1 7 7 10 2 2 2 0
Oldham 1 1 0 1 0 0 0 0 0 1 0 0 0 0 0 1 0 0 0 0
Rochdale 3 3 0 1 0 1 1 0 0 2 0 1 0 0 1 1 0 1 1 0
Salford 22 14 8 0 3 11 5 1 2 5 0 0 0 17 6 6 4 0 2 0
Sefton 7 5 2 0 3 2 2 0 0 7 0 0 0 0 5 3 1 1 0 1
St. Helens 0 0 0 0 0 0 0 0 0 0 0 0 0 0 0 0 0 0 0 0
Stockport 10 9 1 0 2 5 2 0 1 9 0 0 0 1 3 4 4 3 0 0
Tameside 10 7 3 0 3 4 3 0 0 8 0 0 0 2 2 5 0 1 0 2
Trafford 5 4 1 0 0 3 0 1 0 5 0 0 0 0 2 3 0 0 0 0
Warrington 10 7 3 1 3 2 1 2 1 9 0 0 0 1 1 3 3 1 1 1
Wigan 8 6 2 1 3 3 0 1 0 0 0 0 0 8 2 5 2 0 0 0
Wirral 2 2 0 0 1 1 0 0 0 0 1 0 0 1 0 0 1 0 0 0
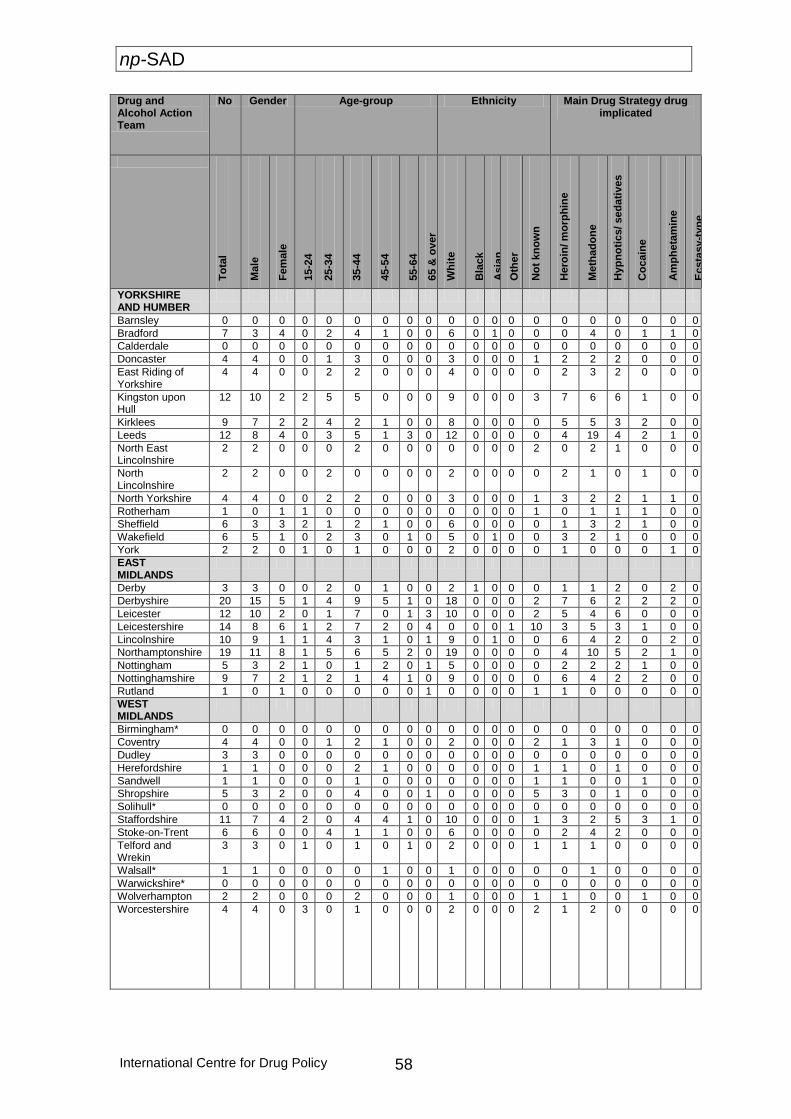
np-SAD
International Centre for Drug Policy 58
Drug and Alcohol Action Team
No Gender Age-group Ethnicity Main Drug Strategy drug implicated
To
tal
Ma
le
Fe
male
15-2
4
25-3
4
35-4
4
45-5
4
55-6
4
65 &
ov
er
Wh
ite
Bla
ck
Asia
n
Oth
er
No
t kn
ow
n
Hero
in/ m
orp
hin
e
Me
tha
do
ne
Hyp
no
tics/ sed
ati
ves
Co
cain
e
Am
ph
eta
min
e
Ecsta
sy-t
yp
e
YORKSHIRE AND HUMBER
Barnsley 0 0 0 0 0 0 0 0 0 0 0 0 0 0 0 0 0 0 0 0
Bradford 7 3 4 0 2 4 1 0 0 6 0 1 0 0 0 4 0 1 1 0
Calderdale 0 0 0 0 0 0 0 0 0 0 0 0 0 0 0 0 0 0 0 0
Doncaster 4 4 0 0 1 3 0 0 0 3 0 0 0 1 2 2 2 0 0 0
East Riding of Yorkshire
4 4 0 0 2 2 0 0 0 4 0 0 0 0 2 3 2 0 0 0
Kingston upon Hull
12 10 2 2 5 5 0 0 0 9 0 0 0 3 7 6 6 1 0 0
Kirklees 9 7 2 2 4 2 1 0 0 8 0 0 0 0 5 5 3 2 0 0
Leeds 12 8 4 0 3 5 1 3 0 12 0 0 0 0 4 19 4 2 1 0
North East Lincolnshire
2 2 0 0 0 2 0 0 0 0 0 0 0 2 0 2 1 0 0 0
North Lincolnshire
2 2 0 0 2 0 0 0 0 2 0 0 0 0 2 1 0 1 0 0
North Yorkshire 4 4 0 0 2 2 0 0 0 3 0 0 0 1 3 2 2 1 1 0
Rotherham 1 0 1 1 0 0 0 0 0 0 0 0 0 1 0 1 1 1 0 0
Sheffield 6 3 3 2 1 2 1 0 0 6 0 0 0 0 1 3 2 1 0 0
Wakefield 6 5 1 0 2 3 0 1 0 5 0 1 0 0 3 2 1 0 0 0
York 2 2 0 1 0 1 0 0 0 2 0 0 0 0 1 0 0 0 1 0
EAST MIDLANDS
Derby 3 3 0 0 2 0 1 0 0 2 1 0 0 0 1 1 2 0 2 0
Derbyshire 20 15 5 1 4 9 5 1 0 18 0 0 0 2 7 6 2 2 2 0
Leicester 12 10 2 0 1 7 0 1 3 10 0 0 0 2 5 4 6 0 0 0
Leicestershire 14 8 6 1 2 7 2 0 4 0 0 0 1 10 3 5 3 1 0 0
Lincolnshire 10 9 1 1 4 3 1 0 1 9 0 1 0 0 6 4 2 0 2 0
Northamptonshire 19 11 8 1 5 6 5 2 0 19 0 0 0 0 4 10 5 2 1 0
Nottingham 5 3 2 1 0 1 2 0 1 5 0 0 0 0 2 2 2 1 0 0
Nottinghamshire 9 7 2 1 2 1 4 1 0 9 0 0 0 0 6 4 2 2 0 0
Rutland 1 0 1 0 0 0 0 0 1 0 0 0 0 1 1 0 0 0 0 0
WEST MIDLANDS
Birmingham* 0 0 0 0 0 0 0 0 0 0 0 0 0 0 0 0 0 0 0 0
Coventry 4 4 0 0 1 2 1 0 0 2 0 0 0 2 1 3 1 0 0 0
Dudley 3 3 0 0 0 0 0 0 0 0 0 0 0 0 0 0 0 0 0 0
Herefordshire 1 1 0 0 0 2 1 0 0 0 0 0 0 1 1 0 1 0 0 0
Sandwell 1 1 0 0 0 1 0 0 0 0 0 0 0 1 1 0 0 1 0 0
Shropshire 5 3 2 0 0 4 0 0 1 0 0 0 0 5 3 0 1 0 0 0
Solihull* 0 0 0 0 0 0 0 0 0 0 0 0 0 0 0 0 0 0 0 0
Staffordshire 11 7 4 2 0 4 4 1 0 10 0 0 0 1 3 2 5 3 1 0
Stoke-on-Trent 6 6 0 0 4 1 1 0 0 6 0 0 0 0 2 4 2 0 0 0
Telford and Wrekin
3 3 0 1 0 1 0 1 0 2 0 0 0 1 1 1 0 0 0 0
Walsall* 1 1 0 0 0 0 1 0 0 1 0 0 0 0 0 1 0 0 0 0
Warwickshire* 0 0 0 0 0 0 0 0 0 0 0 0 0 0 0 0 0 0 0 0
Wolverhampton 2 2 0 0 0 2 0 0 0 1 0 0 0 1 1 0 0 1 0 0
Worcestershire
4 4 0 3 0 1 0 0 0 2 0 0 0 2 1 2 0 0 0 0
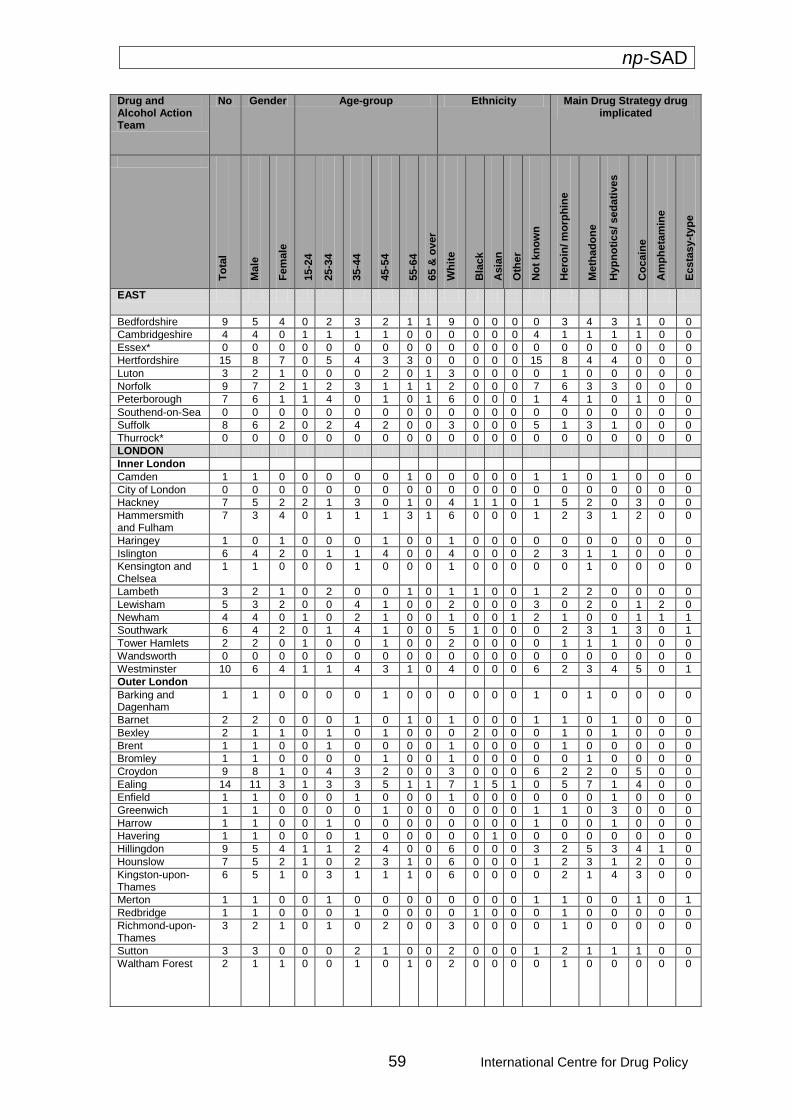
np-SAD
59 International Centre for Drug Policy
Drug and Alcohol Action Team
No Gender Age-group Ethnicity Main Drug Strategy drug implicated
To
tal
Ma
le
Fe
male
15-2
4
25-3
4
35-4
4
45-5
4
55-6
4
65 &
ov
er
Wh
ite
Bla
ck
Asia
n
Oth
er
No
t kn
ow
n
Hero
in/ m
orp
hin
e
Me
tha
do
ne
Hyp
no
tics/ sed
ati
ves
Co
cain
e
Am
ph
eta
min
e
Ecsta
sy-t
yp
e
EAST
Bedfordshire 9 5 4 0 2 3 2 1 1 9 0 0 0 0 3 4 3 1 0 0
Cambridgeshire 4 4 0 1 1 1 1 0 0 0 0 0 0 4 1 1 1 1 0 0
Essex* 0 0 0 0 0 0 0 0 0 0 0 0 0 0 0 0 0 0 0 0
Hertfordshire 15 8 7 0 5 4 3 3 0 0 0 0 0 15 8 4 4 0 0 0
Luton 3 2 1 0 0 0 2 0 1 3 0 0 0 0 1 0 0 0 0 0
Norfolk 9 7 2 1 2 3 1 1 1 2 0 0 0 7 6 3 3 0 0 0
Peterborough 7 6 1 1 4 0 1 0 1 6 0 0 0 1 4 1 0 1 0 0
Southend-on-Sea 0 0 0 0 0 0 0 0 0 0 0 0 0 0 0 0 0 0 0 0
Suffolk 8 6 2 0 2 4 2 0 0 3 0 0 0 5 1 3 1 0 0 0
Thurrock* 0 0 0 0 0 0 0 0 0 0 0 0 0 0 0 0 0 0 0 0
LONDON
Inner London
Camden 1 1 0 0 0 0 0 1 0 0 0 0 0 1 1 0 1 0 0 0
City of London 0 0 0 0 0 0 0 0 0 0 0 0 0 0 0 0 0 0 0 0
Hackney 7 5 2 2 1 3 0 1 0 4 1 1 0 1 5 2 0 3 0 0
Hammersmith and Fulham
7 3 4 0 1 1 1 3 1 6 0 0 0 1 2 3 1 2 0 0
Haringey 1 0 1 0 0 0 1 0 0 1 0 0 0 0 0 0 0 0 0 0
Islington 6 4 2 0 1 1 4 0 0 4 0 0 0 2 3 1 1 0 0 0
Kensington and Chelsea
1 1 0 0 0 1 0 0 0 1 0 0 0 0 0 1 0 0 0 0
Lambeth 3 2 1 0 2 0 0 1 0 1 1 0 0 1 2 2 0 0 0 0
Lewisham 5 3 2 0 0 4 1 0 0 2 0 0 0 3 0 2 0 1 2 0
Newham 4 4 0 1 0 2 1 0 0 1 0 0 1 2 1 0 0 1 1 1
Southwark 6 4 2 0 1 4 1 0 0 5 1 0 0 0 2 3 1 3 0 1
Tower Hamlets 2 2 0 1 0 0 1 0 0 2 0 0 0 0 1 1 1 0 0 0
Wandsworth 0 0 0 0 0 0 0 0 0 0 0 0 0 0 0 0 0 0 0 0
Westminster 10 6 4 1 1 4 3 1 0 4 0 0 0 6 2 3 4 5 0 1
Outer London
Barking and Dagenham
1 1 0 0 0 0 1 0 0 0 0 0 0 1 0 1 0 0 0 0
Barnet 2 2 0 0 0 1 0 1 0 1 0 0 0 1 1 0 1 0 0 0
Bexley 2 1 1 0 1 0 1 0 0 0 2 0 0 0 1 0 1 0 0 0
Brent 1 1 0 0 1 0 0 0 0 1 0 0 0 0 1 0 0 0 0 0
Bromley 1 1 0 0 0 0 1 0 0 1 0 0 0 0 0 1 0 0 0 0
Croydon 9 8 1 0 4 3 2 0 0 3 0 0 0 6 2 2 0 5 0 0
Ealing 14 11 3 1 3 3 5 1 1 7 1 5 1 0 5 7 1 4 0 0
Enfield 1 1 0 0 0 1 0 0 0 1 0 0 0 0 0 0 1 0 0 0
Greenwich 1 1 0 0 0 0 1 0 0 0 0 0 0 1 1 0 3 0 0 0
Harrow 1 1 0 0 1 0 0 0 0 0 0 0 0 1 0 0 1 0 0 0
Havering 1 1 0 0 0 1 0 0 0 0 0 1 0 0 0 0 0 0 0 0
Hillingdon 9 5 4 1 1 2 4 0 0 6 0 0 0 3 2 5 3 4 1 0
Hounslow 7 5 2 1 0 2 3 1 0 6 0 0 0 1 2 3 1 2 0 0
Kingston-upon-Thames
6 5 1 0 3 1 1 1 0 6 0 0 0 0 2 1 4 3 0 0
Merton 1 1 0 0 1 0 0 0 0 0 0 0 0 1 1 0 0 1 0 1
Redbridge 1 1 0 0 0 1 0 0 0 0 1 0 0 0 1 0 0 0 0 0
Richmond-upon-Thames
3 2 1 0 1 0 2 0 0 3 0 0 0 0 1 0 0 0 0 0
Sutton 3 3 0 0 0 2 1 0 0 2 0 0 0 1 2 1 1 1 0 0
Waltham Forest
2 1 1 0 0 1 0 1 0 2 0 0 0 0 1 0 0 0 0 0
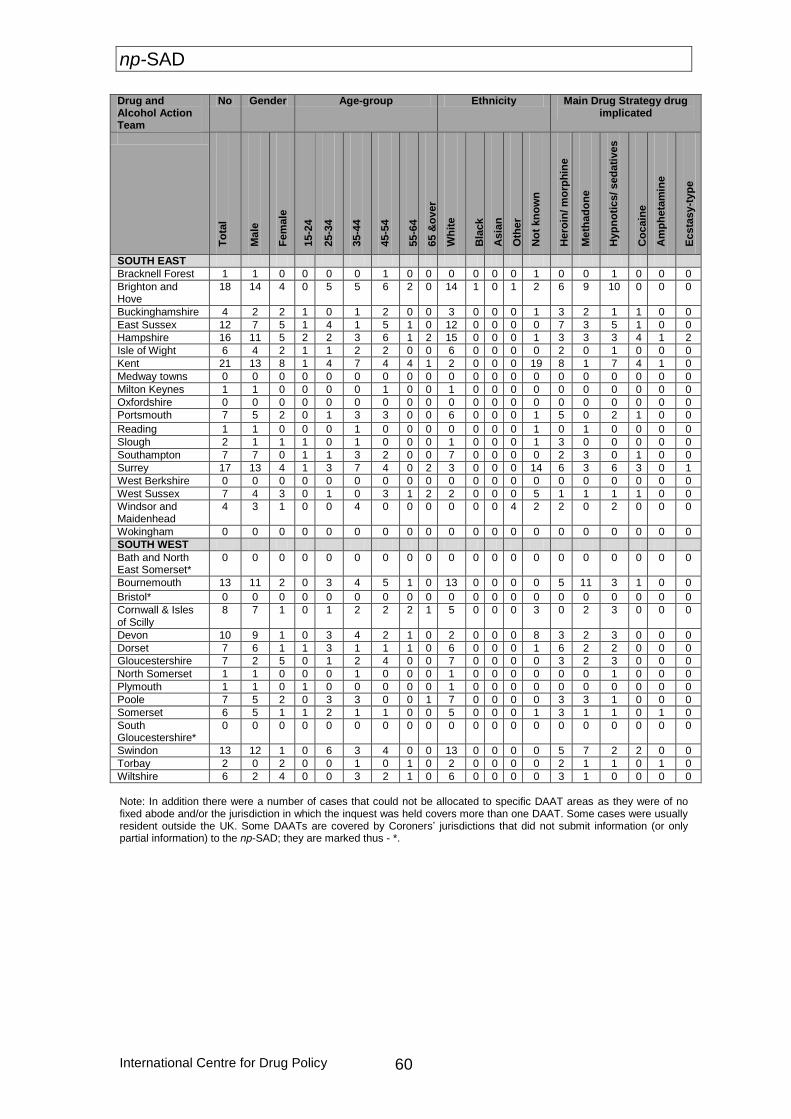
np-SAD
International Centre for Drug Policy 60
Drug and Alcohol Action Team
No Gender Age-group Ethnicity Main Drug Strategy drug implicated
To
tal
Ma
le
Fe
male
15-2
4
25-3
4
35-4
4
45-5
4
55-6
4
65 &
ov
er
Wh
ite
Bla
ck
Asia
n
Oth
er
No
t kn
ow
n
Hero
in/ m
orp
hin
e
Me
tha
do
ne
Hyp
no
tics/ sed
ati
ves
Co
cain
e
Am
ph
eta
min
e
Ecsta
sy-t
yp
e
SOUTH EAST
Bracknell Forest 1 1 0 0 0 0 1 0 0 0 0 0 0 1 0 0 1 0 0 0
Brighton and Hove
18 14 4 0 5 5 6 2 0 14 1 0 1 2 6 9 10 0 0 0
Buckinghamshire 4 2 2 1 0 1 2 0 0 3 0 0 0 1 3 2 1 1 0 0
East Sussex 12 7 5 1 4 1 5 1 0 12 0 0 0 0 7 3 5 1 0 0
Hampshire 16 11 5 2 2 3 6 1 2 15 0 0 0 1 3 3 3 4 1 2
Isle of Wight 6 4 2 1 1 2 2 0 0 6 0 0 0 0 2 0 1 0 0 0
Kent 21 13 8 1 4 7 4 4 1 2 0 0 0 19 8 1 7 4 1 0
Medway towns 0 0 0 0 0 0 0 0 0 0 0 0 0 0 0 0 0 0 0 0
Milton Keynes 1 1 0 0 0 0 1 0 0 1 0 0 0 0 0 0 0 0 0 0
Oxfordshire 0 0 0 0 0 0 0 0 0 0 0 0 0 0 0 0 0 0 0 0 Portsmouth 7 5 2 0 1 3 3 0 0 6 0 0 0 1 5 0 2 1 0 0
Reading 1 1 0 0 0 1 0 0 0 0 0 0 0 1 0 1 0 0 0 0
Slough 2 1 1 1 0 1 0 0 0 1 0 0 0 1 3 0 0 0 0 0
Southampton 7 7 0 1 1 3 2 0 0 7 0 0 0 0 2 3 0 1 0 0
Surrey 17 13 4 1 3 7 4 0 2 3 0 0 0 14 6 3 6 3 0 1
West Berkshire 0 0 0 0 0 0 0 0 0 0 0 0 0 0 0 0 0 0 0 0 West Sussex 7 4 3 0 1 0 3 1 2 2 0 0 0 5 1 1 1 1 0 0
Windsor and Maidenhead
4 3 1 0 0 4 0 0 0 0 0 0 4 2 2 0 2 0 0 0
Wokingham 0 0 0 0 0 0 0 0 0 0 0 0 0 0 0 0 0 0 0 0 SOUTH WEST
Bath and North East Somerset*
0 0 0 0 0 0 0 0 0 0 0 0 0 0 0 0 0 0 0 0
Bournemouth 13 11 2 0 3 4 5 1 0 13 0 0 0 0 5 11 3 1 0 0
Bristol* 0 0 0 0 0 0 0 0 0 0 0 0 0 0 0 0 0 0 0 0
Cornwall & Isles of Scilly
8 7 1 0 1 2 2 2 1 5 0 0 0 3 0 2 3 0 0 0
Devon 10 9 1 0 3 4 2 1 0 2 0 0 0 8 3 2 3 0 0 0
Dorset 7 6 1 1 3 1 1 1 0 6 0 0 0 1 6 2 2 0 0 0
Gloucestershire 7 2 5 0 1 2 4 0 0 7 0 0 0 0 3 2 3 0 0 0
North Somerset 1 1 0 0 0 1 0 0 0 1 0 0 0 0 0 0 1 0 0 0
Plymouth 1 1 0 1 0 0 0 0 0 1 0 0 0 0 0 0 0 0 0 0
Poole 7 5 2 0 3 3 0 0 1 7 0 0 0 0 3 3 1 0 0 0
Somerset 6 5 1 1 2 1 1 0 0 5 0 0 0 1 3 1 1 0 1 0
South Gloucestershire*
0 0 0 0 0 0 0 0 0 0 0 0 0 0 0 0 0 0 0 0
Swindon 13 12 1 0 6 3 4 0 0 13 0 0 0 0 5 7 2 2 0 0
Torbay 2 0 2 0 0 1 0 1 0 2 0 0 0 0 2 1 1 0 1 0
Wiltshire 6 2 4 0 0 3 2 1 0 6 0 0 0 0 3 1 0 0 0 0
Note: In addition there were a number of cases that could not be allocated to specific DAAT areas as they were of no fixed abode and/or the jurisdiction in which the inquest was held covers more than one DAAT. Some cases were usually resident outside the UK. Some DAATs are covered by Coroners’ jurisdictions that did not submit information (or only partial information) to the np-SAD; they are marked thus - *.
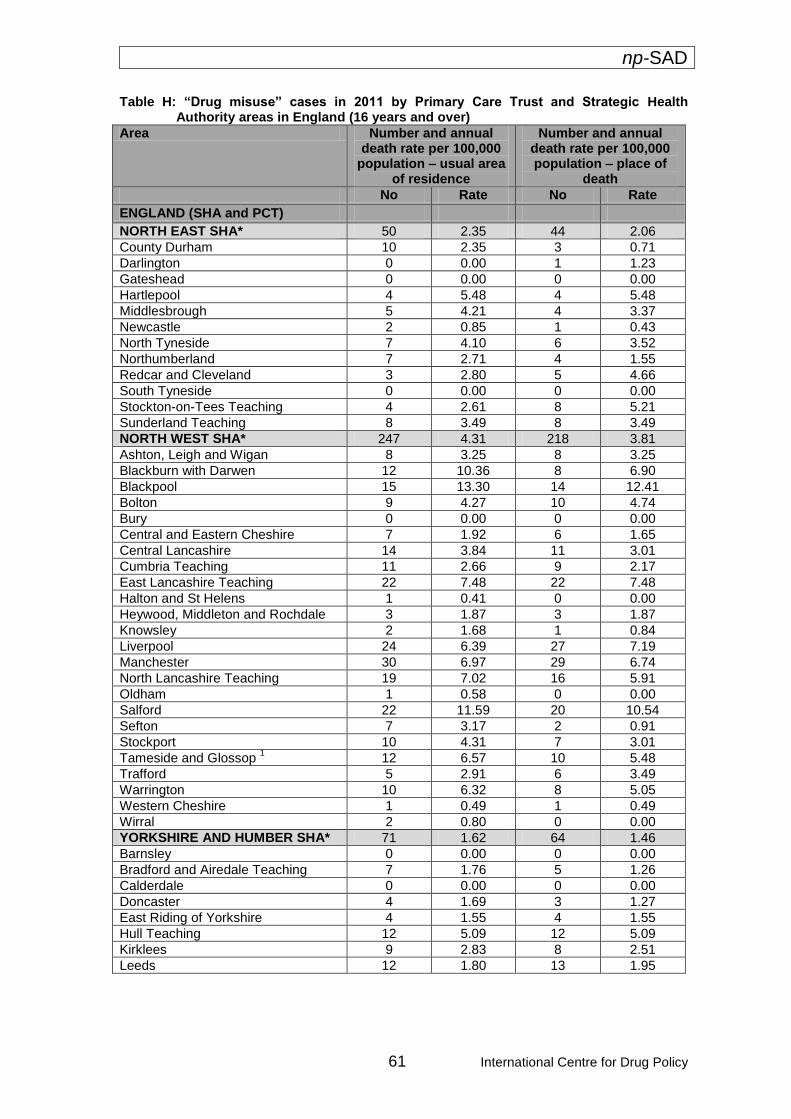
np-SAD
61 International Centre for Drug Policy
Table H: “Drug misuse” cases in 2011 by Primary Care Trust and Strategic Health Authority areas in England (16 years and over)
Area Number and annual death rate per 100,000
population – usual area of residence
Number and annual death rate per 100,000 population – place of
death
No Rate No Rate
ENGLAND (SHA and PCT)
NORTH EAST SHA* 50 2.35 44 2.06
County Durham 10 2.35 3 0.71
Darlington 0 0.00 1 1.23
Gateshead 0 0.00 0 0.00
Hartlepool 4 5.48 4 5.48
Middlesbrough 5 4.21 4 3.37
Newcastle 2 0.85 1 0.43
North Tyneside 7 4.10 6 3.52
Northumberland 7 2.71 4 1.55
Redcar and Cleveland 3 2.80 5 4.66
South Tyneside 0 0.00 0 0.00
Stockton-on-Tees Teaching 4 2.61 8 5.21
Sunderland Teaching 8 3.49 8 3.49
NORTH WEST SHA* 247 4.31 218 3.81
Ashton, Leigh and Wigan 8 3.25 8 3.25
Blackburn with Darwen 12 10.36 8 6.90
Blackpool 15 13.30 14 12.41
Bolton 9 4.27 10 4.74
Bury 0 0.00 0 0.00
Central and Eastern Cheshire 7 1.92 6 1.65
Central Lancashire 14 3.84 11 3.01
Cumbria Teaching 11 2.66 9 2.17
East Lancashire Teaching 22 7.48 22 7.48
Halton and St Helens 1 0.41 0 0.00
Heywood, Middleton and Rochdale 3 1.87 3 1.87
Knowsley 2 1.68 1 0.84
Liverpool 24 6.39 27 7.19
Manchester 30 6.97 29 6.74
North Lancashire Teaching 19 7.02 16 5.91
Oldham 1 0.58 0 0.00
Salford 22 11.59 20 10.54
Sefton 7 3.17 2 0.91
Stockport 10 4.31 7 3.01
Tameside and Glossop 1 12 6.57 10 5.48
Trafford 5 2.91 6 3.49
Warrington 10 6.32 8 5.05
Western Cheshire 1 0.49 1 0.49
Wirral 2 0.80 0 0.00
YORKSHIRE AND HUMBER SHA* 71 1.62 64 1.46
Barnsley 0 0.00 0 0.00
Bradford and Airedale Teaching 7 1.76 5 1.26
Calderdale 0 0.00 0 0.00
Doncaster 4 1.69 3 1.27
East Riding of Yorkshire 4 1.55 4 1.55
Hull Teaching 12 5.09 12 5.09
Kirklees 9 2.83 8 2.51
Leeds 12 1.80 13 1.95
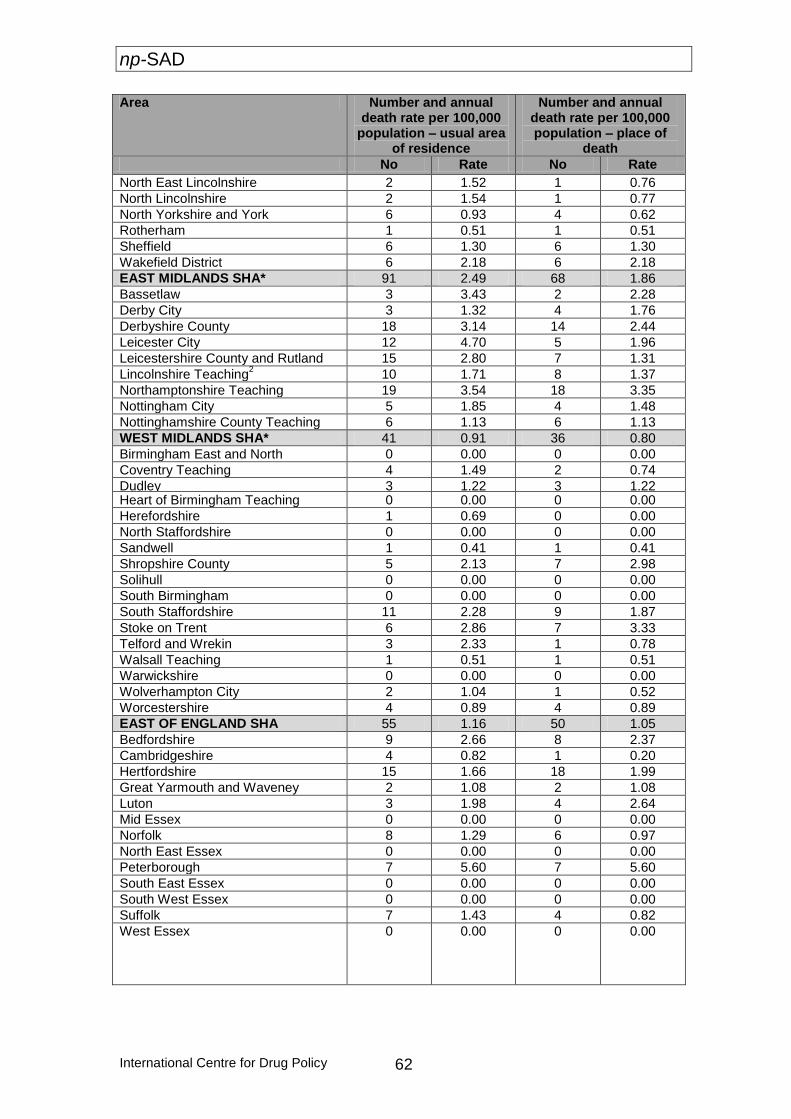
np-SAD
International Centre for Drug Policy 62
Area Number and annual death rate per 100,000
population – usual area of residence
Number and annual death rate per 100,000 population – place of
death
No Rate No Rate
North East Lincolnshire 2 1.52 1 0.76
North Lincolnshire 2 1.54 1 0.77
North Yorkshire and York 6 0.93 4 0.62
Rotherham 1 0.51 1 0.51
Sheffield 6 1.30 6 1.30
Wakefield District 6 2.18 6 2.18
EAST MIDLANDS SHA* 91 2.49 68 1.86
Bassetlaw 3 3.43 2 2.28
Derby City 3 1.32 4 1.76
Derbyshire County 18 3.14 14 2.44
Leicester City 12 4.70 5 1.96
Leicestershire County and Rutland 15 2.80 7 1.31
Lincolnshire Teaching2 10 1.71 8 1.37
Northamptonshire Teaching 19 3.54 18 3.35
Nottingham City 5 1.85 4 1.48
Nottinghamshire County Teaching 6 1.13 6 1.13
WEST MIDLANDS SHA* 41 0.91 36 0.80
Birmingham East and North 0 0.00 0 0.00
Coventry Teaching 4 1.49 2 0.74
Dudley 3 1.22 3 1.22 Heart of Birmingham Teaching 0 0.00 0 0.00
Herefordshire 1 0.69 0 0.00
North Staffordshire 0 0.00 0 0.00
Sandwell 1 0.41 1 0.41
Shropshire County 5 2.13 7 2.98
Solihull 0 0.00 0 0.00
South Birmingham 0 0.00 0 0.00
South Staffordshire 11 2.28 9 1.87
Stoke on Trent 6 2.86 7 3.33
Telford and Wrekin 3 2.33 1 0.78
Walsall Teaching 1 0.51 1 0.51
Warwickshire 0 0.00 0 0.00
Wolverhampton City 2 1.04 1 0.52
Worcestershire 4 0.89 4 0.89
EAST OF ENGLAND SHA 55 1.16 50 1.05
Bedfordshire 9 2.66 8 2.37
Cambridgeshire 4 0.82 1 0.20
Hertfordshire 15 1.66 18 1.99
Great Yarmouth and Waveney 2 1.08 2 1.08
Luton 3 1.98 4 2.64
Mid Essex 0 0.00 0 0.00
Norfolk 8 1.29 6 0.97
North East Essex 0 0.00 0 0.00
Peterborough 7 5.60 7 5.60
South East Essex 0 0.00 0 0.00
South West Essex 0 0.00 0 0.00
Suffolk 7 1.43 4 0.82
West Essex
0 0.00 0 0.00
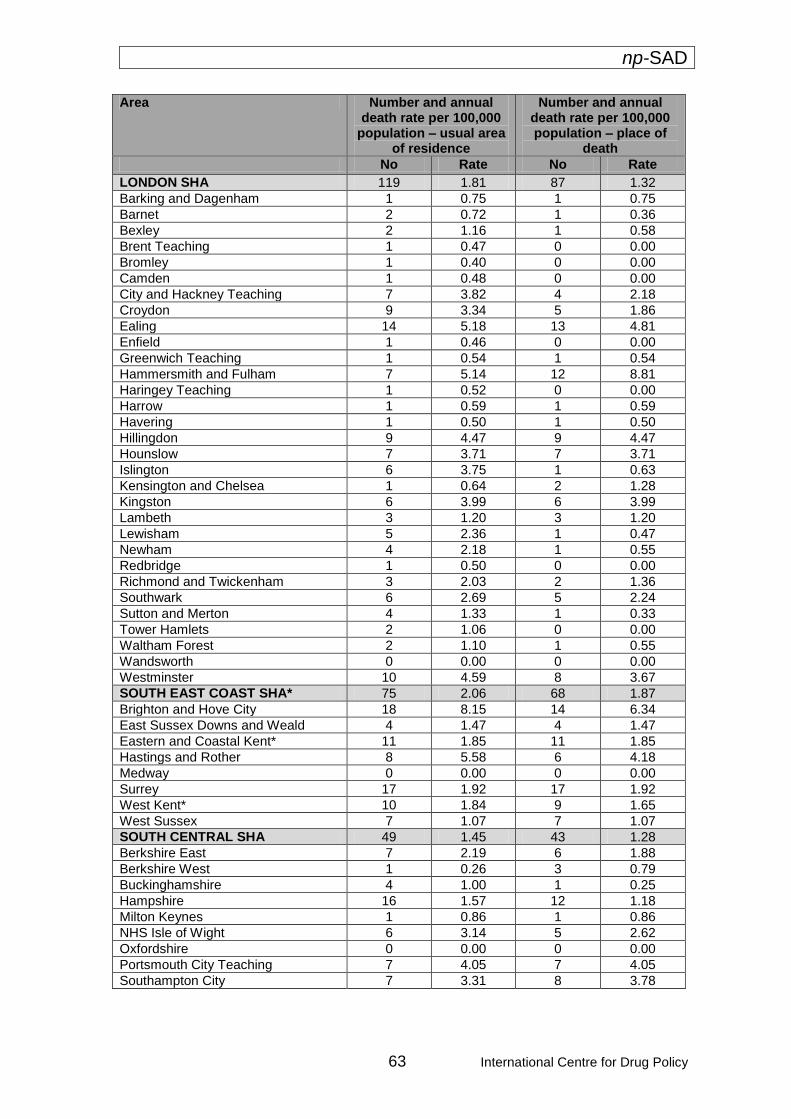
np-SAD
63 International Centre for Drug Policy
Area Number and annual death rate per 100,000
population – usual area of residence
Number and annual death rate per 100,000 population – place of
death
No Rate No Rate
LONDON SHA 119 1.81 87 1.32
Barking and Dagenham 1 0.75 1 0.75
Barnet 2 0.72 1 0.36
Bexley 2 1.16 1 0.58
Brent Teaching 1 0.47 0 0.00
Bromley 1 0.40 0 0.00
Camden 1 0.48 0 0.00
City and Hackney Teaching 7 3.82 4 2.18
Croydon 9 3.34 5 1.86
Ealing 14 5.18 13 4.81
Enfield 1 0.46 0 0.00
Greenwich Teaching 1 0.54 1 0.54
Hammersmith and Fulham 7 5.14 12 8.81
Haringey Teaching 1 0.52 0 0.00
Harrow 1 0.59 1 0.59
Havering 1 0.50 1 0.50
Hillingdon 9 4.47 9 4.47
Hounslow 7 3.71 7 3.71
Islington 6 3.75 1 0.63
Kensington and Chelsea 1 0.64 2 1.28
Kingston 6 3.99 6 3.99
Lambeth 3 1.20 3 1.20
Lewisham 5 2.36 1 0.47
Newham 4 2.18 1 0.55
Redbridge 1 0.50 0 0.00
Richmond and Twickenham 3 2.03 2 1.36
Southwark 6 2.69 5 2.24
Sutton and Merton 4 1.33 1 0.33
Tower Hamlets 2 1.06 0 0.00
Waltham Forest 2 1.10 1 0.55
Wandsworth 0 0.00 0 0.00
Westminster 10 4.59 8 3.67
SOUTH EAST COAST SHA* 75 2.06 68 1.87
Brighton and Hove City 18 8.15 14 6.34
East Sussex Downs and Weald 4 1.47 4 1.47
Eastern and Coastal Kent* 11 1.85 11 1.85
Hastings and Rother 8 5.58 6 4.18
Medway 0 0.00 0 0.00
Surrey 17 1.92 17 1.92
West Kent* 10 1.84 9 1.65
West Sussex 7 1.07 7 1.07
SOUTH CENTRAL SHA 49 1.45 43 1.28
Berkshire East 7 2.19 6 1.88
Berkshire West 1 0.26 3 0.79
Buckinghamshire 4 1.00 1 0.25
Hampshire 16 1.57 12 1.18
Milton Keynes 1 0.86 1 0.86
NHS Isle of Wight 6 3.14 5 2.62
Oxfordshire 0 0.00 0 0.00
Portsmouth City Teaching 7 4.05 7 4.05
Southampton City 7 3.31 8 3.78
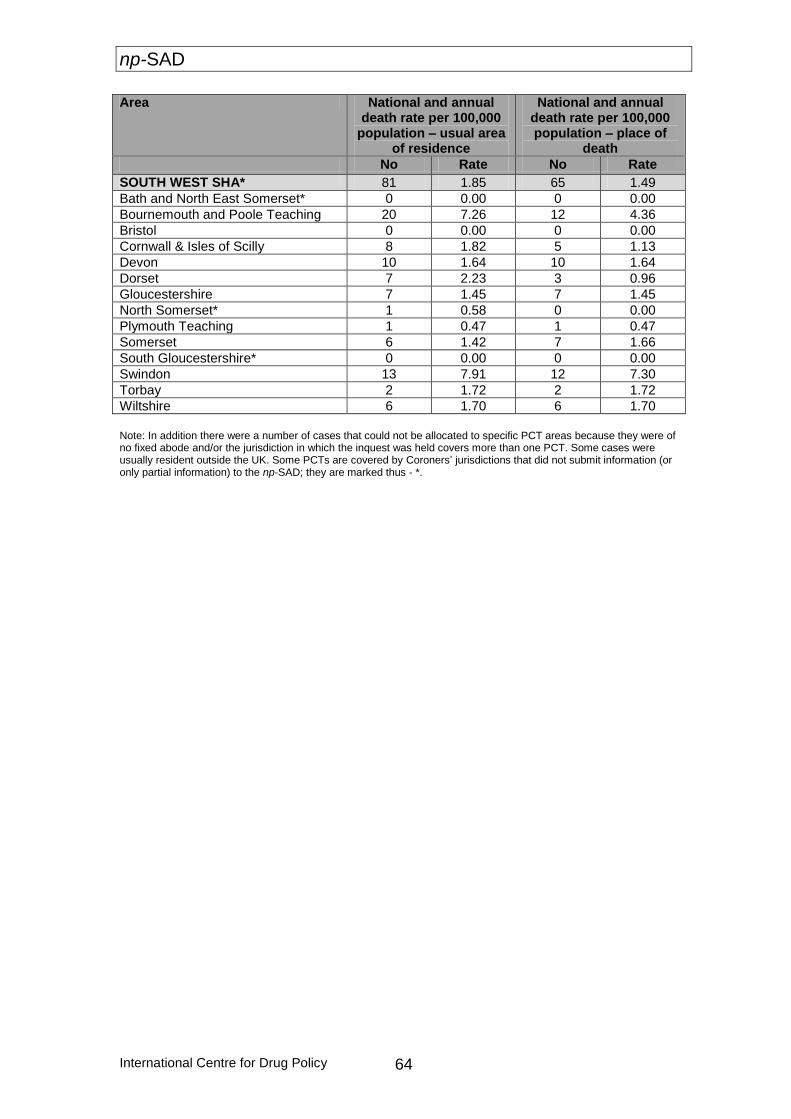
np-SAD
International Centre for Drug Policy 64
Area National and annual death rate per 100,000
population – usual area of residence
National and annual death rate per 100,000 population – place of
death
No Rate No Rate
SOUTH WEST SHA* 81 1.85 65 1.49
Bath and North East Somerset* 0 0.00 0 0.00
Bournemouth and Poole Teaching 20 7.26 12 4.36
Bristol 0 0.00 0 0.00
Cornwall & Isles of Scilly 8 1.82 5 1.13
Devon 10 1.64 10 1.64
Dorset 7 2.23 3 0.96
Gloucestershire 7 1.45 7 1.45
North Somerset* 1 0.58 0 0.00
Plymouth Teaching 1 0.47 1 0.47
Somerset 6 1.42 7 1.66
South Gloucestershire* 0 0.00 0 0.00
Swindon 13 7.91 12 7.30
Torbay 2 1.72 2 1.72
Wiltshire 6 1.70 6 1.70
Note: In addition there were a number of cases that could not be allocated to specific PCT areas because they were of no fixed abode and/or the jurisdiction in which the inquest was held covers more than one PCT. Some cases were usually resident outside the UK. Some PCTs are covered by Coroners’ jurisdictions that did not submit information (or only partial information) to the np-SAD; they are marked thus - *.
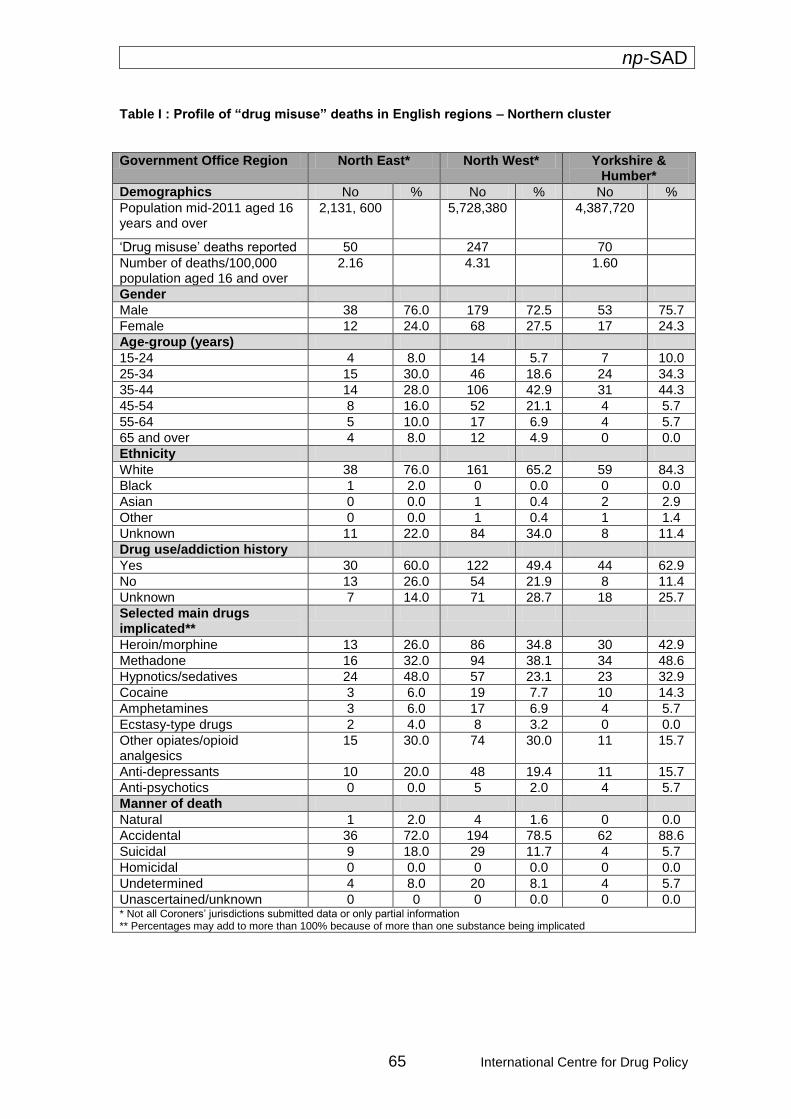
np-SAD
65 International Centre for Drug Policy
Table I : Profile of “drug misuse” deaths in English regions – Northern cluster
Government Office Region North East* North West* Yorkshire & Humber*
Demographics No % No % No %
Population mid-2011 aged 16 years and over
2,131, 600
5,728,380 4,387,720
‘Drug misuse’ deaths reported 50 247 70
Number of deaths/100,000 population aged 16 and over
2.16 4.31 1.60
Gender
Male 38 76.0 179 72.5 53 75.7
Female 12 24.0 68 27.5 17 24.3
Age-group (years)
15-24 4 8.0 14 5.7 7 10.0
25-34 15 30.0 46 18.6 24 34.3
35-44 14 28.0 106 42.9 31 44.3
45-54 8 16.0 52 21.1 4 5.7
55-64 5 10.0 17 6.9 4 5.7
65 and over 4 8.0 12 4.9 0 0.0
Ethnicity
White 38 76.0 161 65.2 59 84.3
Black 1 2.0 0 0.0 0 0.0
Asian 0 0.0 1 0.4 2 2.9
Other 0 0.0 1 0.4 1 1.4
Unknown 11 22.0 84 34.0 8 11.4
Drug use/addiction history
Yes 30 60.0 122 49.4 44 62.9
No 13 26.0 54 21.9 8 11.4
Unknown 7 14.0 71 28.7 18 25.7
Selected main drugs implicated**
Heroin/morphine 13 26.0 86 34.8 30 42.9
Methadone 16 32.0 94 38.1 34 48.6
Hypnotics/sedatives 24 48.0 57 23.1 23 32.9
Cocaine 3 6.0 19 7.7 10 14.3
Amphetamines 3 6.0 17 6.9 4 5.7
Ecstasy-type drugs 2 4.0 8 3.2 0 0.0
Other opiates/opioid analgesics
15 30.0 74 30.0 11 15.7
Anti-depressants 10 20.0 48 19.4 11 15.7
Anti-psychotics 0 0.0 5 2.0 4 5.7
Manner of death
Natural 1 2.0 4 1.6 0 0.0
Accidental 36 72.0 194 78.5 62 88.6
Suicidal 9 18.0 29 11.7 4 5.7
Homicidal 0 0.0 0 0.0 0 0.0
Undetermined 4 8.0 20 8.1 4 5.7
Unascertained/unknown 0 0 0 0.0 0 0.0 * Not all Coroners’ jurisdictions submitted data or only partial information ** Percentages may add to more than 100% because of more than one substance being implicated
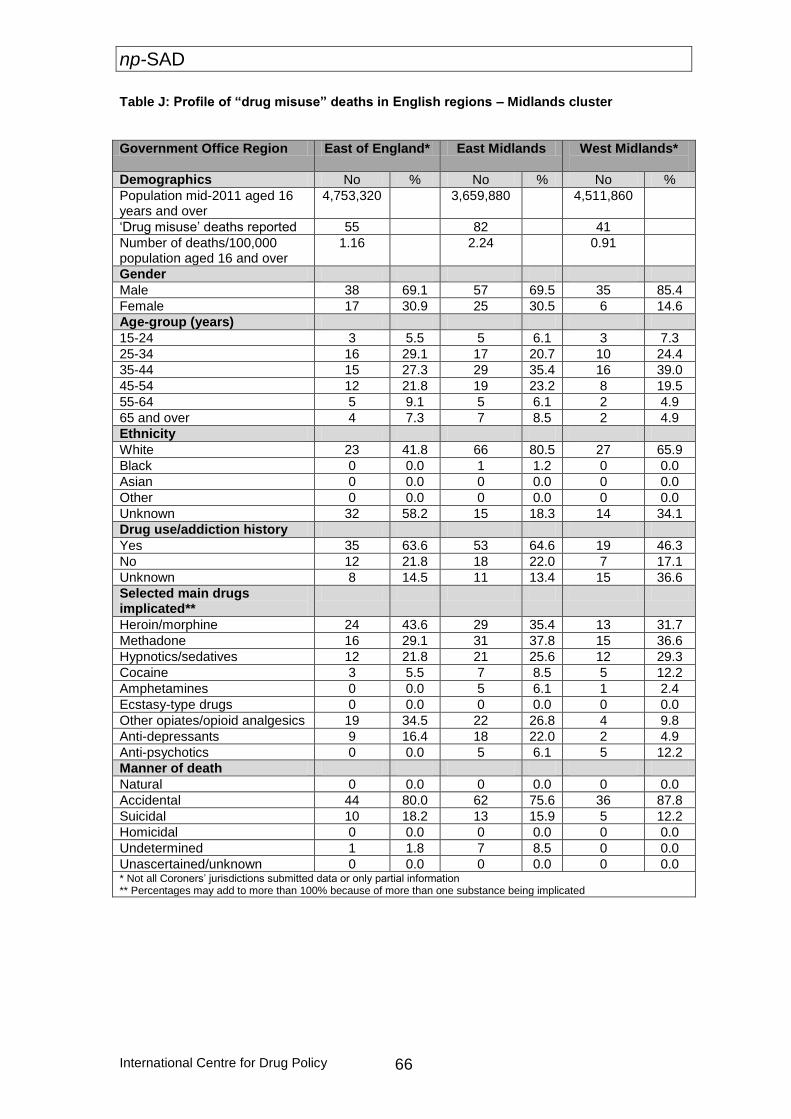
np-SAD
International Centre for Drug Policy 66
Table J: Profile of “drug misuse” deaths in English regions – Midlands cluster
Government Office Region East of England* East Midlands West Midlands*
Demographics No % No % No %
Population mid-2011 aged 16 years and over
4,753,320 3,659,880 4,511,860
‘Drug misuse’ deaths reported 55 82 41
Number of deaths/100,000 population aged 16 and over
1.16 2.24 0.91
Gender
Male 38 69.1 57 69.5 35 85.4
Female 17 30.9 25 30.5 6 14.6
Age-group (years)
15-24 3 5.5 5 6.1 3 7.3
25-34 16 29.1 17 20.7 10 24.4
35-44 15 27.3 29 35.4 16 39.0
45-54 12 21.8 19 23.2 8 19.5
55-64 5 9.1 5 6.1 2 4.9
65 and over 4 7.3 7 8.5 2 4.9
Ethnicity
White 23 41.8 66 80.5 27 65.9
Black 0 0.0 1 1.2 0 0.0
Asian 0 0.0 0 0.0 0 0.0
Other 0 0.0 0 0.0 0 0.0
Unknown 32 58.2 15 18.3 14 34.1
Drug use/addiction history
Yes 35 63.6 53 64.6 19 46.3
No 12 21.8 18 22.0 7 17.1
Unknown 8 14.5 11 13.4 15 36.6
Selected main drugs implicated**
Heroin/morphine 24 43.6 29 35.4 13 31.7
Methadone 16 29.1 31 37.8 15 36.6
Hypnotics/sedatives 12 21.8 21 25.6 12 29.3
Cocaine 3 5.5 7 8.5 5 12.2
Amphetamines 0 0.0 5 6.1 1 2.4
Ecstasy-type drugs 0 0.0 0 0.0 0 0.0
Other opiates/opioid analgesics 19 34.5 22 26.8 4 9.8
Anti-depressants 9 16.4 18 22.0 2 4.9
Anti-psychotics 0 0.0 5 6.1 5 12.2
Manner of death
Natural 0 0.0 0 0.0 0 0.0
Accidental 44 80.0 62 75.6 36 87.8
Suicidal 10 18.2 13 15.9 5 12.2
Homicidal 0 0.0 0 0.0 0 0.0
Undetermined 1 1.8 7 8.5 0 0.0
Unascertained/unknown 0 0.0 0 0.0 0 0.0 * Not all Coroners’ jurisdictions submitted data or only partial information ** Percentages may add to more than 100% because of more than one substance being implicated
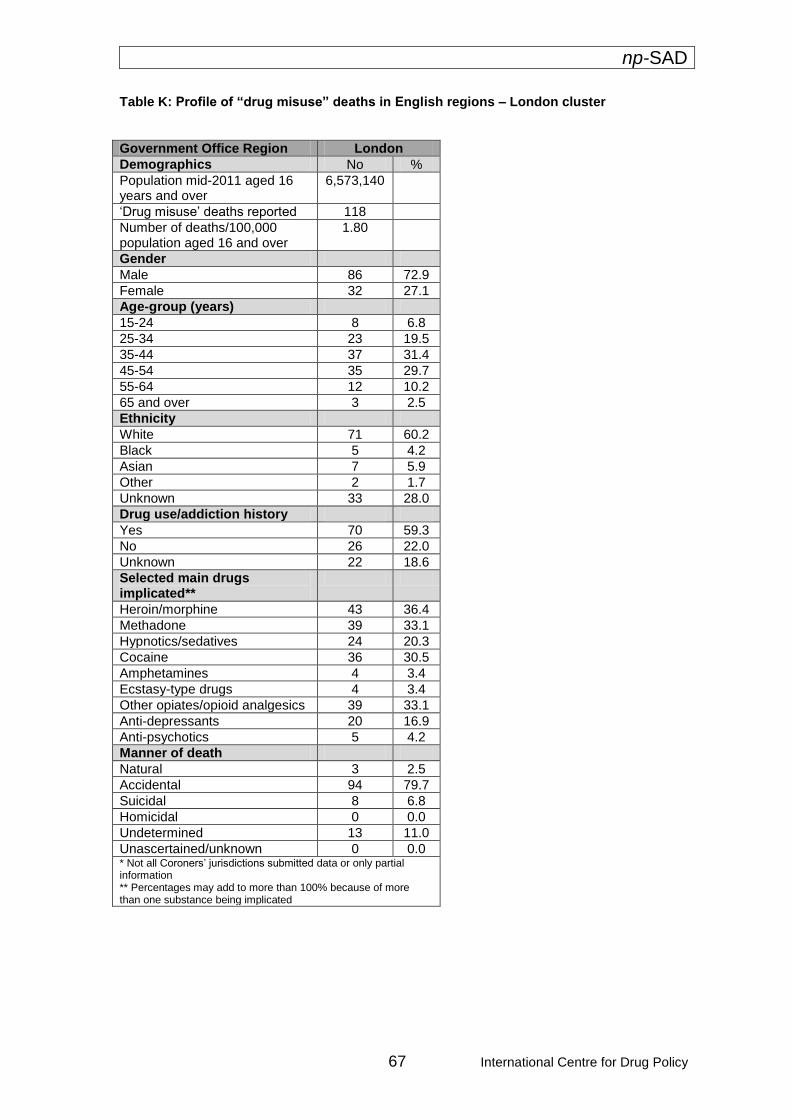
np-SAD
67 International Centre for Drug Policy
Table K: Profile of “drug misuse” deaths in English regions – London cluster
Government Office Region London
Demographics No %
Population mid-2011 aged 16 years and over
6,573,140
‘Drug misuse’ deaths reported 118
Number of deaths/100,000 population aged 16 and over
1.80
Gender
Male 86 72.9
Female 32 27.1
Age-group (years)
15-24 8 6.8
25-34 23 19.5
35-44 37 31.4
45-54 35 29.7
55-64 12 10.2
65 and over 3 2.5
Ethnicity
White 71 60.2
Black 5 4.2
Asian 7 5.9
Other 2 1.7
Unknown 33 28.0
Drug use/addiction history
Yes 70 59.3
No 26 22.0
Unknown 22 18.6
Selected main drugs implicated**
Heroin/morphine 43 36.4
Methadone 39 33.1
Hypnotics/sedatives 24 20.3
Cocaine 36 30.5
Amphetamines 4 3.4
Ecstasy-type drugs 4 3.4
Other opiates/opioid analgesics 39 33.1
Anti-depressants 20 16.9
Anti-psychotics 5 4.2
Manner of death
Natural 3 2.5
Accidental 94 79.7
Suicidal 8 6.8
Homicidal 0 0.0
Undetermined 13 11.0
Unascertained/unknown 0 0.0 * Not all Coroners’ jurisdictions submitted data or only partial information ** Percentages may add to more than 100% because of more than one substance being implicated
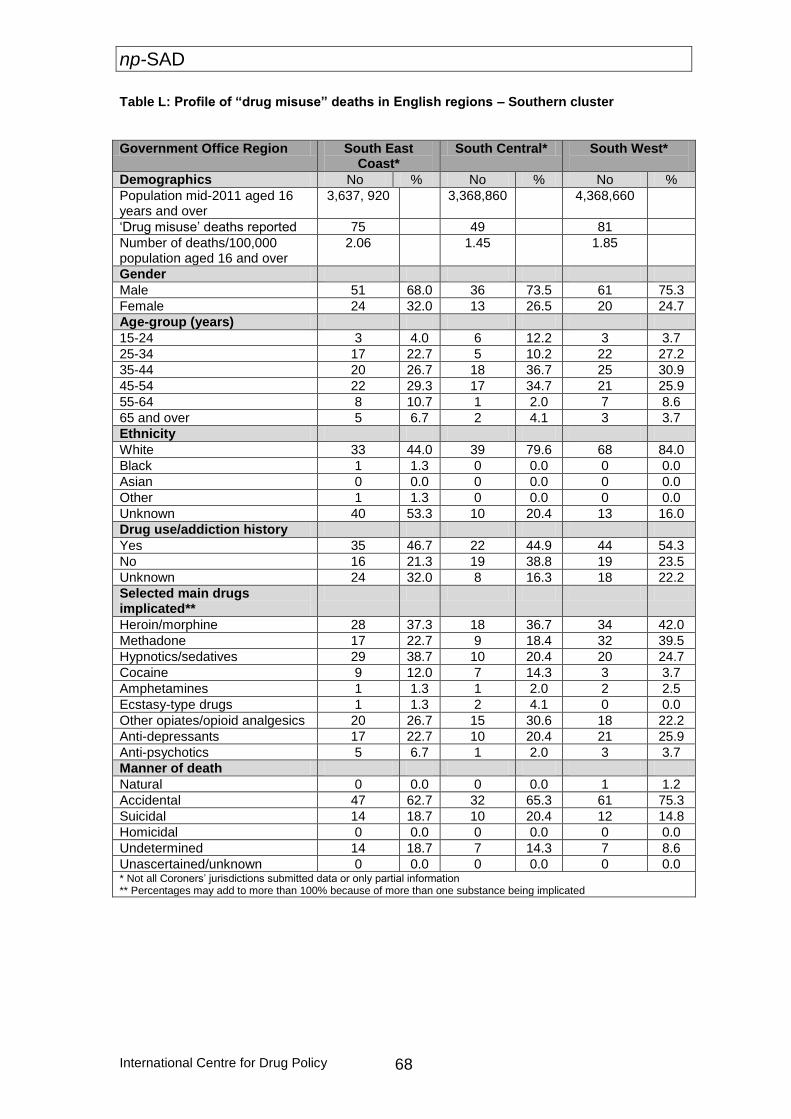
np-SAD
International Centre for Drug Policy 68
Table L: Profile of “drug misuse” deaths in English regions – Southern cluster
Government Office Region South East Coast*
South Central* South West*
Demographics No % No % No %
Population mid-2011 aged 16 years and over
3,637, 920 3,368,860 4,368,660
‘Drug misuse’ deaths reported 75 49 81
Number of deaths/100,000 population aged 16 and over
2.06 1.45 1.85
Gender
Male 51 68.0 36 73.5 61 75.3
Female 24 32.0 13 26.5 20 24.7
Age-group (years)
15-24 3 4.0 6 12.2 3 3.7
25-34 17 22.7 5 10.2 22 27.2
35-44 20 26.7 18 36.7 25 30.9
45-54 22 29.3 17 34.7 21 25.9
55-64 8 10.7 1 2.0 7 8.6
65 and over 5 6.7 2 4.1 3 3.7
Ethnicity
White 33 44.0 39 79.6 68 84.0
Black 1 1.3 0 0.0 0 0.0
Asian 0 0.0 0 0.0 0 0.0
Other 1 1.3 0 0.0 0 0.0
Unknown 40 53.3 10 20.4 13 16.0
Drug use/addiction history
Yes 35 46.7 22 44.9 44 54.3
No 16 21.3 19 38.8 19 23.5
Unknown 24 32.0 8 16.3 18 22.2
Selected main drugs implicated**
Heroin/morphine 28 37.3 18 36.7 34 42.0
Methadone 17 22.7 9 18.4 32 39.5
Hypnotics/sedatives 29 38.7 10 20.4 20 24.7
Cocaine 9 12.0 7 14.3 3 3.7
Amphetamines 1 1.3 1 2.0 2 2.5
Ecstasy-type drugs 1 1.3 2 4.1 0 0.0
Other opiates/opioid analgesics 20 26.7 15 30.6 18 22.2
Anti-depressants 17 22.7 10 20.4 21 25.9
Anti-psychotics 5 6.7 1 2.0 3 3.7
Manner of death
Natural 0 0.0 0 0.0 1 1.2
Accidental 47 62.7 32 65.3 61 75.3
Suicidal 14 18.7 10 20.4 12 14.8
Homicidal 0 0.0 0 0.0 0 0.0
Undetermined 14 18.7 7 14.3 7 8.6
Unascertained/unknown 0 0.0 0 0.0 0 0.0 * Not all Coroners’ jurisdictions submitted data or only partial information ** Percentages may add to more than 100% because of more than one substance being implicated

np-SAD
69 International Centre for Drug Policy
Chapter 3: Drug-related deaths in Wales
This chapter describes the pattern of drug-related deaths in Wales reported by Coroners to the np-SAD that meet the Programme’s case criteria. 1. Demography There were 81 notifications of drug-related deaths occurring in 2011 from Coroners in Wales. Furthermore there were some additional notifications for deaths occurring in 2010 (4); 2009 (4); 2008 (2) and one from 2004. In 2011 there was a rate of 2.83 drug-related deaths per 100,000 population aged 16 years
and over, compared with 3.30 in 2010 and 5.23 in 2009. The majority (80.2%) of the cases in 2011 were male (Table 3.1). The median age at death was 36 years (interquartile range = 12.6) (Figure 3.1) and 79% of cases were aged under 45 years. Those who were unemployed accounted for 66.7% of cases, and the living arrangements showed 43.2% living with others. Addict status was known in 60 cases, 80% of which had a history of dependence or drug use. Ethnicity was known in 48 cases, 97.9% were White; 2.1% other; and in 33 cases ethnic background was not provided.
Table 3.1: Demographic variables for drug-related deaths reported by Coroners meeting
np-SAD criteria, Wales, 2011
2. Location of death Most fatalities (93.8%) occurred at a defined residential address (i.e. the deceased’s home address or other private residential address). Deaths in hospital accounted for 1.2% and 5% occurred elsewhere.
3. Cause(s) of death Accidental poisoning accounted for 76.5% of the deaths, with 14.8% from intentional self-poisoning, and in 6.1% of cases the intent was undetermined. The remaining two deaths were related to accidental poisoning by gases and unspecified cirrhosis of the liver.
Variable Category Number (%)
Total 81 (100.0)
Gender Male 65 (80.2)
Female 16 (19.8)
Employment status
Employed 19 (23.5)
Unemployed 54 (66.7)
Childcare/house person 0 (0.0)
Student/pupil 0 (0.0)
Retired/sickness/invalidity 4 (4.9)
Not known 3 (3.7)
Other 1 (1.2)
Living Arrangements
Alone 37 (45.7)
With others 35 (43.2)
No fixed abode 3 (3.7)
Other 2 (2.5)
Not known 4 (4.9)
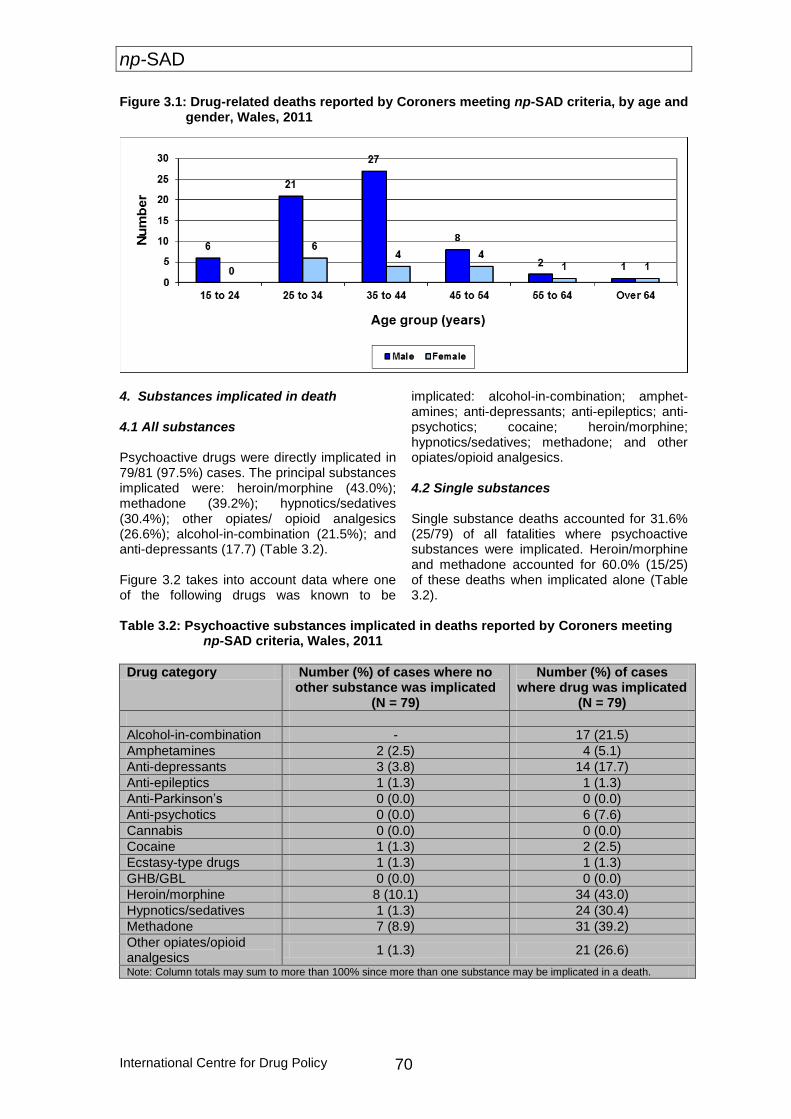
np-SAD
International Centre for Drug Policy 70
Figure 3.1: Drug-related deaths reported by Coroners meeting np-SAD criteria, by age and gender, Wales, 2011
4. Substances implicated in death 4.1 All substances Psychoactive drugs were directly implicated in 79/81 (97.5%) cases. The principal substances implicated were: heroin/morphine (43.0%); methadone (39.2%); hypnotics/sedatives (30.4%); other opiates/ opioid analgesics (26.6%); alcohol-in-combination (21.5%); and anti-depressants (17.7) (Table 3.2). Figure 3.2 takes into account data where one of the following drugs was known to be
implicated: alcohol-in-combination; amphet-amines; anti-depressants; anti-epileptics; anti-psychotics; cocaine; heroin/morphine; hypnotics/sedatives; methadone; and other opiates/opioid analgesics. 4.2 Single substances Single substance deaths accounted for 31.6% (25/79) of all fatalities where psychoactive substances were implicated. Heroin/morphine and methadone accounted for 60.0% (15/25) of these deaths when implicated alone (Table 3.2).
Table 3.2: Psychoactive substances implicated in deaths reported by Coroners meeting
np-SAD criteria, Wales, 2011
Drug category Number (%) of cases where no other substance was implicated
(N = 79)
Number (%) of cases where drug was implicated
(N = 79)
Alcohol-in-combination - 17 (21.5)
Amphetamines 2 (2.5) 4 (5.1)
Anti-depressants 3 (3.8) 14 (17.7)
Anti-epileptics 1 (1.3) 1 (1.3)
Anti-Parkinson’s 0 (0.0) 0 (0.0)
Anti-psychotics 0 (0.0) 6 (7.6)
Cannabis 0 (0.0) 0 (0.0)
Cocaine 1 (1.3) 2 (2.5)
Ecstasy-type drugs 1 (1.3) 1 (1.3)
GHB/GBL 0 (0.0) 0 (0.0)
Heroin/morphine 8 (10.1) 34 (43.0)
Hypnotics/sedatives 1 (1.3) 24 (30.4)
Methadone 7 (8.9) 31 (39.2)
Other opiates/opioid analgesics
1 (1.3) 21 (26.6)
Note: Column totals may sum to more than 100% since more than one substance may be implicated in a death.

np-SAD
71 International Centre for Drug Policy
Figure 3.2: Drug-related deaths reported by Coroners meeting np-SAD criteria, by selected psychoactive drug implicated, Wales, 2011
17
4
14
1
62
34
24
31
21
0
5
10
15
20
25
30
35
40
Nu
mb
er
Implicated drug
5. Age and drug implicated in death Of the 79 drug related deaths where a psychoactive drug was implicated, heroin/morphine and methadone accounted for the same number of deaths in the 25-34 age-group, followed by hypnotics/sedatives. Heroin/morphine accounted for one more death than methadone and two more than hypnotics/sedatives in the 35-44 age-group. Table 3.3 shows where any particular drug
was implicated across the whole range of age-groups. In the 35-44 age-group alcohol-in-combination was reported more than in any other. Looking at 45 through to 64 years as a whole, the most commonly implicated substances were heroin/morphine; methadone; and other opiates/opioid analgesics. Only anti-depressants were implicated in the 65+ age-group.
Table 3.3: Age and drug implicated in deaths reported by Coroners meeting np-SAD
criteria, Wales, 2011
Age-group (years)
Drug category (alone or in combination) most frequently implicated in each age-group
Hero
in/m
orp
hin
e
Me
tha
do
ne
Hyp
no
tics/s
ed
ati
ves
Oth
er
op
iate
s/o
pio
id
an
alg
esic
s
Co
cain
e
Am
ph
eta
min
es
Ecsta
sy-t
yp
e
An
ti-d
ep
ressan
ts
An
ti-p
sych
oti
cs
Alc
oh
ol-
in-c
om
bin
ati
on
An
ti-e
pil
ep
tics
Can
na
bis
GH
B
An
ti-P
ark
inso
n’s
Barb
itu
rate
s
15-24 3 2 1 3 0 0 0 0 0 1 0 0 0 0 0
25-34 12 12 10 6 2 2 1 3 3 5 0 0 0 0 0
35-44 13 12 11 7 0 2 0 5 2 9 0 0 0 0 0
45-54 4 5 3 4 0 0 0 3 1 2 1 0 0 0 0
55-64 2 0 0 1 0 0 0 1 0 0 0 0 0 0 0
65+ 0 0 0 0 0 0 0 2 0 0 0 0 0 0 0
TOTAL 34 31 25 21 2 4 1 14 6 17 1 0 0 0 0
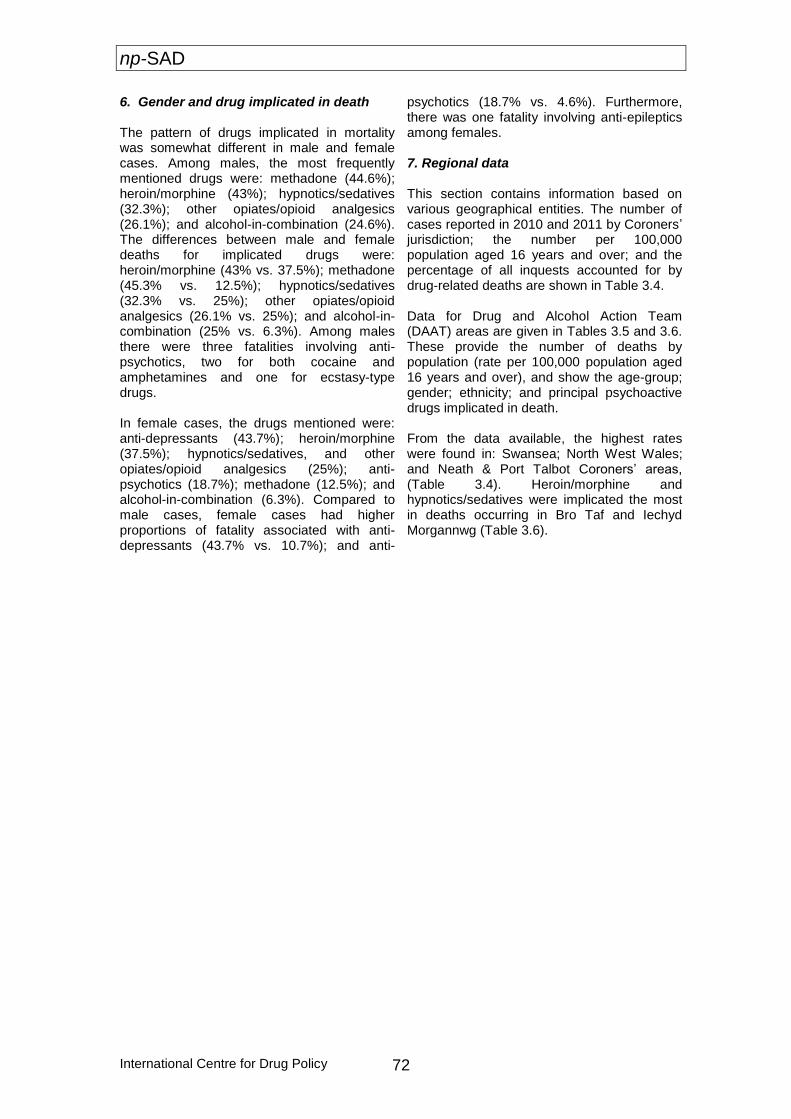
np-SAD
International Centre for Drug Policy 72
6. Gender and drug implicated in death
The pattern of drugs implicated in mortality was somewhat different in male and female cases. Among males, the most frequently mentioned drugs were: methadone (44.6%); heroin/morphine (43%); hypnotics/sedatives (32.3%); other opiates/opioid analgesics (26.1%); and alcohol-in-combination (24.6%). The differences between male and female deaths for implicated drugs were: heroin/morphine (43% vs. 37.5%); methadone (45.3% vs. 12.5%); hypnotics/sedatives (32.3% vs. 25%); other opiates/opioid analgesics (26.1% vs. 25%); and alcohol-in-combination (25% vs. 6.3%). Among males there were three fatalities involving anti-psychotics, two for both cocaine and amphetamines and one for ecstasy-type drugs. In female cases, the drugs mentioned were: anti-depressants (43.7%); heroin/morphine (37.5%); hypnotics/sedatives, and other opiates/opioid analgesics (25%); anti-psychotics (18.7%); methadone (12.5%); and alcohol-in-combination (6.3%). Compared to male cases, female cases had higher proportions of fatality associated with anti-depressants (43.7% vs. 10.7%); and anti-
psychotics (18.7% vs. 4.6%). Furthermore, there was one fatality involving anti-epileptics among females. 7. Regional data This section contains information based on various geographical entities. The number of cases reported in 2010 and 2011 by Coroners’ jurisdiction; the number per 100,000 population aged 16 years and over; and the percentage of all inquests accounted for by drug-related deaths are shown in Table 3.4. Data for Drug and Alcohol Action Team (DAAT) areas are given in Tables 3.5 and 3.6. These provide the number of deaths by population (rate per 100,000 population aged 16 years and over), and show the age-group; gender; ethnicity; and principal psychoactive drugs implicated in death. From the data available, the highest rates were found in: Swansea; North West Wales; and Neath & Port Talbot Coroners’ areas, (Table 3.4). Heroin/morphine and hypnotics/sedatives were implicated the most in deaths occurring in Bro Taf and Iechyd Morgannwg (Table 3.6).
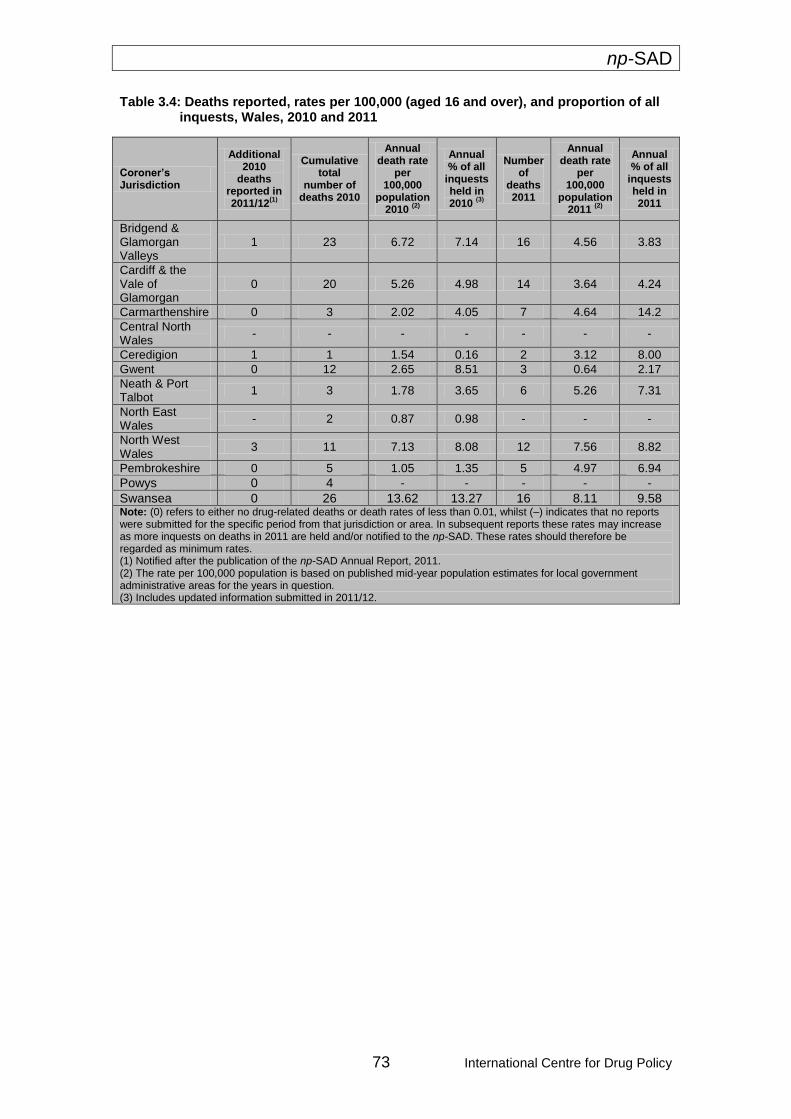
np-SAD
73 International Centre for Drug Policy
Table 3.4: Deaths reported, rates per 100,000 (aged 16 and over), and proportion of all inquests, Wales, 2010 and 2011
Coroner’s Jurisdiction
Additional 2010
deaths reported in 2011/12
(1)
Cumulative total
number of deaths 2010
Annual death rate
per 100,000
population 2010
(2)
Annual % of all
inquests held in 2010
(3)
Number of
deaths 2011
Annual death rate
per 100,000
population 2011
(2)
Annual % of all
inquests held in 2011
Bridgend & Glamorgan Valleys
1 23 6.72 7.14 16 4.56 3.83
Cardiff & the Vale of Glamorgan
0 20 5.26 4.98 14 3.64 4.24
Carmarthenshire 0 3 2.02 4.05 7 4.64 14.2
Central North Wales
- - - - - - -
Ceredigion 1 1 1.54 0.16 2 3.12 8.00
Gwent 0 12 2.65 8.51 3 0.64 2.17
Neath & Port Talbot
1 3 1.78 3.65 6 5.26 7.31
North East Wales
- 2 0.87 0.98 - - -
North West Wales
3 11 7.13 8.08 12 7.56 8.82
Pembrokeshire 0 5 1.05 1.35 5 4.97 6.94
Powys 0 4 - - - - -
Swansea 0 26 13.62 13.27 16 8.11 9.58 Note: (0) refers to either no drug-related deaths or death rates of less than 0.01, whilst (–) indicates that no reports were submitted for the specific period from that jurisdiction or area. In subsequent reports these rates may increase as more inquests on deaths in 2011 are held and/or notified to the np-SAD. These rates should therefore be regarded as minimum rates. (1) Notified after the publication of the np-SAD Annual Report, 2011. (2) The rate per 100,000 population is based on published mid-year population estimates for local government administrative areas for the years in question. (3) Includes updated information submitted in 2011/12.
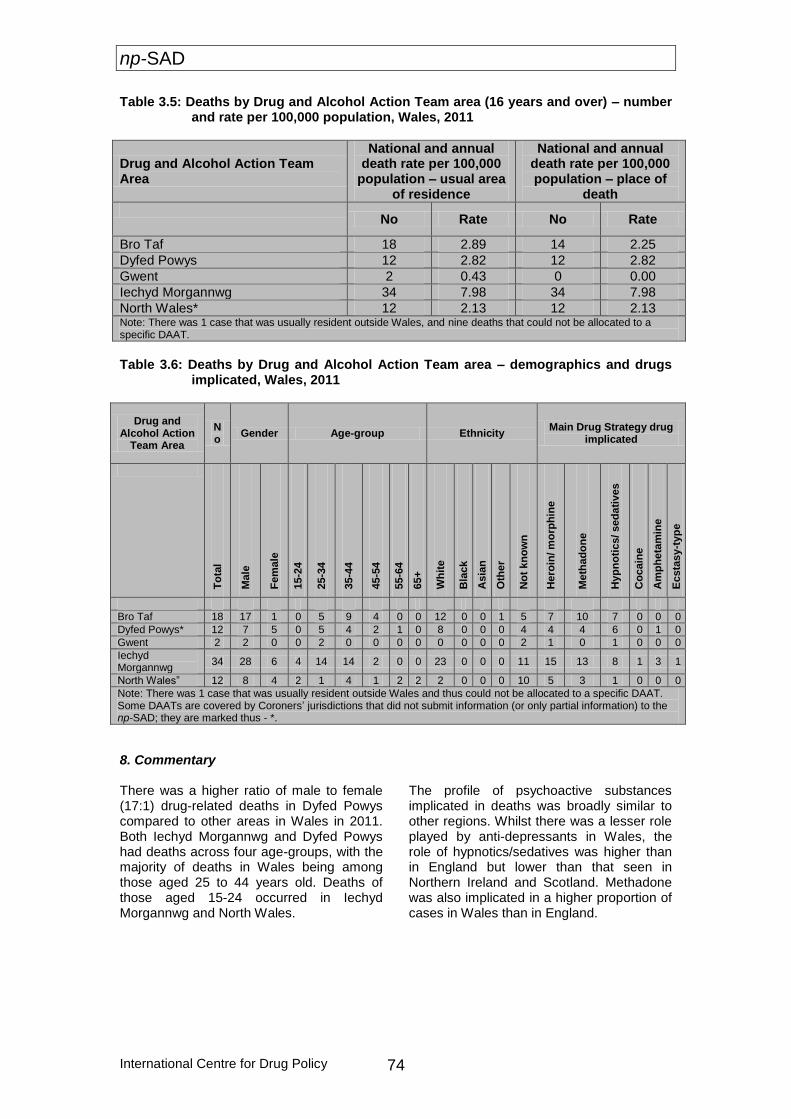
np-SAD
International Centre for Drug Policy 74
Table 3.5: Deaths by Drug and Alcohol Action Team area (16 years and over) – number and rate per 100,000 population, Wales, 2011
Drug and Alcohol Action Team Area
National and annual death rate per 100,000
population – usual area of residence
National and annual death rate per 100,000 population – place of
death
No Rate No Rate
Bro Taf 18 2.89 14 2.25
Dyfed Powys 12 2.82 12 2.82
Gwent 2 0.43 0 0.00
Iechyd Morgannwg 34 7.98 34 7.98
North Wales* 12 2.13 12 2.13 Note: There was 1 case that was usually resident outside Wales, and nine deaths that could not be allocated to a specific DAAT.
Table 3.6: Deaths by Drug and Alcohol Action Team area – demographics and drugs
implicated, Wales, 2011
Drug and Alcohol Action
Team Area
No
Gender Age-group Ethnicity Main Drug Strategy drug
implicated
To
tal
Ma
le
Fe
male
15-2
4
25-3
4
35-4
4
45-5
4
55-6
4
65+
Wh
ite
Bla
ck
Asia
n
Oth
er
No
t kn
ow
n
Hero
in/ m
orp
hin
e
Me
tha
do
ne
Hyp
no
tics/ sed
ati
ves
Co
cain
e
Am
ph
eta
min
e
Ecsta
sy-t
yp
e
Bro Taf 18 17 1 0 5 9 4 0 0 12 0 0 1 5 7 10 7 0 0 0
Dyfed Powys* 12 7 5 0 5 4 2 1 0 8 0 0 0 4 4 4 6 0 1 0
Gwent 2 2 0 0 2 0 0 0 0 0 0 0 0 2 1 0 1 0 0 0
Iechyd Morgannwg
34 28 6 4 14 14 2 0 0 23 0 0 0 11 15 13 8 1 3 1
North Wales” 12 8 4 2 1 4 1 2 2 2 0 0 0 10 5 3 1 0 0 0
Note: There was 1 case that was usually resident outside Wales and thus could not be allocated to a specific DAAT. Some DAATs are covered by Coroners’ jurisdictions that did not submit information (or only partial information) to the np-SAD; they are marked thus - *.
8. Commentary There was a higher ratio of male to female (17:1) drug-related deaths in Dyfed Powys compared to other areas in Wales in 2011. Both Iechyd Morgannwg and Dyfed Powys had deaths across four age-groups, with the majority of deaths in Wales being among those aged 25 to 44 years old. Deaths of those aged 15-24 occurred in Iechyd Morgannwg and North Wales.
The profile of psychoactive substances implicated in deaths was broadly similar to other regions. Whilst there was a lesser role played by anti-depressants in Wales, the role of hypnotics/sedatives was higher than in England but lower than that seen in Northern Ireland and Scotland. Methadone was also implicated in a higher proportion of cases in Wales than in England.

np-SAD
75 International Centre for Drug Policy
Chapter 4: Drug-related deaths in Northern Ireland
This chapter describes the pattern of drug-related deaths in Northern Ireland reported by Coroners and from registrations data supplied by The Northern Ireland Statistics and Research Agency (NISRA) recorded by the General Register Office for Northern Ireland. 1. Demography Notifications of 70 drug-related deaths occurring in 2011 were received from NISRA and Coroners which meet the np-SAD case criteria. The number of such deaths was 71 in 2009 and 72 in 2010 including one 2009 death reported in 2011/12.The number of deaths reported in 2009, 2010 and 2011 has been consistent. In 2011 there was a rate of 4.88 drug-related
deaths per 100,000 population aged 16 years and over, compared with 4.62 in 2009 and 4.94 in 2010. In 2011, 62.9% of cases were male (Table 4.1), and 37.1% were female. Of these 62.9% were unemployed and 50% lived with others. Ethnicity was known in 61 cases with all decedents being White, and in the remaining nine cases ethnicity was not known. Addict status was known in 29/70 cases, 17 (58.6%) of which had a history of dependence or drug use. The median age at death was 42.0 years (interquartile range = 24.5) (Figure 4.1). Over half of the decedents (58.5%) were under the age of 45 years.
Table 4.1: Demographic variables for drug-related deaths reported by NISRA and
Coroners meeting np-SAD criteria, Northern Ireland, 2011
2. Location of death Most fatalities (80%) occurred at a defined residential address (i.e. the deceased’s home address or another private residential address); with 17.1% deaths occurring in hospital and 2.9% elsewhere.
3. Cause(s) of death
Based on the information available from Coroners, 41.4% of cases died from accidental poisoning, 14.2% from intentional self-poisoning, and in 35.7% of cases the intent was undetermined. Of the remaining 6 deaths, 3 were traumatic and 3 were due to other causes.
Variable Category Number (%)
Total 70 (100.0)
Gender Male 44 (62.9)
Female 26 (37.1)
Employment status
Employed 14 (20.0)
Unemployed 44 (62.9)
Childcare/house person 1 (1.4)
Student/pupil 1 (1.4)
Retired/sickness/invalidity 6 (8.6)
Not known 4 (5.7)
Living arrangements
Alone 31 (44.3)
With others 35 (50.0)
Other 1 (1.4)
Not known 3 (4.3)
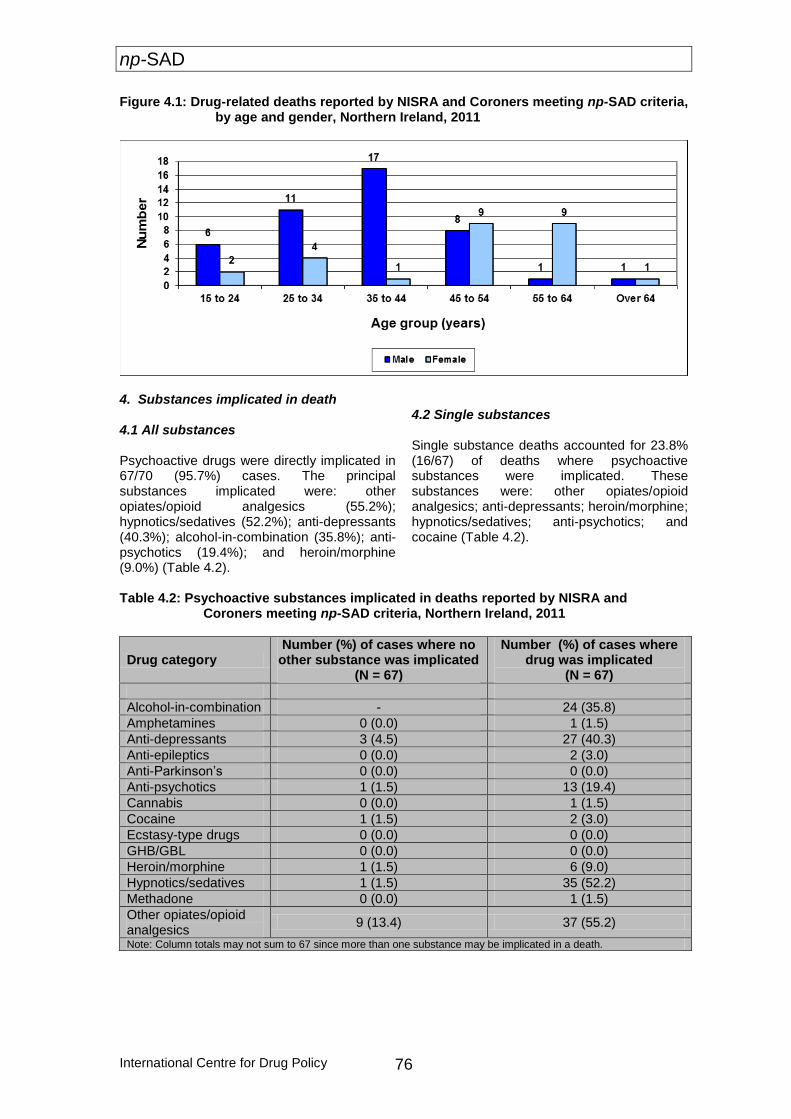
np-SAD
International Centre for Drug Policy 76
Figure 4.1: Drug-related deaths reported by NISRA and Coroners meeting np-SAD criteria, by age and gender, Northern Ireland, 2011
4. Substances implicated in death 4.1 All substances Psychoactive drugs were directly implicated in 67/70 (95.7%) cases. The principal substances implicated were: other opiates/opioid analgesics (55.2%); hypnotics/sedatives (52.2%); anti-depressants (40.3%); alcohol-in-combination (35.8%); anti-psychotics (19.4%); and heroin/morphine (9.0%) (Table 4.2).
4.2 Single substances Single substance deaths accounted for 23.8% (16/67) of deaths where psychoactive substances were implicated. These substances were: other opiates/opioid analgesics; anti-depressants; heroin/morphine; hypnotics/sedatives; anti-psychotics; and cocaine (Table 4.2).
Table 4.2: Psychoactive substances implicated in deaths reported by NISRA and
Coroners meeting np-SAD criteria, Northern Ireland, 2011
Drug category Number (%) of cases where no
other substance was implicated (N = 67)
Number (%) of cases where drug was implicated
(N = 67)
Alcohol-in-combination - 24 (35.8)
Amphetamines 0 (0.0) 1 (1.5)
Anti-depressants 3 (4.5) 27 (40.3)
Anti-epileptics 0 (0.0) 2 (3.0)
Anti-Parkinson’s 0 (0.0) 0 (0.0)
Anti-psychotics 1 (1.5) 13 (19.4)
Cannabis 0 (0.0) 1 (1.5)
Cocaine 1 (1.5) 2 (3.0)
Ecstasy-type drugs 0 (0.0) 0 (0.0)
GHB/GBL 0 (0.0) 0 (0.0)
Heroin/morphine 1 (1.5) 6 (9.0)
Hypnotics/sedatives 1 (1.5) 35 (52.2)
Methadone 0 (0.0) 1 (1.5)
Other opiates/opioid analgesics
9 (13.4) 37 (55.2)
Note: Column totals may not sum to 67 since more than one substance may be implicated in a death.
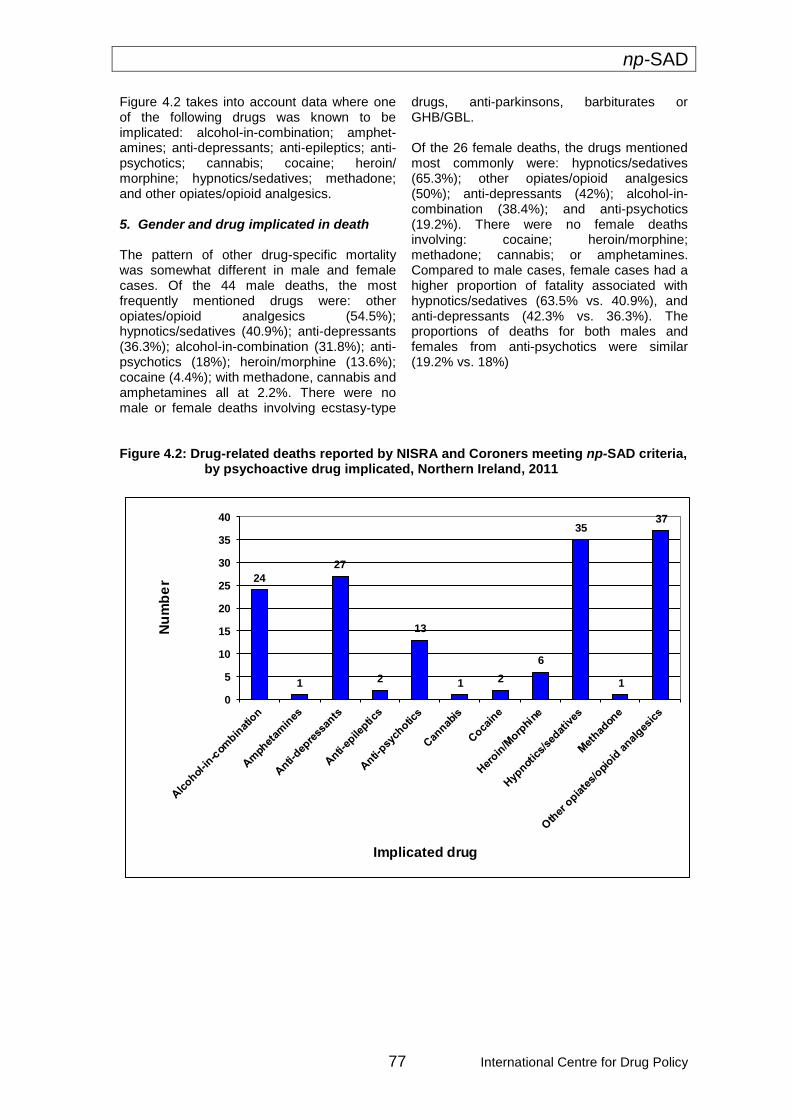
np-SAD
77 International Centre for Drug Policy
Figure 4.2 takes into account data where one of the following drugs was known to be implicated: alcohol-in-combination; amphet-amines; anti-depressants; anti-epileptics; anti-psychotics; cannabis; cocaine; heroin/ morphine; hypnotics/sedatives; methadone; and other opiates/opioid analgesics. 5. Gender and drug implicated in death The pattern of other drug-specific mortality was somewhat different in male and female cases. Of the 44 male deaths, the most frequently mentioned drugs were: other opiates/opioid analgesics (54.5%); hypnotics/sedatives (40.9%); anti-depressants (36.3%); alcohol-in-combination (31.8%); anti-psychotics (18%); heroin/morphine (13.6%); cocaine (4.4%); with methadone, cannabis and amphetamines all at 2.2%. There were no male or female deaths involving ecstasy-type
drugs, anti-parkinsons, barbiturates or GHB/GBL. Of the 26 female deaths, the drugs mentioned most commonly were: hypnotics/sedatives (65.3%); other opiates/opioid analgesics (50%); anti-depressants (42%); alcohol-in-combination (38.4%); and anti-psychotics (19.2%). There were no female deaths involving: cocaine; heroin/morphine; methadone; cannabis; or amphetamines. Compared to male cases, female cases had a higher proportion of fatality associated with hypnotics/sedatives (63.5% vs. 40.9%), and anti-depressants (42.3% vs. 36.3%). The proportions of deaths for both males and females from anti-psychotics were similar (19.2% vs. 18%)
Figure 4.2: Drug-related deaths reported by NISRA and Coroners meeting np-SAD criteria,
by psychoactive drug implicated, Northern Ireland, 2011
24
1
27
2
13
1 2
6
35
1
37
0
5
10
15
20
25
30
35
40
Nu
mb
er
Implicated drug
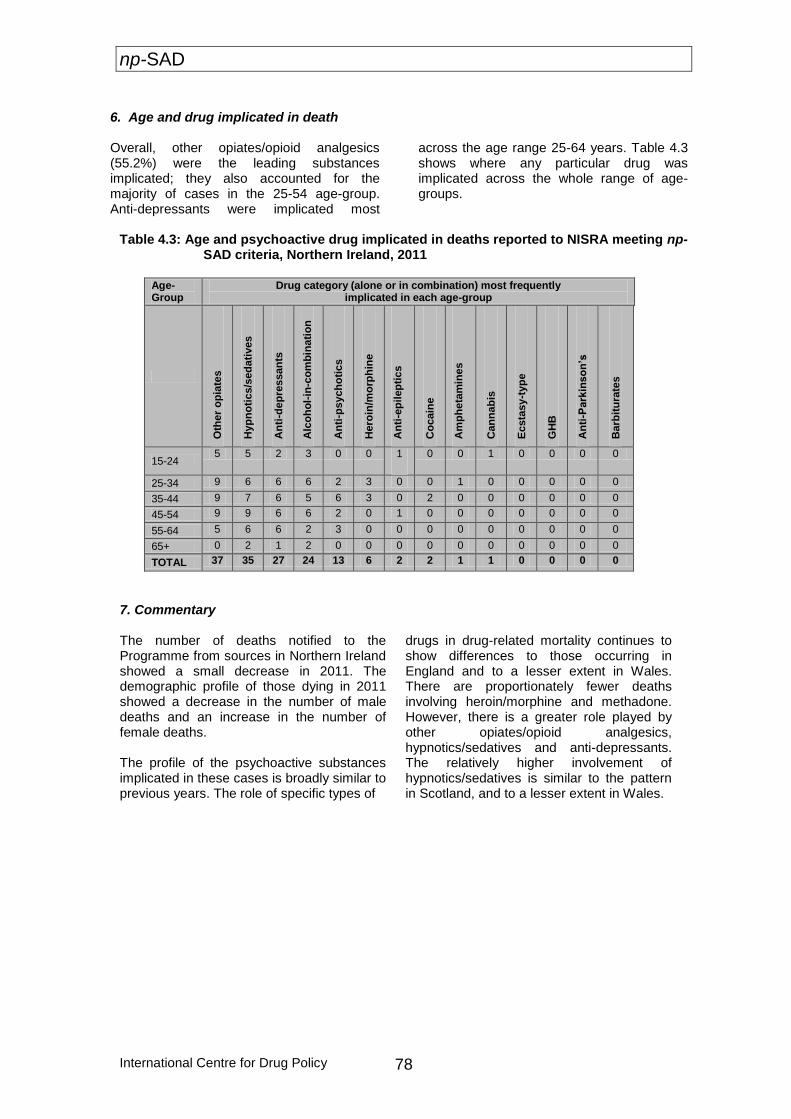
np-SAD
International Centre for Drug Policy 78
6. Age and drug implicated in death
Overall, other opiates/opioid analgesics (55.2%) were the leading substances implicated; they also accounted for the majority of cases in the 25-54 age-group. Anti-depressants were implicated most
across the age range 25-64 years. Table 4.3 shows where any particular drug was implicated across the whole range of age-groups.
Table 4.3: Age and psychoactive drug implicated in deaths reported to NISRA meeting np-
SAD criteria, Northern Ireland, 2011
Age-Group
Drug category (alone or in combination) most frequently implicated in each age-group
Oth
er
op
iate
s
Hyp
no
tics/s
ed
ati
ves
An
ti-d
ep
ressan
ts
Alc
oh
ol-
in-c
om
bin
ati
on
An
ti-p
sych
oti
cs
Hero
in/m
orp
hin
e
An
ti-e
pil
ep
tics
Co
cain
e
Am
ph
eta
min
es
Can
na
bis
Ecsta
sy-t
yp
e
GH
B
An
ti-P
ark
inso
n’s
Barb
itu
rate
s
15-24 5 5 2 3 0 0 1 0 0 1 0 0 0 0
25-34 9 6 6 6 2 3 0 0 1 0 0 0 0 0
35-44 9 7 6 5 6 3 0 2 0 0 0 0 0 0
45-54 9 9 6 6 2 0 1 0 0 0 0 0 0 0
55-64 5 6 6 2 3 0 0 0 0 0 0 0 0 0
65+ 0 2 1 2 0 0 0 0 0 0 0 0 0 0
TOTAL 37 35 27 24 13 6 2 2 1 1 0 0 0 0
7. Commentary The number of deaths notified to the Programme from sources in Northern Ireland showed a small decrease in 2011. The demographic profile of those dying in 2011 showed a decrease in the number of male deaths and an increase in the number of female deaths. The profile of the psychoactive substances implicated in these cases is broadly similar to previous years. The role of specific types of
drugs in drug-related mortality continues to show differences to those occurring in England and to a lesser extent in Wales. There are proportionately fewer deaths involving heroin/morphine and methadone. However, there is a greater role played by other opiates/opioid analgesics, hypnotics/sedatives and anti-depressants. The relatively higher involvement of hypnotics/sedatives is similar to the pattern in Scotland, and to a lesser extent in Wales.

np-SAD
79 International Centre for Drug Policy
Chapter 5: Drug-related deaths in Scotland This chapter describes the pattern of drug-related deaths in Scotland. The Scottish Crime and Drug Enforcement Agency (SCDEA) on behalf of the Association of Chief Police Officers in Scotland (ACPOS) collates data on drug-related deaths obtained from Scottish police forces. These data are used to populate a police/SCDEA national database which is maintained by the SCDEA. As such the data supplied to the SCDEA remain the property of the submitting force that is also responsible for its accuracy and submission to the database. Drug-related death cases are those that meet the definition used by the Association of Chief Police Officers (Scotland) – “where there is prima facie evidence of a fatal overdose of controlled drugs. Such evidence would be recent drug misuse, for example controlled drugs and/or a hypodermic syringe found in close proximity to the body and/or the person is known to the police as a drug misuser although not necessarily a notified addict.” Thus, most suicides in Scotland are excluded. Figures for “drug misuse” deaths registered in 2011 have been published by the National Records of Scotland (NRS, 2012). 1. Demography Notifications of 336 drug-related deaths occurring in 2011 were received by the SCDEA, covering the following police force areas: Central Scotland (3.3%); Dumfries & Galloway (2.4%); Fife (4.8%); Grampian (14.3%); Lothian & Borders (29.1%); Northern (6.5%); Strathclyde (30.4%); and Tayside (9.2%). This represents a fall of 7.9% compared to 2010 (365 cases). The majority (79%) of cases were male (Table 5.1). The median age at death was 35.6 years (interquartile range = 12.4) (Figure 4.1). Most cases (86%) were under 45 years. Where ethnicity was known, all were White.
2. Location of death In line with data protection, the SCDEA database structure does not record information on living arrangements and place of death. Where such information was available (from external sources – 65 cases), 86% died at a defined residential address, and 11% in hospital. 3. Cause(s) of death Most of the fatalities (94.9%) were considered to be accidental (i.e. clearly non-deliberate) poisoning; this reflects the definition being used by Scottish police. Intentional poisonings accounted for 2.7% and deaths caused by mental disorders due to psychoactive substances (1.5%) accounted for most of the remaining cases. 4. Substances implicated in death 4.1 All substances Psychoactive drugs were not directly implicated in only 0.9% of cases (n = 3). Of the remaining 333 cases, the principal substances implicated were: methadone (49%); heroin/morphine (41%); hypnotics/sedatives (35%); other opiates/ opioid analgesics (23%); alcohol-in-combination with other substances (21%); and cocaine (8%) (Table 5.2). Figure 4.2 takes into account data where one of the following drugs was known to be implicated: alcohol-in-combination; amphetamines, anti-depressants; cocaine; ecstasy-type drugs; heroin/morphine; methadone; hypnotics/ sedatives; or other opiates/opioid analgesics. 4.2 Single substances The following substances, as the sole implicated drug, accounted for 117 (35%) deaths: heroin/morphine (14%); methadone (14%); other opiates/opioid analgesics (3%); ecstasy-type (2%); amphetamines (<1%); cocaine (<1%) and hypnotics/sedatives (<1%) (Table 5.2).
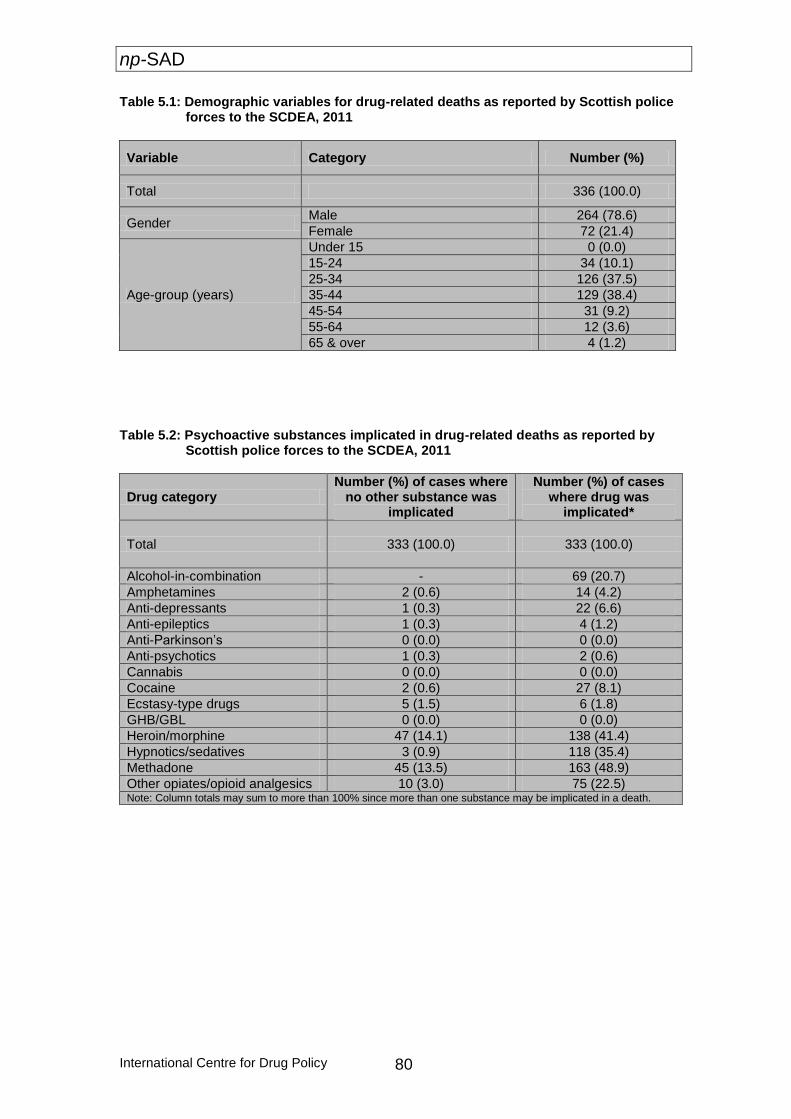
np-SAD
International Centre for Drug Policy 80
Table 5.1: Demographic variables for drug-related deaths as reported by Scottish police forces to the SCDEA, 2011
Table 5.2: Psychoactive substances implicated in drug-related deaths as reported by
Scottish police forces to the SCDEA, 2011
Drug category Number (%) of cases where
no other substance was implicated
Number (%) of cases where drug was
implicated*
Total 333 (100.0) 333 (100.0)
Alcohol-in-combination - 69 (20.7)
Amphetamines 2 (0.6) 14 (4.2)
Anti-depressants 1 (0.3) 22 (6.6)
Anti-epileptics 1 (0.3) 4 (1.2)
Anti-Parkinson’s 0 (0.0) 0 (0.0)
Anti-psychotics 1 (0.3) 2 (0.6)
Cannabis 0 (0.0) 0 (0.0)
Cocaine 2 (0.6) 27 (8.1)
Ecstasy-type drugs 5 (1.5) 6 (1.8)
GHB/GBL 0 (0.0) 0 (0.0)
Heroin/morphine 47 (14.1) 138 (41.4)
Hypnotics/sedatives 3 (0.9) 118 (35.4)
Methadone 45 (13.5) 163 (48.9)
Other opiates/opioid analgesics 10 (3.0) 75 (22.5) Note: Column totals may sum to more than 100% since more than one substance may be implicated in a death.
Variable Category Number (%)
Total 336 (100.0)
Gender Male 264 (78.6)
Female 72 (21.4)
Age-group (years)
Under 15 0 (0.0)
15-24 34 (10.1)
25-34 126 (37.5)
35-44 129 (38.4)
45-54 31 (9.2)
55-64 12 (3.6)
65 & over 4 (1.2)
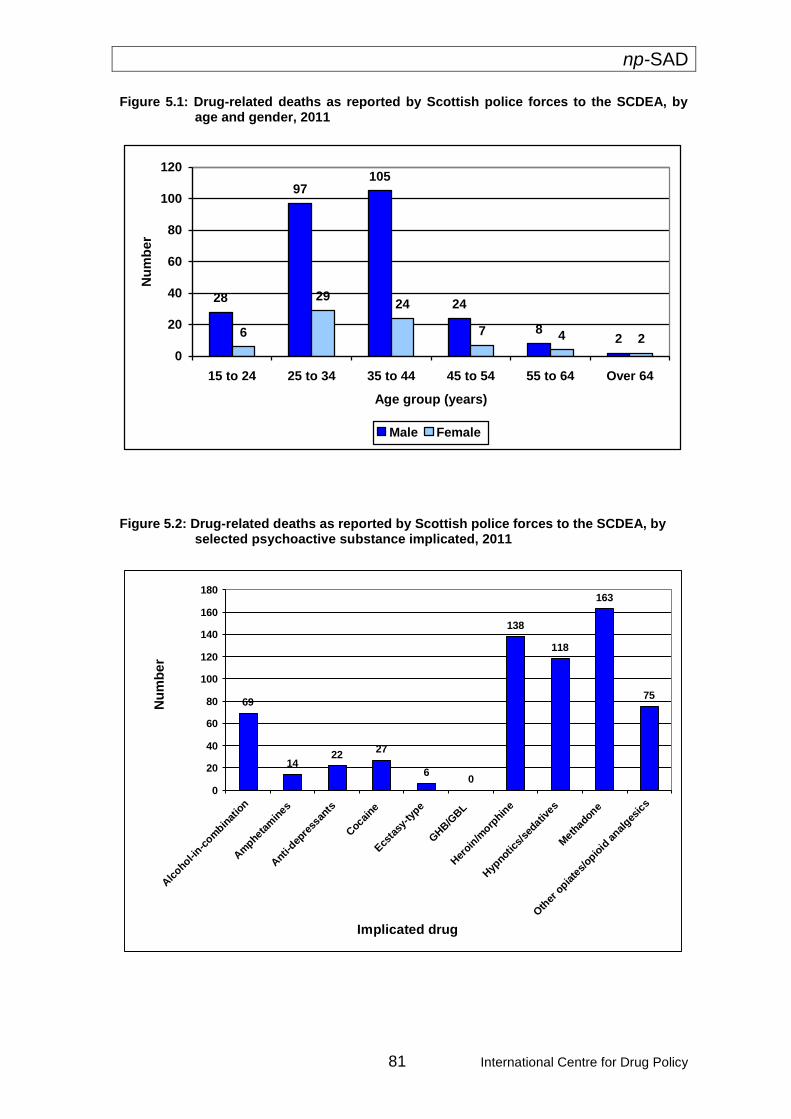
np-SAD
81 International Centre for Drug Policy
Figure 5.1: Drug-related deaths as reported by Scottish police forces to the SCDEA, by age and gender, 2011
28
97105
24
82
6
2924
7 4 2
0
20
40
60
80
100
120
15 to 24 25 to 34 35 to 44 45 to 54 55 to 64 Over 64
Age group (years)
Nu
mb
er
Male Female
Figure 5.2: Drug-related deaths as reported by Scottish police forces to the SCDEA, by selected psychoactive substance implicated, 2011
69
1422
27
60
138
118
163
75
0
20
40
60
80
100
120
140
160
180
Alc
ohol-in-c
ombin
atio
n
Am
phetam
ines
Anti-
depre
ssan
ts
Cocai
ne
Ecs
tasy
-typ
e
GHB/G
BL
Her
oin/m
orphin
e
Hyp
notics/
sedativ
es
Meth
adone
Oth
er o
piate
s/opio
id a
nalges
ics
Implicated drug
Nu
mb
er
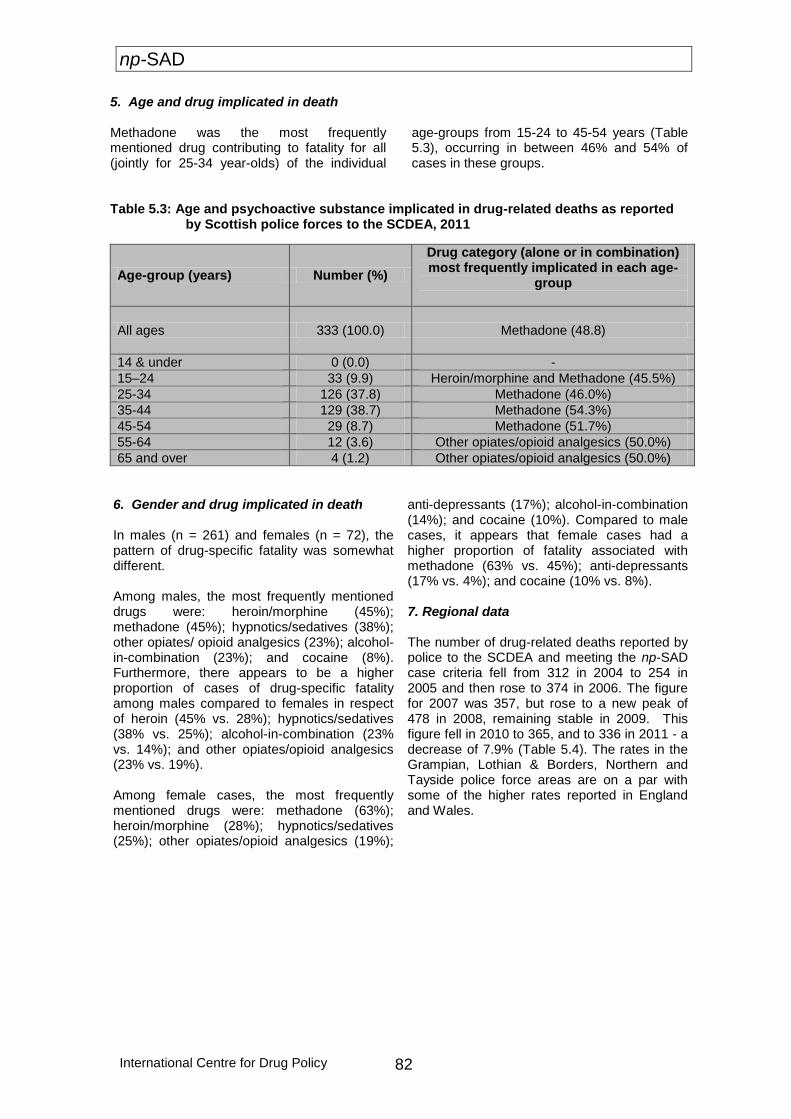
np-SAD
International Centre for Drug Policy 82
5. Age and drug implicated in death
Methadone was the most frequently mentioned drug contributing to fatality for all (jointly for 25-34 year-olds) of the individual
age-groups from 15-24 to 45-54 years (Table 5.3), occurring in between 46% and 54% of cases in these groups.
Table 5.3: Age and psychoactive substance implicated in drug-related deaths as reported
by Scottish police forces to the SCDEA, 2011
Age-group (years) Number (%)
Drug category (alone or in combination) most frequently implicated in each age-
group
All ages 333 (100.0) Methadone (48.8)
14 & under 0 (0.0) -
15–24 33 (9.9) Heroin/morphine and Methadone (45.5%)
25-34 126 (37.8) Methadone (46.0%)
35-44 129 (38.7) Methadone (54.3%)
45-54 29 (8.7) Methadone (51.7%)
55-64 12 (3.6) Other opiates/opioid analgesics (50.0%)
65 and over 4 (1.2) Other opiates/opioid analgesics (50.0%)
6. Gender and drug implicated in death In males (n = 261) and females (n = 72), the pattern of drug-specific fatality was somewhat different. Among males, the most frequently mentioned drugs were: heroin/morphine (45%); methadone (45%); hypnotics/sedatives (38%); other opiates/ opioid analgesics (23%); alcohol-in-combination (23%); and cocaine (8%). Furthermore, there appears to be a higher proportion of cases of drug-specific fatality among males compared to females in respect of heroin (45% vs. 28%); hypnotics/sedatives (38% vs. 25%); alcohol-in-combination (23% vs. 14%); and other opiates/opioid analgesics (23% vs. 19%). Among female cases, the most frequently mentioned drugs were: methadone (63%); heroin/morphine (28%); hypnotics/sedatives (25%); other opiates/opioid analgesics (19%);
anti-depressants (17%); alcohol-in-combination (14%); and cocaine (10%). Compared to male cases, it appears that female cases had a higher proportion of fatality associated with methadone (63% vs. 45%); anti-depressants (17% vs. 4%); and cocaine (10% vs. 8%). 7. Regional data The number of drug-related deaths reported by police to the SCDEA and meeting the np-SAD case criteria fell from 312 in 2004 to 254 in 2005 and then rose to 374 in 2006. The figure for 2007 was 357, but rose to a new peak of 478 in 2008, remaining stable in 2009. This figure fell in 2010 to 365, and to 336 in 2011 - a decrease of 7.9% (Table 5.4). The rates in the Grampian, Lothian & Borders, Northern and Tayside police force areas are on a par with some of the higher rates reported in England and Wales.
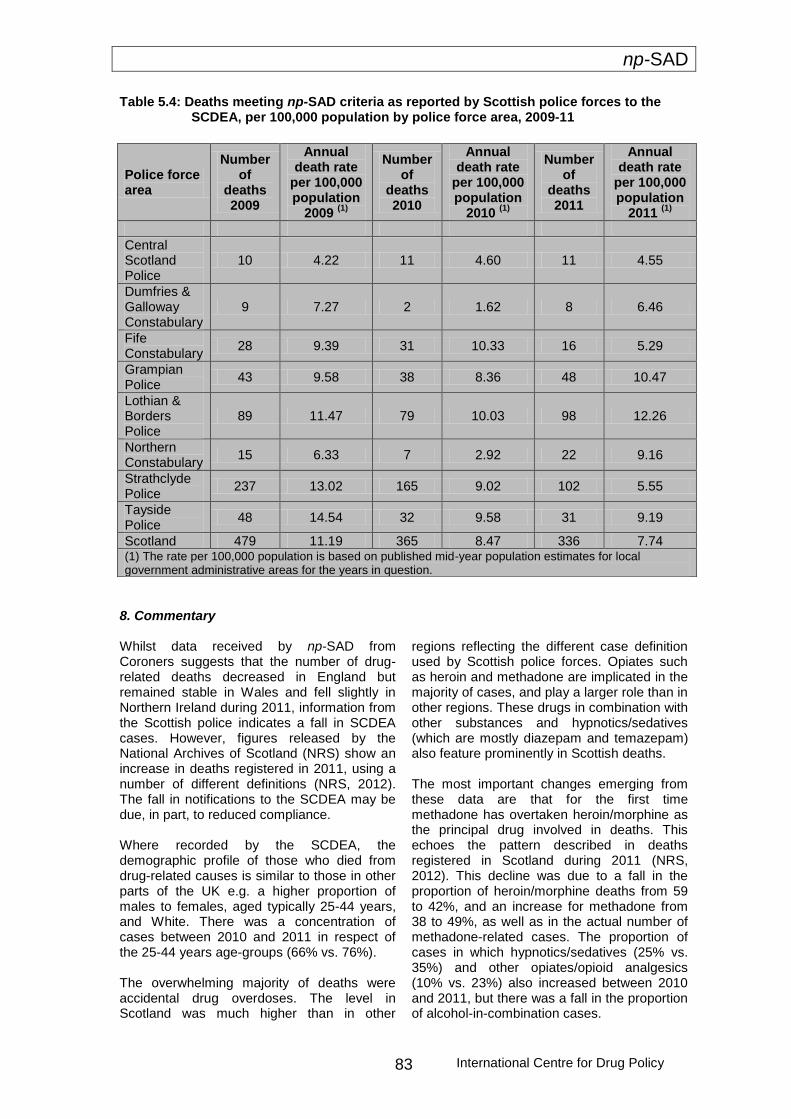
np-SAD
International Centre for Drug Policy 83
Table 5.4: Deaths meeting np-SAD criteria as reported by Scottish police forces to the SCDEA, per 100,000 population by police force area, 2009-11
8. Commentary Whilst data received by np-SAD from Coroners suggests that the number of drug-related deaths decreased in England but remained stable in Wales and fell slightly in Northern Ireland during 2011, information from the Scottish police indicates a fall in SCDEA cases. However, figures released by the National Archives of Scotland (NRS) show an increase in deaths registered in 2011, using a number of different definitions (NRS, 2012). The fall in notifications to the SCDEA may be due, in part, to reduced compliance. Where recorded by the SCDEA, the demographic profile of those who died from drug-related causes is similar to those in other parts of the UK e.g. a higher proportion of males to females, aged typically 25-44 years, and White. There was a concentration of cases between 2010 and 2011 in respect of the 25-44 years age-groups (66% vs. 76%). The overwhelming majority of deaths were accidental drug overdoses. The level in Scotland was much higher than in other
regions reflecting the different case definition used by Scottish police forces. Opiates such as heroin and methadone are implicated in the majority of cases, and play a larger role than in other regions. These drugs in combination with other substances and hypnotics/sedatives (which are mostly diazepam and temazepam) also feature prominently in Scottish deaths. The most important changes emerging from these data are that for the first time methadone has overtaken heroin/morphine as the principal drug involved in deaths. This echoes the pattern described in deaths registered in Scotland during 2011 (NRS, 2012). This decline was due to a fall in the proportion of heroin/morphine deaths from 59 to 42%, and an increase for methadone from 38 to 49%, as well as in the actual number of methadone-related cases. The proportion of cases in which hypnotics/sedatives (25% vs. 35%) and other opiates/opioid analgesics (10% vs. 23%) also increased between 2010 and 2011, but there was a fall in the proportion of alcohol-in-combination cases.
Police force area
Number of
deaths 2009
Annual death rate
per 100,000 population
2009 (1)
Number of
deaths 2010
Annual death rate
per 100,000 population
2010 (1)
Number of
deaths 2011
Annual death rate
per 100,000 population
2011 (1)
Central Scotland Police
10 4.22 11 4.60 11 4.55
Dumfries & Galloway Constabulary
9 7.27 2 1.62 8 6.46
Fife Constabulary
28 9.39 31 10.33 16 5.29
Grampian Police
43 9.58 38 8.36 48 10.47
Lothian & Borders Police
89 11.47 79 10.03 98 12.26
Northern Constabulary
15 6.33 7 2.92 22 9.16
Strathclyde Police
237 13.02 165 9.02 102 5.55
Tayside Police
48 14.54 32 9.58 31 9.19
Scotland 479 11.19 365 8.47 336 7.74 (1) The rate per 100,000 population is based on published mid-year population estimates for local government administrative areas for the years in question.
np-SAD
International Centre for Drug Policy 84
These changes may be due, in part, to the heroin ‘drought’ of 2010-11 (Simonson and Daly, 2011; EMCDDA, 2011; Lidell, 2012), which particularly affected Strathclyde where there was a noticeable decline in the number
of deaths notified to the police. The overall purity of heroin available on the streets also generally fell during this period, to record low levels (SCDEA, 2012:11).
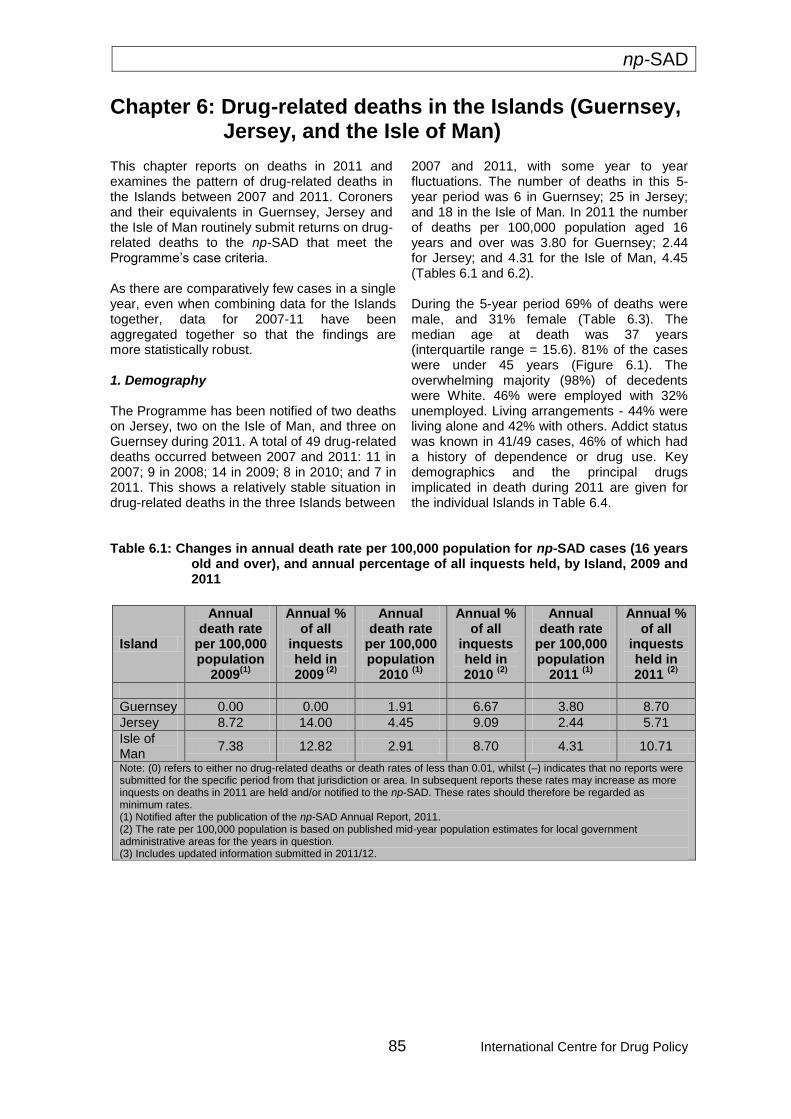
np-SAD
85 International Centre for Drug Policy
Chapter 6: Drug-related deaths in the Islands (Guernsey, Jersey, and the Isle of Man)
This chapter reports on deaths in 2011 and examines the pattern of drug-related deaths in the Islands between 2007 and 2011. Coroners and their equivalents in Guernsey, Jersey and the Isle of Man routinely submit returns on drug-related deaths to the np-SAD that meet the Programme’s case criteria.
As there are comparatively few cases in a single year, even when combining data for the Islands together, data for 2007-11 have been aggregated together so that the findings are more statistically robust.
1. Demography
The Programme has been notified of two deaths on Jersey, two on the Isle of Man, and three on Guernsey during 2011. A total of 49 drug-related deaths occurred between 2007 and 2011: 11 in 2007; 9 in 2008; 14 in 2009; 8 in 2010; and 7 in 2011. This shows a relatively stable situation in drug-related deaths in the three Islands between
2007 and 2011, with some year to year fluctuations. The number of deaths in this 5-year period was 6 in Guernsey; 25 in Jersey; and 18 in the Isle of Man. In 2011 the number of deaths per 100,000 population aged 16 years and over was 3.80 for Guernsey; 2.44 for Jersey; and 4.31 for the Isle of Man, 4.45 (Tables 6.1 and 6.2).
During the 5-year period 69% of deaths were male, and 31% female (Table 6.3). The median age at death was 37 years (interquartile range = 15.6). 81% of the cases were under 45 years (Figure 6.1). The overwhelming majority (98%) of decedents were White. 46% were employed with 32% unemployed. Living arrangements - 44% were living alone and 42% with others. Addict status was known in 41/49 cases, 46% of which had a history of dependence or drug use. Key demographics and the principal drugs implicated in death during 2011 are given for the individual Islands in Table 6.4.
Table 6.1: Changes in annual death rate per 100,000 population for np-SAD cases (16 years
old and over), and annual percentage of all inquests held, by Island, 2009 and 2011
Island
Annual death rate
per 100,000 population
2009(1)
Annual % of all
inquests held in 2009
(2)
Annual death rate
per 100,000 population
2010 (1)
Annual % of all
inquests held in 2010
(2)
Annual death rate
per 100,000 population
2011 (1)
Annual % of all
inquests held in 2011
(2)
Guernsey 0.00 0.00 1.91 6.67 3.80 8.70
Jersey 8.72 14.00 4.45 9.09 2.44 5.71
Isle of Man
7.38 12.82 2.91 8.70 4.31 10.71
Note: (0) refers to either no drug-related deaths or death rates of less than 0.01, whilst (–) indicates that no reports were submitted for the specific period from that jurisdiction or area. In subsequent reports these rates may increase as more inquests on deaths in 2011 are held and/or notified to the np-SAD. These rates should therefore be regarded as minimum rates. (1) Notified after the publication of the np-SAD Annual Report, 2011. (2) The rate per 100,000 population is based on published mid-year population estimates for local government administrative areas for the years in question. (3) Includes updated information submitted in 2011/12.
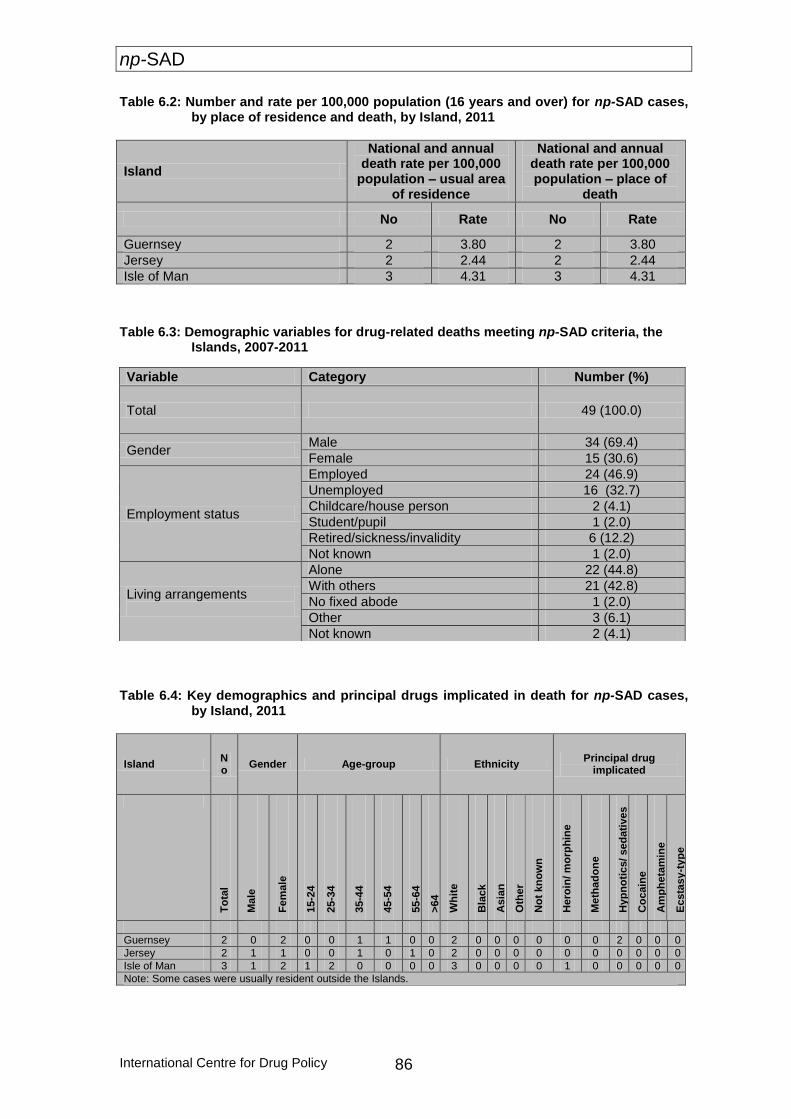
np-SAD
International Centre for Drug Policy 86
Table 6.2: Number and rate per 100,000 population (16 years and over) for np-SAD cases, by place of residence and death, by Island, 2011
Island
National and annual death rate per 100,000
population – usual area of residence
National and annual death rate per 100,000 population – place of
death
No Rate No Rate
Guernsey 2 3.80 2 3.80
Jersey 2 2.44 2 2.44
Isle of Man 3 4.31 3 4.31
Table 6.3: Demographic variables for drug-related deaths meeting np-SAD criteria, the
Islands, 2007-2011
Table 6.4: Key demographics and principal drugs implicated in death for np-SAD cases,
by Island, 2011
Island No
Gender Age-group Ethnicity Principal drug
implicated
To
tal
Ma
le
Fe
male
15-2
4
25-3
4
35-4
4
45-5
4
55-6
4
>64
Wh
ite
Bla
ck
Asia
n
Oth
er
No
t kn
ow
n
Hero
in/ m
orp
hin
e
Me
tha
do
ne
Hyp
no
tics/
sed
ati
ves
Co
cain
e
Am
ph
eta
min
e
Ecsta
sy
-typ
e
Guernsey 2 0 2 0 0 1 1 0 0 2 0 0 0 0 0 0 2 0 0 0
Jersey 2 1 1 0 0 1 0 1 0 2 0 0 0 0 0 0 0 0 0 0
Isle of Man 3 1 2 1 2 0 0 0 0 3 0 0 0 0 1 0 0 0 0 0
Note: Some cases were usually resident outside the Islands.
Variable Category Number (%)
Total 49 (100.0)
Gender Male 34 (69.4)
Female 15 (30.6)
Employment status
Employed 24 (46.9)
Unemployed 16 (32.7)
Childcare/house person 2 (4.1)
Student/pupil 1 (2.0)
Retired/sickness/invalidity 6 (12.2)
Not known 1 (2.0)
Living arrangements
Alone 22 (44.8)
With others 21 (42.8)
No fixed abode 1 (2.0)
Other 3 (6.1)
Not known 2 (4.1)
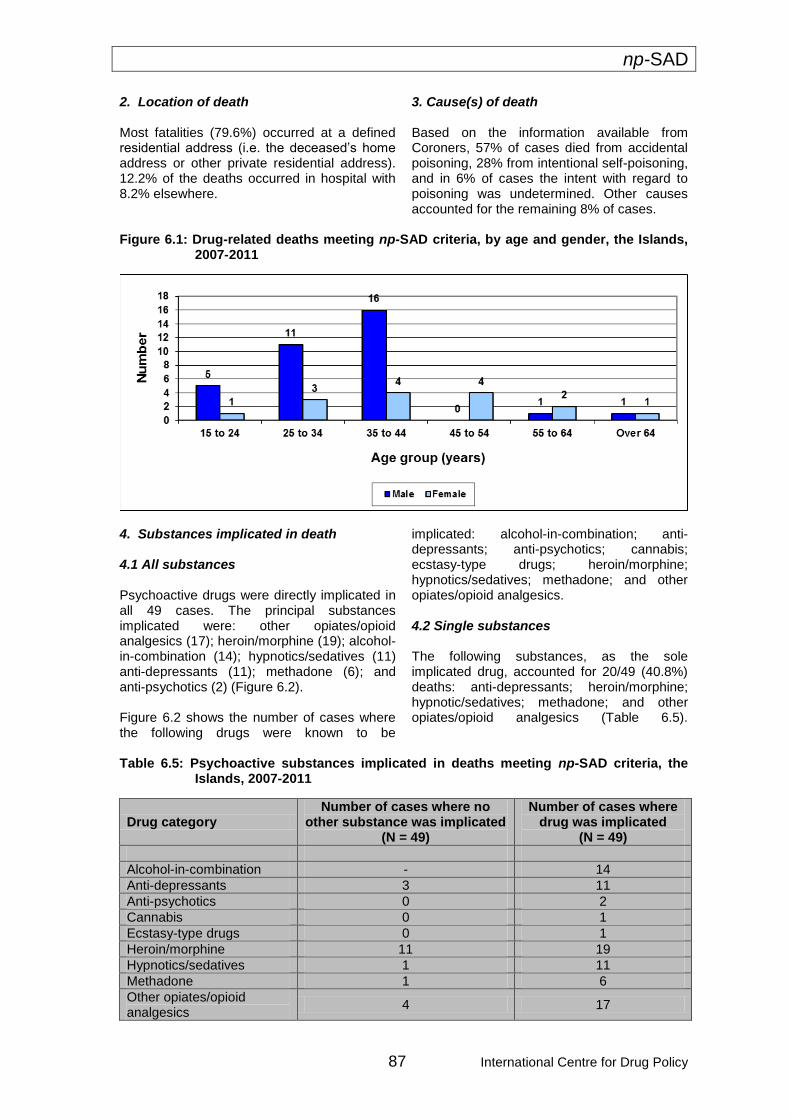
np-SAD
87 International Centre for Drug Policy
2. Location of death Most fatalities (79.6%) occurred at a defined residential address (i.e. the deceased’s home address or other private residential address). 12.2% of the deaths occurred in hospital with 8.2% elsewhere.
3. Cause(s) of death
Based on the information available from Coroners, 57% of cases died from accidental poisoning, 28% from intentional self-poisoning, and in 6% of cases the intent with regard to poisoning was undetermined. Other causes accounted for the remaining 8% of cases.
Figure 6.1: Drug-related deaths meeting np-SAD criteria, by age and gender, the Islands,
2007-2011
4. Substances implicated in death 4.1 All substances Psychoactive drugs were directly implicated in all 49 cases. The principal substances implicated were: other opiates/opioid analgesics (17); heroin/morphine (19); alcohol-in-combination (14); hypnotics/sedatives (11) anti-depressants (11); methadone (6); and anti-psychotics (2) (Figure 6.2). Figure 6.2 shows the number of cases where the following drugs were known to be
implicated: alcohol-in-combination; anti-depressants; anti-psychotics; cannabis; ecstasy-type drugs; heroin/morphine; hypnotics/sedatives; methadone; and other opiates/opioid analgesics. 4.2 Single substances The following substances, as the sole implicated drug, accounted for 20/49 (40.8%) deaths: anti-depressants; heroin/morphine; hypnotic/sedatives; methadone; and other opiates/opioid analgesics (Table 6.5).
Table 6.5: Psychoactive substances implicated in deaths meeting np-SAD criteria, the Islands, 2007-2011
Drug category Number of cases where no
other substance was implicated (N = 49)
Number of cases where drug was implicated
(N = 49)
Alcohol-in-combination - 14
Anti-depressants 3 11
Anti-psychotics 0 2
Cannabis 0 1
Ecstasy-type drugs 0 1
Heroin/morphine 11 19
Hypnotics/sedatives 1 11
Methadone 1 6
Other opiates/opioid analgesics
4 17
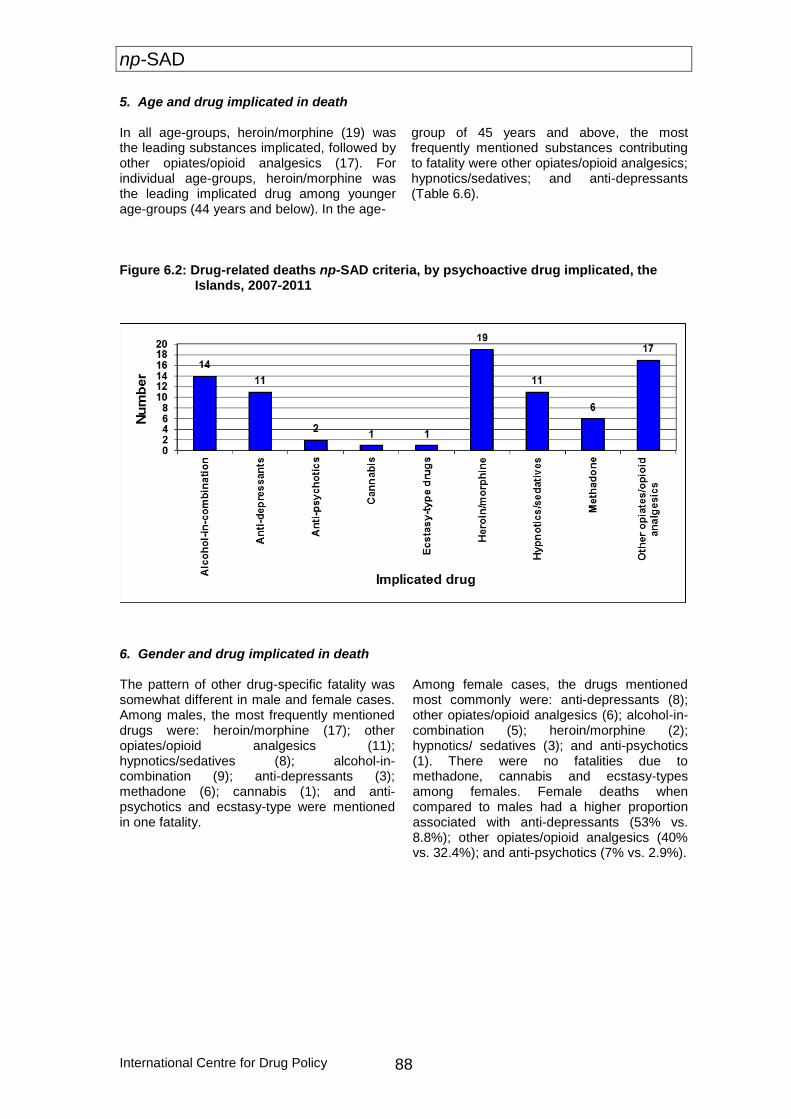
np-SAD
International Centre for Drug Policy 88
5. Age and drug implicated in death
In all age-groups, heroin/morphine (19) was the leading substances implicated, followed by other opiates/opioid analgesics (17). For individual age-groups, heroin/morphine was the leading implicated drug among younger age-groups (44 years and below). In the age-
group of 45 years and above, the most frequently mentioned substances contributing to fatality were other opiates/opioid analgesics; hypnotics/sedatives; and anti-depressants (Table 6.6).
Figure 6.2: Drug-related deaths np-SAD criteria, by psychoactive drug implicated, the
Islands, 2007-2011
6. Gender and drug implicated in death The pattern of other drug-specific fatality was somewhat different in male and female cases. Among males, the most frequently mentioned drugs were: heroin/morphine (17); other opiates/opioid analgesics (11); hypnotics/sedatives (8); alcohol-in-combination (9); anti-depressants (3); methadone (6); cannabis (1); and anti-psychotics and ecstasy-type were mentioned in one fatality.
Among female cases, the drugs mentioned most commonly were: anti-depressants (8); other opiates/opioid analgesics (6); alcohol-in-combination (5); heroin/morphine (2); hypnotics/ sedatives (3); and anti-psychotics (1). There were no fatalities due to methadone, cannabis and ecstasy-types among females. Female deaths when compared to males had a higher proportion associated with anti-depressants (53% vs. 8.8%); other opiates/opioid analgesics (40% vs. 32.4%); and anti-psychotics (7% vs. 2.9%).
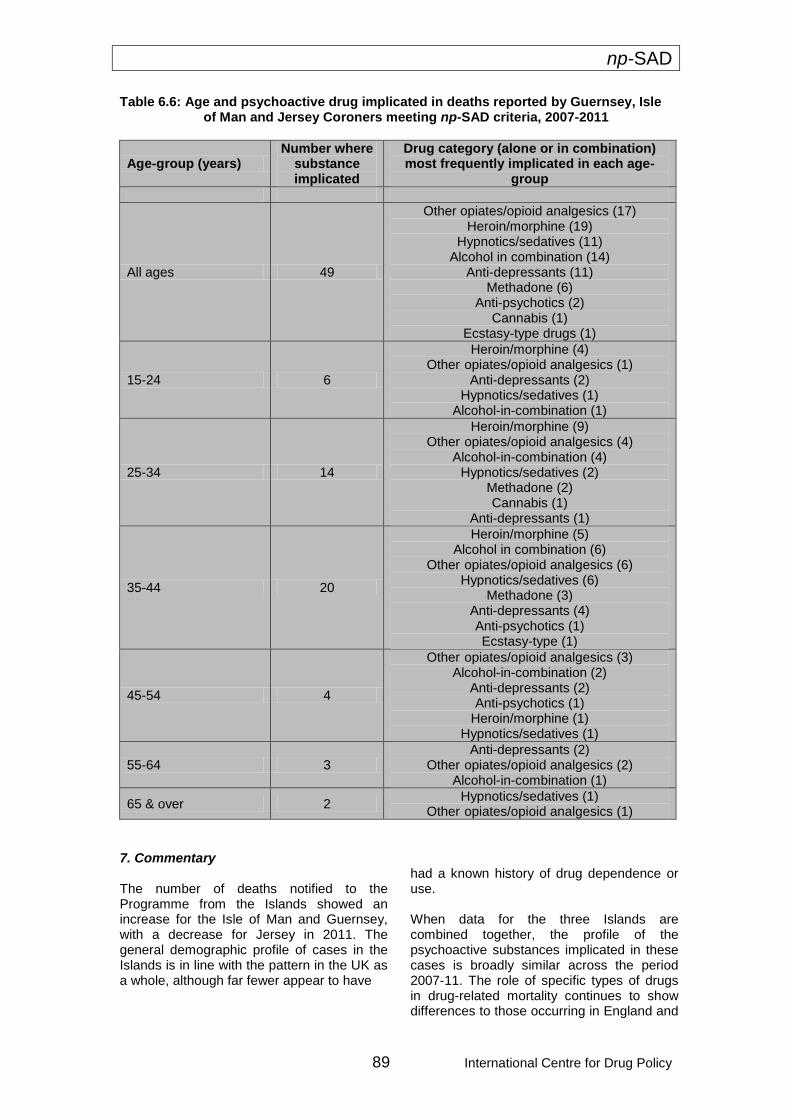
np-SAD
89 International Centre for Drug Policy
Table 6.6: Age and psychoactive drug implicated in deaths reported by Guernsey, Isle of Man and Jersey Coroners meeting np-SAD criteria, 2007-2011
Age-group (years) Number where
substance implicated
Drug category (alone or in combination) most frequently implicated in each age-
group
All ages 49
Other opiates/opioid analgesics (17) Heroin/morphine (19)
Hypnotics/sedatives (11) Alcohol in combination (14)
Anti-depressants (11) Methadone (6)
Anti-psychotics (2) Cannabis (1)
Ecstasy-type drugs (1)
15-24 6
Heroin/morphine (4) Other opiates/opioid analgesics (1)
Anti-depressants (2) Hypnotics/sedatives (1)
Alcohol-in-combination (1)
25-34 14
Heroin/morphine (9) Other opiates/opioid analgesics (4)
Alcohol-in-combination (4) Hypnotics/sedatives (2)
Methadone (2) Cannabis (1)
Anti-depressants (1)
35-44 20
Heroin/morphine (5) Alcohol in combination (6)
Other opiates/opioid analgesics (6) Hypnotics/sedatives (6)
Methadone (3) Anti-depressants (4) Anti-psychotics (1) Ecstasy-type (1)
45-54 4
Other opiates/opioid analgesics (3) Alcohol-in-combination (2)
Anti-depressants (2) Anti-psychotics (1)
Heroin/morphine (1) Hypnotics/sedatives (1)
55-64 3 Anti-depressants (2)
Other opiates/opioid analgesics (2) Alcohol-in-combination (1)
65 & over 2 Hypnotics/sedatives (1)
Other opiates/opioid analgesics (1)
7. Commentary The number of deaths notified to the Programme from the Islands showed an increase for the Isle of Man and Guernsey, with a decrease for Jersey in 2011. The general demographic profile of cases in the Islands is in line with the pattern in the UK as a whole, although far fewer appear to have
had a known history of drug dependence or use. When data for the three Islands are combined together, the profile of the psychoactive substances implicated in these cases is broadly similar across the period 2007-11. The role of specific types of drugs in drug-related mortality continues to show differences to those occurring in England and
np-SAD
International Centre for Drug Policy 90
to a lesser extent in Wales. There are proportionately fewer deaths involving methadone and stimulants. However, there is a greater role played by other opiate/opioid analgesics; heroin/morphine; and anti-depressants.
np-SAD
91 International Centre for Drug Policy
Chapter 7: Drug-related deaths in the United Kingdom 1. Numbers of deaths reported
The total number of deaths that occurred during 2011 in the UK reported to the National Programme on Substance Abuse Deaths (np-SAD) was 1,757. This number compares to 1,883 cases reported by the same sources during the equivalent period in 2010. This change represents a decrease of 6.7% for the UK in the number of notifications to the Programme, but not necessarily in drug-related mortality during this period. Of the 1,757 drug-related deaths reported for 2011, England had 1,263; Scotland 336; Wales 81; Northern Ireland 70; and the Islands 7. In 2010 out of the 1,883 England had 1,358; Scotland 365; Wales 81; Northern Ireland 72; and the Islands 7. As in the previous Annual Reports, those inquests which have not been completed will be added to next year’s figure. The number of cases reported from England represents a decrease of 7.0% over the number reported during the equivalent period last year. In Wales and the Islands numbers remained stable, and Northern Ireland exhibited a fall of 2.8%. Drug-related cases in Scotland recorded by the Scottish Crime and Drug Enforcement Agency (SCDEA) fell by 7.9%. There was a decrease in the number of drug-related deaths reported to np-SAD generally across the UK and Islands, particularly in England and Scotland, although this varied from region to region. This overall fall echoes the drop in the overall number of UK death registrations in 2011 using all three definitions of drug-related deaths reported to the
European Monitoring Centre for Drugs & Drug Addiction (Davies et al., 2012). This decrease may be attributable, in part, to the declines in the number and proportion of deaths where heroin/morphine was implicated – as demonstrated in the present report, and elsewhere (ONS, 2012; NRS, 2012). 2. Demography The majority (72%) of cases were male (Table 7.1 and Figure 7.1). This proportion varied from 63% in Northern Ireland to 80% in Wales. Where ethnicity was known, the majority were White (97%). The proportion of individuals living with others ranged from 45% in England to 65% in Scotland. About two-fifths (42%) of decedents were known to be unemployed, ranging from 29% in the Islands to 69% in Wales. Where known, 65% of cases had a history of drug use, dependence or addiction. The median age at death was 40.1 years (interquartile range = 15.6 years) for all sources combined; the medians ranged from 35.6 years in Scotland to 42.4 years in Northern Ireland. There were also differences in the median ages broken down by gender: 38.7 years (interquartile range = 14.6 years) for males compared to 44.6 years (interquartile range = 18.8 years) for females. Figures 7.2 and 7.3 give breakdowns by age-group, and by gender and age-group respectively. The above differences reflect distinctions in the nature and purpose of the data sources; the types of cases covered; and the volumes of cases dealt with by them. These variations also illustrate the limitations on making comparisons between them.
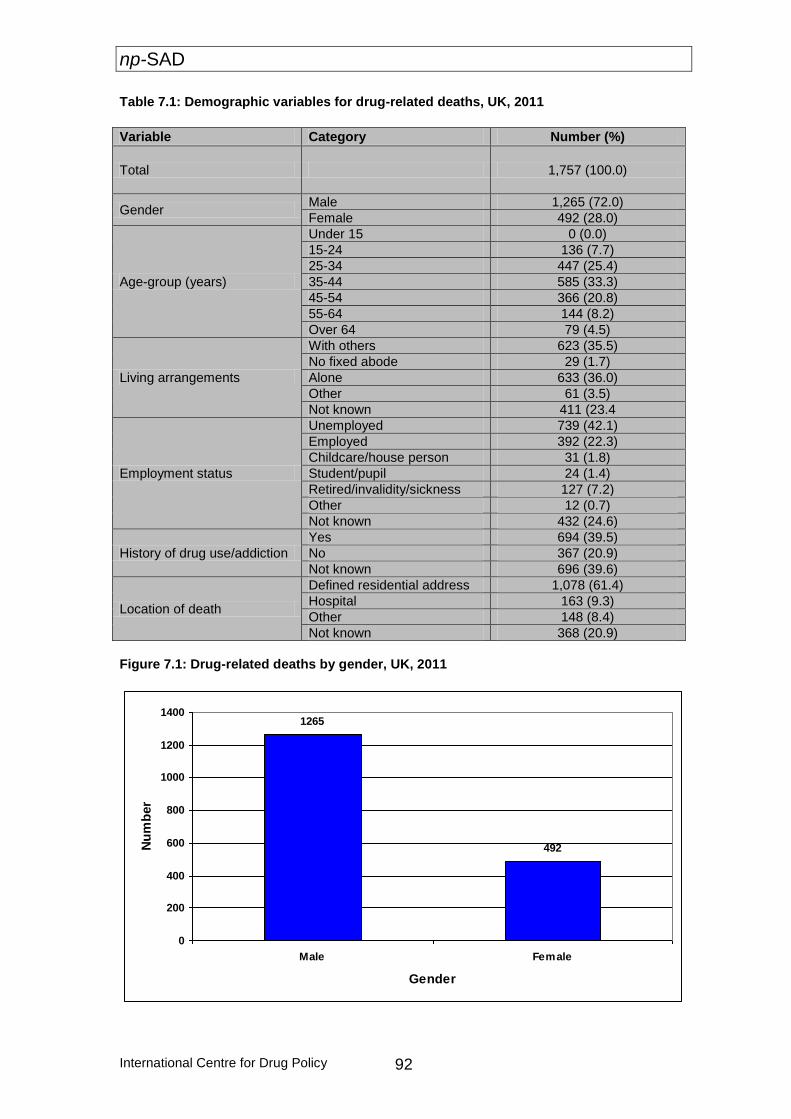
np-SAD
International Centre for Drug Policy 92
Table 7.1: Demographic variables for drug-related deaths, UK, 2011
Figure 7.1: Drug-related deaths by gender, UK, 2011
1265
492
0
200
400
600
800
1000
1200
1400
Male Female
Gender
Nu
mb
er
Variable Category Number (%)
Total 1,757 (100.0)
Gender Male 1,265 (72.0)
Female 492 (28.0)
Age-group (years)
Under 15 0 (0.0)
15-24 136 (7.7)
25-34 447 (25.4)
35-44 585 (33.3)
45-54 366 (20.8)
55-64 144 (8.2)
Over 64 79 (4.5)
Living arrangements
With others 623 (35.5)
No fixed abode 29 (1.7)
Alone 633 (36.0)
Other 61 (3.5)
Not known 411 (23.4
Employment status
Unemployed 739 (42.1)
Employed 392 (22.3)
Childcare/house person 31 (1.8)
Student/pupil 24 (1.4)
Retired/invalidity/sickness 127 (7.2)
Other 12 (0.7)
Not known 432 (24.6)
History of drug use/addiction
Yes 694 (39.5)
No 367 (20.9)
Not known 696 (39.6)
Location of death
Defined residential address 1,078 (61.4)
Hospital 163 (9.3)
Other 148 (8.4)
Not known 368 (20.9)
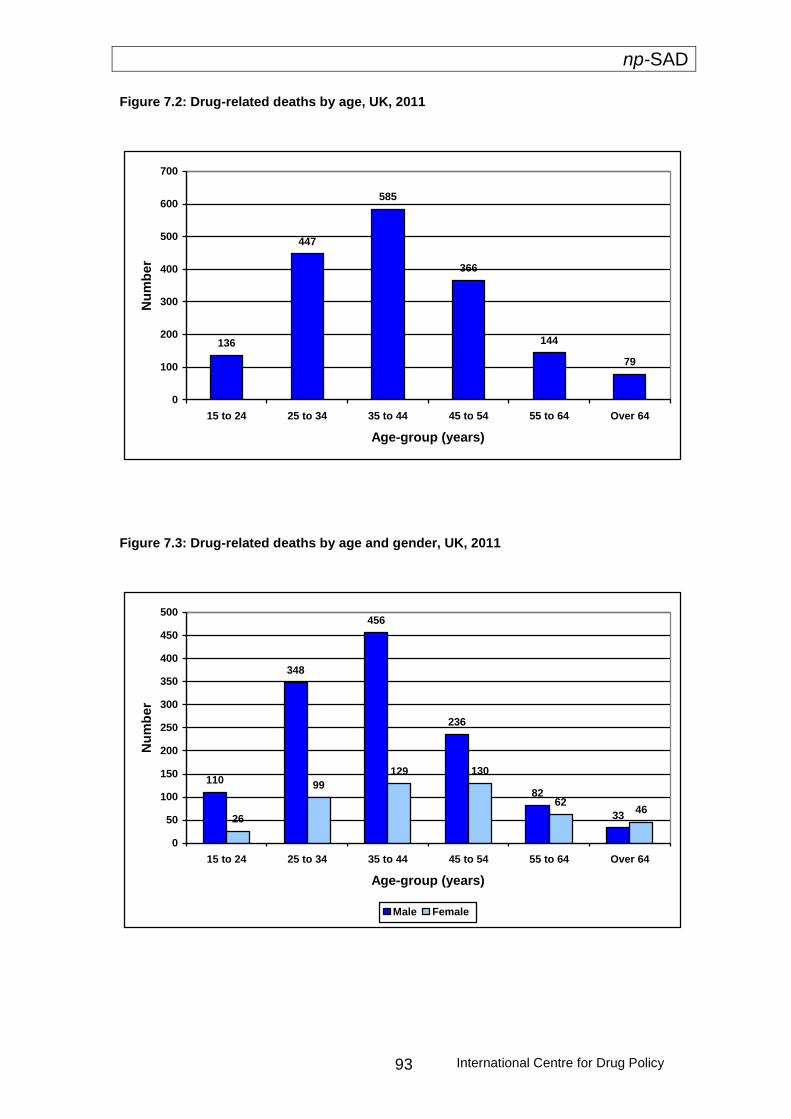
np-SAD
International Centre for Drug Policy 93
Figure 7.2: Drug-related deaths by age, UK, 2011
136
447
585
366
144
79
0
100
200
300
400
500
600
700
15 to 24 25 to 34 35 to 44 45 to 54 55 to 64 Over 64
Age-group (years)
Nu
mb
er
Figure 7.3: Drug-related deaths by age and gender, UK, 2011
110
348
456
236
82
3326
99
129 130
6246
0
50
100
150
200
250
300
350
400
450
500
15 to 24 25 to 34 35 to 44 45 to 54 55 to 64 Over 64
Age-group (years)
Nu
mb
er
Male Female
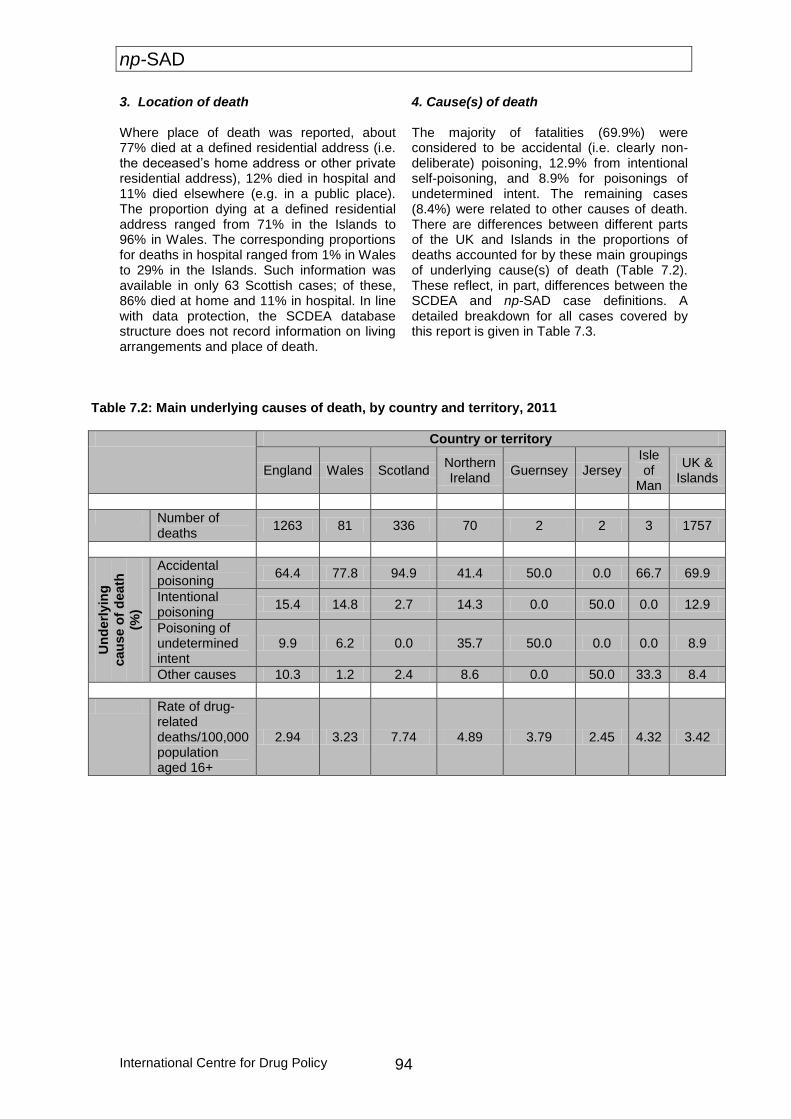
np-SAD
International Centre for Drug Policy 94
3. Location of death Where place of death was reported, about 77% died at a defined residential address (i.e. the deceased’s home address or other private residential address), 12% died in hospital and 11% died elsewhere (e.g. in a public place). The proportion dying at a defined residential address ranged from 71% in the Islands to 96% in Wales. The corresponding proportions for deaths in hospital ranged from 1% in Wales to 29% in the Islands. Such information was available in only 63 Scottish cases; of these, 86% died at home and 11% in hospital. In line with data protection, the SCDEA database structure does not record information on living arrangements and place of death.
4. Cause(s) of death
The majority of fatalities (69.9%) were considered to be accidental (i.e. clearly non-deliberate) poisoning, 12.9% from intentional self-poisoning, and 8.9% for poisonings of undetermined intent. The remaining cases (8.4%) were related to other causes of death. There are differences between different parts of the UK and Islands in the proportions of deaths accounted for by these main groupings of underlying cause(s) of death (Table 7.2). These reflect, in part, differences between the SCDEA and np-SAD case definitions. A detailed breakdown for all cases covered by this report is given in Table 7.3.
Table 7.2: Main underlying causes of death, by country and territory, 2011
Country or territory
England Wales Scotland Northern Ireland
Guernsey Jersey Isle of
Man
UK & Islands
Number of deaths
1263 81 336 70 2 2 3 1757
Un
derl
yin
g
cau
se o
f d
eath
(%)
Accidental poisoning
64.4 77.8 94.9 41.4 50.0 0.0 66.7 69.9
Intentional poisoning
15.4 14.8 2.7 14.3 0.0 50.0 0.0 12.9
Poisoning of undetermined intent
9.9 6.2 0.0 35.7 50.0 0.0 0.0 8.9
Other causes 10.3 1.2 2.4 8.6 0.0 50.0 33.3 8.4
Rate of drug-related deaths/100,000 population aged 16+
2.94 3.23 7.74 4.89 3.79 2.45 4.32 3.42
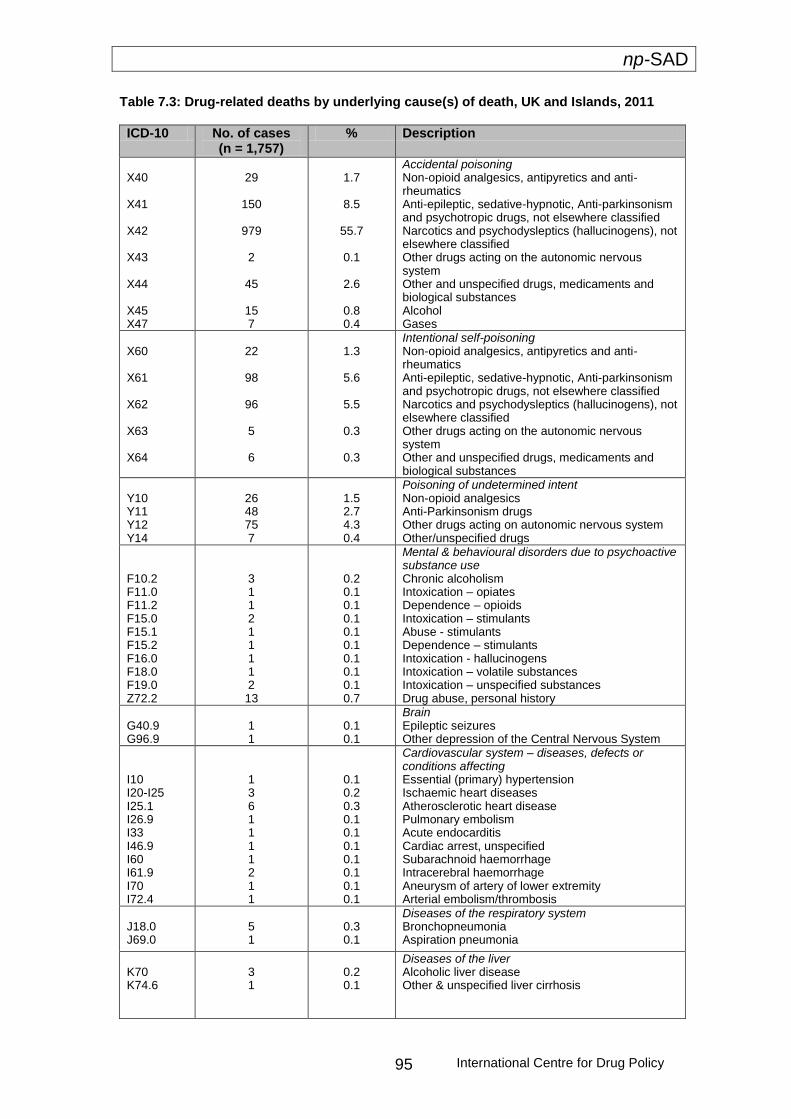
np-SAD
International Centre for Drug Policy 95
Table 7.3: Drug-related deaths by underlying cause(s) of death, UK and Islands, 2011
ICD-10 No. of cases (n = 1,757)
% Description
X40 X41 X42 X43 X44 X45 X47
29
150
979
2
45
15 7
1.7
8.5
55.7
0.1
2.6
0.8 0.4
Accidental poisoning Non-opioid analgesics, antipyretics and anti-rheumatics Anti-epileptic, sedative-hypnotic, Anti-parkinsonism and psychotropic drugs, not elsewhere classified Narcotics and psychodysleptics (hallucinogens), not elsewhere classified Other drugs acting on the autonomic nervous system Other and unspecified drugs, medicaments and biological substances Alcohol Gases
X60 X61 X62 X63 X64
22
98
96
5
6
1.3
5.6
5.5
0.3
0.3
Intentional self-poisoning Non-opioid analgesics, antipyretics and anti-rheumatics Anti-epileptic, sedative-hypnotic, Anti-parkinsonism and psychotropic drugs, not elsewhere classified Narcotics and psychodysleptics (hallucinogens), not elsewhere classified Other drugs acting on the autonomic nervous system Other and unspecified drugs, medicaments and biological substances
Y10 Y11 Y12 Y14
26 48 75 7
1.5 2.7 4.3 0.4
Poisoning of undetermined intent Non-opioid analgesics Anti-Parkinsonism drugs Other drugs acting on autonomic nervous system Other/unspecified drugs
F10.2 F11.0 F11.2 F15.0 F15.1 F15.2 F16.0 F18.0 F19.0 Z72.2
3 1 1 2 1 1 1 1 2 13
0.2 0.1 0.1 0.1 0.1 0.1 0.1 0.1 0.1 0.7
Mental & behavioural disorders due to psychoactive substance use Chronic alcoholism Intoxication – opiates Dependence – opioids Intoxication – stimulants Abuse - stimulants Dependence – stimulants Intoxication - hallucinogens Intoxication – volatile substances Intoxication – unspecified substances Drug abuse, personal history
G40.9 G96.9
1 1
0.1 0.1
Brain Epileptic seizures Other depression of the Central Nervous System
I10 I20-I25 I25.1 I26.9 I33 I46.9 I60 I61.9 I70 I72.4
1 3 6 1 1 1 1 2 1 1
0.1 0.2 0.3 0.1 0.1 0.1 0.1 0.1 0.1 0.1
Cardiovascular system – diseases, defects or conditions affecting Essential (primary) hypertension Ischaemic heart diseases Atherosclerotic heart disease Pulmonary embolism Acute endocarditis Cardiac arrest, unspecified Subarachnoid haemorrhage Intracerebral haemorrhage Aneurysm of artery of lower extremity Arterial embolism/thrombosis
J18.0 J69.0
5 1
0.3 0.1
Diseases of the respiratory system Bronchopneumonia Aspiration pneumonia
K70 K74.6
3 1
0.2 0.1
Diseases of the liver Alcoholic liver disease Other & unspecified liver cirrhosis
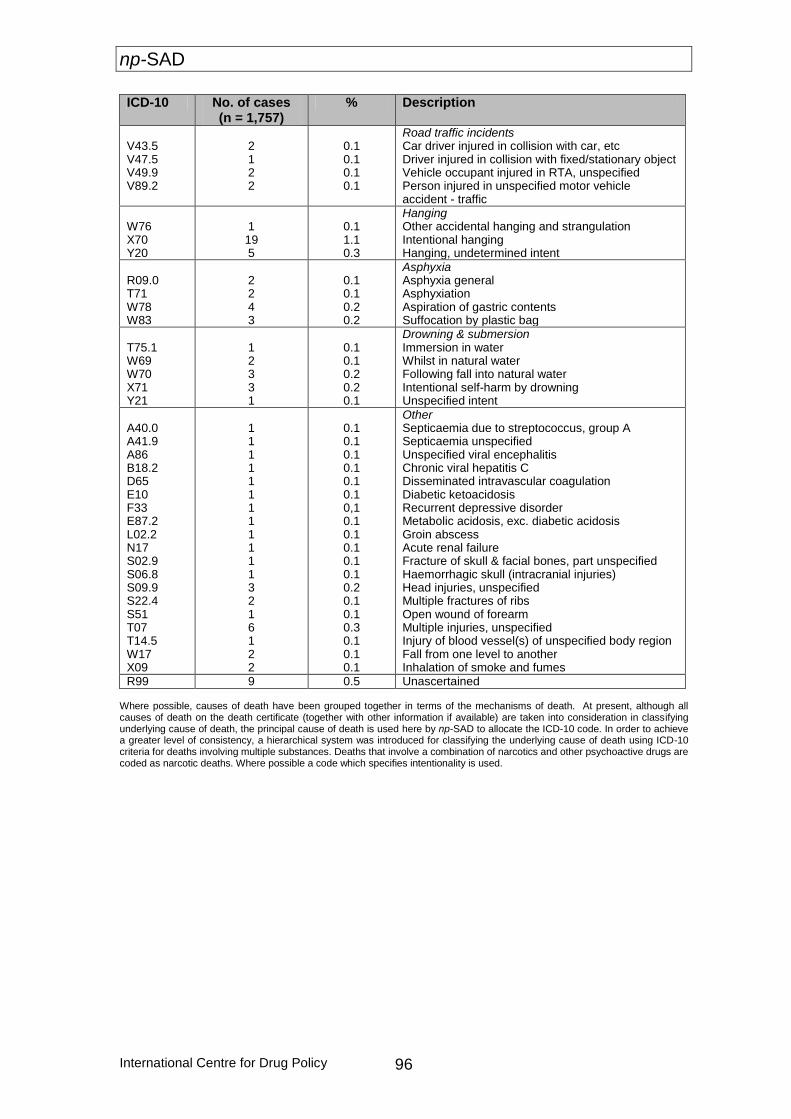
np-SAD
International Centre for Drug Policy 96
ICD-10 No. of cases (n = 1,757)
% Description
V43.5 V47.5 V49.9 V89.2
2 1 2 2
0.1 0.1 0.1 0.1
Road traffic incidents Car driver injured in collision with car, etc Driver injured in collision with fixed/stationary object Vehicle occupant injured in RTA, unspecified Person injured in unspecified motor vehicle accident - traffic
W76 X70 Y20
1 19 5
0.1 1.1 0.3
Hanging Other accidental hanging and strangulation Intentional hanging Hanging, undetermined intent
R09.0 T71 W78 W83
2 2 4 3
0.1 0.1 0.2 0.2
Asphyxia Asphyxia general Asphyxiation Aspiration of gastric contents Suffocation by plastic bag
T75.1 W69 W70 X71 Y21
1 2 3 3 1
0.1 0.1 0.2 0.2 0.1
Drowning & submersion Immersion in water Whilst in natural water Following fall into natural water Intentional self-harm by drowning Unspecified intent
A40.0 A41.9 A86 B18.2 D65 E10 F33 E87.2 L02.2 N17 S02.9 S06.8 S09.9 S22.4 S51 T07 T14.5 W17 X09
1 1 1 1 1 1 1 1 1 1 1 1 3 2 1 6 1 2 2
0.1 0.1 0.1 0.1 0.1 0.1 0,1 0.1 0.1 0.1 0.1 0.1 0.2 0.1 0.1 0.3 0.1 0.1 0.1
Other Septicaemia due to streptococcus, group A Septicaemia unspecified Unspecified viral encephalitis Chronic viral hepatitis C Disseminated intravascular coagulation Diabetic ketoacidosis Recurrent depressive disorder Metabolic acidosis, exc. diabetic acidosis Groin abscess Acute renal failure Fracture of skull & facial bones, part unspecified Haemorrhagic skull (intracranial injuries) Head injuries, unspecified Multiple fractures of ribs Open wound of forearm Multiple injuries, unspecified Injury of blood vessel(s) of unspecified body region Fall from one level to another Inhalation of smoke and fumes
R99 9 0.5 Unascertained Where possible, causes of death have been grouped together in terms of the mechanisms of death. At present, although all causes of death on the death certificate (together with other information if available) are taken into consideration in classifying underlying cause of death, the principal cause of death is used here by np-SAD to allocate the ICD-10 code. In order to achieve a greater level of consistency, a hierarchical system was introduced for classifying the underlying cause of death using ICD-10 criteria for deaths involving multiple substances. Deaths that involve a combination of narcotics and other psychoactive drugs are coded as narcotic deaths. Where possible a code which specifies intentionality is used.
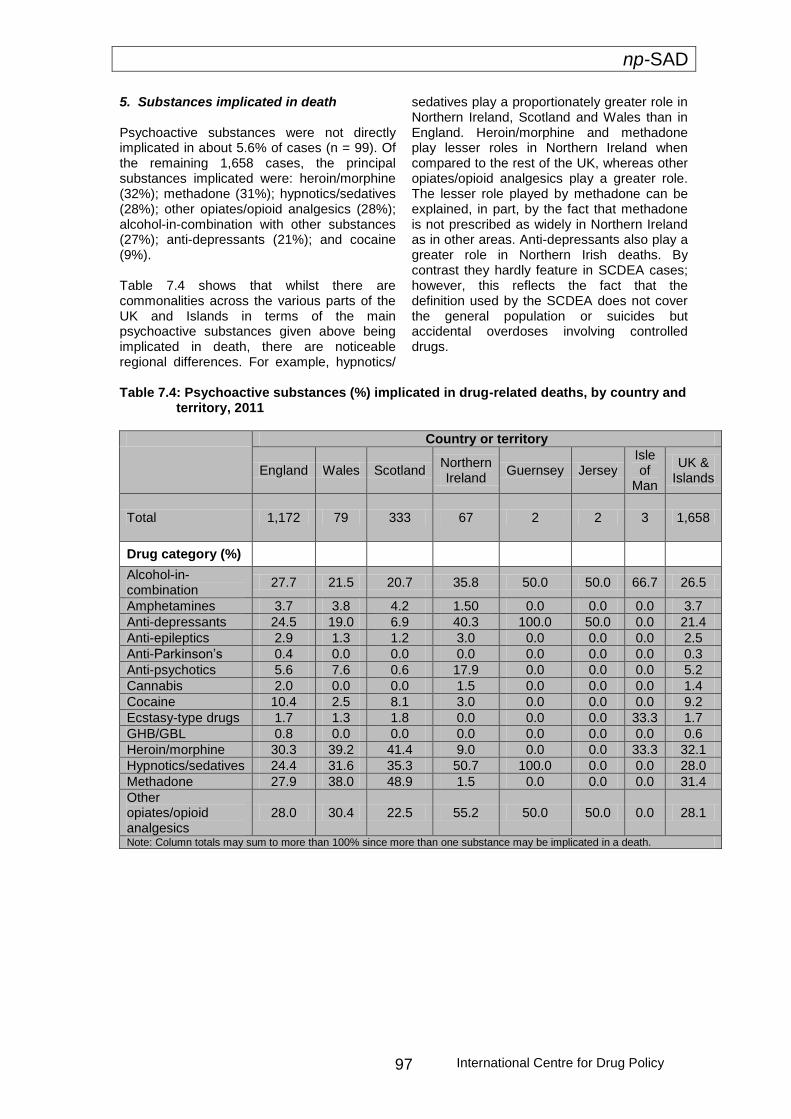
np-SAD
International Centre for Drug Policy 97
5. Substances implicated in death Psychoactive substances were not directly implicated in about 5.6% of cases (n = 99). Of the remaining 1,658 cases, the principal substances implicated were: heroin/morphine (32%); methadone (31%); hypnotics/sedatives (28%); other opiates/opioid analgesics (28%); alcohol-in-combination with other substances (27%); anti-depressants (21%); and cocaine (9%). Table 7.4 shows that whilst there are commonalities across the various parts of the UK and Islands in terms of the main psychoactive substances given above being implicated in death, there are noticeable regional differences. For example, hypnotics/
sedatives play a proportionately greater role in Northern Ireland, Scotland and Wales than in England. Heroin/morphine and methadone play lesser roles in Northern Ireland when compared to the rest of the UK, whereas other opiates/opioid analgesics play a greater role. The lesser role played by methadone can be explained, in part, by the fact that methadone is not prescribed as widely in Northern Ireland as in other areas. Anti-depressants also play a greater role in Northern Irish deaths. By contrast they hardly feature in SCDEA cases; however, this reflects the fact that the definition used by the SCDEA does not cover the general population or suicides but accidental overdoses involving controlled drugs.
Table 7.4: Psychoactive substances (%) implicated in drug-related deaths, by country and territory, 2011
Country or territory
England Wales Scotland Northern Ireland
Guernsey Jersey Isle of
Man
UK & Islands
Total 1,172 79 333 67 2 2 3 1,658
Drug category (%)
Alcohol-in-combination
27.7 21.5 20.7 35.8 50.0 50.0 66.7 26.5
Amphetamines 3.7 3.8 4.2 1.50 0.0 0.0 0.0 3.7
Anti-depressants 24.5 19.0 6.9 40.3 100.0 50.0 0.0 21.4
Anti-epileptics 2.9 1.3 1.2 3.0 0.0 0.0 0.0 2.5
Anti-Parkinson’s 0.4 0.0 0.0 0.0 0.0 0.0 0.0 0.3
Anti-psychotics 5.6 7.6 0.6 17.9 0.0 0.0 0.0 5.2
Cannabis 2.0 0.0 0.0 1.5 0.0 0.0 0.0 1.4
Cocaine 10.4 2.5 8.1 3.0 0.0 0.0 0.0 9.2
Ecstasy-type drugs 1.7 1.3 1.8 0.0 0.0 0.0 33.3 1.7
GHB/GBL 0.8 0.0 0.0 0.0 0.0 0.0 0.0 0.6
Heroin/morphine 30.3 39.2 41.4 9.0 0.0 0.0 33.3 32.1
Hypnotics/sedatives 24.4 31.6 35.3 50.7 100.0 0.0 0.0 28.0
Methadone 27.9 38.0 48.9 1.5 0.0 0.0 0.0 31.4
Other opiates/opioid analgesics
28.0 30.4 22.5 55.2 50.0 50.0 0.0 28.1
Note: Column totals may sum to more than 100% since more than one substance may be implicated in a death.
np-SAD
International Centre for Drug Policy 98
6. Commentary Whilst data received by np-SAD from Coroners suggest that the number of drug-related deaths fell in England, they remained stable in Wales and Northern Ireland during 2011. Information from the SCDEA police indicates a fall in Scottish police cases. However, figures released by the National Records of Scotland show an increase in deaths between 2010 and 2011 (NRS, 2012). Overall, demographic profiles of those who died from drug-related causes are similar across the various countries within the UK e.g. a higher proportion of males to females, aged typically 25-44 years, White, and the majority of cases living with others, there are differences within this general pattern. Most deaths were accidental drug overdoses, occurring at a private residential address (typically at home or the home of a friend).
Opiates such as heroin, methadone and opioid analgesics are implicated in the majority of cases. Other substances playing major roles in deaths include alcohol-in-combination with substances; hypnotics/sedatives; anti-depressants; and cocaine. However, there are also regional variations in these patterns. Whilst there appears to have been a decrease in the proportion of cases involving heroin; alcohol-in-combination; and anti-depressants, the proportions involving methadone; other opiates/opioid analgesics; and hypnotics/ sedatives all increased. The stabilisation noted in the previous report regarding the role of stimulants (cocaine; amphetamines; and ecstasy-type drugs) in death appears to have ended, with slight increases in such deaths. The patterns observed in different parts of the UK, and possible reasons for the continuing changes in recreational drug use, are examined in the following chapter.

np-SAD
International Centre for Drug Policy 99
Chapter 8: Commentary and emerging themes
Introduction This chapter provides up-to-date information on emerging trends and issues to those who investigate drug-related deaths (DRDs) and those who are trying to prevent such fatalities. The main trends and issues
highlighted here emerge from the submitted forms, communications from Coroners, and other relevant data such as published papers and intelligence from forensic toxicological agencies.
General patterns The total number of deaths that occurred during 2011 in the UK reported to the National Programme on Substance Abuse Deaths (np-SAD) was 1,757. This number compares to 1,883 cases reported by the same sources during the equivalent period in 2010. This change represents a decrease in the number of notifications to the Programme, but not necessarily in drug-related mortality during this period. Similarly, the decreased number of cases reported by Coroners in England and by the Scottish Crime and Drug Enforcement Agency (SCDEA) for Scotland, does not necessarily mean a decrease in deaths related to drug use. The demographic profile of fatalities reported to the np-SAD remains consistent with previous reports. There was an increase in the proportion of UK deaths where the underlying cause of death was accidental poisoning (up from 64% to 70%) and for deaths of intentional self-poisoning (from 11 to 13%) with corresponding decreases in the proportions recorded as poisoning of undetermined intent and other causes. Opiates/opioids (i.e. heroin/morphine; methadone; other opiates/opioid analgesics), alone or in combination with other drugs continue to account for the majority of all cases. Heroin/morphine alone or in combination with other drugs, accounted for
the highest proportion (32%) of ‘drug misuse’ fatalities in 2011, a decrease over the 2010 level of 41% (53% in 2009). There was a slight fall in the proportion of cases involving alcohol-in-combination (30% to 27%). There were modest increases in the proportion of deaths due to methadone (27% to 31%), other opiates/opioid analgesics (22% to 28%), and anti-depressants (18% to 21%). For stimulants, there was a slight increase in the proportion of cases involving cocaine (from 8.7% to 9.2%); amphetamines (from 2.9% to 3.7%); and ecstasy-type drugs (from 0.6% to 1.7%). These patterns are also generally reflected at country level. Over recent years there has been a trend towards multiple substances, including alcohol, being implicated in deaths. In 2011, there was a stabilisation in the proportion of monovalent deaths, at around 34%. Prescribed heroin/morphine and methadone are most commonly involved in deaths where these substances are directly implicated in death. Other opiates/opioid analgesics; hypnotics/sedatives; and anti-depressants prescribed to individuals are less likely to be involved in their deaths. The median age at death of individuals notified to the np-SAD with a known history of drug use or dependence was 40.1 years (interquartile range = 15.6 years) in 2011.
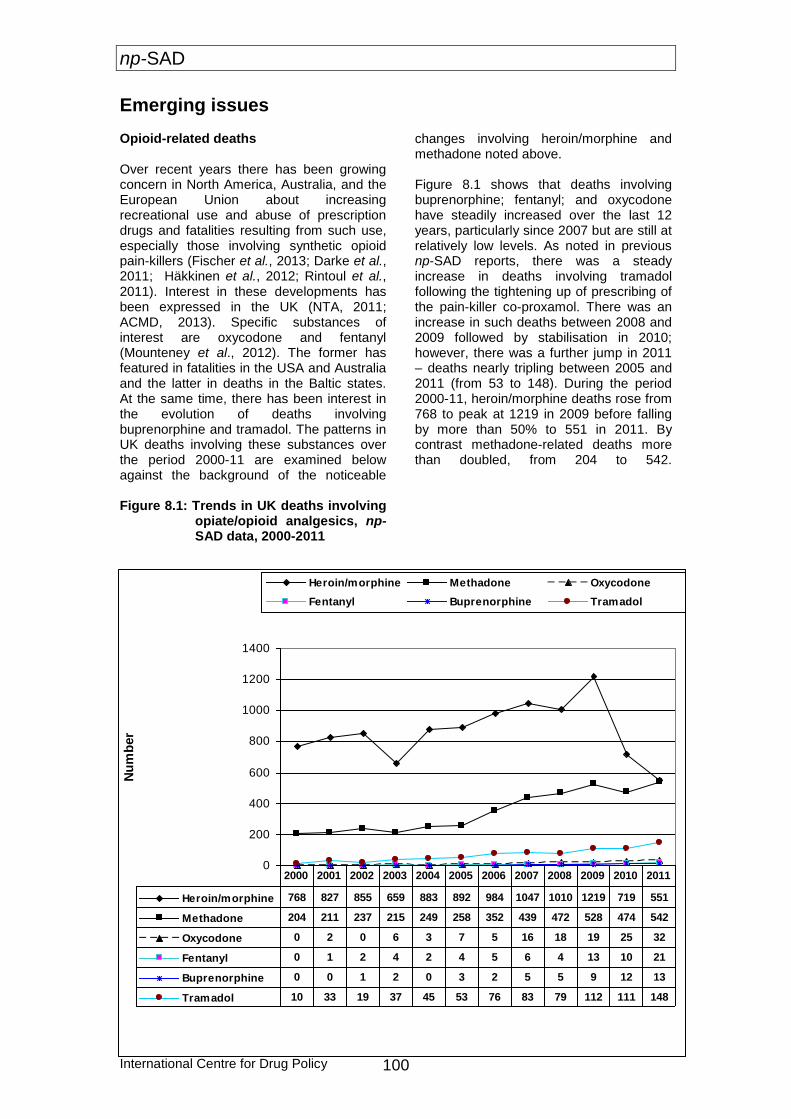
np-SAD
International Centre for Drug Policy 100
Emerging issues Opioid-related deaths Over recent years there has been growing concern in North America, Australia, and the European Union about increasing recreational use and abuse of prescription drugs and fatalities resulting from such use, especially those involving synthetic opioid pain-killers (Fischer et al., 2013; Darke et al., 2011; Häkkinen et al., 2012; Rintoul et al., 2011). Interest in these developments has been expressed in the UK (NTA, 2011; ACMD, 2013). Specific substances of interest are oxycodone and fentanyl (Mounteney et al., 2012). The former has featured in fatalities in the USA and Australia and the latter in deaths in the Baltic states. At the same time, there has been interest in the evolution of deaths involving buprenorphine and tramadol. The patterns in UK deaths involving these substances over the period 2000-11 are examined below against the background of the noticeable
changes involving heroin/morphine and methadone noted above. Figure 8.1 shows that deaths involving buprenorphine; fentanyl; and oxycodone have steadily increased over the last 12 years, particularly since 2007 but are still at relatively low levels. As noted in previous np-SAD reports, there was a steady increase in deaths involving tramadol following the tightening up of prescribing of the pain-killer co-proxamol. There was an increase in such deaths between 2008 and 2009 followed by stabilisation in 2010; however, there was a further jump in 2011 – deaths nearly tripling between 2005 and 2011 (from 53 to 148). During the period 2000-11, heroin/morphine deaths rose from 768 to peak at 1219 in 2009 before falling by more than 50% to 551 in 2011. By contrast methadone-related deaths more than doubled, from 204 to 542.
Figure 8.1: Trends in UK deaths involving
opiate/opioid analgesics, np-SAD data, 2000-2011
0
200
400
600
800
1000
1200
1400
Nu
mb
er
Heroin/morphine Methadone Oxycodone
Fentanyl Buprenorphine Tramadol
Heroin/morphine 768 827 855 659 883 892 984 1047 1010 1219 719 551
Methadone 204 211 237 215 249 258 352 439 472 528 474 542
Oxycodone 0 2 0 6 3 7 5 16 18 19 25 32
Fentanyl 0 1 2 4 2 4 5 6 4 13 10 21
Buprenorphine 0 0 1 2 0 3 2 5 5 9 12 13
Tramadol 10 33 19 37 45 53 76 83 79 112 111 148
2000 2001 2002 2003 2004 2005 2006 2007 2008 2009 2010 2011
np-SAD
International Centre for Drug Policy 101
Novel Psychoactive Substances The UK Advisory Council on the Misuse of Drugs (ACMD) uses the following definition: “psychoactive drugs which are not prohibited by the United Nations Single Convention on Narcotic Drugs or by the Misuse of Drugs Act 1971, and which people in the UK are seeking for intoxicant use’ (ACMD, 2011:10). This report considers substances brought under control by legislation after being examined by the ACMD, being considered for control/regulation, or still legal. However, changes in legal status may affect availability – and thus use. As reported in the previous np-SAD report (Ghodse et al., 2012), recent years saw decreases in the number of deaths involving ‘traditional’ stimulants such as cocaine, amphetamines, and ecstasy-type substances. Reasons for these decreases, also seen in death registration statistics from the General Mortality Registers, may include a decline in cocaine purity and/or a shift to using alternative stimulants, including ‘legal highs’. For example, the mean purity of powder cocaine seized by the police in England & Wales fell from 33% in 2007 to 24% in 2010; the purity of 'crack' cocaine is reported to have fallen during the same period from 52% to 31% (Davies et al., 2012). Last year the use of powder cocaine amongst 16–59 year-olds in England & Wales fell from 3% in 2008/9 to 2% in 2010/11 (Home Office, 2012). It has been proposed that the fall in ecstasy and cocaine-related deaths in the United Kingdom since 2008 may be as a result of users switching to ‘legal highs’ with the suggestion that this may have had an unintended harm reduction effect (Bird, 2010). Whilst the use of amphetamine, ecstasy-type drugs and cocaine appears to have continued to fall between 2009 and 2011 (Home Office, 2012), the street purity of these substances, including the MDMA content of ecstasy tablets rose in 2011 (Davies et al., 2012:123). The proportion of stimulant deaths reported to the np-SAD that occurred in 2011 increased marginally compared to 2010. This is in line with the rises in the average street purity of the stimulants mentioned above. UK deaths registered in 2011 involving ecstasy-type
substances and amphetamine showed increases whereas cocaine related fatalities fell (Davies et al., 2012:183). As part of its surveillance function, in recent years the np-SAD Annual Report has reported on new substances which are appearing on the drug scene and which have either been noted in post mortem toxicological reports and/or implicated in deaths reported to the Programme. Against this background, np-SAD has observed an increase in the number and range of Novel Psychoactive Substances (NPS) in the post mortem toxicology results and/or cause of death of cases notified to the Programme (see Figure 8.2). Chemical groups represented by these NPS include: aminoindanes (MDAI); amphetamine-type substances (Fluoroamphetamine, PMA, PMMA); benzofurans (APB); tryptamines (AMT, 5-MeO-DALT); natural products (Ibogaine, khat (Catha edulis), Salvia divinorum); and, most prominently, the methcathinones. Methcathinones The last two Annual Reports from the Programme specifically mentioned Mephedrone (Methylmethcathinone), MDPV (Methylenedioxypyrovalerone) and NRG-1 (Naphyrone). As can be seen from Table 8.1, the number of cases where Mephedrone and MDPV were mentioned increased significantly in 2010, falling away in 2011. Other methcathinones also emerged onto the scene; in many instances, several such chemicals were involved in individual cases. During 2011 and 2012, forensic toxicologists continued to report increased seizures of ‘legal highs’ derived from methcathinone, particularly mephedrone commonly known as “bubbles” and “meow-meow”. Many of these cases have now gone to inquest or through similar formal investigations by Procurators Fiscal in Scotland, and are being reported to np-SAD. This class of chemical is still very much present in the UK recreational drug scene, and its use may be developing into one of a problematic nature in respect of injecting and dependence. It is important, therefore, to be aware of this fact in terms of information and service provision, and prevention initiatives.

np-SAD
International Centre for Drug Policy 102
Table 8.1: Deaths involving Novel Psychoactive Substances, np-SAD data, 2009-11
Substance Post mortem toxicology Cause of Death
Year 2009 2010 2011 2009 2010 2011
Aminoindanes
MDAI 0 0 2 0 0 2
ATS
2,5-Dimethoxy-4- chloroamphetamine
0 0 1 0 0 1
Fluoroamphetamine 1 0 0 0 0 0
PMA 0 1 3 0 0 4
PMMA 0 0 2 0 0 2
Benzofurans
APB 0 0 1 0 0 1
Benzodiazepines
Phenazepam 0 0 14 0 0 7
Ketamine derivatives
Methoxetamine 0 0 1 0 0 1
Natural products
Cathinone (khat) 0 0 1 0 0 1
Datura products 1 0 0 1 0 0
Ibogaine 1 0 0 1 0 0
Noribogaine 1 0 0 0 0 0
Salvia 0 0 0 0 0 1
Piperidines
Desoxypipradrol 0 3 0 0 3 0
Methcathinones
4-MEC 0 0 5 0 0 4
Flephedrone 0 2 2 0 2 2
MDPBP 0 0 1 0 0 1
MDPV 0 9 3 0 6 2
Mephedrone 8 46 20 5 29 13
Methedrone 0 2 3 0 1 2
Methylone 0 2 0 0 2 0
N-desakyl-4- methylmethcathinone
0 1 0 0 0 0
Naphyrone 0 2 0 0 2 0
Pentylone 0 0 1 0 0 1
Pyrovalerone 0 1 0 0 1 0
Tryptamines
5-MeO-DALT 0 1 0 0 1 0
AMT 0 0 2 0 0 2
Tryptamine 1 0 0 1 0 0
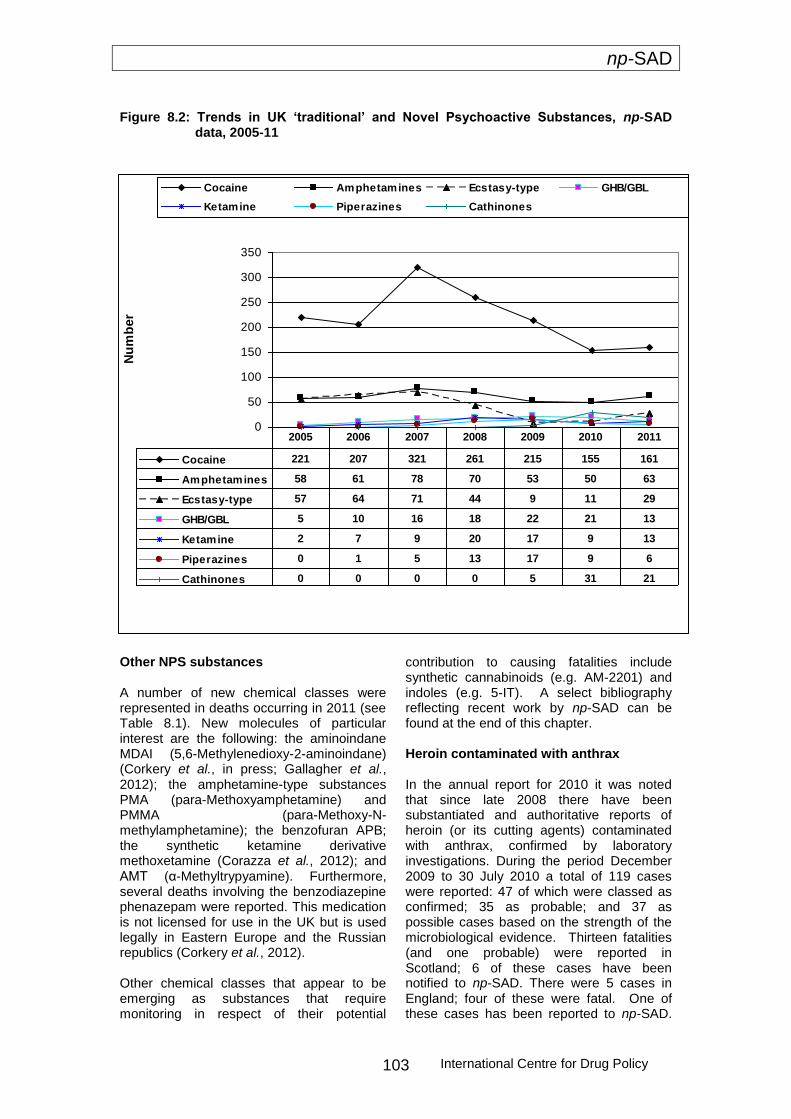
np-SAD
International Centre for Drug Policy 103
Figure 8.2: Trends in UK ‘traditional’ and Novel Psychoactive Substances, np-SAD
data, 2005-11
Other NPS substances A number of new chemical classes were represented in deaths occurring in 2011 (see Table 8.1). New molecules of particular interest are the following: the aminoindane MDAI (5,6-Methylenedioxy-2-aminoindane) (Corkery et al., in press; Gallagher et al., 2012); the amphetamine-type substances PMA (para-Methoxyamphetamine) and PMMA (para-Methoxy-N-methylamphetamine); the benzofuran APB; the synthetic ketamine derivative methoxetamine (Corazza et al., 2012); and AMT (α-Methyltrypyamine). Furthermore, several deaths involving the benzodiazepine phenazepam were reported. This medication is not licensed for use in the UK but is used legally in Eastern Europe and the Russian republics (Corkery et al., 2012). Other chemical classes that appear to be emerging as substances that require monitoring in respect of their potential
contribution to causing fatalities include synthetic cannabinoids (e.g. AM-2201) and indoles (e.g. 5-IT). A select bibliography reflecting recent work by np-SAD can be found at the end of this chapter. Heroin contaminated with anthrax In the annual report for 2010 it was noted that since late 2008 there have been substantiated and authoritative reports of heroin (or its cutting agents) contaminated with anthrax, confirmed by laboratory investigations. During the period December 2009 to 30 July 2010 a total of 119 cases were reported: 47 of which were classed as confirmed; 35 as probable; and 37 as possible cases based on the strength of the microbiological evidence. Thirteen fatalities (and one probable) were reported in Scotland; 6 of these cases have been notified to np-SAD. There were 5 cases in England; four of these were fatal. One of these cases has been reported to np-SAD.
0
50
100
150
200
250
300
350
Nu
mb
er
Cocaine Amphetamines Ecstasy-type GHB/GBL
Ketamine Piperazines Cathinones
Cocaine 221 207 321 261 215 155 161
Amphetamines 58 61 78 70 53 50 63
Ecstasy-type 57 64 71 44 9 11 29
GHB/GBL 5 10 16 18 22 21 13
Ketamine 2 7 9 20 17 9 13
Piperazines 0 1 5 13 17 9 6
Cathinones 0 0 0 0 5 31 21
2005 2006 2007 2008 2009 2010 2011
np-SAD
International Centre for Drug Policy 104
The Scottish cases were the first documented outbreak associated with heroin use anywhere in the world. It proved to be the largest single common source outbreak of anthrax in humans in the UK in over 50 years. The outbreak was declared over in Scotland on 23 December 2010 (HPS, 2011). Factors associated with an increased risk of infection included longer injecting history, receiving opioid substitution therapy, and alcohol consumption. Smoking heroin was associated with lower risk of infection
(Palmateer et al., 2012). Between June and December 2012 six further cases were reported in the UK: 4 (including 3 fatal) cases in England (Blackpool, Medway and Oxford), one in Lanarkshire (Scotland) and one in Gwynedd (Wales) (HPA, 2012). It is unclear whether the British cases are linked to the European outbreak, which has affected drug users in Denmark, Germany and France.
Conclusions Opiates, mainly heroin/morphine and methadone, still account for the majority of drug-related deaths in the UK. There is evidence both from np-SAD data and other authoritative sources that the role of heroin/morphine decreased in 2010 and 2011. However, deaths involving methadone and other opiates/opioid analgesics rose slightly during this period. The marginal increase in cases involving stimulants (such as cocaine, amphetamines, and ecstasy-type drugs) following a decline in 2009 and stabilisation in 2010 may well be due to the growing use in recent years of so-called ‘legal highs’ such as ketamine; the piperazines; GHB/GBL; and more recently the methcathinones such as mephedrone. Whilst these are still available their popularity has declined slightly, in part as a consequence of them having been brought under the control of the Misuse of Drugs Act 1971. However, these substances are still popular on the UK recreational drug scene and may be causing problems in terms of dependency. Indeed, there appears to have been a slight increase in deaths involving amphetamines and ecstasy-type substances. At the same time, other novel substances – principally other methcathinones and related chemicals – have emerged on the recreational drug scene in Western Europe but especially the British Isles. The rapidity with which these new substances are emerging appears to be increasing. It is now difficult to gauge with any certainty what will capture the attention of the experimenter or regular recreational drug user. The range of drug classes now on offer, both diverted pharmaceutical products such as phenazepam, and synthetic substances is also growing. Several new classes were present in the post mortem
toxicology and cause of death in 2011 cases. These trends appear to have continued into 2012.
Furthermore, there is a lack of information provided to the potential consumer by the retailer as to the true nature of the ingredients in the substance being purchased. Therefore, it is important that the np-SAD, in collaboration with other surveillance systems, continues to monitor reports from the treatment and forensic toxicology fields as well as Coroners’ records so as to be able to alert health professionals about emerging issues, and to suggest to Coroners and pathologists what they might look out for. The Programme feeds into the formal scientific evidence-gathering activities of the Advisory Council on the Misuse of Drugs (see Select Bibliography for examples), and the formal risk assessments of Novel Psychoactive Substances conducted by the European Monitoring Centre for Drugs and Drug Addiction.
However, it is important not to overlook the fact that opiates/opioids still account for the majority of drug-related deaths in England and other parts of the UK. Together with hypnotics/sedatives (chiefly benzodiazepines such as diazepam and temazepam) the involvement of methadone in deaths has increased over the past year.
As reported last year, the injection of heroin contaminated with anthrax or botulism is, at present, a continuing and serious risk factor for adverse health consequences and death. As heroin can be stockpiled for several years before being released onto the market it is important that vigilance is maintained by heroin users and those who treat them for any tell-tale signs of infection, thereby preventing premature death.
np-SAD
International Centre for Drug Policy 105
Select bibliography on Novel Psychoactive Substances
ACMD. (2009). ACMD report on the major cannabinoid agonists. 12 August. London: Advisory Council on the Misuse of Drugs. Available at: http://www.homeoffice.gov.uk/publications/agencies-public-bodies/acmd1/acmd-report-agonists?view=Binary Accessed 20 February 2013 ACMD. (2010). ACMD report on the consideration of the cathinones. 31 March. London: Advisory Council on the Misuse of Drugs. Available at: http://www.homeoffice.gov.uk/publications/agencies-public-bodies/acmd1/acmd-cathinodes-report-2010?view=Binary Accessed 20 February 2013 ACMD. (2010). Advisory Council on the Misuse of Drugs Naphyrone Report (2010). 7 July. London: Advisory Council on the Misuse of Drugs. Available at: http://www.homeoffice.gov.uk/publications/agencies-public-bodies/acmd1/naphyrone-report?view=Binary Accessed 20 February 2013 ACMD. (2010). ACMD advice on 'Ivory Wave'. 2 November. London: Advisory Council on the Misuse of Drugs. Available at: http://www.homeoffice.gov.uk/publications/agencies-public-bodies/acmd1/advice-ivory-wave?view=Binary Accessed 20 February 2013 ACMD. (2011). ACMD advice on phenazepam. 20 July. London: Advisory Council on the Misuse of Drugs. Available at: http://www.homeoffice.gov.uk/publications/agencies-public-bodies/acmd1/acmd-advice-phenazepam?view=Binary Accessed 20 February 2013 ACMD. (2011). ACMD report on desoxypipradrol. 13 September. London: Advisory Council on the Misuse of Drugs. Available at: http://www.homeoffice.gov.uk/publications/agencies-public-bodies/acmd1/desoxypipradrol-report?view=Binary Accessed 20 February 2013 ACMD. (2011). Consideration of the Novel Psychoactive Substances (‘Legal Highs’). 25 October. London: Advisory Council on the Misuse of Drugs. Available at: http://www.homeoffice.gov.uk/publications/agencies-public-bodies/acmd1/acmdnps2011?view=Binary Accessed 20 February 2013 ACMD. (2012). Statement of evidence – methoxetamine. 27 March. London: Advisory Council on the Misuse of Drugs. Available at: http://www.homeoffice.gov.uk/publications/agencies-public-bodies/acmd1/statement-methoxetamine?view=Binary Accessed 20 February 2013 ACMD. (2012). Advisory Council on the Misuse of Drugs - further consideration of the synthetic cannabinoids. 18 October. London: Advisory Council on the Misuse of Drugs. Available at: http://www.homeoffice.gov.uk/publications/agencies-public-bodies/acmd1/synthetic-cannabinoids-2012?view=Binary Accessed 20 February 2013 ACMD. (2012). Advisory Council on the Misuse of Drugs (ACMD) Methoxetamine Report (2012). 18 October. London: Advisory Council on the Misuse of Drugs. Available at: http://www.homeoffice.gov.uk/publications/agencies-public-bodies/acmd1/methoxetamine2012?view=Binary Accessed 20 February 2013

np-SAD
International Centre for Drug Policy 106
ACMD. (2013). Khat: A review of its potential harms to the individual and communities in the UK. 23 January. London: Advisory Council on the Misuse of Drugs. Available at: http://www.homeoffice.gov.uk/publications/agencies-public-bodies/acmd1/ACMD-khat-report-2013/report-2013 Accessed 20 February 2013 Corazza, O. Schifano, F., Simonato, P., Fergus, S., Assi, S., Stair, J., Corkery, J., Trincas, G., Deluca, P., Davey, Z., Drummond, C., Blaszko, U., Demetrovics, Z., Moskalewicz, J., Enea, A., di Melchiorre, G., Mervo, B., Floridi, L., di Furia, L., Farre, M., Flesland, L., Pasinetti, M., Pezzolesi, C., Pisarska, A., Shapiro, H., Siemann, H., Skutle, A., Sferrazza, E., Torrens, M., van der Kreeft, P., Zummo, D., Scherbaum, N. (2012). 'The phenomenon of new drugs on the Internet: the case of ketamine derivative methoxetamine (“MXE”)'. Human Psychopharmacology: Clinical and Experimental. Mar, 27(2):145-9. Corkery J.M., Durkin, E., Elliott, S., Schifano, F., Ghodse, A.H. (2012). The recreational tryptamine 5-MeO-DALT (N,N-diallyl-5-methoxytryptamine): a brief review. Progress in Neuropsychopharmacology and Biological Psychiatry – special issue. Dec, 39(2): 259-62. Corkery, J.M., Elliott, S., Schifano, F., Corazza, O., Ghodse, A.H. (2012). 2-DPMP (Desoxypipradrol, 2-Benzhydrylpiperidine, 2-Phenylmethylpiperidine) and D2PM (Diphenyl-2-pyrrolidin-2-yl-methanol, Diphenylprolinol): a preliminary review. Progress in Neuropsychopharmacology and Biological Psychiatry – special issue. Dec, 39(2): 253-8. Corkery, J.M., Elliott, S., Schifano, F., Corazza, O. & Ghodse, A.H. (in press) MDAI (5,6-methylenedioxy-2-aminoindane; 6,7-dihydro-5H-cyclopenta[f][1,3]benzodioxol-6-amine; ‘sparkle’; ‘mindy’) toxicity: a brief overview and update. Human Psychopharmacology: Clinical and Experimental Corkery, J.M., Schifano, F. and Ghodse, A.H. (2012). ‘Mephedrone-related fatalities in the United Kingdom: contextual, clinical and practical issues’, chapter 17, pp. 355-380, in Pharmacology. Rijeka, Croatia: InTech - Open Access Publisher. ISBN 979-953-307-482-4 Edited by Dr. Luca Gallelli Department of Experimental and Clinical Medicine, School of Medicine, University of Catanzaro, Clinical Pharmacology Unit, Mater Domini Hospital, Italy. Published 14 March 2012. Corkery, J.M., Schifano, F., Ghodse, A.H. (2012). Phenazepam use in the UK: an emerging problem causing serious adverse health problems, including death. Human Psychopharmacology: Clinical and Experimental. May, 27(3): 254-61. Corkery J.M., Schifano, F., Oyefeso, A., Ghodse, A.H., Tonia, T., Naidoo, V. and Button, J. (2011). Review of literature and information on ‘khat-related’ mortality: a call for recognition of the issue and further research. Annali dell’Instituto Superiore di Sanitá, Dec, 47(4):445-64. Corkery, J.M., Schifano, F., Oyefeso, A., Ghodse, A.H., Tonia, T., Naidoo, V. and Button, J. (2011). ‘ ‘Bundle of fun’ or ‘bunch of problems’? Case series of khat-related deaths in the UK’. Drugs: education, prevention and policy, Dec, 18(6): 408-25. Gallagher, C. T., Assi, S., Stair, J. L., Fergus, S., Corazza, O., Corkery, J. M. and Schifano, F. (2012), 5,6-Methylenedioxy-2-aminoindane: from laboratory curiosity to ‘legal high’. Human Psychopharmacology: Clinical and Experimental, March, 27(2): 106–12. Schifano F, Albanese A, Fergus S, Stair JL, Deluca P, Corazza O, Davey Z, Corkery J, Siemann H, Scherbaum N, Farre' M, Torrens M, Demetrovics Z, Ghodse AH; Psychonaut Web Mapping; ReDNet Research Groups. (2011). ‘Mephedrone (4-methylmethcathinone; 'meow meow'): chemical, pharmacological and clinical issues’. Psychopharmacology (Berl). Apr, 214(3):593-602. Schifano, F. and Corkery, J. (2006). ‘Decessi ed altri indicatori chiave del consume di cocaine nel Regno Unito (1990-2004)’, pp. 87-101 in G. Serpelloni, T. Macchia, G. Gerra. (eds.) Cocaina: Manuale di aggiornamento tecnico scientifico. January 2006. Verona, Italy: Dipartimento Nazionale per le Politiche Antidroga. ISBN: 88-95149-00-9
np-SAD
International Centre for Drug Policy 107
Schifano, F., Corkery, J. (2008). ‘Cocaine/crack cocaine consumption, treatment demand, seizures, related offences, prices, average purity levels and deaths in the UK (1990 - 2004)’. Journal of Psychopharmacology Jan, 22(1):71-9. Schifano, F., Corkery, J.M., Cuffolo, G. (2007). ‘Smokable ("ice", "crystal meth") and non smokable amphetamine-type stimulants: clinical pharmacological and epidemiological issues, with special reference to the UK’. Annali Istituto Superiore di Sanita. 43(1):110-5. Schifano, F., Corkery, J., Deluca, P., Oyefeso, A., Ghodse, A.H. (2006). ‘Ecstasy (MDMA, MDA, MDEA, MBDB) consumption, seizures, related offences, prices, dosage levels and deaths in the UK (1994-2003)’. Journal of Psychopharmacology. May, 20(3):456-63. Schifano, F., Corkery, J. & Ghodse, A.H. (2012). Suspected and confirmed fatalities associated with mephedrone (4-methylmethcathinone; ‘meow meow’) in the UK. Journal of Clinical Psychopharmacology, Oct, 32(5):710-4. Schifano, F., Corkery, J., Naidoo, V., Oyefeso, A., Ghodse, H. (2010). ‘Overview of amphetamine-type stimulant mortality data--UK, 1997-2007’. Neuropsychobiology. 61(3):122-30. Schifano, F., Corkery, J., Oyefeso, A., Tonia, T., Ghodse, A.H. ‘(2008). Trapped in the "K-hole":overview of deaths associated with ketamine misuse in the UK (1993-2006)’. Journal of Clinical Psychopharmacology Feb, 28(1):114-6.

np-SAD
International Centre for Drug Policy 108
References Advisory Council on the Misuse of Drugs. (2000). Reducing drug related deaths. London: The Stationery Office. Available at: http://www.drugsandalcohol.ie/5017/ Accessed 20 December 2012. ACMD. (2013). ACMD advice on tramadol. London: Advisory Council on the Misuse of Drugs. 13 February. Available at: http://www.homeoffice.gov.uk/publications/agencies-public-bodies/acmd1/advice-tramadol?view=Binary Accessed 14 February 2013. Bird, S. (2010), ‘Banned drug may have saved lives, not cost them’, Available at: http://www.straightstatistics.org/article/banned-drug-may-have-saved-lives-not-cost-them. Accessed 20 December 2012. Bird, S.M., Hutchinson, S.J. and Goldberg, D.J. (2003). ‘Drug-related deaths by region, sex, and age group per 100 injecting drug users in Scotland, 2000-01’. Lancet, Sep, 362(9388):941-4 Corazza, O. Schifano, F., Simonato, P., Fergus, S., Assi, S., Stair, J., Corkery, J., Trincas, G., Deluca, P., Davey, Z., Drummond, C., Blaszko, U., Demetrovics, Z., Moskalewicz, J., Enea, A., di Melchiorre, G., Mervo, B., Floridi, L., di Furia, L., Farre, M., Flesland, L., Pasinetti, M., Pezzolesi, C., Pisarska, A., Shapiro, H., Siemann, H., Skutle, A., Sferrazza, E., Torrens, M., van der Kreeft, P., Zummo, D., Scherbaum, N. (2012). 'The phenomenon of new drugs on the Internet: the case of ketamine derivative methoxetamine (“MXE”)'. Human Psychopharmacology: Clinical and Experimental. Mar, 27(2):145-9. Corkery J. (2008), ‘UK drug-related mortality – issues in definition and classification’, Drugs and Alcohol Today, Volume 8, Issue 2, 17-25. Corkery, J.M., Schifano, F., Ghodse, A.H. (2012). Phenazepam use in the UK: an emerging problem causing serious adverse health problems, including death. Human Psychopharmacology: Clinical and Experimental. May, 27(3): 254-61. Darke, S., Duflou, J., Torok, M. (2011). Toxicology and characteristics of fatal oxycodone toxicity cases in New South Wales, Australia 1999-2008. J Forensic Sci. May, 56(3):690-3. Davies, C., English, L., Stewart, C., Edington, M., McVeigh, J. and Bellis, M.A. (eds). (2012). United Kingdom drug situation: annual report to the European Monitoring Centre for Drugs and Drug Addiction (EMCDDA) 2012. 15 November. London: Department of Health & Centre for Public Health, Liverpool John Moore's University. Available at: http://www.nwph.net/ukfocalpoint/writedir/userfiles/file/Report%202012/REPORT2012FINAL.pdf Accessed 19 December 2012. EMCDDA. (2011). Summary report for EMCDDA TrendSpotter meeting 18-19 October 2011 – Recent shocks to the European heroin market; explanations and ramifications. 15 November. Lisbon: European Monitoring Centre for Drugs & Drug Addiction. Available at: http://www.emcdda.europa.eu/attachements.cfm/att_144648_EN_TrendspotterSummaryReport.pdf Accessed 6 January 2013. Fischer, B., Jones, W., Rehm, J. (2013). High correlations between levels of consumption and mortality related to strong prescription opioid analgesics in British Columbia and Ontario, 2005 - 2009. Pharmacoepidemiol Drug Saf. Jan 14. doi: 10.1002/pds.3404. [Epub ahead of print] Gallagher, C. T., Assi, S., Stair, J. L., Fergus, S., Corazza, O., Corkery, J. M. and Schifano, F. (2012), 5,6-Methylenedioxy-2-aminoindane: from laboratory curiosity to ‘legal high’. Hum. Psychopharmacol. Clin. Exp., March, 27(2): 106–12.
np-SAD
International Centre for Drug Policy 109
Ghodse, H., Corkery, J., Oyefeso, A., Schifano, F., Ahmed, K. and Naidoo, V. (2009). Drug-related deaths in the UK: Annual Report 2009. Drug-related deaths reported by Coroners in England, Wales, Northern Ireland, Guernsey, Jersey and the Isle of Man; Police forces in Scotland; & the Northern Ireland Statistics and Research Agency – Annual Report January-December 2008. London: International Centre for Drug Policy, St George's University of London. September 2009. Available at: http://www.sgul.ac.uk/research/projects/icdp/our-work-programmes/substance-abuse-deaths Accessed 19 December 2012 Ghodse, H., Corkery, J., Ahmed, K., Naidoo, V., Oyefeso, A. and Schifano, F. (2010). Drug-related deaths in the UK: Annual Report 2010. Drug-related deaths reported by Coroners in England, Wales, Northern Ireland, Guernsey, Jersey and the Isle of Man; Police forces in Scotland; & the Northern Ireland Statistics and Research Agency – Annual Report January-December 2009. London: International Centre for Drug Policy, St George's University of London. Available at: http://www.sgul.ac.uk/research/projects/icdp/our-work-programmes/substance-abuse-deaths Accessed 19 December 2012 Ghodse, H., Corkery, J., Schifano, F. Piolanti, A. Trinca ,G. di Melchiorre,G. (2012). Drug-related deaths in the UK: Annual Report 2011. Drug-related deaths reported by Coroners in England, Wales, Northern Ireland, Guernsey, Jersey and the Isle of Man; Police forces in Scotland; & the Northern Ireland Statistics and Research Agency – Annual Report January-December 2010. London: International Centre for Drug Policy, St George's University of London. Available at: http://www.sgul.ac.uk/research/projects/icdp/our-work-programmes/substance-abuse-deaths Accessed 7 February 2013 Häkkinen, M., Launiainen, T., Vuori, E., Ojanperä, I. (2012). Comparison of fatal poisonings by prescription opioids. Forensic Sci Int. Oct 10, 222(1-3):327-31. Home Office (2012), Drug Misuse Declared: Findings from the 2011/12 British Crime Survey England and Wales (2nd Edition). Home Office Statistical Bulletin London, Home Office Science, Research and Statistics, available at: http://www.homeoffice.gov.uk/publications/science-research-statistics/research-statistics/crime-research/drugs-misuse-dec-1112/drugs-misuse-dec-1112-pdf Accessed 19 December 2012 HPA. (2012). Case of anthrax in Medway. 19 December. London: Health Protection Agency. Available at: http://www.hpa.org.uk/NewsCentre/NationalPressReleases/2012PressReleases/121219CaseofAnthraxinMedway/ Accessed 20 February 2013 HPS. (2011). National Anthrax Outbreak Control Team. An Outbreak of Anthrax Among Drug Users in Scotland, December 2009 to December 2010. December. Glasgow: Health Protection Scotland, Glasgow. Available at: http://www.hps.scot.nhs.uk/giz/publicationsdetail.aspx?id=50107. Accessed 20 February 2013 Lidell, D. (2012). Looking behind the methadone figures. 30 October. Scottish Drugs Forum. Available at: http://www.sdf.org.uk/news-and-media/sdf-news/looking-behind-the-methadone-figures/ Accessed 6 January 2013 Mounteney, J., Evans-Brown, M., Giraudon, I. (2012). EMCDDA Trendspotter study on fentanyl in Europe. 15 November. Lisbon: European Monitoring Centre for Drugs & Drug Addiction. Available at: http://www.emcdda.europa.eu/attachements.cfm/att_191974_EN_TD3112230ENN_Fentanyl.pdf Accessed 20 February 2013 NISRA. (2012). Drug-Related Deaths and Deaths due to Drug Misuse registered in Northern Ireland (2001-2011). 13 June 2012. Belfast: Northern Ireland Statistics & Research Agency. Available at: http://www.nisra.gov.uk/archive/demography/publications/drug_deaths/Drug_Tables_11.xls Accessed 19 December 2012.

np-SAD
International Centre for Drug Policy 110
NRS. (2012). Drug related deaths in Scotland in 2011. Edinburgh: National Records of Scotland. 17 August 2012. Available at: http://www.gro-scotland.gov.uk/statistics/theme/vital-events/deaths/drug-related/2011/index.html http://www.gro-scotland.gov.uk/files2/stats/drug-related-deaths/2011/drug-related-deaths2011.pdf http://www.gro-scotland.gov.uk/files2/stats/drug-related-deaths/2011/drd-2011-table-hbx.xls http://www.gro-scotland.gov.uk/files2/stats/drug-related-deaths/2011/drd-2011-table-cx.xls Accessed 20 February 2013 NTA. (2011). Addiction to medicine: an investigation into the configuration and commissioning of treatment services to support those who develop problems with prescription-only or over-the-counter medicine. 11 May. London: National Treatment Agency. Available at: http://www.nta.nhs.uk/uploads/addictiontomedicinesmay2011a.pdf Accessed 20 February 2013 ONS. (2012) Deaths related to drug poisoning in England and Wales, 2011. Statistical Bulletin. 29 August 2012. Newport, Gwent: Office for National Statistics Available with accompanying spreadsheets at: http://www.ons.gov.uk/ons/rel/subnational-health3/deaths-related-to-drug-poisoning/2011/stb-deaths-related-to-drug-poisoning-2011.html Accessed 19 December 2012. Palmateer, N. E., Ramsay, C. N., Browning, L., Goldberg, D. J. and Hutchinson, S. J. (2012). Anthrax infection among heroin users in Scotland During 2009-2010: A case-control study by linkage to a national drug treatment database. Clinical Infectious Diseases. Sep, 55(5):706-10. Rintoul, A.C., Dobbin, M.D., Drummer, O.H., Ozanne-Smith, J. (2011). Increasing deaths involving oxycodone, Victoria, Australia, 2000-09. Inj Prev. Aug, 17(4):254-9. SCDEA. (2012). SCDEA Annual Report 2011-12. July, Glasgow: Scottish Crime & Drug Enforcement Agency. Available at: http://www.sdea.police.uk/Downloads/SDEA-Annual-Report/SCDEA%20Annual%20Report%2011-12%20Final%20Version%20WEB.pdf Accessed 6 January 2013. Simonson, P. and Daly, M. (2011). The great heroin crash. Druglink, March/April, 26(2):6-7. World Health Organisation. (1992). The ICD-10 Classification of Mental and Behavioural Disorders. Clinical descriptions and diagnostic guidelines. Geneva: WHO. World Health Organisation. (2007). International Statistical Classification of Diseases and Related Health Problems - 10th Revision. (2010 edition). Geneva: WHO. Available at http://apps.who.int/classifications/icd10/browse/2010/en. Accessed 20 December 2012.
np-SAD
International Centre for Drug Policy 111
Appendices
np-SAD
International Centre for Drug Policy 112
Appendix 1: The national programme on Substance Abuse Deaths (np-SAD)
Aims and objectives The Programme’s principal aim is to reduce and prevent drug-related deaths in the UK due to the misuse of drugs, both licit and illicit, by collecting, analysing, and disseminating information on the extent and nature of death. The Programme offers a comprehensive prevention package to Drug (and Alcohol) Action Teams (DAATs), Primary Care Trusts (PCTs) and Strategic Health Authorities (SHAs) with a mission to tackle the problem of drug-related deaths. The Programme’s objectives are to:
Collect and collate drug-related mortality data
Develop and maintain a computerised surveillance system
Identify substances implicated in drug-related deaths – including new drugs and new combinations
Monitor and examine patterns and trends, e.g. geographic, demographic, substances implicated in death, method of death
Act as an early warning system for new trends in mortality and drug misuse
Use data as an indicator to estimate the prevalence of substance-related problems and assess the hazards associated with substance abuse
Collaborate with relevant agencies in research on substance-related mortality locally, nationally and internationally
Inform and facilitate discussion on the prevention of drug-related deaths, whether accidental or intentional
Provide data for local and national drug abuse policy formulation and programme planning
Disseminate information on drug-related mortality to the scientific community, clinicians, policy makers and other interested parties
Surveillance data management Data collated for this programme is stored on the np–SAD Coroners’ database which was established in 1997. Its purpose is to provide information for the Programme’s surveillance system of monitoring drug-related deaths reported by Coroners, procurators fiscal and other agencies.
Data collection All coroners in the UK (see Appendix 3) are issued with copies of the standard data collection form (see Appendix 4). They are invited to complete the forms on all deaths that meet the criteria described in this report (see Appendix 2) and return them to the np-SAD at the ICDP office at St. George’s, University of London for coding and entry onto the database. Data submission is mostly directly on paper by coroners or their staff. There is also manual completion of the np-SAD data collection form or print-out of completed computer-generated forms using bespoke software. Forms are submitted when inquests are complete – either singly or in batches. Manual extraction of data by team members is undertaken at some coroners’ courts – mostly in London. A monitoring process is undertaken to ascertain the quality of the information received from coroners, as well as the extent to which all relevant cases are being identified and submitted. This assists in further improving the quality of the various outputs that the Programme seeks to provide. Data entry and coding To enable comparison with various national and international datasets all causes of death have been coded according to the International Classification of Diseases (ICD-10). This is an international standard for the classification of diseases and health-related problems published by the World Health Organisation (1992). The online version (ICD-10 2010) has been employed for coding all substances implicated in death separately according to its therapeutic drug category, i.e. hypnotics/sedatives, anti-depressants, opiates, etc. The ‘intentionality‘ of deaths based on the Coroner’s verdict and/or or other additional information employing ICD-10 codes is inadequate for informing interested parties as to whether certain categories of drug-related deaths can be prevented.
np-SAD
International Centre for Drug Policy 113
Whilst the ‘cause’ of death (as given in the preceding section) is concerned with the disease or injury responsible for the lethal sequence of events, the ‘manner’ of death explains how the cause of death arose, i.e. a natural or violent death. The categories for ‘manner of death’ have been adopted from the UK practice (Explore Forensics http://www.exploreforensics.co.uk/the-four-manners-of-death.html) with the additional categories for those where intentionality is unclear or manner of death is impossible to determine: natural, accidental, suicidal, homicidal, undetermined, and unclassified/not specified. Verdicts of ‘dependence on drugs’ or ‘non-dependent abuse of drugs’ are regarded as ‘accidental’. The ‘manner of death’ is derived from information such as the verdict or ‘finding’, history of drug misuse or dependence, post mortem drugs, and other information; and is based on the interpretation of the death by np-SAD and clinical presentation/profile of the individual case. Statistical analysis Due to the nature of the information collected by the programme, i.e. drug-related deaths as reported by the Coroners, this is an observational study. Hence, statistical methods employed are based on proportions and ratios. Where the data include proportions of incidence for particular groups of interest, the ratio of the proportions forms a measure of the relative risk in one group compared with that of another. These scales of measurement are generally known as point estimates. Although point estimates can be calculated they do not represent the ‘true’ values. Each point estimate is subject to random variation. Confidence intervals (CI) provide an indication of the range in the true values for the population as a whole, which would be expected in future investigations. The methods used for quantitative data relied mainly on complex assumptions of distributional form. It may be the case that the assumptions are not always satisfied. In such cases, methods known as distribution-free methods can be applied, also known as non-parametric tests (e.g. Mann-Whitney). The use of decimal places varies in some contexts so as to provide greater granularity to bring out distinctions between apparently similar populations or groups. The data were analysed using IBM ® SPSS™ Statistics for Windows version 19.
Data Storage
The anonymised data-set for Coroners is held on a SPSS database for analysis. All data held, whether electronic or paper, is stored securely and treated as confidential. Access is restricted to Programme staff; only aggregated and anonymised data are released to third parties.
Other activities and resources The Programme provides information to public consultations, Parliamentary questions, Ministerial briefings, as well as contributing to the UK’s Drugs Early Warning System. As part of the early warning function, emerging trends and potential issues are brought to the attention of policy-makers and Coroners in a special briefing. Analysis of data for specific Drug and Alcohol Action Teams (DAATs), Primary Care Trusts (PCTs) and (Special Health Authorities) SHAs is undertaken on request. Findings from the Programme’s annual report and research articles is used in national and international research. For example, the key findings from the np-SAD are included in the annual report from the UK Focal Point to the EMCDDA, and in various annual United Nations publications
In addition to the above activities, the Programme
Is the official custodian of the national UK Addicts Index Access database and digitised files covering the period 1968-1997 Holds a copy of the official Dead Addicts datafile
Is located in an academic centre with input from relevant disciplines
Brings to a broad range of expertise from different professional backgrounds – psychiatry, psychology, social science, pharmacology, epidemiology, addictive behavioural science, database, project management, etc.
Has national and international experience, collaborating in research and training with bodies such as the World Health Organisation, European Monitoring Centre for Drugs and Drug Addiction (EMCDDA), and the European Collaborating Centres for Addiction Studies.
np-SAD
International Centre for Drug Policy 114
National Steering Group The np-SAD has a National Steering Group to provide additional expertise to the Programme through involvement and participation. Its
principal role is in giving advice on the full range of its activities, including the national surveillance of Coroners and production of the annual report.
np-SAD
International Centre for Drug Policy 115
Appendix 2: Definitions of drug-related death
Introduction There are a number of issues and problems associated with defining drug-related deaths and drug-related mortality. For a full
discussion see Corkery (2008) and Office for National Statistics (2012).
np-SAD definition An np-SAD case is defined as a relevant death where any of the following criteria are met at a completed inquest, fatal accident inquiry or similar investigation:
One or more psychoactive substances* directly** implicated in death;
History of dependence or abuse of psychoactive drugs;
Presence of Controlled Drugs*** at post mortem; or
Cases of deaths directly due to drugs but with no inquest.
Deaths where solvents and other volatile substances are implicated alone are also included. However, we do collect information on these cases separately; further information can be seen at http://www.vsareport.org. Alcohol is included only when implicated in combination with other qualifying drugs. * ‘Psychoactive’ substances are those having a direct effect on perception, mood, cognition, behaviour or motor function. Typically these include opiates and opioid analgesics, hypnotics, sedatives, anti-depressants, anti-epileptics, anti-psychotics, hallucinogens, and stimulants (such as amphetamines and cocaine) and “legal highs”. ** ‘Directly implicated’ means that drugs were considered by the Coroner or other person investigating the death to have been
instrumental in the coming about of the deceased’s death (e.g. through poisoning or intoxication), or causing their powers of reasoning and/or perception to be so affected as to induce them to take risks which they would not have done had they been sober (e.g. thinking they could fly). *** ‘Controlled Drugs’ are those drugs specifically classified by the Misuse of Drugs Act 1971 as amended by subsequent legislation. Controlled drugs include opioids, cocaine, amphetamines, cannabis, GHB, hallucinogens and most benzodiazepines. Who is a drug abuser/dependent? A drug abuser/dependent case is defined as one with a history of substance abuse where one or more of the following criteria are met:
Reported as a known illicit drug user by the coroner, based on evidence obtained at inquest;
Prescribed substitute medication for drug dependence;
Presence of an illicit drug at post mortem, where not prescribed; or
Presence of any additional information on the Coroner’s report suggestive of a history of drug abuse, and where such a history fulfils ICD-10 criteria: (F11-F16 and F19, using the 4-code subdivisions of .0 (acute intoxication), .1 (harmful use), and .2 (dependence syndrome).
“Drug misuse” definition Cause of death categories included in the headline indicator of ‘drug misuse’ deaths used to monitor progress against the Government’s drug strategy are defined in terms of ICD-10 codes and Controlled Drug Status. The relevant codes from ICD-10 are given in brackets. The definition comprises two types of deaths:
a) deaths where the underlying cause of death has been coded to the following categories of mental and behavioural disorders due to psychoactive substance use (excluding alcohol, tobacco and volatile solvents): (i) opioids (F11); (ii) cannabinoids (F12); (iii) sedatives or hypnotics (F13);
np-SAD
International Centre for Drug Policy 116
(iv) cocaine (F14); (v) other stimulants, including caffeine (F15); (vi) hallucinogens (F16); and (vii) multiple drug use and use of other psychoactive substances (F19) b) deaths coded to the following categories and where a drug controlled under the Misuse of Drugs Act 1971 was mentioned on the death record: (i) Accidental poisoning by drugs, medicaments and biological substances (X40–X44); (ii) Intentional self-poisoning by drugs, medicaments and biological substances (X60–X64); (iii) Poisoning by drugs, medicaments and biological substances, undetermined intent (Y10–14); (iv) Assault by drugs, medicaments and biological substances (X85); and (v) Mental and behavioural disorders due to use of volatile solvents (F18) Notes: 1. Deaths coded to opiate abuse which resulted from the injection of contaminated heroin have been included in the indicator. This differs from the approach taken in Scotland, where these deaths have been excluded. This is because the General Register Office for Scotland (GROS) is able to identify deaths which occurred as a result of
the use of contaminated heroin, whereas in England and Wales, these deaths cannot be readily identified. In practice, in England and Wales, they will only be included where the drug was mentioned on the death record and the death was coded to one of the ICD codes on the ONS database of drug-related poisonings and not to an infection code. 2. Specific rules were adopted for dealing with compound analgesics which contain relatively small quantities of drugs listed under the Misuse of Drugs Act, the major ones being dextropropoxyphene, dihydrocodeine and codeine. Where these drugs are mentioned on a death record, they have been excluded if they are part of a compound analgesic (such as co-proxamol, co-dydramol or co-codamol) or cold remedy. Dextropropoxyphene has been excluded on all occasions, whether or not paracetamol or a compound analgesic was mentioned. This is because dextropropoxyphene is rarely, if ever, available other than as part of a paracetamol compound. However, codeine or dihydrocodeine mentioned alone were included in the indicator. This is because they are routinely available and known to be abused in this form. This approach is taken by both the Office for National Statistics and the General Register Office for Scotland. 3. Drugs controlled under the Misuse of Drugs Act 1971 include class A, B and C drugs.
Definition used by SCDEA Deaths reported to the SCDEA by Scottish police forces are those which meet the definition used by the Association of Chief Police Officers (Scotland) – “where there is prima facie evidence of a fatal overdose of controlled drugs. Such evidence would be recent drug misuse, for example controlled
drugs and/or a hypodermic syringe found in close proximity to the body and/or the person is known to the police as a drug misuser although not necessarily a notified addict.” Thus, most suicides in Scotland will be excluded.
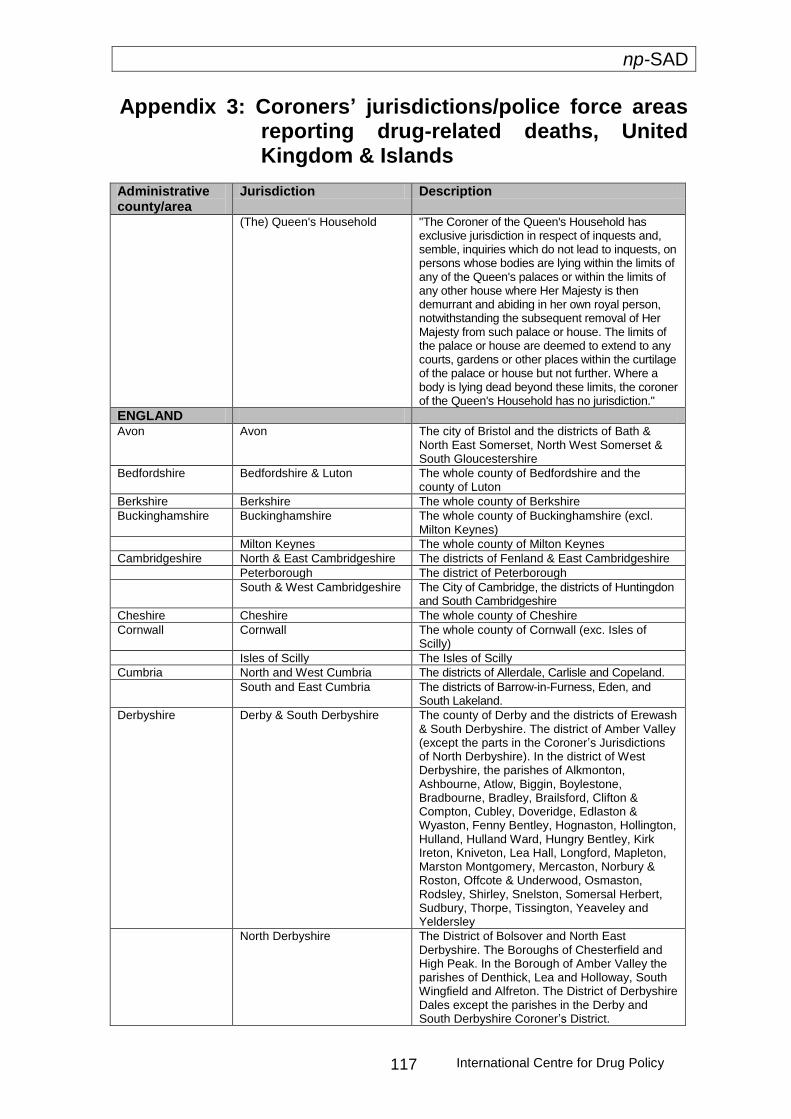
np-SAD
International Centre for Drug Policy 117
Appendix 3: Coroners’ jurisdictions/police force areas reporting drug-related deaths, United Kingdom & Islands
Administrative county/area
Jurisdiction Description
(The) Queen's Household "The Coroner of the Queen's Household has exclusive jurisdiction in respect of inquests and, semble, inquiries which do not lead to inquests, on persons whose bodies are lying within the limits of any of the Queen's palaces or within the limits of any other house where Her Majesty is then demurrant and abiding in her own royal person, notwithstanding the subsequent removal of Her Majesty from such palace or house. The limits of the palace or house are deemed to extend to any courts, gardens or other places within the curtilage of the palace or house but not further. Where a body is lying dead beyond these limits, the coroner of the Queen's Household has no jurisdiction."
ENGLAND Avon Avon The city of Bristol and the districts of Bath &
North East Somerset, North West Somerset & South Gloucestershire
Bedfordshire Bedfordshire & Luton The whole county of Bedfordshire and the county of Luton
Berkshire Berkshire The whole county of Berkshire
Buckinghamshire Buckinghamshire The whole county of Buckinghamshire (excl. Milton Keynes)
Milton Keynes The whole county of Milton Keynes
Cambridgeshire North & East Cambridgeshire The districts of Fenland & East Cambridgeshire
Peterborough The district of Peterborough
South & West Cambridgeshire The City of Cambridge, the districts of Huntingdon and South Cambridgeshire
Cheshire Cheshire The whole county of Cheshire
Cornwall Cornwall The whole county of Cornwall (exc. Isles of Scilly)
Isles of Scilly The Isles of Scilly
Cumbria North and West Cumbria The districts of Allerdale, Carlisle and Copeland.
South and East Cumbria The districts of Barrow-in-Furness, Eden, and South Lakeland.
Derbyshire Derby & South Derbyshire The county of Derby and the districts of Erewash & South Derbyshire. The district of Amber Valley (except the parts in the Coroner’s Jurisdictions of North Derbyshire). In the district of West Derbyshire, the parishes of Alkmonton, Ashbourne, Atlow, Biggin, Boylestone, Bradbourne, Bradley, Brailsford, Clifton & Compton, Cubley, Doveridge, Edlaston & Wyaston, Fenny Bentley, Hognaston, Hollington, Hulland, Hulland Ward, Hungry Bentley, Kirk Ireton, Kniveton, Lea Hall, Longford, Mapleton, Marston Montgomery, Mercaston, Norbury & Roston, Offcote & Underwood, Osmaston, Rodsley, Shirley, Snelston, Somersal Herbert, Sudbury, Thorpe, Tissington, Yeaveley and Yeldersley
North Derbyshire The District of Bolsover and North East Derbyshire. The Boroughs of Chesterfield and High Peak. In the Borough of Amber Valley the parishes of Denthick, Lea and Holloway, South Wingfield and Alfreton. The District of Derbyshire Dales except the parishes in the Derby and South Derbyshire Coroner’s District.
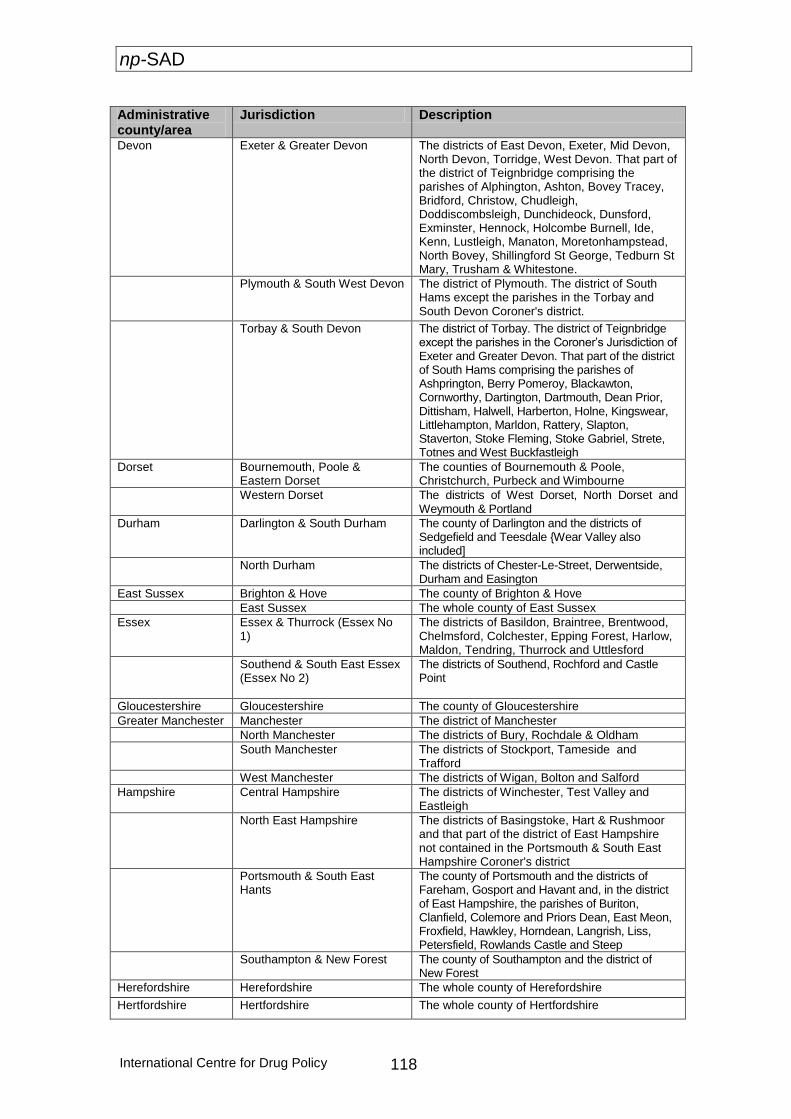
np-SAD
International Centre for Drug Policy 118
Administrative county/area
Jurisdiction Description
Devon Exeter & Greater Devon The districts of East Devon, Exeter, Mid Devon, North Devon, Torridge, West Devon. That part of the district of Teignbridge comprising the parishes of Alphington, Ashton, Bovey Tracey, Bridford, Christow, Chudleigh, Doddiscombsleigh, Dunchideock, Dunsford, Exminster, Hennock, Holcombe Burnell, Ide, Kenn, Lustleigh, Manaton, Moretonhampstead, North Bovey, Shillingford St George, Tedburn St Mary, Trusham & Whitestone.
Plymouth & South West Devon The district of Plymouth. The district of South Hams except the parishes in the Torbay and South Devon Coroner's district.
Torbay & South Devon The district of Torbay. The district of Teignbridge except the parishes in the Coroner’s Jurisdiction of Exeter and Greater Devon. That part of the district of South Hams comprising the parishes of Ashprington, Berry Pomeroy, Blackawton, Cornworthy, Dartington, Dartmouth, Dean Prior, Dittisham, Halwell, Harberton, Holne, Kingswear, Littlehampton, Marldon, Rattery, Slapton, Staverton, Stoke Fleming, Stoke Gabriel, Strete, Totnes and West Buckfastleigh
Dorset Bournemouth, Poole & Eastern Dorset
The counties of Bournemouth & Poole, Christchurch, Purbeck and Wimbourne
Western Dorset The districts of West Dorset, North Dorset and Weymouth & Portland
Durham Darlington & South Durham The county of Darlington and the districts of Sedgefield and Teesdale {Wear Valley also included]
North Durham The districts of Chester-Le-Street, Derwentside, Durham and Easington
East Sussex Brighton & Hove The county of Brighton & Hove
East Sussex The whole county of East Sussex
Essex Essex & Thurrock (Essex No 1)
The districts of Basildon, Braintree, Brentwood, Chelmsford, Colchester, Epping Forest, Harlow, Maldon, Tendring, Thurrock and Uttlesford
Southend & South East Essex (Essex No 2)
The districts of Southend, Rochford and Castle Point
Gloucestershire Gloucestershire The county of Gloucestershire
Greater Manchester Manchester The district of Manchester
North Manchester The districts of Bury, Rochdale & Oldham
South Manchester The districts of Stockport, Tameside and Trafford
West Manchester The districts of Wigan, Bolton and Salford
Hampshire Central Hampshire The districts of Winchester, Test Valley and Eastleigh
North East Hampshire The districts of Basingstoke, Hart & Rushmoor and that part of the district of East Hampshire not contained in the Portsmouth & South East Hampshire Coroner's district
Portsmouth & South East Hants
The county of Portsmouth and the districts of Fareham, Gosport and Havant and, in the district of East Hampshire, the parishes of Buriton, Clanfield, Colemore and Priors Dean, East Meon, Froxfield, Hawkley, Horndean, Langrish, Liss, Petersfield, Rowlands Castle and Steep
Southampton & New Forest The county of Southampton and the district of New Forest
Herefordshire Herefordshire The whole county of Herefordshire
Hertfordshire Hertfordshire The whole county of Hertfordshire
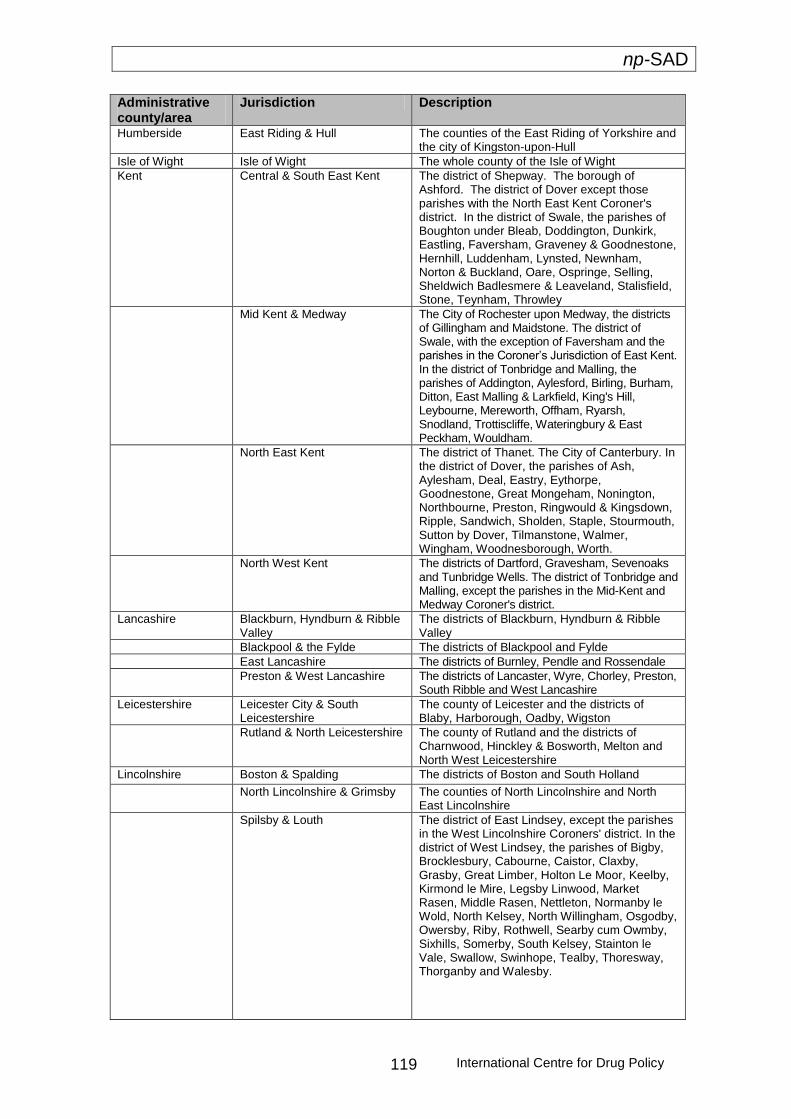
np-SAD
International Centre for Drug Policy 119
Administrative county/area
Jurisdiction Description
Humberside East Riding & Hull The counties of the East Riding of Yorkshire and the city of Kingston-upon-Hull
Isle of Wight Isle of Wight The whole county of the Isle of Wight
Kent Central & South East Kent The district of Shepway. The borough of Ashford. The district of Dover except those parishes with the North East Kent Coroner's district. In the district of Swale, the parishes of Boughton under Bleab, Doddington, Dunkirk, Eastling, Faversham, Graveney & Goodnestone, Hernhill, Luddenham, Lynsted, Newnham, Norton & Buckland, Oare, Ospringe, Selling, Sheldwich Badlesmere & Leaveland, Stalisfield, Stone, Teynham, Throwley
Mid Kent & Medway The City of Rochester upon Medway, the districts of Gillingham and Maidstone. The district of Swale, with the exception of Faversham and the parishes in the Coroner’s Jurisdiction of East Kent. In the district of Tonbridge and Malling, the parishes of Addington, Aylesford, Birling, Burham, Ditton, East Malling & Larkfield, King's Hill, Leybourne, Mereworth, Offham, Ryarsh, Snodland, Trottiscliffe, Wateringbury & East Peckham, Wouldham.
North East Kent The district of Thanet. The City of Canterbury. In the district of Dover, the parishes of Ash, Aylesham, Deal, Eastry, Eythorpe, Goodnestone, Great Mongeham, Nonington, Northbourne, Preston, Ringwould & Kingsdown, Ripple, Sandwich, Sholden, Staple, Stourmouth, Sutton by Dover, Tilmanstone, Walmer, Wingham, Woodnesborough, Worth.
North West Kent The districts of Dartford, Gravesham, Sevenoaks and Tunbridge Wells. The district of Tonbridge and Malling, except the parishes in the Mid-Kent and Medway Coroner's district.
Lancashire Blackburn, Hyndburn & Ribble Valley
The districts of Blackburn, Hyndburn & Ribble Valley
Blackpool & the Fylde The districts of Blackpool and Fylde
East Lancashire The districts of Burnley, Pendle and Rossendale
Preston & West Lancashire The districts of Lancaster, Wyre, Chorley, Preston, South Ribble and West Lancashire
Leicestershire Leicester City & South Leicestershire
The county of Leicester and the districts of Blaby, Harborough, Oadby, Wigston
Rutland & North Leicestershire The county of Rutland and the districts of Charnwood, Hinckley & Bosworth, Melton and North West Leicestershire
Lincolnshire Boston & Spalding The districts of Boston and South Holland
North Lincolnshire & Grimsby The counties of North Lincolnshire and North East Lincolnshire
Spilsby & Louth The district of East Lindsey, except the parishes in the West Lincolnshire Coroners' district. In the district of West Lindsey, the parishes of Bigby, Brocklesbury, Cabourne, Caistor, Claxby, Grasby, Great Limber, Holton Le Moor, Keelby, Kirmond le Mire, Legsby Linwood, Market Rasen, Middle Rasen, Nettleton, Normanby le Wold, North Kelsey, North Willingham, Osgodby, Owersby, Riby, Rothwell, Searby cum Owmby, Sixhills, Somerby, South Kelsey, Stainton le Vale, Swallow, Swinhope, Tealby, Thoresway, Thorganby and Walesby.
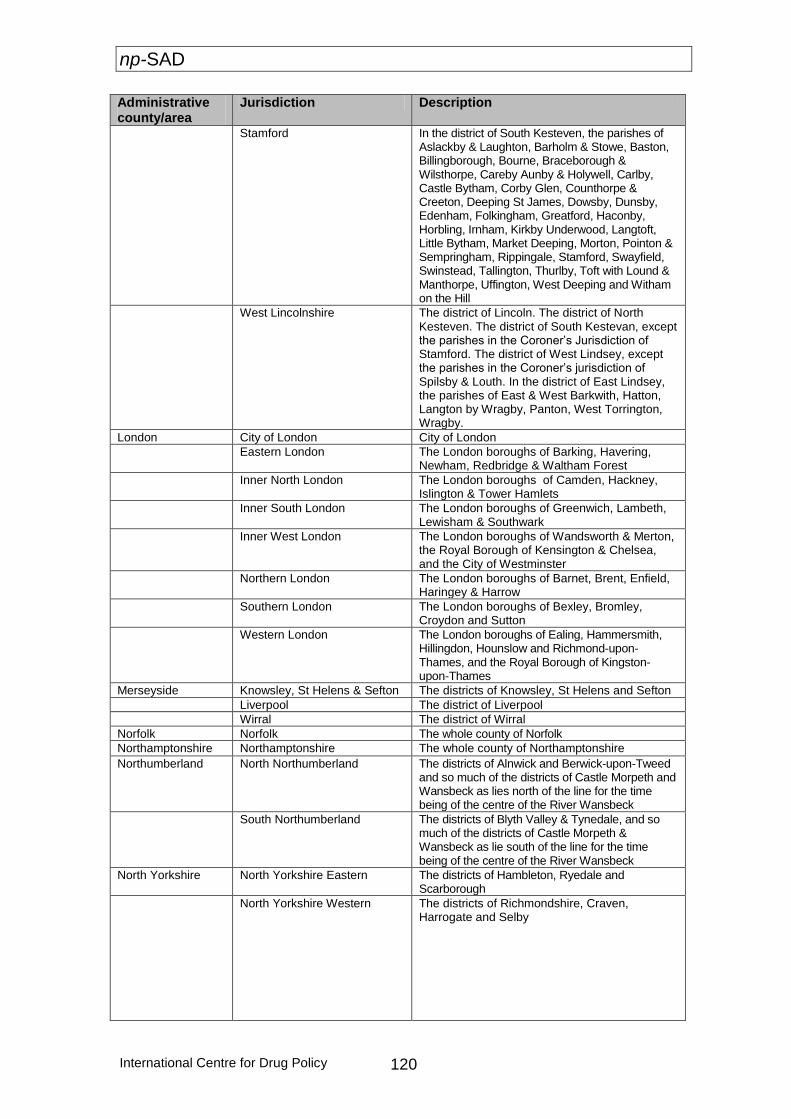
np-SAD
International Centre for Drug Policy 120
Administrative county/area
Jurisdiction Description
Stamford In the district of South Kesteven, the parishes of Aslackby & Laughton, Barholm & Stowe, Baston, Billingborough, Bourne, Braceborough & Wilsthorpe, Careby Aunby & Holywell, Carlby, Castle Bytham, Corby Glen, Counthorpe & Creeton, Deeping St James, Dowsby, Dunsby, Edenham, Folkingham, Greatford, Haconby, Horbling, Irnham, Kirkby Underwood, Langtoft, Little Bytham, Market Deeping, Morton, Pointon & Sempringham, Rippingale, Stamford, Swayfield, Swinstead, Tallington, Thurlby, Toft with Lound & Manthorpe, Uffington, West Deeping and Witham on the Hill
West Lincolnshire The district of Lincoln. The district of North Kesteven. The district of South Kestevan, except the parishes in the Coroner’s Jurisdiction of Stamford. The district of West Lindsey, except the parishes in the Coroner’s jurisdiction of Spilsby & Louth. In the district of East Lindsey, the parishes of East & West Barkwith, Hatton, Langton by Wragby, Panton, West Torrington, Wragby.
London City of London City of London
Eastern London The London boroughs of Barking, Havering, Newham, Redbridge & Waltham Forest
Inner North London The London boroughs of Camden, Hackney, Islington & Tower Hamlets
Inner South London The London boroughs of Greenwich, Lambeth, Lewisham & Southwark
Inner West London The London boroughs of Wandsworth & Merton, the Royal Borough of Kensington & Chelsea, and the City of Westminster
Northern London The London boroughs of Barnet, Brent, Enfield, Haringey & Harrow
Southern London The London boroughs of Bexley, Bromley, Croydon and Sutton
Western London The London boroughs of Ealing, Hammersmith, Hillingdon, Hounslow and Richmond-upon-Thames, and the Royal Borough of Kingston-upon-Thames
Merseyside Knowsley, St Helens & Sefton The districts of Knowsley, St Helens and Sefton
Liverpool The district of Liverpool
Wirral The district of Wirral
Norfolk Norfolk The whole county of Norfolk
Northamptonshire Northamptonshire The whole county of Northamptonshire
Northumberland North Northumberland The districts of Alnwick and Berwick-upon-Tweed and so much of the districts of Castle Morpeth and Wansbeck as lies north of the line for the time being of the centre of the River Wansbeck
South Northumberland The districts of Blyth Valley & Tynedale, and so much of the districts of Castle Morpeth & Wansbeck as lie south of the line for the time being of the centre of the River Wansbeck
North Yorkshire North Yorkshire Eastern The districts of Hambleton, Ryedale and Scarborough
North Yorkshire Western The districts of Richmondshire, Craven, Harrogate and Selby
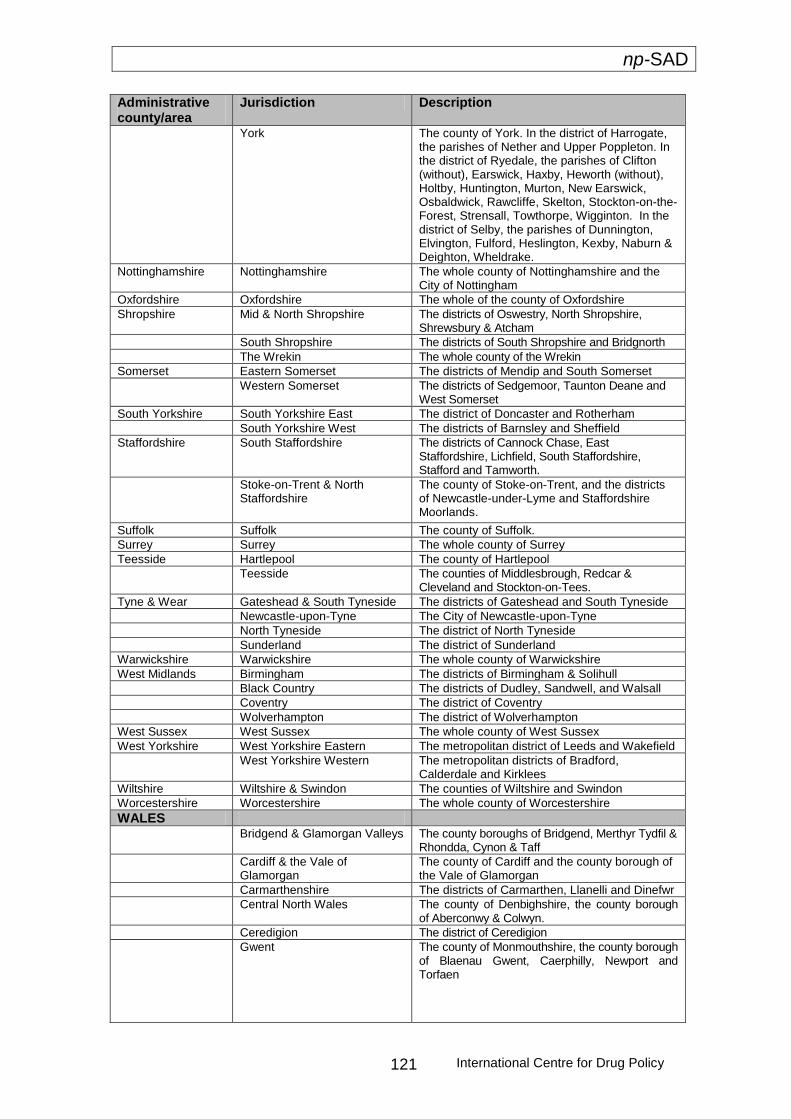
np-SAD
International Centre for Drug Policy 121
Administrative county/area
Jurisdiction Description
York The county of York. In the district of Harrogate, the parishes of Nether and Upper Poppleton. In the district of Ryedale, the parishes of Clifton (without), Earswick, Haxby, Heworth (without), Holtby, Huntington, Murton, New Earswick, Osbaldwick, Rawcliffe, Skelton, Stockton-on-the- Forest, Strensall, Towthorpe, Wigginton. In the district of Selby, the parishes of Dunnington, Elvington, Fulford, Heslington, Kexby, Naburn & Deighton, Wheldrake.
Nottinghamshire Nottinghamshire The whole county of Nottinghamshire and the City of Nottingham
Oxfordshire Oxfordshire The whole of the county of Oxfordshire
Shropshire Mid & North Shropshire The districts of Oswestry, North Shropshire, Shrewsbury & Atcham
South Shropshire The districts of South Shropshire and Bridgnorth
The Wrekin The whole county of the Wrekin
Somerset Eastern Somerset The districts of Mendip and South Somerset
Western Somerset The districts of Sedgemoor, Taunton Deane and West Somerset
South Yorkshire South Yorkshire East The district of Doncaster and Rotherham
South Yorkshire West The districts of Barnsley and Sheffield
Staffordshire South Staffordshire The districts of Cannock Chase, East Staffordshire, Lichfield, South Staffordshire, Stafford and Tamworth.
Stoke-on-Trent & North Staffordshire
The county of Stoke-on-Trent, and the districts of Newcastle-under-Lyme and Staffordshire Moorlands.
Suffolk Suffolk The county of Suffolk.
Surrey Surrey The whole county of Surrey
Teesside Hartlepool The county of Hartlepool
Teesside The counties of Middlesbrough, Redcar & Cleveland and Stockton-on-Tees.
Tyne & Wear Gateshead & South Tyneside The districts of Gateshead and South Tyneside
Newcastle-upon-Tyne The City of Newcastle-upon-Tyne
North Tyneside The district of North Tyneside
Sunderland The district of Sunderland
Warwickshire Warwickshire The whole county of Warwickshire
West Midlands Birmingham The districts of Birmingham & Solihull
Black Country The districts of Dudley, Sandwell, and Walsall
Coventry The district of Coventry
Wolverhampton The district of Wolverhampton
West Sussex West Sussex The whole county of West Sussex
West Yorkshire West Yorkshire Eastern The metropolitan district of Leeds and Wakefield
West Yorkshire Western The metropolitan districts of Bradford, Calderdale and Kirklees
Wiltshire Wiltshire & Swindon The counties of Wiltshire and Swindon
Worcestershire Worcestershire The whole county of Worcestershire
WALES Bridgend & Glamorgan Valleys The county boroughs of Bridgend, Merthyr Tydfil &
Rhondda, Cynon & Taff
Cardiff & the Vale of Glamorgan
The county of Cardiff and the county borough of the Vale of Glamorgan
Carmarthenshire The districts of Carmarthen, Llanelli and Dinefwr
Central North Wales The county of Denbighshire, the county borough of Aberconwy & Colwyn.
Ceredigion The district of Ceredigion
Gwent The county of Monmouthshire, the county borough of Blaenau Gwent, Caerphilly, Newport and Torfaen
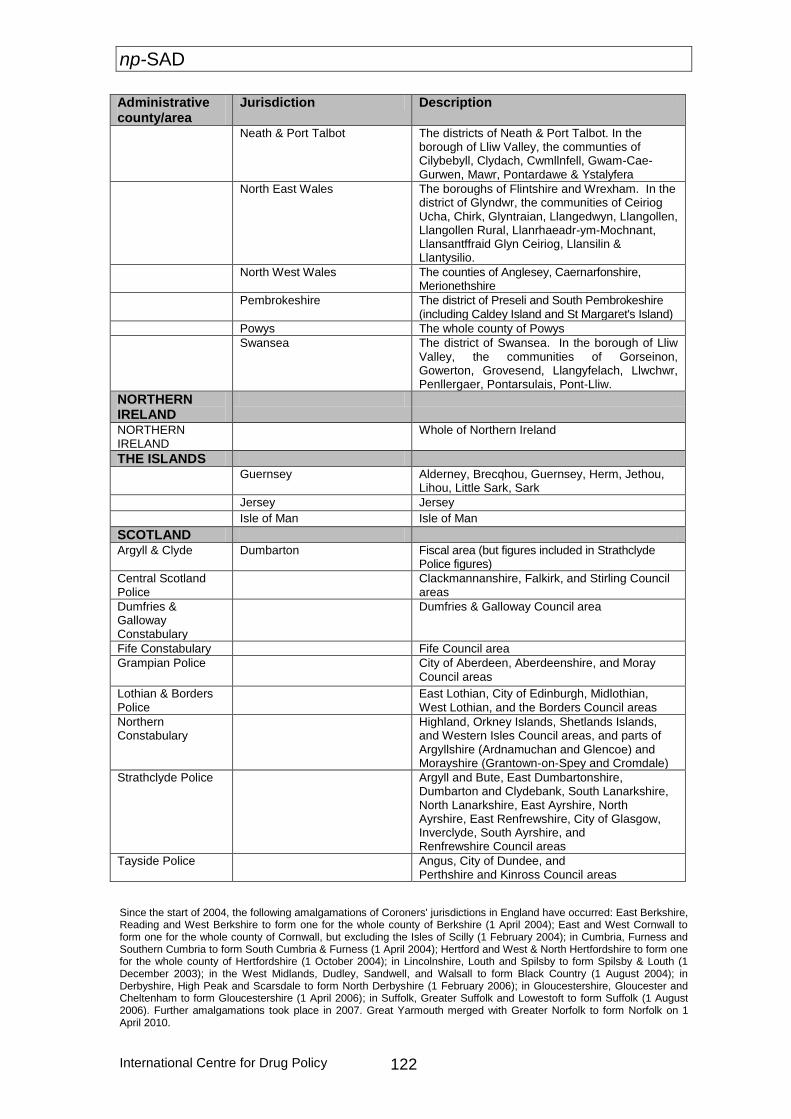
np-SAD
International Centre for Drug Policy 122
Administrative county/area
Jurisdiction Description
Neath & Port Talbot The districts of Neath & Port Talbot. In the borough of Lliw Valley, the communties of Cilybebyll, Clydach, Cwmllnfell, Gwam-Cae-Gurwen, Mawr, Pontardawe & Ystalyfera
North East Wales The boroughs of Flintshire and Wrexham. In the district of Glyndwr, the communities of Ceiriog Ucha, Chirk, Glyntraian, Llangedwyn, Llangollen, Llangollen Rural, Llanrhaeadr-ym-Mochnant, Llansantffraid Glyn Ceiriog, Llansilin & Llantysilio.
North West Wales The counties of Anglesey, Caernarfonshire, Merionethshire
Pembrokeshire The district of Preseli and South Pembrokeshire (including Caldey Island and St Margaret's Island)
Powys The whole county of Powys
Swansea The district of Swansea. In the borough of Lliw Valley, the communities of Gorseinon, Gowerton, Grovesend, Llangyfelach, Llwchwr, Penllergaer, Pontarsulais, Pont-Lliw.
NORTHERN IRELAND
NORTHERN IRELAND
Whole of Northern Ireland
THE ISLANDS
Guernsey Alderney, Brecqhou, Guernsey, Herm, Jethou, Lihou, Little Sark, Sark
Jersey Jersey
Isle of Man Isle of Man
SCOTLAND Argyll & Clyde Dumbarton Fiscal area (but figures included in Strathclyde
Police figures)
Central Scotland Police
Clackmannanshire, Falkirk, and Stirling Council areas
Dumfries & Galloway Constabulary
Dumfries & Galloway Council area
Fife Constabulary Fife Council area
Grampian Police City of Aberdeen, Aberdeenshire, and Moray Council areas
Lothian & Borders Police
East Lothian, City of Edinburgh, Midlothian, West Lothian, and the Borders Council areas
Northern Constabulary
Highland, Orkney Islands, Shetlands Islands, and Western Isles Council areas, and parts of Argyllshire (Ardnamuchan and Glencoe) and Morayshire (Grantown-on-Spey and Cromdale)
Strathclyde Police Argyll and Bute, East Dumbartonshire, Dumbarton and Clydebank, South Lanarkshire, North Lanarkshire, East Ayrshire, North Ayrshire, East Renfrewshire, City of Glasgow, Inverclyde, South Ayrshire, and Renfrewshire Council areas
Tayside Police Angus, City of Dundee, and Perthshire and Kinross Council areas
Since the start of 2004, the following amalgamations of Coroners' jurisdictions in England have occurred: East Berkshire, Reading and West Berkshire to form one for the whole county of Berkshire (1 April 2004); East and West Cornwall to form one for the whole county of Cornwall, but excluding the Isles of Scilly (1 February 2004); in Cumbria, Furness and Southern Cumbria to form South Cumbria & Furness (1 April 2004); Hertford and West & North Hertfordshire to form one for the whole county of Hertfordshire (1 October 2004); in Lincolnshire, Louth and Spilsby to form Spilsby & Louth (1 December 2003); in the West Midlands, Dudley, Sandwell, and Walsall to form Black Country (1 August 2004); in Derbyshire, High Peak and Scarsdale to form North Derbyshire (1 February 2006); in Gloucestershire, Gloucester and Cheltenham to form Gloucestershire (1 April 2006); in Suffolk, Greater Suffolk and Lowestoft to form Suffolk (1 August 2006). Further amalgamations took place in 2007. Great Yarmouth merged with Greater Norfolk to form Norfolk on 1 April 2010.
np-SAD
International Centre for Drug Policy 123
The retirement of several Coroners has resulted in some Coroners taking on responsibility for additional jurisdictions. The Isles of Scilly (regarded as part of Cornwall) are currently being looked after by the Coroner for Plymouth & South West Devon. Data for Herefordshire are also submitted now together with those for Worcestershire. The two jurisdictions in Durham are now being looked after by the same Coroner, but have not been formally amalgamated. The Coroner for Suffolk is also Coroner for Southend & South East Essex. In Northern Ireland there has been a single Coroner’s area covering the whole of the Province since 1 April 2006. It is centred on the Greater Belfast office and served by three full-time Coroners, overseen by a High Court judge.
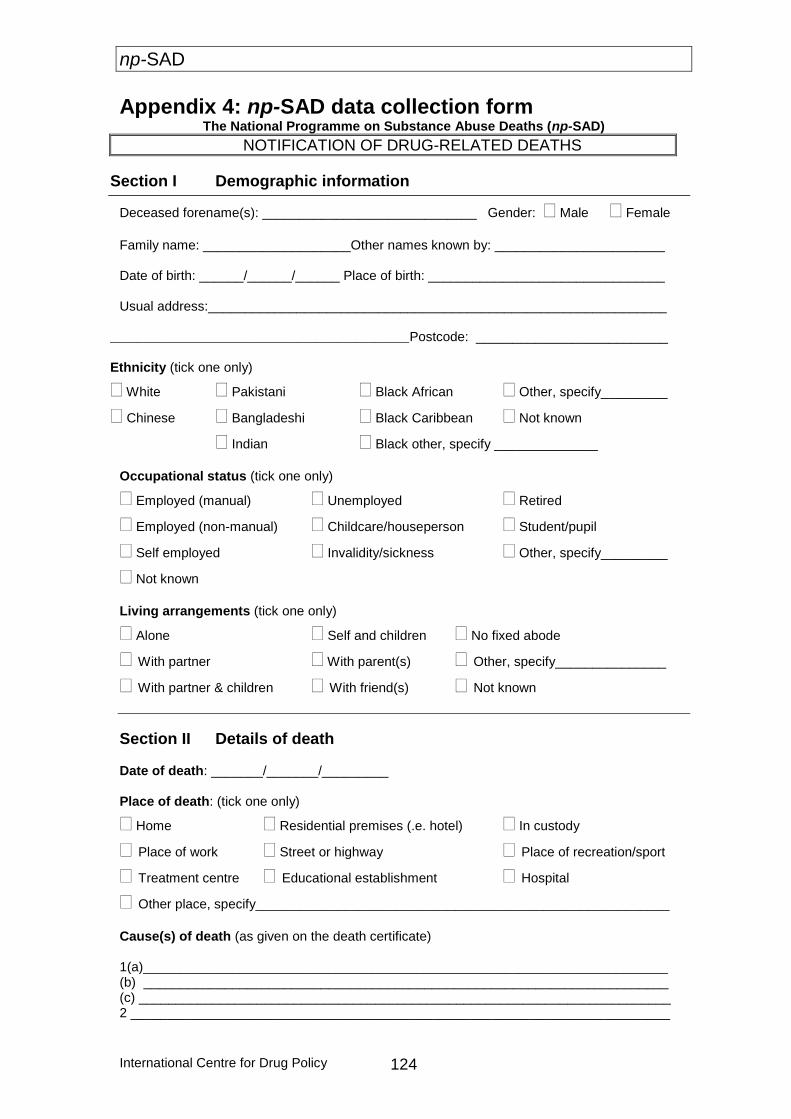
np-SAD
International Centre for Drug Policy 124
Appendix 4: np-SAD data collection form The National Programme on Substance Abuse Deaths (np-SAD)
NOTIFICATION OF DRUG-RELATED DEATHS
Section I Demographic information
Deceased forename(s): _____________________________ Gender: Male Female
Family name: ____________________Other names known by: _______________________
Date of birth: ______/______/______ Place of birth: ________________________________
Usual address:______________________________________________________________
_____________________________________________Postcode: __________________________
Ethnicity (tick one only)
White Pakistani Black African Other, specify_________
Chinese Bangladeshi Black Caribbean Not known
Indian Black other, specify ______________
Occupational status (tick one only)
Employed (manual) Unemployed Retired
Employed (non-manual) Childcare/houseperson Student/pupil
Self employed Invalidity/sickness Other, specify_________
Not known
Living arrangements (tick one only)
Alone Self and children No fixed abode
With partner With parent(s) Other, specify_______________
With partner & children With friend(s) Not known
Section II Details of death
Date of death: _______/_______/_________
Place of death: (tick one only)
Home Residential premises (.e. hotel) In custody
Place of work Street or highway Place of recreation/sport
Treatment centre Educational establishment Hospital
Other place, specify________________________________________________________
Cause(s) of death (as given on the death certificate)
1(a)_______________________________________________________________________ (b) _______________________________________________________________________
(c) ________________________________________________________________________ 2 _________________________________________________________________________
np-SAD
International Centre for Drug Policy 125
The National Programme on Substance Abuse Deaths (np-SAD)
Toxicology Please list drugs and alcohol present at post mortem (in order of importance, if known)
Drug/alcohol Level Drug/alcohol Level
B T U B T U
1 4
2 5
3 6
B = Blood; T = Tissues; U = Urine
Section III Coroner’s verdict
Section IV Background information Recent history of drug use and other relevant information: e.g. evidence of injecting drug use; evidence of ‘crack’ use; recently released from prison or discharged from treatment programme; psychiatric history; known to alcohol/drug services; length of use; poly-substance user; known health problems associated with substance misuse; last 24 hours of life (if known), time police summoned, any drugs paraphernalia, etc.:
Was the deceased on prescribed psychoactive medication? Yes No Not known If yes, please list drugs: 1 _______________________________ 2 ___________________________ 3 _______________________________ 4 ___________________________ 5 _______________________________ 6 ___________________________
Was the deceased a drug addict or known drug abuser? Yes No Not known
Section V Coroner’s details Coroner’s name: __________________________Date inquest completed: ____/_____/_____ Jurisdiction: __________________________________ Office: _______________________ Signature: ___________________________________ Date: _______/________/________
Please send completed form to:
National Programme on Substance Abuse Deaths (np-SAD) International Centre for Drug Policy St George’s, University of London
FREEPOST LON 10141, London SW17 0BR
For general enquiries: Tel 020 8725 5522 or Fax 020 8725 3538
This form is available electronically
np-SAD
International Centre for Drug Policy 126
© 2013 International Centre for Drug Policy
All rights reserved. No part of this publication may be reproduced, stored in a retrieval system,
or transmitted in any form, without the written permission of the publisher.
ISBN: 978 1 897778 79 1
Copies available from National Programme on Substance Abuse Deaths (np-SAD) International Centre for Drug Policy (ICDP) St George’s, University of London Cranmer Terrace London SW17 0RE Tel: +44 (0)20 8725 5522 Fax: +44 (0)20 8725 3538 E-mail: [email protected] Issued in 2013