driving technological innovation for a low-carbon …...driving technological innovation for a...
TRANSCRIPT

Driving Technological Innovation for a Low-Carbon Society
Case Studies for Solar Photovoltaics and Carbon Capture and Storage
Annika Varnäs, Jesse Fahnestock, Björn Nykvist, Chelsea Chandler, Peter Erickson, Måns Nilsson,
Guoyi Han, Michael Lazarus, Karl Hallding
Research Report, Stockholm Environment Institute, 2012


Driving Technological Innovation for a Low-Carbon Society
Case Studies for Solar Photovoltaics and Carbon Capture and Storage
Annika Varnäs, Jesse Fahnestock, Björn Nykvist, Chelsea Chandler, Peter Erickson, Måns Nilsson, Guoyi Han, Michael Lazarus, Karl Hallding

Stockholm Environment InstituteKräftriket 2B106 91 Stockholm Sweden
Tel: +46 8 674 7070Fax: +46 8 674 7020Web: www.sei-international.orgDirector of Communications: Robert WattPublications Manager: Erik WillisEditing: Andrew MashLayout: Richard Clay
Cover photo: © now picnic/flickr
This publication may be reproduced in whole or in part and in any form for educational or non-profit purposes, without special permission from the copyright holder(s) provided acknowledgement of the source is made. No use of this publication may be made for resale or other commercial purpose, without the written permission of the copyright holder(s).
The publication of this report has been made possible through financial support provided by the business leaders’ initiative 3C (Combat Climate Change).
Copyright © February 2012 by Stockholm Environment Institute
ISBN 978-91-86125-38-7

iii
ContentsAcronyms and abbreviations ivList of tables vList of figures viList of boxes viiAcknowledgements vii
Executive summary 1
1. Introduction 5
2. Governance for low carbon technology innovations 8
2.1 Governance of innovation: a brief view on the literature 82.2 TIS analysis and research design 13
3. Solar photovoltaics 17
3.1 Solar PV introduction 173.2 Case study: solar PV in Europe 253.3 Case study: solar PV in the USA 423.4 Short case study: PV in China 623.5 Short case study: PV in India 66
4. Carbon capture and storage 70
4.1 CCS introduction 704.2 Case study: CCS in Europe 764.3 Case study: CCS in the USA 88
5. Cross-case analysis and discussion 100
5.1 What are the barriers to and drivers of innovation in the respective innovation system? 100
5.2 What is the geographical scope of the systems and how does this affect the innovation process? 102
5.3 What policies have been used and how have they contributed to achieving innovations and deployment? 105
6. References 109

iv
ACronyms And AbbreviAtions
ARPA-E Advanced Research Projects Agency-EnergyARRA American Recovery and Reinvestment ActBIPV building-integrated photovoltaicsBoS balance of systemCDM Clean Development MechanismCEC Commission of the European CommunitiesCCS carbon capture and storageCdTe cadmium tellurideCIGS copper indium gallium diselenideCIS copper indium seleniumc-Si crystalline siliconCO2 carbon dioxideCPV concentrating photovoltaicsCREBs clean renewable energy bondsDOE US Department of EnergyECF European Climate FoundationEERP European Economic Recovery PlanEIB European Investment BankEOR enhanced oil recoveryEPA Environmental Protection AgencyEPAct Energy Policy ActEPIA European Photovoltaic Industry AssociationEU ETS European Emissions Trading SchemeEUR euroFP Framework ProgrammeGT gigatonneGTM Greentech MediaGW gigawattH2 hydrogenHVDC high voltage direct currentIGCC integrated gasification combined cycleIEA International Energy AgencyIEA PVPS International Energy Agency Photovoltaic Power Systems ProgrammeIPCC United Nations Intergovernmental Panel on Climate ChangeITC investor tax creditJI joint implementationkWh kilo watt hourNREAPs National Renewable Energy Action PlansLCOE levelized costs of electricity generationMW mega wattMWp mega watt peakNGO non-governmental organisationNER New Entrants’ ReserveNOK Norwegian krone

v
List of tAbLes
Table 2.1: Functions to be analysed in a TIS analysis as suggested by Hekkert et al., (2007) 15
Table 3.1: PV technology state-of-the-art and major objectives/milestones for the coming years 20
Table 3.2: Estimations of so called dynamic grid parity for select European countries 22
Table 3.3: Levelised Cost of Electricity estimates (USD/kwh) for utility scale installations, projected by EPIA (2011b) and IEA (2010b) compared with costs for generating electricity with coal and gas 22
Table 3.4: Major Europe based PV module and cell manufacturers 29Table 3.5: EU level policies of relevance for PV deployment 31Table 3.6: Support schemes for introduction of solar PV in the main European
PV markets according to EPIA (2011a) 32Table 3.7: Public budgets for R&D in 2010 in selected European countries 36Table 3.8: Functional pattern of the solar PV TIS in Europe 37Table 3.9: Largest US-based solar PV Manufacturers 44
NREL National Renewable Energy LabNSM Jawaharlal Nehru National Solar MissionPCAST President’s Council of Advisors on Science and TechnologyPPA power purchase agreementPTC production tax creditPV photovoltaicsREC renewable energy creditRGGI Regional Greenhouse Gas InitiativeR&D research and developmentRPS renewable portfolio standardsSEIA Solar Energy Industries Association SEII Solar Europe Industry InitiativeSETP Solar Energy Technologies ProgramSET-Plan Strategic Energy Technology PlanSTI science and technology infrastructureSVTC Silicon Valley Toxics Coalition TF thin filmTGC tradable green certificateTIS technological innovation systemTWh Terawatt hourUNEP United Nations Environment ProgrammeWCI Western Climate InitiativeWp watt peakZEP Zero Emissions Platform

vi
List of figures
Figure 2.1: Governance needs in different stages of development as technologies move from pre-market development phases to wider deployment 9
Figure 2.2: Scheme of analysis for a TIS analysis 13Figure 3.1: Cumulative installed solar PV capacity globally (GW) and cost of
installed PV systems (USD/W) – historical 17Figure 3.2: Current price and performance of different PV module technologies 19Figure 3.3: PV module experience curve for crystalline silicon and thin film
(USD/Wp and MW) 21Figure 3.4: Cost of PV modules and installed PV system costs (USD/W) 2001-
2010 21Figure 3.5: Shares of solar PV value chain for some of the most important
countries 23Figure 3.6: PV market share of different countries/regions versus PV module
production, as shares of the total global market and module production 2000 – 2010 24
Figure 3.7: Cumulative installed PV capacity in main European countries 25Figure 3.8: Actual growth in installed PV capacity (MW) in OECD Europe
(2001 – 2010) and projected future growth according to the IEA Blue Map Scenario 26
Figure 3.9: Investments in photovoltaics under FP6 and the first four calls of FP7 35
Figure 3.10: Actual growth in installed capacity, US (2001-2010), and future growth according to the IEA Blue Map Scenario 49
Table 3.10: USA solar PV Trade Flows, 2009, Million USD 45Table 3.11: Largest US purchasers of solar PV-generated electricity 47Table 3.12: Overview of PV Incentives and Policies 52Table 3.13: Functional pattern of the US PV TIS 55Table 3.14: Top 10 solar PV companies in China in 2009 63Table 4.1: Public funding for CCS demonstration and R&D in the USA and
Europe 74Table 4.2: Large-scale CCS demonstration projects in operation 75Table 4.3: Actors in the CCS TIS 77Table 4.4: An overview of the policies supporting and regulating CCS in the EU 78Table 4.5: CCS projects funded by the European Economic Recovery Plan
(2009) 80Table 4.6: CCS projects applying for NER 300 funding 81Table 4.7: TIS functions for CCS in Europe 83Table 4.8: Existing and proposed large-scale CCS projects in the US 89Table 4.9: Key existing US policy on CCS 92Table 4.10: TIS functions for CCS in the USA 96Table 5.1: Government R&D Expenditures in Solar and CCS Technologies 102

vii
List of boxes
Box 4.1: The three key carbon capture technologies 73
ACknowLedgements
This project has been carried out within the partnership programme between the business leaders’ initiative Combat Climate Change (3C) and the Stockholm Environment Institute. The authors would like to thank 3C for supporting the project, and those 3C companies which participated in the workshop and the survey for contributing their time and knowledge to the project. The project team would also like to thank all those companies and other organisations that participated in the interviews for the case studies, as well as our reviewers, Prof. Staffan Laestadius and Dr Mikael Román, for their valuable feedback on the report.
Figure 3.11: Utility scale installations by state in the USA 50Figure 3.12: Installed capacity in different US states 51Figure 3.13: US DOE Budget Authority for Solar Energy R&D 53Figure 3.14: Solar PV installation in China: 1976 – 2010 65Figure 4.1: Comparison of CO2 volumes (MTpa) 71Figure 4.2: Role of large-scale CCS projects in meeting industrial demand for
CO2 72Figure 4.3: Demonstration plants planned in the world according to the MIT
CCS database 76

viii

1
stockholm environment institute
exeCutive summAry
Technological change is crucial for reducing emissions of greenhouse gases. Some of the technologies needed to achieve a low carbon society are ready to implement
now, while others need further development and cost reductions to become affordable, attractive, and scalable alternatives. The long term economic case for investing in climate mitigation technologies is strong and well-established, and some economic benefits (e.g. technology sales, jobs) can be realized in the short term. But given the pace of progress needed to sufficiently reduce global emissions to meet climate stabilization goals, the technological shifts and innovations required are not happening quickly enough. The United Nations Intergovernmental Panel on Climate Change (IPCC) has stated that global carbon dioxide (CO2) emissions need to be reduced by 50 to 85 per cent compared to 2000 levels by 2050, to avoid serious effects from climate change (IPCC, 2007). The International Energy Agency (IEA) has developed scenarios to show how to attain the necessary emissions reductions, and have concluded that achieving even a 50 per cent reduction in energy-related CO2 emissions by 2050 will require significant increases in investment in both emerging technologies and more mature ones (IEA, 2010c).
The need for change and innovation is particularly important in the electricity sector, as it is responsible for about 40 per cent of global CO2 emissions, and since electricity is used throughout the economy. However, bringing about innovation in the sector is challenging. Well-established technologies dominate, and can provide low-risk, low-cost electricity. These technologies can also create barriers to new entrants. Power plants often have economic lives of 40 years or more, offering fewer opportunities than other sectors for replacing capital stocks, and levels of private sector R&D are relatively low. Where policy has attempted to stimulate technological change, progress has often been limited by high costs, capital intensity and long investment cycles that leave investors exposed to risks, including changing political support.
Given the need for technological shifts in the electricity sector, this project has researched the development and deployment of two technologies that could play key roles in supplying electricity for a low carbon society – solar photovoltaics (PV) and carbon capture and storage (CCS) – with a particular focus on the USA and Europe. The project is the first of three within a partnership programme between the business leaders’ initiative Combat Climate Change (3C) and the Stockholm Environment Institute (SEI). The choice to study these two technologies was made in dialogue with 3C companies at a workshop, and informed by a survey distributed to 3C companies and a literature review.
The academic literature provides many approaches to describe and analyse technological innovation processes and the role of government policies in supporting such processes. Some of these approaches regard innovation as embedded in societal systems. Analysis of innovation systems may focus on nations, industrial sectors, or specific technologies. The concept of ‘national innovation systems’ emphasises the role of rules, norms and various actors in national contexts, and the theory that markets

2
driving technological innovation for a Low-Carbon society
are organised differently in different nations. The concept of ‘sectoral innovation systems’ focuses on specific industries and their characteristics. By contrast, the technological innovation system (TIS) concept, which is used in this study, focuses instead on specific technologies. TIS analysis stresses that a number of processes, or functions,1 operate simultaneously in a technological innovation system, and that these are subject to different barriers and enabling factors, many of which are related to governance. These processes include classical ones such as ‘knowledge development’ and ‘knowledge diffusion’, which can be enabled through R&D support, or ‘market formation’, which is facilitated by subsidies or procurement strategies. But they also include ‘creation of legitimacy’ and ‘guidance of search’. These latter processes imply a need for a wider variety of governance measures than traditional technology support policies have provided. Analysts stress the importance of the formation of networks, government procurement strategies, assured market sales and subsidies.
This study uses the TIS framework to analyse and describe innovations in solar PV and CCS in the USA and Europe. In comparing the development of both technologies in the two regions, the study examines the barriers to and drivers of innovation; the geographic scope of each innovation system and how it affects the innovation process; and policies that support innovation and deployment. The study maps the actors and policies relevant to these technologies using a literature review and interviews. It also analyses the process of technology development and diffusion using concepts defined in the TIS literature. Narrower reviews of solar PV development and deployment in China and India are also included.
High costs (and associated risks and barriers to investment) constrain deployment of both PV and CCS in Europe and the USA. To facilitate the innovations needed to decrease these costs, governments can apply policies that target the demand side (‘market pull’ policies) and those that target supply and stimulate innovation more directly (‘technology push’ policies). Fortunately, costs for solar PV are coming down rapidly, and grid parity is likely to be achieved within the decade in key, high-insolation areas of both the USA and the EU. Still, further innovation is crucial to drive down PV system costs (including costs for ‘balance of system’ components (those components other than the panels) to make solar PV competitive with other sources of electricity.
For CCS, significant uncertainty remains over the effectiveness and costs of the integrated system, and it is likely that the first attempts will be less successful than those that follow. Demonstration projects are needed to ensure the viability of the CCS technology on a larger scale, and to move from technological development to deployment. Despite significant policy support in Europe, the scale and associated risks of these CCS projects deter private sector investors, and most of the planned demonstrations are already either behind schedule or in doubt. This situation is exacerbated by underdeveloped policy and legal frameworks for long-term carbon storage.
1 Specifically, these ‘functions’ are: entrepreneurial activity, knowledge development, knowledge diffu-sion, guidance of search, market formation, resource mobilization and creation of legitimacy

3
stockholm environment institute
The study found quite different approaches in Europe and in the USA for market pull and technology push policies. There is a stronger focus on market pull policies in Europe, while the USA emphasises R&D support and ‘technology push’ initiatives. Due to the current high cost of solar PV compared to other energy technologies, its deployment has so far been almost entirely dependent on government support mechanisms. The feed-in tariffs applied in several European countries have been effective in achieving deployment (e.g. Fouquet and Johansson, 2008). However, it is difficult to assess the exact effect of the tariffs on innovation for solar PV modules and cells, and the findings of this study indicate that tariff levels have sometimes been too generous to sufficiently stimulate cost reductions. Finding the right level of market support that leads to sufficient deployment while at the same time incentivising innovation and cost reductions is challenging, and several European countries are now reducing tariff levels in an effort to stimulate cost reductions in the industry. Nevertheless, the feed in tariffs have stimulated innovative activity (Johnstone et al., 2010) and have spurred the development of a large international industry. Furthermore, such market development policies create trust in the technology among investors and developers, which also has positive effects for innovation.
According to the IEA, the USA is the country that has invested ‘by far’ the most in R&D for solar PV and CCS. However, while this may be true on an absolute basis, as a fraction of GDP the investments of Germany, France, Italy, and Spain in solar R&D all exceed that of the USA. In all four cases studied, this analysis identified public funding as critical to overcome ‘market failures’, move technologies to commercialization, drive down costs, and leverage substantial additional private capital. However, current levels of investment in both PV and CCS are far short of what would be needed for these technologies to become cost-effective options to maintain a global atmospheric CO2 concentration of 450 ppm (IEA, 2010c). This suggests that substantial increases in investment are still necessary. Demand for solar PV in the USA is largely driven by a patchwork of state-level policies and trends with no nationally coordinated energy strategy. The market for solar PV in the USA is still very small by global standards and far behind the global leader, Germany. A US national policy for solar PV and other renewables would, in addition to avoiding leakage, also create the uniformity and predictability desired by utilities, investors and project developers.
As others have pointed out (e.g. Sandén and Azar, 2005), there is a need both for broad-based polices (such as the EU ETS) and more targeted, technology focused policies (such as feed in tariffs). The former can provide the vision needed to provide investors with trust in the technology in the long term. It is commonly suggested that policy should support technological R&D in the early stages of technology development, followed by support for market creation in the later stages (e.g. IEA, 2010c; Nilsson et al., 2009). While this is largely true, the findings from this project also point to the need for a balanced approach combining both technology push and market pull measures throughout the development path. The urgency of the climate challenge calls for support to market creation at earlier stages of technology development. Such proven political commitment can also create confidence among investors and spur the development of an industry, which in turn can create more private sector resources for

4
driving technological innovation for a Low-Carbon society
R&D. However, because of the technological variety within, for example, solar PV (including crystalline silicon, thin film and organic cells), and since these technologies are at different stages of development, continued support for research is also needed at later stages of technology development.
The innovation systems for PV and CCS are increasingly international, with innovative activity and manufacturing taking place in many countries. Industrial activity related to PV occurs in several parts of the world, and China plays an increasingly important role. This internationalisation of the solar PV innovation system can be seen as positive for both the growth of the industry and cost reductions, because it increases competition and innovative activity. At the same time, however, it imposes challenges on policy-makers, who often seek to stimulate the growth of domestic industry alongside the growth of new technologies.
Markets, though, are still concentrated in a few areas of the world. For CCS, the ‘push’ of demonstration must be complemented with credible prospects for a market for CO2. The carbon price created by the European Union Emissions Trading System could provide a strong incentive to adopt CCS once the technology is ready for application on a large scale, which could be 15 or 20 years from now. However, uncertainties remain around the timing and ambition of carbon pricing and other emission reduction policies (especially outside the EU), which has slowed the development of CCS.
To date, European countries – especially Germany – have been the principal markets for solar PV installations, and these markets have helped spur the development of an international industry. Following this industry development, these policy driven markets in Europe have also had positive effects on implementation of solar PV in other parts of the world. The Chinese government has created programmes to support deployment in China, partly to support the domestic PV industry, which has largely grown due to European policies.
However, the reliance on policy and political support in a few countries also makes the industry vulnerable: inadequate policy design and political changes in these countries could create major problems for the industry and the progress of the technology. For PV technologies to develop rapidly and play a leading role in emissions abatement, further development and expansion of markets in other parts of the world are crucial.
5
stockholm environment institute
1. introduCtion
Limiting climate change by reducing anthropogenic greenhouse gas emissions will require a major overhaul of energy systems. This overhaul can be achieved using
several means: behavioural changes to encourage energy conservation; systemic changes to economies to reduce energy demand; incremental efficiency improvements to existing technologies; and increased deployment of new, low-emitting technology alternatives. All these approaches will need to be pursued in order to meet ambitious climate change goals.
Switching to new, low-emitting technologies is one option that has received significant political attention – perhaps in part because developing and deploying new technologies is also often thought to contribute to economic growth and increased employment (e.g. CEC, 2010). A number of scenarios have been developed for the technologies needed to achieve a low carbon society (e.g. IEA, 2010c; McKinsey & Company, 2009). These scenarios demonstrate that technological changes will be required in several sectors of society, one of the most crucial of which is the electricity sector. Electricity is used in most areas of society, and the increased demand for electricity linked, for example, to the increased use of electric vehicles and improved electricity supply in developing countries means that global electricity consumption can be expected to increase. The emissions abatement required from the electricity generation sector could be achieved through increased generation from renewable sources, increased use of nuclear power, switching from coal to natural gas-based generation and the use of carbon capture and storage (CCS) in fossil fuel- and biomass-based generation. Abatement in the electricity sector is also likely to require the development and deployment of enabling technologies, including ‘smart grids’ and energy storage technologies.
Some of these technologies are relatively well-known and can be implemented today. Others will require significant development and cost reductions to become realistic options for reducing emissions. In either case, however, change is not occurring quickly enough.
The slow progress with technological development and the deployment of new technologies might be linked to certain characteristics of the electricity sector. The different industrial sectors vary in their degree of innovation – information technology and pharmaceuticals, for example, are characterised by a high degree of innovation, to a great extent financed by private investment (e.g. Neuhoff, 2005). In contrast, the electricity generation sector is characterised by a small number of major technologies that have been dominant for a long time, and there is relatively little private sector R&D (Margolis and Kammen, 1999). Furthermore, markets are not easily formed in the electricity sector and new technologies rarely provide any benefits to either the purchaser or the investor (Jacobsson and Bergek, 2004). Energy markets and energy technologies suffer from significant levels of inertia: investment needs are large, infrastructure is long-lived and the product is often an invisible commodity to the consumer. This inertia favours incremental change and presents difficulties for much needed climate-related overhauls that need to happen within the lifetime of a
6
driving technological innovation for a Low-Carbon society
single power plant. As Grubb (2004) points out, climate policy is trying to achieve radical innovation in one of the least innovative sectors of the economy. Strong policy interventions and effective governance will be required.
In addition, climate change is a global problem, with effects at the global scale rather than in any one country. Climate change has been called the ‘greatest market failure’. Nemet (2008) for example, lists a number of often cited reasons for this market failure. First, firms may under invest in R&D compared to the socially optimal level of investment in order to avoid spillover to other players. Second, emissions of greenhouse gases are an ‘unpriced negative externality’ because the emissions will create future damage to the economy and society as a whole. Reducing greenhouse gas emissions can therefore be seen as a public good and firms do not get involved in this type of activity since they do not benefit directly from the results. Third, the development of new technologies may be discouraged since it is often regarded as easier to continue with existing ones, which are often built into the economic system and sometimes also supported by subsidies. Because markets do not seem able to overcome these hurdles, it is generally agreed that government intervention is needed through various policy instruments. However, nations are reluctant to make the necessary investment alone to reduce emissions because the reduced emissions will benefit all nations.
This project, which takes place within the partnership programme between the business leaders’ initiative Combat Climate Change (3C) and the Stockholm Environment Institute, focuses on the policies and governance measures required to achieve technological change and innovation. The decision was made to focus on two of the technologies that occur in most abatement scenarios (e.g. McKinsey & Company, 2009; IEA 2010c) and are relevant for the electricity sector: solar photovoltaics (solar PV) and carbon capture and storage (CCS). This choice was made in dialogue with the companies in the 3C network, through a survey, a workshop discussion and a literature review. These technologies are of interest as abatement options, and also because they offer a contrast between two technologies aimed at the same market – electricity consumers – using different modalities. CCS is expected to be useful only in large-scale deployments. The actors that engage with the technology are established and relatively few and the manufacture of components will not be carried out in high unit volumes compared to some other technologies. Solar PV, however, is expected to thrive in distributed, small-scale applications. There are currently a multitude of actors and the technology is expected to benefit from both the development of entirely new applications and learning-by-doing in the mass production of solar panels. Both technologies need to become significantly less expensive than they are today if carbon abatement is to be achieved affordably.
A choice has also been made to focus primarily on two regions – the United States (USA) and Europe. Europe has played and continues to play a leading role in both solar PV and CCS development and deployment, and the USA has been a major driver of R&D in both these technologies. Furthermore, it has been suggested that the USA will be the next major market for solar PV, and there is significant potential for using CCS there because a large part of its electricity supply is produced using coal. In

7
stockholm environment institute
addition to these case studies, smaller studies are made of China, as one of the main suppliers in the photovoltaic industry, and India, which represents a new market for solar PV and is a nation that has yet to supply electricity to all its regions.
The project compares the development and deployment of solar PV and CCS in the USA and Europe. The levels of innovation and technological change tend to vary not only between industrial sectors, as is pointed out above, but also between different countries and regions. These differences are linked to a number of interrelated factors, including the specific policy context, the type of actor, the cultures and norms under which the different actors act and interact, and the support provided to research in the region. Because of this, it is often relevant to study innovations as a part of ‘innovation systems’ (see Chapter 2), where the various components that constitute the innovation system are relevant to innovative potential.
The report focuses primarily on three research questions:
• What are the barriers to and drivers of innovation in the respective systems?
• What is the geographical scope of the systems and how does this affect the innovation process?
• What policies have been used and how have they contributed to achieving innovation and deployment?
Chapter 2 examines some of the most important theories of innovation and innovation systems as well as the theories of governance measures that it is often suggested contribute to innovation. The theoretical framework chosen for this study is also outlined, and the methodology for the case studies described. Chapter 3 describes the case studies on solar PV in Europe, the USA, China and India, and Chapter 4 describes the CCS case studies. The four main cases (PV in Europe and in the USA; CCS in Europe and in the USA), follow broadly the scheme suggested by Bergek et al., (2008) (see Chapter 2.2). Chapter 5 contains a cross-case analysis that focuses on the three research questions outlined above.

8
driving technological innovation for a Low-Carbon society
2. governAnCe for Low CArbon teChnoLogy innovAtions
The roles played by innovation and technical change in generating economic growth have long been recognised (e.g. Solow, 1956). Innovation generally refers to new
creations, or new combinations of inventions, which have economic significance and are marketable (e.g. Lundvall, 2004; Edquist 2002). Innovations are sometimes, but not always, linked to achievements in science and technology, although innovations that are strongly linked to science and technology tend also to include non-scientific elements.
Two modes of innovation have been identified – science and technology infrastructure and doing-using-interacting. The former focuses particularly on R&D and the latter on learning by doing, using and interacting, and while the second is experience-based the first is science-based (e.g. Lundvall, 2004). The roles played by scientific and technological achievements vary between industrial sectors, which means that the two modes have different levels of importance to different sectors.
Although technical change is widely regarded as important for economic growth, views on its exact role in creating economic growth vary in the literature (e.g. Cantwell 2006). In addition, different types of technical change contribute differently – some may have little or no impact on the economy whereas others might influence the economy more substantially. A distinction is often made between radical and incremental innovation. Radical innovations tend to contribute most to technical change in society and have the ability to make more substantial contributions to economic growth, but such radical innovations often build on incremental innovations.
Several attempts have been made in the literature to describe how innovations occur and how they can be stimulated by various policy and governance measures. This chapter provides an introduction to some of these theories, with a particular emphasis on technological innovation systems (TIS) analysis, which is the framework used in this report, as well as a description of the approach used for the study.
2.1 Governance of innovation: a brief view of the literature
When examining what the literature on technological innovation has to say about governance, three main perspectives can be recognised. The first one is based on the traditional S-curve for technology systems change and market development. This is often used as a basis for identifying differential governance needs. For instance, the IEA (2010c) and Nilsson et al., (2009) suggest that governance needs differ markedly as technologies move from the pre-market development phase through niche markets to up-scaling and wider deployment (Figure 2.1). Early-stage technologies may need technology-specific support schemes. In the early phases of innovation and product

9
stockholm environment institute
development, a dynamic innovation framework needs to emphasise experimentation and learning. Here, R&D investment, technology partnerships and technology-specific niche-market measures have an important role to play. For example, in the case of renewable electricity promotion, fixing prices appears to be an important strategy for early-stage technologies. In the more mature technology phase, governance based on broader market efficiency is more appropriate. Under these schemes, different technologies have to compete under equal market conditions. In the mature technology and mass marketing stage, technologies should be competitive regardless of governance measures but market prices should take account of external costs.
4. Accelerate adoption byaddressing market barriers
Building codes, efficiencystandards, information campaigns
3. Technology-neutralbut declining support
Green certificates, GHG trading
2. Stable, technology-specific incentives
Feed-in tariffs, tax credits, loan guarentees
1. Developmentand infrastructure
planning
RD&D financing,capital cost support
for long-scaledemonstration
Low cost gap(onshore wind, biomasspower in some markets)
High cost gap
(CSP, PV,hybrid vehicles)
Prototype and demo stage
(e.g. fuel cells, 2 generationbiofuels, EV, CCS)
nd
Mature technology
(energy efficiencyindustrial CHP)
Mark
et develo
pm
ent
Mark
et develo
pm
ent
Time
1. Technology developmentand demonstration
2. Nichemarkets
3. Achievingcompetitiveness
4. Massmarket
Figure 2.1: Governance needs in different stages of development as technologies move from pre-market development phases to wider deployment
Adapted from ieA (2010c)
This perspective could arguably be linked to two sets of forces that it has been suggested drive innovation: market forces and technological forces (e.g. Kline and Rosenberg, 1986). Whether technological change is influenced more by changes in market demand or advances in science and technology is a matter of debate. The science and technology push argument suggests that scientific understanding determines the rate and direction of innovation, whereas the market pull argument suggests that demand drives innovation (e.g. Nemet, 2009). Policies can be directed to support the technology and research side – technology push policy – such as for example government funded R&D or demonstration projects, tax credits for companies to invest in R&D and support for education and training. Market pull policy instead targets the demand side by, for example, introducing taxes that encourage consumption of the new technology, or the use of government procurement strategies or regulatory standards. Yet, as Kline and Rosenberg (1986) point out, there is constant interaction between market pull and technology push factors, and some level of support for both may be needed along the development path.

10
driving technological innovation for a Low-Carbon society
A second strand of the literature discusses transition management and the multilevel perspective, which analyse technological change using a niche regime landscape framework. Transition management and its sister concept strategic niche management are both portrayed as governance systems in themselves (Kemp et al., 1998). The concepts recognise that technological achievements often tend to happen in a certain pattern, a so-called technological paradigm, which limits the direction of technological development (Dosi 1982). The efforts and technological imagination of engineers often follow a certain direction within this technological paradigm, without acknowledging other possibilities. This direction has been called a technological trajectory, defined as ‘the pattern of normal problem solving activity (i.e. of ‘progress’) on the ground of a technological paradigm’ (Dosi, 1982). Such trajectories may be established by interactions between five subsystems: science, technology, economy, politics and culture (Freeman and Loucã, 2001). Niches may form around visions of alternative technologies, and this is regarded as important for radical innovation to occur (e.g. Geels, 2004). Innovation can break out of its niche and surprise incumbent firms with a rapid breakthrough linked to major events, such as a war, or develop more gradually involving multiple innovations. The niche may also expand and challenge the regime if society recognises the need for fundamental change, for example linked to climate change, or if there is a powerful external influence on society, such as catastrophic climate change impacts or the belief that they will happen (Geels, 2004).
These traditions highlight the need for governance to provide vision and orientation, as well as networks and platforms to stimulate mutual learning and foster socio-technical alignment, ensuring that a wide variety of options is explored, dealing with conflicting claims from technology actors and learning about the effects of their policies (Dijk et al., 2011). Geels and Raven (2006) suggest that this has some explanatory power in that isolation from the regime or protection from within the regime may be critical factors to consider when designing effective governance. In addition, the stability of rules can be decisive. A technology that is located outside the dominant regime may suffer from a range of institutional constraints and governance ‘deficits’.
A third tradition in the literature on technological innovation is linked to innovation system theories. These theories have linkages with evolutionary theories that suggest that technological innovations can be seen as evolutionary processes and that using evolutionary theories can facilitate an understanding of the process of innovation (e.g. Nelson, 1995; Ziman, 2000). Some of the central aspects of the evolutionary approach to describing technical change are the processes of variety creation (in technologies, products and firms), and replication and selection, which reduces variety and discourages the inefficient use of resources (Malerba, 2006). At the same time, innovation systems theories recognise that innovation as well as economic change need to be seen and explained as parts of a larger system, with a range of actors interacting in a specific institutional context and under certain sets of policies and rules (e.g. Carlsson and Stankiewicz, 1991).
The national systems of innovation concept emphasises the role of rules, norms and various actors in different nations, and that markets are organised differently in different

11
stockholm environment institute
nations (Lundvall, 2010a). A number of assumptions form the core of the concept: (i) elements of knowledge important for economic performance are local and cannot be easily moved from one place to another; (ii) important elements of knowledge are embodied in the minds and bodies of agents, in the routines of firms and in the relationships between people and organisations; (iii) learning and innovation are best understood as outcomes of interaction; (iv) interactive learning is a socially embedded process, which means that purely economic analysis is insufficient; (v) learning and innovation are strongly interconnected processes; (vi) national systems differ in terms of specialisation in both production and trade and in terms of knowledge base; and (vii) national systems are systemic in the sense that different elements are interdependent and interrelationships matter for innovation performance (Lundvall, 2004). Porter (1990) also writes about the importance of country-specific factors, outlining four that are important in national competitive advantage: (i) factor conditions, related to factors of production such as a skilled labour force and infrastructure; (ii) demand conditions, relating to the demand for an industry’s product in the home market; (iii) the presence of related and supporting industries, that is, domestic suppliers; and (iv) firm strategy, structure and rivalry, which relates to the conditions in the country that govern how companies are created, organised and managed, and the nature of domestic competition.
The factors that contribute to innovation also vary between industrial sectors. Recognition of this fact has led to the concept of sectoral innovation systems (Malerba, 2006). A sector is defined as ‘a set of activities that are unified by some linked product groups for a given or emerging demand and which share some common knowledge’ (Malerba, 2006). Firms within the sector may be heterogeneous but still have some commonalities, and they are faced with a number of similar rules, technologies and factors in the environment. Malerba (2006) suggests that a sectoral system framework focuses on three main sectors: the knowledge and technological domain, actors and networks, and institutions. The boundaries of the sectors are rarely fixed, but change over time. Actors as well as institutions within a sector can either be national or span several countries, so a sector may have local as well as national and/or global dimensions. National systems result from differences in the composition of sectors, some of which are so important that they even drive the economic growth of the nation. Sectors can be R&D intensive or characterised by low levels of R&D. They may also differ regarding the extent to which knowledge within them builds on current knowledge.
Innovation processes are rarely uniformly distributed either within nations or within sectors, but are often concentrated in certain areas. The tendency for there to be a concentration of innovation tends to vary between sectors and activities, and knowledge-intensive activities tend to be more regionally clustered. The tendency has also become more marked over time (Asheim and Gertler, 2006). Recognition of the role of regional variation in innovation led to the development of the concept regional innovation systems. Proponents of this concept argue the importance of regional production systems, industrial districts and technological districts (Lundvall, 2010b).
The technological innovation system concept, finally, is linked to all the innovation systems concepts described above, but its focus is on neither nations nor sectors but
12
driving technological innovation for a Low-Carbon society
on specific technologies. The concept has similarities with the regional innovation systems concept, as it recognises that successful innovation often tends to require a clustering of resources which enables interaction between different agents (Carlsson and Stankiewicz, 1991). A number of approaches have been suggested for analysing how well a technological innovation system functions (see Chapter 2.2).
Innovation system analysis stresses that a number of processes or functions are happening simultaneously in a TIS, and that they are subject to different barriers and enablers, including governance (Bergek et al., 2008; Hillman et al., 2011). These processes include classical ones such as knowledge development and diffusion, which can be enabled through R&D support, or market formation, which is facilitated by subsidies or procurement strategies, but they also include legitimation and search guidance (see Table 2.1). These latter processes imply a wider variety of governance needs than traditional technology support policies have tended to cover. Analysts stress the importance of the formation of networks, government procurement strategies, assured market sales and subsidies (see, e.g. Edquist and McKelvey 2000; Jacobsson and Bergek, 2004; Nygaard, 2008). In relation to sustainability, the need for technology-specific market measures such as price fixing has been highlighted (Jacobsson and Lauber, 2006). Furthermore, in the broader governance literature, the innovation systems research shows that actors other than the state may well be better positioned to initiate or execute governance. Here, a strong interest has developed in the triple-helix metaphor for cooperation between universities, industry and local government (Etzkowitz, 2003).
Policymakers are increasingly faced with complexities linked to the globalization of economies. Innovations may occur at the company level, but it is not only the innovating companies that gain from their innovative activity. Other actors in the country may learn from this and benefit from related innovations (Cantwell, 2006). Interaction and learning occur within nations but also within industries across national borders. Based on Archibugi and Michie (1995), Archibugi and Iammarino (2002) identify three main categories of what they call the globalisation of innovation. The first category includes when innovators seek economic advantage by exploiting technological competences in markets other than the domestic. They call this category international rather than global, as the companies maintain their national identity. This may also include production activity in a host foreign country. The second category entails the global generation of innovations. This includes innovations generated on a global scale by multinational companies. The third category is when companies based in different countries cooperate to create innovations. They also outline two different tendencies in the debate on innovation policies linked to globalisation of innovation. The first views policies to strengthen national technological competences as irrelevant, since this does not generate a national advantage. The second argues that globalisation requires a broader spectrum of public policies than those which exist at present to equip nations for technological changes and increased globalisation.

13
stockholm environment institute
Chapter 2.2 outlines the methodology suggested to analyse technological innovation systems, as this is the theory on which the approach used in this study was based. It also clarifies how the TIS framework was used in this study.
2.2 TIS analysis and research design
The research and analysis in this study use the technological innovation systems (TIS) framework, which provides a level of analysis that is not limited to national borders, regions or sectors. National and sectoral factors play important roles in the development of both carbon capture and storage (CCS) and solar photovoltaics (solar PV), but technological development is not limited to one or a small number of countries. Subnational clusters also contribute to the development of the technologies. However, as Nuur et al., (2009) point out, it is often necessary to shift between different innovation systems and different levels of analysis when analysing innovation systems and their role in technical development.
TIS analysis is a hands-on, practical approach to analysing systems. In this study, we broadly follow the scheme of analysis suggested by Bergek et al., (2008) (see Figure 2.2).
6. Key policy issues
5. Inducement andblocking mechanisms 4. Assessing
functionality andsetting process goals
1. Starting-point;defining theTIS in focus
3b. Achievedfunctional pattern
2. Structuralcomponents
3a. Functions
Actors
Networks
InstitutionsLegitimation Entrepreneurial
experimentation
Development ofexternal economies
Knowledgedevelopment
Resourcemobilization
Marketformation
Influence on thedirection of search
Figure 2.2: Scheme of analysis for a TIS analysis Adapted from bergek et al., (2008)
The first step in this scheme is to decide on the starting point for the analysis. This involves deciding whether to focus on a knowledge field or a process, on the breadth and depth of the study and on the spatial domain. These decisions are rarely straightforward. For example, drawing boundaries is linked to circumstances such as technological and market requirements, the capabilities of various agents, and

14
driving technological innovation for a Low-Carbon society
the degree of interdependence among agents (Carlsson and Stankiewicz, 1991). If boundaries are defined in terms of the national institutional infrastructure, the technological system will have much in common with the national innovation system concept. However, TIS systems often overlap with several national innovation systems and with various sectoral innovation systems (Hekkert et al., 2007). Sometimes, a TIS may even be global.
For this study, a decision was made to focus on CCS and PV technologies, that is, to target a knowledge field rather than a specific product. It was also decided to focus on Europe and the USA. Political goals and policymaking at the national as well as the EU level are important for these technologies, but interactions also occur at the sector level, across national borders and within companies active in different countries. International aspects also play an important role, for example linked to international agreements on climate change and scenarios for technological switches that are drawn up by international agencies. However, a limitation on the scope of the study was necessary for practical reasons, which led to the decision to focus on Europe and the USA. To provide a better understanding of the internationalisation of these systems, which is also linked to research question (ii) above, smaller case studies on solar PV in China and India were also carried out. The broad geographical scope of the study, however, has made it necessary to limit its depth.
The next step was to identify the actors, networks and institutions in the TIS, or the ‘structural components’ of the TIS (Bergek et al., 2008). The methods suggested by Bergek et al., (2008) for identifying these include reaching out to industry actors as well as searches of exhibitions, company directories and catalogues; analyses of patents, which can reveal the volume and direction of technological activity in different organisations; bibliometric analyses, which reveal the most active organisations in terms of published papers; and interviews and discussions with technology or industry experts, firms, research organisations and financiers. Because of the large number of actors, in particular in the field of PV, this study has tried to identify the categories of actor and of networks present, using literature reviews and interviews, and to analyse the role these play in the innovation process – rather than attempt to map every single actor and network. The concept ‘institutions’, according to Bergek et al., (2008), includes culture, norms, laws, regulations and routines. Of these, this study has focused in particular on the policies relevant to the specific technological fields. This is also linked to research question (iii) above.
Bergek et al., (2008) suggest that identifying the structural components (i.e. actors, networks and institutions) forms the basis for later steps to analyse the functional pattern, that is, the different functions of the TIS. Technological change is seen as a dynamic process, where the interaction within the system in which the technological innovation is embedded is stressed. To understand these interactions and their role in generating innovation, it has been suggested that TIS analysis should be based on mapping a number of functions (e.g. Hekkert et al., 2007). Various sets of such functions have been suggested (for an overview, see e.g. Bergek et al., 2008) and this study uses the set suggested by by Hekkert et al., (2007) (see Table 2.1).

15
stockholm environment institute
Table 2.1: Functions to be analysed in a TIS analysis as suggested by Hekkert et al., (2007) sources: hekkert et al., (2007) and hillman et al., (2011)
Entrepreneurial activities New entrants who recognise business opportunities in new markets or incumbent companies who diversify their business strategy to take advantage of new developments. The role of the entrepreneur is emphasised; the presence of active entrepreneurs has even been suggested as the best indicator of the performance of the system – when entrepreneurial activity lags behind, causes may be found in the other functions (Hekkert et al., 2007).
Knowledge development Knowledge development can be seen as one of the most central functions since mechanisms of knowledge are at the heart of the innovation process (Hekkert et al., 2007). Refers to the generation of knowledge, including both ‘learning by searching’ and ‘learning by doing’ and taking into account different types of knowledge (e.g. scientific, applied, patents) generated both at universities and companies.
Knowledge diffusion Refers to the exchange of information, which is essential not least where R&D meets government, competitors and the market, where policy decisions need to be consistent with the latest technological insights and R&D agendas need to be affected by norms and values.
Guidance of the search Refers to the activities within the system that can positively affect the visibility and clarity of wants among technology users. The long term policy goals and preferences in society that may influence R&D priority setting are possible examples. Market or government influences play an important role but also interaction between technology producers, technology users and many other actors.
Market formation It is often difficult for new technologies to compete with conventional technology. Protected space can be created for the new technology by, for example, forming temporary markets. This function refers to the extent to which such markets have been created.
Resource mobilization The extent to which financial and human capital are allocated to make knowledge generation possible. Examples include funds made available for long term R&D programmes set up by governments, or funds made available for specific experiments.
Creation of legitimacy To acquire political strength the new technology and its proponents need to be considered appropriate and desirable by relevant actors in different parts of the TIS and become part of the existing regime. Advocacy coalitions can play an important role here. Mapping this function may include both understanding the legitimacy of the technology in the eyes of various actors and stakeholders and the activities within the system that may increase this legitimacy (Bergek et al., 2008).
A number of indicators have been suggested for mapping and analysing these functions in a quantitative way. Other authors use qualitative methods. A study by Alphen et al., (2010) for example, analyses ‘innovation system performance and system intervention’, that is, the functions, the interactions between them and the overall performance of the system, using a literature review and interviews with the main actors involved in the development of the technology, where the questions were linked to the TIS functions. Magnusson (2011) also used a literature review and interviews in a TIS analysis to study the development of hybrid-electric vehicle technology in Sweden.

16
driving technological innovation for a Low-Carbon society
Inspired by these studies, for this project the functions outlined in Table 2.1 have been analysed using literature reviews and interviews. A number of actors within the TIS, including utilities, manufacturing companies and other industry actors, as well as governmental and research organizations, were selected for each case study and contacted for interviews. The interview questions were designed to assess the functions outlined in Table 2.1 and to facilitate an understanding of the research questions listed in Chapter 1.
Once the functions have been mapped, the functionality of the TIS needs to be assessed, which can be done by understanding how momentum within the TIS is created (Hekkert et al., 2007). Interactions between the different functions may cause a virtuous circle. At the start of development, some system functions may act as a pull on other functions. Similarly, vicious circles can also be created, where reduced activities in some functions may slow the process down (Hekkert et al., 2007). Inducement and blocking mechanisms should be identified that either contribute to or hinder the growth of the technology and the TIS, after which policy issues should be identified that can contribute to removing or reducing the strength of the blocking mechanisms, or to further strengthening the inducement mechanisms (Bergek et al., 2008).
After an introduction of the respective technologies, chapter 3 and chapter 4 describe the case studies on solar PV and CCS, respectively. Following the scheme suggested by Bergek et al., (2008), each case study starts with a description of the structural components, with a particular emphasis on actors and policies, followed by a description and analysis of the functional pattern and the inducement and blocking mechanisms that contribute to or hinder the development of the TIS, followed by a policy assessment.

17
stockholm environment institute
3. soLAr photovoLtAiCs
3.1 Solar PV introduction
Solar photovoltaic (PV) power is one of the fastest growing energy technologies. In the past decade, the photovoltaic market has grown by 50 per cent per year. Cumulative installed capacity has grown from 0.1 GW in 1992 to more than 36 GW in 2010 (IEA PVPS, 2011; EPIA, 2011a). The total contribution of PV to electricity generation is still very small however, at around 0.1 per cent (IEA, 2010b). Different scenarios have been developed for the future role of PV in energy generation and in reducing emissions of greenhouse gases. The International Energy Agency (IEA), for example, suggests in its Energy Technology Perspectives that PV could contribute two per cent of the CO2 reductions required by 2050 and make up five per cent (2 000 TWh) of global electricity generation by the same time (IEA, 2010c).
Figure 3.1 shows the development of installed capacity and installed costs for PV in 2001–2010 and IEA projections for both to 2050, according the IEA’s ‘450 Scenario’. Delivering on this scenario would mean increasing global installed PV capacity from 36 GW in 2010 to 1600 GW by 2050, with associated cost reductions from about USD 4/W to USD 1/W installed. Installed costs of USD 1/W would make PV fully competitive with today’s conventional sources of electricity, while costs of around USD 2/W could make PV competitive given an ambitious carbon price (see below).
0.0
1.0
2.0
3.0
4.0
5.0
6.0
7.0
8.0
2000 2010 2020 2030 2040 2050
0
200
400
600
800
1000
1200
1400
1600
GW
US
D/W
Installed costrange ($/W)
Global installedPV capacity (GW)
Figure 3.1: Cumulative installed solar PV capacity globally (GW) and cost of installed PV systems (USD/W) – historical (as reported by the OECD countries included in IEA PVPS) and projected in the ‘IEA 450 Scenario’. Reported costs for installed systems vary and both highest and lowest estimates are provided here, as well as the average between these
data sources: ieA pvps (2001-2011), ieA (2010c) and ieA (2010d)
A small number of countries have been driving the growth of the PV industry and PV development. The main markets thus far have been in Europe, where Germany has

18
driving technological innovation for a Low-Carbon society
been dominant. Japan and the USA have also been important to PV market growth. In the future, markets are expected to develop in all regions but particularly in the USA, the Middle East, Japan, India, China and Australia. A key obstacle and a challenge for solar PV technologies are the high costs, which is why market development so far has been entirely driven by policies that subsidise deployment.
3.1.1 Solar PV technologySolar PV systems use semiconductors that convert sunlight into electricity. Photovoltaic cells are interconnected and form PV modules, which are combined to form various PV systems. There are two broad categories of commercial PV technologies: wafer based crystalline silicon (c-Si) and thin films, and a number of subcategories exist within these. In addition, there are a number of emerging technologies, including concentrating photovoltaics (CPV) and organic solar cells. Price and efficiency for the different PV technologies vary (Figure 3.2). The technologies are at different stages of maturity but all need further development.
Crystalline siliconCrystalline silicon technology accounts for between 85 and 90 per cent of the solar PV systems installed each year. However, this is changing as new PV technologies are developed and enter the market. By 2020, it is forecast that the market share will be around 50 per cent. Manufacturing of c-Si modules usually includes a number of steps: growing ingots of silicon, slicing the ingots into wafers to make solar cells, interconnecting the cells electrically and encapsulating the strings of cells to form a module. Current crystalline silicon modules are based on single or multi crystalline silicon cells. Single crystalline silicon cells usually have conversion efficiencies of 14–20 per cent, which is expected to increase to 25 per cent in the long term. Multi-crystalline silicon cells convert at 13–15 per cent. They are expected to improve to 21 per cent in the long term, and are less expensive to manufacture. Crystalline silicon technology is the most mature among the PV technologies, but has disadvantages linked to high material costs and labour-intensive production techniques (IEA, 2010b).
Thin filmThin film technologies are based on extremely thin layers of photosensitive materials that are deposited on a low-cost surface such as glass, stainless steel or plastic. The first thin film solar cells were amorphous single junction cells (a-Si). Amorphous tandem and triple cell configurations have developed from this type. Thin amorphous and microcrystalline silicon cells have also been combined (thin hybrid silicon cells). Other thin film technologies include Cadmium Telluride (CdTe) and Copper-Indium-Gallium-Diselenide (CIGS) (IEA, 2010b).
Production of thin film cells consumes fewer raw materials than the crystalline silicon technologies, and involves high levels of automation and production efficiency, leading to reduced production costs. Thin film cells also have technical advantages – as they are so thin, they have the potential to be integrated into different types of building materials. However, they are less efficient than crystalline silicon cells (6-12 per cent,

19
stockholm environment institute
expected to increase to 15–18 per cent in 2020–2030) and are therefore often used in large- or utility-scale installations (IEA, 2010b).
4
3
1
0
Mo
du
le p
rice (
US
D p
er
Wp
)
USD200 /m
2
USD300 /m
2
USD400 /m
2
USD500 /m
2
USD600 /m
2
Module price perm2
5%50 W/m
2
10%100 W/m
2
15%150 W/m
2
20%200 W/m
2
25%250 W/m
2
Efficiency performance
Concentratingphotovoltaicstechnologies
under 1%*
Crystallinesilicon
technologies85-90%*
2Organic
solar cellsunder 1%*
Thin filmstechnologies
10-15%*
Figure 3.2: Current price and performance of different PV module technologies After ieA (2010b)
3.1.2 Solar PV systems and applicationsSolar photovoltaic installations today occur in stand-alone, off-grid solutions and grid connected generation facilities. There are currently four main types of application for PV power systems: off-grid domestic systems, providing electricity to a household or a number of households that are not connected to the electricity grid; off grid non-domestic installations, providing electricity for applications in telecommunications, water pumping and navigational aids, among others; grid-connected distributed PV systems, installed on private, public or commercial buildings, providing power to grid-connected customers or directly to the electricity network; and grid-connected centralised systems, which function as centralised power stations (IEA PVPS, 2010). Grid-connected applications have so far dominated the market (with about 99 per cent of the market in 2009) but off-grid markets, which are often unsubsidised, are growing worldwide (IEA PVPS, 2010). The type and size of installations that dominate vary between the different regions. Residential systems usually have a capacity of up to 20 kW, commercial systems for offices, schools, hospitals and retail usually have capacity of up to 1 MW, while utility scale systems are usually larger than 1 MW (IEA, 2010b).
3.1.3 Research and developmentResearch efforts primarily aim to achieve cost reductions, and costs per Watt of capacity have decreased at a rapid pace – historically at a learning rate2 of between 15 and 22 per cent. Figure 3.3 shows the development of module prices, as the installed
2 I.e. the percentage cost reduction associated with a doubling of the cumulative installed capacity.

20
driving technological innovation for a Low-Carbon society
PV capacity has increased. Some of these gains have come through the increased efficiency of cells, although there appear to be technical limits to electrical conversion efficiency which means that cost reductions now increasingly come from innovations in the manufacturing processes.
Much has been made of the major reductions in both module and total installed costs during the last years, with prices falling more than 40 per cent from 2007 to 2010 and indications of continued declines in the coming years (Table 3.1).
Table 3.1: PV technology state-of-the-art and major objectives/milestones for the coming years 345 After eu pv platform (2010)
PV Technology state-of-the-art and major objectives/milestones for the next 10 years
2007 2010 2015 2020
Turn-key price large systems (€/Wp)3 5 2.5-3.5 2 1.5
PV electricity generation cost in Southern EU (€/kWh)4
0.30-0.60 0.13-0.25 0.10-0.20 0.07-0.14
Typical PV module efficiency range (%)
Crystalline silicon
13-18% 15-20% 16-21% 18-23%
Thin films 5-11% 6-12% 8-14% 10-16%
Concentrators 20% 20-25% 25-30% 30-35%
Inverter lifetime (years) 10 15 20 >25
Module lifetime (years) 20-25 20-25 25-30 35-40
Energy pay-back time (years) 2-3 1-2 1 0.5
Cost of PV + small-scale storage (€/kWh) in Southern EU (grid-connected)5
-- 0.35 0.22 <0.15
Making solar PV competitive with other sources of electricity is a major target of R&D efforts. This is often referred to as ‘grid parity’. Several attempts have been made to predict the point at which grid parity will be achieved for solar PV. As Yang (2010) points out, these discussions are often complicated by the fact that the definitions of ‘grid parity’ are often vague and inconsistent. It is commonly referred to as the point at which solar PV electricity becomes competitive with energy retail prices (IEA, 2010b). This will depend on a number of factors, including the solar intensity in the region and the retail price of electricity, but the IEA (2010b) suggests that it will happen in 2020 in many countries. Suggestions have also been made to compare PV’s generation costs with its revenues (EPIA, 2011b), which would be useful for residential rooftop systems. EPIA (2011b) speaks about ‘dynamic grid parity’, where PV’s generation costs are compared with PV revenues and ‘generation value competitiveness’. Table
3 The price of the system does not only depend on the technology improvement but also on the matu-rity of the market (which imply industry infrastructure as well as administrative cost)
4 LCOE varies with financing cost and location. Southern EU locations considered here range from 1500 (e.g. Toulouse) to 2000kWh/m² per year (e.g. Siracusa)
5 Estimated figures based on EUROBAT roadmaps

21
stockholm environment institute
3.2 shows some estimates of dynamic grid parity in some countries, and Table 3.3 compares the expected levelized costs of electricity generation (LCOE) (i.e. the cost of electricity, considering all the life cycle costs of the power plant) for solar PV with the generation costs of some conventional sources of electricity.
The period 2001–2010 saw cost declines in modules and systems of 19 per cent and 43 per cent, respectively, which would imply learning rates of 4–8 per cent over that period. Yet, in the period 2001–2008, the real terms prices of both modules and installed systems were essentially flat, with several years of price rises occurring in the first half of the decade (Figure 3.4). As several factors contribute to the market prices, it is difficult to assess the technology developments of recent years based on market prices.
The main R&D challenges for crystalline silicon are to reduce material consumption and increase automation in manufacturing (IEA, 2010b). For thin film, research issues
c-SI TRENDTF TREND
TF
c-SI HIGHc-SI LOW
Price-experiencefactor of 22%
1 10 100 1000 10000 100000
MW
(US
$/W
p)
2010
100
10
1
Figure 3.3: PV module experience curve for crystalline silicon and thin film (USD/Wp and MW) After epiA (2011b)
Figure 3.4: Cost of PV modules and installed PV system costs (USD/W) 2001-2010 data source: ieA pvps (2001-2011)
0
1
2
3
4
5
6
7
8
9
2001 2002 2003 2004 2005 2006 2007 2008 2009 2010
Module cost OECD (Avg)
Installed cost OECD (Avg)
Installed cost OECD (High)
Installed cost OECD (Low)US
D/W

22
driving technological innovation for a Low-Carbon society
include improved device structures and substrates, large area deposition techniques, interconnection, and roll-to-roll manufacturing and packaging (IEA, 2010b). However, significant improvements and cost reductions could also be made in the balance of system (BoS) costs, that is, the cost of system components, excluding PV cells and modules.
As PV module costs decline, the relative cost of the BoS in a PV system becomes even more significant. However, the nature of the BoS industry makes realizing cost reductions particularly challenging. For instance, installation involves a number of actors, including suppliers, developers, building owners, installers, regulators and utilities. Furthermore, a BoS is inherently localised, and each PV system requires a unique design based on site-specific characteristics. Striking a balance between standardization and customizability in the BoS will be critical as the PV industry grows. Since BoS costs are dispersed among various components, costs will be reduced through many small improvements, which can be achieved with the help of integrated analysis tools and a cross value-chain systems approach (Bony et al., 2010).
A potential barrier to the long term development of certain PV technologies in the area of thin film is the availability of scarce metals and materials. In addition, some of
France Germany Italy Spain United Kingdom
Residential (RES)
3 kW 2016 2017 2015 2017 2019
Commercial (COM)
100 kW 2018 2017 2013 2014 2017
Industrial (IND)
500 kW 2019 2019 2014 2017 2019
Table 3.2: Estimations of so called dynamic grid parity for select European countries epiA (2011b)
Table 3.3: Levelised cost of electricity estimates (USD/kwh) for utility scale installations, projected by EPIA (2011b) and IEA (2010b) compared with costs for generating electricity with coal and gas (ieA 2010c)
Recent* 2015 2020 2030
IEA PV Roadmap (utility scale)
USD 0.24-USD 0.48
USD 0.14-USD 0.19
USD 0.10-USD 0.14
USD 0.07-USD 09
EPIA PV Europe (utility scale)
USD 0.21-USD 0.41
USD 0.14-USD 0.26
USD 0.10-USD 0.21
N/A
IEA CoalUSD 0.06-USD 0.14
IEA GasUSD 0.07-USD 0.13

23
stockholm environment institute
the materials used are toxic, including the silicon dust created by sawing c-Si wafers; the cadmium used in CdTe cells; the dust from copper, indium, gallium and selenium caused by CIS/CIGS production; and selenium dioxide (SVTC, 2009). There have also been concerns raised about the availability of tellurium, used in CdTe cells, and indium, used in CIGS cells. Candelise et al., (2011) found that although the availability of these materials may not directly constrain PV market growth, their rising costs might limit the potential to achieve cost reductions, which in turn would limit market growth. Recycling programmes have been developed and are in use by some companies.
3.1.4 Industry developmentSolar modules and various system components are produced in several parts of the world. China plays an increasingly important role as a supplier of solar modules. In 2010, Chinese suppliers accounted for around 55 per cent of the global module production, which is an increase from 39 per cent the year before but modules as well as system components are also produced in Europe (around 13 per cent in 2010), the USA (18 per cent) and Japan (13 per cent), as well as in other regions (UNEP and Bloomberg New Energy Finance, 2011). The PV industry is dynamic and the role of different companies and countries in global PV supply has changed rapidly in recent years. Figure 3.5 shows some of the countries that currently play a major role in the PV value chain.
In the past decade, the largest change has been in the demand for and supply of modules. As is shown in Figure 3.6, in the early 2000s, global demand was reasonably balanced between Japan, the EU, the USA and the rest of the world. The supply picture was similar, with much of the demand being met by local producers. By 2010, however, the EU had become the dominant source of demand, and modules were increasingly being supplied from China.
Figure 3.5: Shares of solar PV value chain for some of the most important countries
China
Germany
Norway
UnitedStates
Japan
Korea
Taiwan
Si Feedstock
Ingots and Wafers
Cell production (output)
Module production
PV generating capacity

24
driving technological innovation for a Low-Carbon society
The technologies that dominate production in different regions vary somewhat. In China, for example, the innovation system mainly focuses on conventional crystalline silicon technologies (Marigo et al., 2010) whereas some US-based companies are leading the development of thin film technology.
Large and successful PV companies are increasingly international, with operations in various countries around the world. Over 1000 companies are involved in the manufacture of crystalline silicon technology and more than 30 produce thin film technologies. The production and supply of some key materials and equipment are concentrated in a few players. For example, 90 per cent of the production of polysilicon is manufactured by seven major players in Europe, the USA and Japan (EPIA, 2010). Over 300 companies are active in the production of inverters, although the top 10 companies produce more than 80 per cent of the inverters sold. In wafer and cell manufacture, the market is more segmented and competitive. More than 200 companies are active in this sector and around 1000 companies produced c-Si modules in 2010. Around 160 companies are active in thin film module manufacturing (EPIA, 2010). There is also a trend in the PV industry for fewer and larger companies and increased price pressure at all levels of the value chain. The financial crisis has accelerated these trends (IEA PVPS, 2010), although the industry concentration has fallen lately with 55 per cent of modules sold by the top ten manufacturers in 2010, compared to 63 per cent the year before (UNEP and Bloomberg New Energy Finance, 2011).
100
90
80
70
60
50
40
30
20
10
0
Perc
en
tag
e
2000 2001 2002 2003 2004 2005 2006 2007 2008 2009 2010
Mark
et
Pro
duction
Mark
et
Pro
duction
Mark
et
Pro
duction
Mark
et
Pro
duction
Mark
et
Pro
duction
Mark
et
Pro
duction
Mark
et
Pro
duction
Mark
et
Pro
duction
Mark
et
Pro
duction
Mark
et
Pro
duction
Mark
et
Pro
duction
Rest of the world China/Taiwan USA Japan EU
Figure 3.6: PV market share of different countries/regions versus PV module production, as shares of the total global market and module production 2000 – 2010 note that the total installed capacity and module production has increased dramatically in actual numbers over the same period. After epiA (2011c)

25
stockholm environment institute
3.2 Case study: solar PV in Europe
Europe has played a leading role in the development of solar PV, in terms of both market formation and research and development. European countries make up around 75 per cent of the global PV market6 (EPIA, 2011b). Germany is by far the largest market. By the end of 2010, the cumulative installed capacity in Germany was over 17,000 MW, compared to over 3,000 MW each in Italy and Spain and the Czech Republic, over 1,000 MW in France and around 800 MW in Belgium (EPIA, 2011b) (see Figure 3.7).
Several scenario studies have also suggested that installed solar PV capacity will increase in Europe (see Figure 3.8). Like the predictions and scenarios at the global level, estimates of how much electricity solar PV may contribute in Europe vary between studies. It has been suggested, for example, that PV could contribute 12 per cent of electricity generation in Europe by 2020 (EPIA, 2009), 19 per cent by 2050 in a study by the European Climate Foundation (ECF, 2010) but only 3.9 per cent in the IEA Bluemap scenario (IEA, 2010c). However, to reach the ambitious targets, major regulatory changes and upgrades of the existing electricity grid infrastructure are necessary (CEC, 2009a).
6 In terms of cumulative installed PV capacity.
AUT0.096
CHE0.111
DNK0.007
ESP3.915
FRA1.054
GBR0.07
ITA3.502
NLD0.088
NOR0.009
SWE0.011
TUR0.006
DEU17.37
PRT0.13
Figure 3.7: Cumulative installed PV capacity in main European countries source: ieA pvps (2011)

26
driving technological innovation for a Low-Carbon society
This section analyses the innovation system for PV in Europe. It describes its structural components, including the main policies, both market pull and technology push policies, and the key categories of actors. The functional pattern of the innovation system is described and analysed, including analysis and identification of the key blocking and inducement mechanisms suggested by Bergek et al., (2008). The overview primarily focuses on EU countries.
0
2040
6080
100
120
140
2000 2005 2015 2020 2025 2030 2035
Actual growth in installed capacity,OECD Europe (2001-2010), andfuture growth according the IEABlue Map Scenario
2010
PV c
apac
ity (M
W)
Figure 3.8: Actual growth in installed PV capacity (MW) in OECD Europe (2001 – 2010) and projected future growth according to the IEA Blue Map Scenario (ieA, 2010c). historic data from ieA (2011a) and ieA (2010e)
3.2.1 Actors in the European solar PV innovation systemThe innovation system for PV in Europe comprises a range of actors, such as companies, industry associations, universities and research institutes, and governmental organizations. Although much of the PV research is supported at the level of the EU countries, and markets are driven by national policies, EU wide organisations and initiatives at the EU level increase the connections and collaboration between organisations in different countries.
The European Commission funds PV research, primarily through its framework programmes (see below), which facilitate cross-country collaboration on PV research and promote research topics not connected to specific countries. The Commission also plays an important role in setting the EU-wide greenhouse gas emission reduction targets and targets for renewable energy technologies in the electricity supply and consumption of EU countries. International organisations, in particular the International Energy Agency, play an important role in creating international scenarios for various technologies, collecting statistics on PV research, production and installation, and highlighting R&D needs.
According to the PV Group (2011), the leading PV research institutions are found in Europe. The Fraunhofer Institute for Solar Energy Systems ISE (Fraunhofer ISE) is one of the most important. It was founded in 1981 and currently has around 1000 staff members, making it the largest solar energy research institute in Europe (Fraunhofer ISE, 2011).
Industry associations at the national level, most notably in Germany, have influenced and contributed to the development of market formation policies for PV and other

27
stockholm environment institute
renewable energy technologies. The European Photovoltaic Industry Association (EPIA) represents the European solar industry and has a strong voice on trends and needs within the industry. Industry associations also influence the direction of EU support for research. One example is the European Photovoltaic Technology Platform (EU PV Platform), which is made up of several actors including industry representatives and the EPIA (Jäger-Waldau, 2009). The EU PV Platform has developed a Strategic Research Agenda for PV and makes recommendations on how it should be implemented.
Several financial institutions contribute to PV deployment and research. In addition to the numerous private banks in Europe that provide funds for solar PV projects, these projects are also supported by public banks such as the German KfW and The European Investment Bank (EIB). The EIB provides loans for renewable energy initiatives and has also developed equity and carbon funds to support renewable and energy efficiency projects. The bank has loaned EUR 435 million to PV energy projects and related manufacturing, and also provides credit to support lending by commercial banks to small and medium sized enterprises active in renewable energy projects.
In the solar PV industry, large scale PV suppliers have become increasingly international over time, with production facilities and research centres spread out across several countries, and European suppliers are no exceptions. This internationalization is driven by a number of factors. One of the main reasons is to reduce production costs. This has led some European suppliers to relocate at least part of their production to countries in Asia. A multinational presence also allows companies to establish a market presence in several countries, to benefit from national industry policies, take advantage of customer preferences and local know-how, and reduce transportation costs when serving the local market. The latter reasons were emphasised by interviewees as especially important to the establishment of facilities in the USA.
In this way, the German Q-Cells AG now has production in Malaysia, the Norwegian Renewable Energy Corporation produces solar cells in Singapore and German Solar World AG has manufacturing operations in Germany, the USA and South Korea as well as a joint venture between Solarworld and SolarPark Engineering Co. Ltd. (Jäger-Waldau, 2011).
Similarly, solar PV manufacturers based outside Europe have established production facilities and/or research centres in Europe, partly to increase public support for the manufacturer and partly to benefit from local know-how. In this way, the US company First Solar has manufacturing sites in the USA, Germany and Malaysia, and Japan’s Sharp Corporation, in addition to its main solar cell and module factories in Japan, has a cell manufacturing facility in Italy, and module manufacturing facilities in the USA, the United Kingdom (UK) and Thailand as well as a research centre in the UK (Jäger-Waldau, 2011).
Although the promotion of solar PV in Europe has led to the development of a large regional manufacturing and engineering industry, Europe has become a net importer of photovoltaic devices. Growing production capacity in Asia means that this trend is

28
driving technological innovation for a Low-Carbon society
likely to continue. Only three (Q-Cells AG, Renewable Energy Corporation, and Solar World) of the 20 largest solar cell production7 companies are now based in Europe (Jäger-Waldau, 2011). Table 3.4 displays the largest European PV module and cell manufacturers. Only two of the ten largest polysilicon manufacturers worldwide are European: German Wacker Polysilicon and Norwegian Renewable Energy Corporation (Jäger-Waldau, 2011).
Nonetheless, the European PV industry remains well positioned, in particular in equipment manufacturing and inverter manufacturing (Jäger-Waldau, 2011). In addition, the solar PV value chain includes a range of other activities and European suppliers can be found in all parts of it (EPIA, 2011a). The upstream part of the value chain includes all the steps from the manufacture of equipment and materials to the production of modules, inverters and other balance of system (BoS) elements (EPIA, 2011a). As a supplier of manufacturing equipment, Europe remains the dominant region (Menna et al., 2010). Balance of system components are increasingly in focus as a source of potential cost reductions. Significant attention has been paid to reducing the cost of inverters. Companies in Germany, Spain, Switzerland, Denmark and Italy are active in this field (IEA PVPS, 2010).
The downstream part of the value chain includes wholesalers, which are intermediaries between manufacturers and the installer or the customer; system developers, which offer their services to build turnkey PV installations; and owners of PV installations, which sell power to the grid. A range of small and medium sized enterprises are involved in the downstream part of the supply chain, making this part of the value chain highly fragmented and difficult to track (EPIA, 2011a). Engineering, procurement and construction companies assist the PV system owner to obtain finance, select components and advise on a suitable location and system design (EPIA, 2011a). This downstream segment is an important one for the European PV industry. Even though more than two-thirds of the solar cells that are installed in Germany are produced in other countries, about 60 per cent of the value added remains in the German economy (Jäger-Waldau, 2011).
The role of utilities in relation to solar PV varies throughout Europe. In general, the support mechanisms for introducing PV have often been favourable to small-scale installations. Even the large and utility-scale plants are not always owned by utilities. The role of utility scale installations varies somewhat according to national support mechanisms, but in general these installations represent a relatively low percentage of PV-based generation. Utilities that have invested in utility-scale solar PV installations tend to be active in sunny regions that have feed-in tariffs set at a sufficient level. However, utilities such as Enel (Italy) and GDF Suez (France/Benelux) are also involved in engineering services, installing and distributing solar PV panels. GDF Suez also owns a subsidiary that supplies solar PV modules.
7 Here, ‘solar cell production companies’ include only companies that produce the active circuit (solar cell), including, for the case of wafer silicon based solar cells, only cell manufacturers; and for thin film, producers of the complete module (Jäger-Waldau 2011).
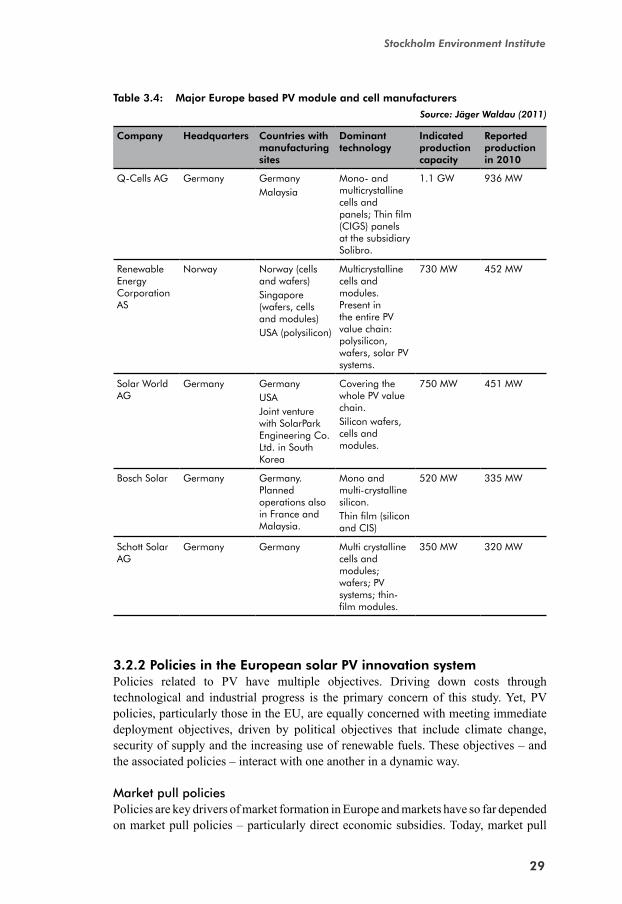
29
stockholm environment institute
3.2.2 Policies in the European solar PV innovation systemPolicies related to PV have multiple objectives. Driving down costs through technological and industrial progress is the primary concern of this study. Yet, PV policies, particularly those in the EU, are equally concerned with meeting immediate deployment objectives, driven by political objectives that include climate change, security of supply and the increasing use of renewable fuels. These objectives – and the associated policies – interact with one another in a dynamic way.
Market pull policiesPolicies are key drivers of market formation in Europe and markets have so far depended on market pull policies – particularly direct economic subsidies. Today, market pull
Table 3.4: Major Europe based PV module and cell manufacturers
source: Jäger waldau (2011)
Company Headquarters Countries with manufacturing sites
Dominant technology
Indicated production capacity
Reported production in 2010
Q-Cells AG Germany GermanyMalaysia
Mono- and multicrystalline cells and panels; Thin film (CIGS) panels at the subsidiary Solibro.
1.1 GW 936 MW
Renewable Energy Corporation AS
Norway Norway (cells and wafers)Singapore (wafers, cells and modules)USA (polysilicon)
Multicrystalline cells and modules. Present in the entire PV value chain: polysilicon, wafers, solar PV systems.
730 MW 452 MW
Solar World AG
Germany GermanyUSAJoint venture with SolarPark Engineering Co. Ltd. in South Korea
Covering the whole PV value chain.Silicon wafers, cells and modules.
750 MW 451 MW
Bosch Solar Germany Germany. Planned operations also in France and Malaysia.
Mono and multi-crystalline silicon.Thin film (silicon and CIS)
520 MW 335 MW
Schott Solar AG
Germany Germany Multi crystalline cells and modules; wafers; PV systems; thin-film modules.
350 MW 320 MW

30
driving technological innovation for a Low-Carbon society
policies for renewable energy technologies are found in most EU countries and are to a great extent linked to EU-wide targets to increase the percentage of renewable energy in the electricity mix. These targets are viewed as a way to reduce dependency on fossil fuels, for reasons of short- and long-term security of supply. They are also seen as supporting EU targets on climate change.
A 1997 European Commission White Paper forms the basis for EU renewable energy policy, but the binding targets for electricity from renewable sources were first established in the Renewable Energy Roadmap published by the EU Commission in 2007. It outlines a long-term strategy including a mandatory target of 20 per cent renewable energy in the EU energy mix by 2020. The energy and climate objectives for 2020 also include a target to reduce greenhouse gas emissions by 20 per cent, or 30 per cent if other developed countries make similar commitments, and to improve energy efficiency by 20 per cent. The targets, sometimes referred to as the ‘20-20-20 targets’, became binding after the approval of the EU Climate and Energy legislative package in 2009. Long term commitments have been made to reduce emissions by 80–95 per cent by 2050 (CEC, 2010).
To meet these targets, the EU Renewable Energy Directive was developed and adopted in 2009. The directive sets national binding targets for greenhouse gas emissions in the different EU countries and requires the EU countries to provide priority access or guaranteed access to the grid-system for electricity produced from renewable sources (Jäger-Waldau, 2011). This directive plays a major role in driving PV market growth in the EU. The promotion of renewable energy is not only meant to reduce emissions of greenhouse gases and contribute to secure energy supply. It is also expected to contribute to the development of a ‘knowledge based industry’ and to create jobs, economic growth and competitiveness (CEC, 2011a).
The creation of a European integrated energy market is also seen as important to achieving the 20-20-20 targets referred to above (CEC, 2010). This is an important goal of the Third Energy Package adopted in 2009. A number of other EU-wide measures and policies relevant to PV deployment are outlined in Table 3.5.
Although the overall goals for renewables and for greenhouse gas emissions are set at the EU level, it is policies at the national level that influence PV deployment most directly. National plans have been developed in the EU countries, including targets for both renewable energy and energy efficiency. The role given to PV varies widely between different EU countries. Finland, Sweden and Ireland are not counting on the technology at all, whereas Greece, Italy, Luxembourg and Spain expect a contribution of 10 per cent of their renewable electricity from PV (Menna et al., 2010). National Renewable Energy Action Plans (NREAPs) have been developed by each country based on the assumptions and strategic choices of the different governments. The reasons behind these differences are related to country-specific factors such as the availability of solar irradiation and the current electricity mix.

31
stockholm environment institute
However, market pull and technology push policies were developed and put in place in Germany long before the EU wide targets for renewables and greenhouse gas emissions were established. The focus on renewable energy technologies in Germany is linked to the energy crisis of the 1970s and a general scepticism about nuclear power among the public. Public R&D funds for renewable energy technologies were increased, followed by a number of policy instruments (Jacobsson and Lauber, 2006). German market pull policies have been the key driver of the global PV industry in recent years, and these policies have functioned as a model for many other European countries.
As solar PV is still quite costly compared to more conventional electricity generation technologies, policies have been put in place to create incentives for investors and to stimulate the development of markets for these technologies. The main policy measures used at the national level to introduce renewable energy technologies are feed-in tariffs and tradable green certificates (TGCs). Other instruments include net metering, capital subsidies and tax credits. These are currently only used as supplementary measures
Policy / initiative Description / relevance for PV
EU Renewable Energy Directive
Includes binding national targets for greenhouse gas emissions in the different EU countries; plays a main role in driving the PV market growth in the EU.
Third Energy Package One target area is to facilitate the creation of a European integrated energy market.
Energy Performance of Buildings Directive
Includes a requirement that all new buildings must be ‘nearly zero energy buildings’ by 2020, which can be expected to spur PV deployment in buildings.
European cohesion policy
Aims to reduce the gaps in development and disparities in well-being between citizens and regions in different parts of the EU. The policy supports the regions through financial instruments, for example, the Cohesion Fund, which provides funding for, among other things, projects installing solar panels or replacing old boilers with more efficient ones.
Intelligent Energy Europe (IEE)
Stimulates cooperation between EU countries to reduce non-technical barriers that hinder the growth of energy markets. Project examples include installation of small and medium sized PV plants on degraded land and projects to develop effective legal frameworks in new member states (EACI 2009).
European Energy Programme for Recovery (EEPR)
Aims to stimulate the economy after the economic recession by supporting investment in renewable and low carbon energy technologies.
Solar European Industrial Initiative (SEII)
The SEII and its implementation plan, Strategic Energy Technology Plan (SET-Plan), aims to expand the European PV market to ensure European technology leadership, and to raise the contribution of PV to European electricity demand to 12 % by 2020 (Menna et al., 2010).
European Emissions Trading Scheme (EU ETS)
Aims to create a market for emission reductions and low-carbon energy solutions by requiring energy producers to pay for the right to emit CO2.
Table 3.5: EU level policies of relevance for PV deployment

32
driving technological innovation for a Low-Carbon society
Country Main support schemes Support levels (2011)
Germany Feed in tariffs (20 years) Tariffs for new installations from 1 January 2011 on:Roof-top and noise barriers:- System size < 30 kW: 0.287 EUR/kWh- System size 30 to 100 kW: 0.273 EUR/kWh- System size 100 kW to 1 MW: 0.259 EUR/kWh- System size > 1 MW: 0.216 EUR/kWhRoof-top with auto consumption:- System size < 30 kW: up to 30% 0.124 EUR/kWh more than 30% 0.167 €/kWh- System size 30 to 100 kW: up to 30% 0.110 €/kWh more than 70% 0.153 €/kWh- System size 100 to 500 kW: up to 30% 0.095 €/kWh more than 70% 0.139 €/kWhGround-mounted installations: 0.211 €/kWhGround-mounted installations in redevelopment areas: 0.227 €/kWhAll tariffs for new systems reduced by 9% in 2012. Increase or decrease in the tariff degression rate depending on the level of the total installed capacity the year before.
Table 3.6: Support schemes for introduction of solar PV in the main European PV markets according to EPIA (2011a). Source: Jäger Waldau (2011)
After epiA (2011c)
rather than as the main policy instrument (Dusonchet and Telaretti, 2009). Table 3.6 provides an overview of policies that support the development of PV markets in European countries.
Feed-in tariffs in Europe were introduced first in Germany. They have been the main mechanism for supporting RES deployment in the EU and by 2009 were being applied in 20 EU countries (Campoccia et al., 2009). The idea behind the feed-in tariff system is that utilities must purchase the electricity generated by renewable energy producers in their service area at a tariff that has been determined by the public authorities and which is guaranteed for a specific time period. The tariffs vary depending on the type of energy technology and the type of installation, and between different countries – and may even vary within countries (Table 3.6).
A system of tradable green certificates (TGCs) commonly issues a number of TGCs to producers of electricity equivalent to the amount of electricity from renewable sources that they generate. These certificates can be sold and traded. In a country where such a system is implemented, electricity suppliers usually need to prove that they can produce a certain level of renewable energy, either through their own generation or by acquiring green certificates. Countries such as Belgium, Sweden and the UK were early implementers of such systems (Bergek and Jacobsson, 2010) and have been followed by several others.

33
stockholm environment institute
Italy Feed in tariffs (20 years). 2% decrease for new systems each year. Tariffs are being reduced monthly from June 2011. Only December tariff levels are described here. Further reductions expected in 2012. Additions:- Up to 30% premium for roof-top systems installed in conjunction with energy efficiency measures- 5% premium for ground mounted systems on garbage dumps, contained sites or similar- 5% bonus for smaller systems in communities with less than 5,000 inhabitants- 0.05 EUR/kWh bonus for roof-top systems with removal of asbestos cement or similar material.
Feed in tariffs – December 2011: Systems on buildings:1 kWp ≤P ≤ 3 kWp: 0.289 EUR/kWh 3 kWp < P ≤ 20 kWp: 0.268 EUR/kWh 20 kWp < P < 200 kWp: 0.253 EUR/kWh 200 kWp < P < 1 MW: 0.246 EUR/kWh 1 MW < P < 5 MW: 0.212 EUR/kWh P > 5 MW: 0.199 EUR/kWh Other installations:1 kWp ≤P ≤ 3 kWp: 0.261 EUR/kWh3 kWp < P ≤ 20 kWp: 0.238 EUR/kWh20 kWp < P < 200 kWp: 0.224 EUR/kWh200 kWp < P < 1 MW: 0.189 EUR/kWh1 MW < P < 5 MW: 0.181 EUR/kWhP > 5 MW: 0.172 EUR/kWh
Czech Republic
Producers of electricity can choose between: - Feed in tariffs- Market price + Green Bonus
Fixed feed in tariff levels 2011:≤ 30 kW: 7.5 CZK/kWh (0.311 ./kWh)> 30 kW and ≤ 100kW: 5.9 CZK/kWh (0.245 EUR/kWh)> 100 kW: 5.5 CZK/kWh (0.228 EUR/kWh)Green Bonus levels 2011:Systems commissioned after 01/01/10:. 30 kW: 6.5 CZK/kWh (0.270 EUR/kWh)> 30 kW and ≤ 100kW: 4.9 CZK/kWh (0.203 EUR/kWh)> 100 kW: 4.5 CZK/kWh (0.187 EUR/kWh)
Belgium Green CertificatesNet metering (for small systems < 10 kWp)Tax reduction
Guaranteed minimum certificate prices:- Brussels: 0.15 – 0.65 €/kWh depending on size (10 years)- Wallonia: 0.15 – 0.70 €/kWh depending on size and actual GC value (15 years)- Flanders: 0.33 €/kWh for 20 years
France Feed in tariffs (20 years) Residential:BIPV: ≤ 9kWp 0.46 EUR/kWh9 < P ≤ 36 kWp 0.403 EUR/kWhSimplified BIPV: ≤ 9kWp 0.304 EUR/kWh9 < P ≤ 36 kWp 0.288 EUR/kWhHealth Care Institutions:BIPV: ≤ 36 kWp 0.406 EUR/kWhSimplified BIPV: ≤ 9kWp 0.304 EUR/kWh9 < P ≤ 36 kWp 0.288 EUR/kWhOther Buildings:BIPV: ≤ 9kWp 0.352 EUR/kWhSimplified BIPV: ≤ 9kWp 0.304 €/kWh9 < P ≤ 36 kWp 0.288 EUR/kWhAll Other Installations: ≤ 12 MWp 0.120 EUR/kWh
Spain Feed in tariffs. Tariffs for new projects:Building-integrated and roof-top:< 20 kWp: 0.289 EUR/kWh 20 kWp < P < 2 MW: 0.204 EUR/kWh Ground-mounted systems, max 10 MW:0.135 EUR/kWh

34
driving technological innovation for a Low-Carbon society
A net metering system has so far only been introduced in a few European countries. The system ensures that the electricity generated and supplied to the grid has the same economic value as the energy sold by the utility to the customers. It allows small-scale renewable energy producers to offset their consumption with RES production during a certain billing period, irrespective of when it is produced, (Campoccia et al., 2009). Our interviews indicate that whereas manufacturers in the PV industry are positive about such measures, opinions among the utilities are more mixed, as energy prices fluctuate over time.
Electricity from renewable energy sources is also awarded certain tax privileges. For example, in Belgium and France individuals who install PV, solar thermal or geothermal energy systems may offset the cost of the installation against their income tax. Similarly, in Belgium, Greece and Spain, companies receive corporate tax cuts for investing in renewable energy systems. In Italy, municipalities may reduce the rate of the real estate tax for property owners who have installed a system for renewable energy on properties that do not function as the main home. Similar measures are in place in Spain, Germany, Denmark, Romania, Slovakia, Sweden and Poland, where there are excise duty exemptions for renewable energy (Cansino et al., 2010). Other support measures include regulatory frameworks to promote the inclusion of solar panels in the fabric of buildings (Building Integrated Photovoltaics, BIPV), which have been implemented in France, Italy and Spain.
Technology push policiesSolar PV research is supported both by individual EU countries and at the EU level, through research programmes supported and administered by the European Commission. The budget for PV support administered through the EU framework programmes (FPs) accounts for about 6 per cent of total spending on PV R&D in the EU. 35 per cent of total spending on PV R&D in the EU comes from national support by EU countries, and the rest comes from the private sector (EU PV Platform, 2009). The EU budget is thus relatively small compared to total national budgets, but it plays an important role in creating a European PV research area (Jäger-Waldau, 2009). PV research is a clear priority among the EU-level research initiatives and in several EU countries, although the focus varies greatly between different countries. The main research support measures for PV at the EU level are described below, and the research funding of European countries with particularly high levels of support for PV research is highlighted.
EU level research support to solar PV began in 1980 and is organised through FPs. European Commission support for solar PV R&D increased from EUR 84 million in FP4 (1994–1998) to EUR 120 million in FP5 (1998–2002) but then decreased to EUR 107.5 million in FP6 (2002–2006) (Jäger-Waldau, 2011). In FP7, which runs from 2007 to 2013, the budget for PV has again been increased (Menna et al., 2010). Significant R&D into traditional wafer-based silicon PV is now carried out by companies and national programmes, so FP7 is focusing less on this area. Instead, material development for longer term applications, concentration PV and manufacturing process development have been prioritised, and significant funding has

35
stockholm environment institute
been made available for thin film technology (Menna et al., 2010) (see Figure 3.9). The Commission expects that its research activities will contribute to reducing the cost of grid connected PV electricity in Europe to 0.10–0.25 EUR/kWh by 2020 (Jäger-Waldau, 2011).
EU level support to solar PV R&D also includes support for innovative companies. Support measures target both R&D in its early phases, demonstration projects and companies in their early development.
The European Strategic Energy Technology Plan (SET-Plan) developed by the European Commission focuses on accelerating innovation in low carbon technologies in Europe. PV is identified as one of the key technologies, and one of the six industry-led initiatives called for in the SET-Plan focuses on solar PV. The Solar Europe Industry Initiative (SEII) under the SET-Plan is led by the European Photovoltaic Industry Association (EPIA) and focuses on large-scale demonstration projects (Jäger-Waldau, 2011). It is intended that the SEII will bring PV to cost competitiveness in all market segments, establish conditions that will allow high levels of penetration of distributed PV electricity in the European electricity system and facilitate the implementation of large-scale demonstration and deployment projects of importance to both the European PV sector and wider society (Jäger-Waldau, 2011).
The public support to solar PV R&D at national level varies between European countries, with Germany as the clear leader (PV research budget of EUR 52.9 million in 2009), followed by the Netherlands (EUR 12.0 million), and Norway (EUR 10.4 million) (IEA PVPS, 2010). German support to PV research increased to around EUR 64 million in 2010 (see Table 3.7). A large part of this support was directed to silicon wafer-based technologies, although film technologies are receiving increased attention.
Horizontal activities/integrating infrastructures
Production equipmentand processes
Innovation installations andgrid interconnections
Building integration
New concepts
CVP
Thin-films
Wafer-based Si
Investment in PV2003–2010 (Euro millions)
0 4 8 12 16 20 24 28
FP7 (2007-10) EUR 116.3 M
FP6 (2003-06) EUR 104.8 M
Figure 3.9: Investments in photovoltaics under FP6 and the first four calls of FP7 After menna et al., (2010)

36
driving technological innovation for a Low-Carbon society
Other focus areas include systems engineering and grid integration, and concentrating photovoltaics. Medium- and long-term research is prioritised and the research findings are made accessible to all German companies (Wissing, 2011). Support has also been provided for collaboration between industry and research, for example, the support provided to the Solarvalley Mitteldeutschland cluster, which is made up of most of Germany’s PV industry and is intended to grow into an internationally attractive centre (Wissing, 2009). 8
Norway has a significant public PV research budget, especially given the size of the country and its small domestic market. Public funding in 2010 was NOK 144 million or EUR 18 million (Bugge and Salvesen, 2011), which was an increase from 2009 (NOK 91 million or EUR 10 million) and 2008 (NOK 56 million or EUR 8 million) (IEA PVPS, 2010). PV research activity in Norway is to a great extent focused on areas related to silicon feedstock for crystalline cells and wafer- and cell-production technologies (Bugge and Salvesen, 2011), areas in which its Renewable Energy Corporation is a leading company internationally.
3.2.3 The European solar PV TIS: Functionality, major barriers and driversHaving reviewed the structural components of the European solar PV innovation system, this section provides an overview of its functional pattern (Bergek et al., 2008) in Table 3.8. Some of these functions are further described below, as well as the main blocking and inducement mechanisms.
Entrepreneurial activity in solar PV in Europe is closely linked to the existence and level of market development policies, in particular feed-in tariffs. Companies are sometimes started as spin-offs from universities, but business opportunities have also arisen in areas such as system development, where companies assist clients with issues such as legal and administrative advice as well as planning and purchasing equipment for the installation, and assist with the installation and maintenance of the equipment.
8 2009 level
Table 3.7: Public budgets for R&D in 2010 in selected European countries source: ieA pvps (2011a)
Country Million EUR
Austria 5.28
Germany > 64
Denmark 3.4
Spain 13
France 43.5
Italy 5.8
Norway 18.1
Sweden 6.3

37
stockholm environment institute
European companies are found in the entire solar PV value chain. Increasing manufacture in Asia, often at lower cost than in Europe, creates challenges for European cell and module suppliers. In response to increased international competition, the companies interviewed tend to focus more on high quality and more sophisticated products that are tailor-made for customers. Even these preferences may be linked to policies. In France, for example, there have been more building integrated projects, since this is particularly supported by French policy. European companies have advantages here since they have local knowledge and understand the clients. Another strategy mentioned is to focus on improving manufacturing technologies that are more difficult for competitors to copy. There might also be a shift in PV technologies. Asian
Function Description
Entrepreneurial activity
Entrepreneurial activity is often linked to research institutes where companies often start as spin-offs from university research groups. The level of entrepreneurial activity varies between different countries and is strongly linked to the development of feed-in tariffs.
Knowledge development
Knowledge development today occurs in companies and academic institutions. Increasing company R&D has tended to focus primarily on short term issues. For long-term R&D, public support to universities and other academic institutes is also necessary.
Knowledge diffusion
Global companies and a dynamic workforce mean that knowledge is spread between countries. Collaboration occurs between market actors as well as between academia and companies.
Influence on the direction of search
Overall direction of search is influenced by EU political targets to reduce emissions of greenhouse gases and increase the use of renewable energy sources. The support to solar PV is affected by public acceptance of the technology, the financial situation and the expected value of PV. Research subsidies tend to support current and ongoing research in the region/country, and support often seeks to stimulate industry growth and low carbon technology growth at the same time. National market development policies influence the direction of search within the industry. As tariff levels are decreased, efforts are being made to achieve cost reductions. Industry actors in turn influence the focus of research funding.
Market formation Markets for PV are well formed in Europe, but they depend on support - primarily from feed-in tariffs. Policies are thus key drivers of market formation. The level of this support and thus of market development varies between different European countries. The dependence on feed-in tariffs makes the markets vulnerable to changes. Activities among established firms, such as utilities (e.g. Enel and GDF Suez) that help customers install PV installations, also contribute to market formation.
Resource mobilization
As the PV industry has grown, the financial resources for R&D have also grown, although this is often focused primarily on short term achievements. Enabling technologies such as storage and smart energy management need to be developed to aid self-consumption and grid integration. A lack of skilled professionals is a potential barrier (European Commission 2009) as the solar PV industry is quite young.
Legitimisation Although solar PV has generally had a high level of public acceptance, increasing electricity prices have altered this situation somewhat. Loss of supply-side market share to other countries and regions could also undermine the legitimacy of PV subsidies in Europe.
Table 3.8: Functional pattern of the solar PV TIS in Europe.

38
driving technological innovation for a Low-Carbon society
companies are taking an increasing market share in the area of crystalline silicon technology, and European companies might benefit from focusing on thin film, where production is more automated and less labour is required.
Companies also said that they are increasingly focused on making cost reductions in the entire solar PV system, on which they tend to collaborate with system developers. However, such collaborations involve the risk of knowledge spillover. Locating production to other parts of the world is another common approach to addressing increased international competition. Decreased feed-in tariff levels and increasing international competition also mean that European companies are increasingly trying to look to new markets, such as India, the USA and Japan.
When it comes to knowledge development, PV research is linked to both public research grants and private funding. Because business-led research often tends to focus on short term issues, however, it is crucial that public research funding is maintained to ensure that long term research is also supported. R&D activities tend to be concentrated in certain geographical regions within countries, such as southern Germany. Industry plays a significant role in influencing the direction of R&D support at the EU level. Decisions on which research areas to support are often based on suggestions by experts in the field and tend to reflect developments in the industry. It was also pointed out in the interviews that research grants at the national level often tend to support existing research in the country.
In a TIS study of solar PV from 2004, Jacobsson and Bergek (2004) observed weak learning and political networks between actors. As the industry grows, this is becoming less of a barrier. Yet, few of the companies interviewed mentioned that they work actively with research institutes, and increased collaboration might assist with both short term and long term development issues. Several initiatives at both the national and the EU level however have tried to create linkages between industry and universities.
The goal of increasing the percentage of renewable energy technologies in the energy mix has dominated the direction of search. Overall political targets at the EU level function as the main drivers of increased deployment of renewable energy sources, support to PV research, and the related development of national market creation mechanisms such as feed-in tariffs. In this way, the overall direction of search is to some extent linked to the EU level, while more detailed market formation mechanisms are found at the national level.
Market formation in Europe has been supported largely by subsidies, and markets have increased over the years. Thus far, the PV markets in Europe have been entirely dependent on feed-in tariffs and other support systems (see below). In countries where subsidies are not sufficiently high to cover the expenses the impact of the support system on deployment of the technology has been very limited (Dusonchet and Telaretti, 2010).

39
stockholm environment institute
Administrative issues also tend to influence market development. Industry representatives argue for simplified administrative processes and a streamlining of the different aspects of the licensing procedure, including building permits, environmental assessments, grants and grid access. This has also been pointed out in the literature (e.g. Campoccia et al., 2009; Dusonchet and Telaretti, 2010). As is discussed below, badly designed feed-in tariffs can also function as a barrier to PV deployment, industry growth and technology development.
Market formation in Europe has also played a key role in the development of the global PV industry and in spurring R&D efforts in several countries worldwide. Financial resources supporting research are available at the EU level as well as nationally in individual countries. As the industry has grown, private sector research has also increased. UNEP and Bloomberg New Energy Finance (2011) point out that corporate solar R&D decreased from 2009 to 2010. Corporate PV R&D is largely linked the development of the PV market, which in turn is determined by the feed-in tariffs. The decrease in corporate solar R&D investment in 2010 may be linked to increasing demand during the year – company investment may have been shifted from R&D to investment in new production capacity (UNEP and Bloomberg New Energy Finance, 2011).
Public and political legitimacy have generally been high for PV, and PV has gained significant support from EU and national policy linked to renewable energy targets. However, more recently, support among consumers has diminished somewhat, as tariff levels increase the price of electricity. This is further complicated by increased international competition, which may also lead to reduced subsidies and policy support.
3.2.4 Assessment of European policiesGiven the objectives of European policy, it seems clear that feed-in tariffs have been the most effective measure in terms of stimulating deployment of renewable technologies in Europe (e.g. Fouquet and Johansson, 2008). Haas et al., (2007) argue that feed-in tariffs also offer the possibility of introducing RES at the fastest speed and lowest cost to society, although it should be pointed out that the objectives of fast deployment and lowest cost are not always compatible. Frondel et al., (2010) criticise feed-in tariffs for poor cost efficiency because the highest tariffs are granted to the least competitive technologies. This, however, is part of the objective – to ensure that markets are created for technologies that are less developed in order to encourage their further development (Lesser and Su, 2008).
In contrast to feed-in tariffs, tradable green certificates are not usually differentiated according to the type of renewable energy technology. Nor do they offer a fixed price for a certain number of years as the feed in tariffs, which presents uncertainties for investors (Campoccia et al., 2009). Green certificate systems have thus been found to be an ineffective policy tool for stimulating PV deployment and development (Haas et al., 2007). TGCs have been effective at promoting PV installations in Belgium, but it has been argued that the Belgian green certificate system, at least in the Flemish part of the country, has similarities with feed-in tariff systems (EPIA, 2010).

40
driving technological innovation for a Low-Carbon society
Green certificates favour competition, that is, they favour low cost renewables over those with higher costs. This focus on dynamic cost efficiency disadvantages technologies that are at an earlier stage of development (e.g. Lesser and Su, 2008). Thus, the choice between feed-in tariffs and a green certificate system depends on the goals of the intended policy instrument. If the main goal is merely to increase the percentage of renewable energy in the electricity mix at the lowest possible cost, TGCs are well suited. On the other hand, if the goal is to promote the development of certain technologies, or to stimulate the market for particular technologies such as PV which are less mature than other renewable energy technologies, then feed-in tariffs are preferable (Bergek and Jacobsson, 2010). As pointed out by for example Sandén and Azar (2005), to meet both short term and long term targets, both broad based policies and more technology-specific support mechanisms are needed.
The optimal feed in tariff level depends on a range of factors, including irradiation, the electricity price and current cost levels in the industry. Tariff levels should be high enough to encourage deployment, but at the same time low enough to stimulate cost reductions in the industry. This means that policymakers need information about a range of issues, such as future market prices for electricity and future capital and operating costs for the different energy technologies (Lesser and Su, 2008). Here, policymakers will partly have to rely on information from industry actors, which may tend to be biased (ibid), increasing the risks of over-generous tariffs.
Too generous feed in tariffs can also have negative effects on the industry, which was the case, for example, in Spain – a country where the feed-in tariff system turned out to be unsustainable. When the legislation became effective in May 2007, the Spanish system had a promotion cap of 371 MW (Lühti, 2010). The awareness of the cap caused a rush of installations. In addition, the Spanish system was the most generous of all support systems for PV deployment, promoting solar PV at EUR 0.58/kWh – more than twice the levelised cost of electricity from PV reported by the EPIA in 2011. Finally, unlike the German feed-in tariff system, the Spanish system did not include an annual reduction. These factors together caused a boom in installations, including inefficient and poorly designed plants. In 2008, more than 40 per cent of the world’s total solar installations were in Spain. Linked to this market development, the PV industry in Spain also grew quickly, and many suppliers were not cost-competitive. The economic crisis which began in 2008 has complicated matters and Spain was forced to revise its subsidies and even implement retroactive changes, so that even existing installations were affected. This in turn caused a collapse in the rapidly growing solar industry.
Johnstone et al., (2010) suggest that the technology-specific support generated by feed-in tariffs has had a positive influence on innovative activity in solar and other, less mature, technologies. However, the exact effect of the feed in tariffs on innovation can be difficult to assess. In the last decade, the costs of modules and PV systems have been relatively stable (Fig 3.4), suggesting that feed in tariffs have been too generous to sufficiently stimulate cost reductions.

41
stockholm environment institute
The aim of feed-in tariffs is not merely to ensure as many solar PV installations as possible, but to enhance the development of a competitive supply-side industry with PV manufacturers competing to offer the lowest costs. However, over the past decade, apart from the last few years, costs of installed systems have remained relatively stable (Figure 3.4), which indicates that tariffs may have been too high to sufficiently incentivise cost reductions.
Current best practice is to establish regular revision mechanisms to align feed-in tariffs with cost developments, and in some cases to use ‘reverse auctions’ to secure the more cost-competitive deployment. Currently, feed-in tariff levels are being significantly reduced in a number of European countries. One of the reasons behind these cuts is to ensure that tariff levels follow the cost reductions that have been achieved within the industry and to create incentives for further cost reductions.
The design of the feed-in tariff system also affects the types of PV installations that are installed, as the tariff levels often vary depending on the size of the installation. The feed in tariff system in Spain has for example favoured large scale installations, whereas the German one has rather favoured small, roof-top installations (Campoccia et al., 2009). When several European countries have announced reductions in tariffs, the trend has been to ensure continued support for small scale installations while support for large, utility scale installations has been reduced more.
Menanteau (2000) suggests that there has been a strong path dependency on crystalline silicon technology since the 1970s, which has been further supported by market pull policies. Just as policies specific to PV appear better at stimulating innovation and deployment (Bergek and Jacobsson, 2010; Johnstone et al., 2010), it could be assumed that feed-in tariffs have to be higher for thin film and organic PV in order to be effective at stimulating the deployment of these technologies rather than only the more mature crystalline PV. Although thin film modules are now also being installed in Europe, these are often manufactured by non-European suppliers. It is plausible that the strong focus on rapid market development in Europe, and in particular in Germany, has led to a stronger focus on silicon crystalline technology in terms of both innovation and entrepreneurial activity, which could be regarded as negative for the long term growth of the European PV industry.
The role of European suppliers in the global PV supply chain has undergone changes in recent years. Whereas 80 per cent of all PV installations take place in Europe, the role of European suppliers in satisfying this demand is decreasing. Only 29 per cent of all solar cells were produced in Europe in 2009, and in 2010 this share dropped to 13 per cent (PV Magazine, 2011). Only one of the world’s top 10 solar cell manufacturers is European, whereas several are based in China and Taiwan.
Concerns about this situation are being raised not only by European industry but also by policymakers. One somewhat controversial idea is the Italian government’s proposal for higher feed-in tariffs for installations that primarily use European suppliers (Solar Industry, 2011). While this may contribute positively to legitimisation and to creating

42
driving technological innovation for a Low-Carbon society
jobs and domestic growth in European countries, it is not clear that it is the best option from a technology development perspective seen in a global context. Feed-in tariffs have been highly effective at creating markets for PV. However, in the long term, PV will have to be efficient without subsidies.
3.2.5 Concluding remarks Europe has played a major role in the development of the international innovation system for PV. It is the European market pull policies in particular that have stimulated the development of markets, which in turn has caused a large international industry to grow. However, these markets are still dependent on subsidies. Currently, the level of these subsidies is being reduced in several countries, which may decrease the number of PV installations in Europe in the coming years. This decrease will have effects on PV suppliers and potentially on PV technology development.
Increased international competition provides challenges for European PV suppliers. As competition increases, suppliers in countries where production costs are lower gain advantages over European suppliers. Several European suppliers are trying to compete using high quality and customised applications. Collaboration with system developers to provide complete systems solutions is also increasing. The increasingly important role of international suppliers in European PV installations also undermines the public and political legitimacy of PV, which could lead to decreased policy support for it – with potential effects on PV development worldwide.
In recent years, R&D support at the EU level has focused to an increasing extent on thin film technology. Although some have argued that market development policies have favoured crystalline technology, the future roles of the two technologies remain unclear, not least because they have different applications.
Feed-in tariffs have proved an effective instrument at spurring market development, but have also encountered considerable criticism. Some believe that there has been too much focus on market development, while technology development and cost reductions might have benefited more from technology push policies. As technology development rarely follows a straight line, and there are many different technologies within PV, a balance between technology push and market pull policies seems appropriate.
3.3 Case study: solar PV in the USA
Despite lagging behind the EU in solar PV installations, and East Asia in PV manufacturing, the USA plays an important role in solar technology development and innovation. The USA also maintains long-standing centres of solar PV research and development within the federal government (the US Department of Energy and national laboratories) as well as in the private sector (e.g. Silicon Valley). In 2009, US government spending on R&D for solar energy amounted to nearly USD 200 million, or approximately a quarter of global spending on solar R&D (IEA, 2010a). The USA

43
stockholm environment institute
is second only to Japan in the number of patents issued for solar PV technologies in the past 30 years (Haščič et al., 2010).
The USA also has solar resources that suggest the country could generate a proportion of its electric power through solar technology that is significantly higher than the current 0.4 per cent. One analysis, for example, charts a plan for the USA to generate up to two-thirds of its electricity needs from solar power (Zweibel et al., 2008). Solar insolation is highest in the south-west, where annual average solar PV resources can exceed 6.5 kWh/m2/day (NREL, 2011), a level only attainable in Europe in certain southern portions of Spain, Portugal and Italy (Šúri et al., 2007).
This case study describes and analyses the policies in place to support solar PV in the USA, the key risks and barriers to its wider deployment and the role of the USA in the global PV innovation system. For solar PV to be deployed on a large scale within the USA and globally, both demand- and supply-side policies and actions will be needed. We examine both in this case study.
3.3.1 Actors in the US solar PV innovation systemThe US Department of Energy (DOE) helps coordinate solar PV R&D activities, providing funding and coordinating stakeholders to develop technology ‘roadmaps’, which is described further in section 3.3.2. This section describes the companies that develop and manufacture solar technologies, the investors that help fund R&D, and the utilities that install solar PV systems or coordinate distributed, smaller scale solar systems. This discussion does not address other types of financing that may be used for other purposes, such as asset financing of utility-scale solar installations (UNEP and Bloomberg New Energy Finance, 2011).
Solar technology suppliers There has been dramatic growth in the manufacture of solar PV components in the USA and by US-based companies in recent years. First Solar and SunPower are the clear US market leaders. Several other larger companies have faced significant challenges in recent years and have been forced to close factories and/or move overseas. While only a few companies account for a significant share of the US market, there is a long tail comprised of many smaller and emerging actors, with dozens of such companies involved in PV module or systems design.9 These companies commonly seek niches or work to develop breakthrough technologies rather than try to compete with the US PV manufacturing giants. Start-ups are exploring a wide array of strategies, from repurposing or integrating existing technologies (e.g., converting a broader solar spectrum with tandem cells) to improving design and the balance of system (e.g. through building-integrated photovoltaics).
Table 3.9 lists the largest PV manufacturers based in the USA measured by dollar-value sales in 2010. US based First Solar was the world’s leading PV manufacturer by market share until 2010, when it was overtaken by Suntech of China (REN21, 2011).
9 http://www.eia.doe.gov/cneaf/solar.renewables/page/solarphotv/solarpv.html

44
driving technological innovation for a Low-Carbon society
Table 3.9: Largest US-based solar PV Manufacturers10 11 12
Company Headquarters Dominant Technology
Shipment, MW (2008)10
Sales, Millions USD (2010)11
Sales Growth (%) 2006-2010
R&D Budget, Millions, USD (2010)
First Solar Tempe, AZ Thin-film (CdTe) modules
440 USD 2,564 1800% USD 95
SunPower San Jose, CA Monocrystalline silicon cells and panels
220 USD 2,219 840% USD 49
Evergreen Solar12
Marlboro, MA String Ribbon (polycrystalline silicon) panels
N/A USD 339 230% USD 19
United Solar Ovonic
Auburn Hills, MI
Thin-film (Nano-Crystalline silicon) laminates
N/A USD 254 150% USD 11
Total of Above
>660 USD 5,376 832% USD 174
The solar industry has global supply chains and trade flows. For example, for the solar PV installations in the USA in 2009, about two-thirds of the modules by value were produced internationally. However, the ratio of domestic to international production varies significantly by system component. Taking account of all the steps needed to install a solar energy system, 71 per cent of the value was domestic (including site preparation and labour) (GTM, 2010).
The USA is a net exporter of solar PV technology. As is indicated in Table 3.10, total exports were USD 2.3 billion and net exports exceeded USD 700 million in 2009, while trade flows and partners vary according to country expertise and capabilities in the different PV value chain components. Of the total USD 2.3 billion in US solar PV exports, about 30 per cent went to Germany, 18 per cent to Japan and 12 per cent to China (GTM, 2010). Strong competition exists from low cost regions such as China and Taiwan, however, which puts continual pressure on US-based manufacturing facilities (SEIA, 2010).
A few ‘innovation hubs’ for solar PV have emerged in the USA, the most prominent being Silicon Valley, California, which grew as entrepreneurs and investors in the Bay Area sought new start-up opportunities following the dot-com boom. This region is well situated as a centre for PV technology innovation due to a confluence of favourable factors: history of technological entrepreneurship and as a base for venture capital, business and legal resources; as well as its proven success in industries applicable to
10 Per (US DOE 2010)
11 Per company income statements available on Morningstar.com unless otherwise noted.
12 http://www.greentechmedia.com/articles/read/evergreen-solar-and-the-politics-of-failure/.

45
stockholm environment institute
PV, such as semiconductors and computers, and California’s progressive legislation pertaining to energy and the environment (Colatat et al., 2009).
National trade associations, such as the Solar Energy Industries Association (SEIA), also play important roles in mainstreaming solar energy in the USA. The SEIA includes a variety of actors in the solar industry, such as manufacturers, distributors, installers and project developers, and strives to affect federal policy to remove market barriers and encourage solar deployment. The SEIA also develops outreach programmes to improve public knowledge and the perception of solar energy.
Venture capital and other investorsVenture capital investors typically fund activities at the beginning of the pipeline: developing, testing and piloting new devices and concepts. Venture capital funding is often closely associated with government R&D investment, either as matching funding (often a requirement of US DOE competitive procurements) or following closely thereafter (NREL, 2008).13 In the USA, venture capital and private equity investments in solar technologies totalled USD 2.3 billion in 2008. While it is difficult to estimate what fraction of total venture funding was for R&D (as opposed to capacity expansion or other investments), one contact at the DOE estimated that venture funding in R&D was at least 10 per cent of this total.14 Furthermore, just as the USA is dominant in government R&D funding for solar PV, it is also dominant in venture and private equity investment in solar PV (UNEP and Bloomberg New Energy Finance, 2011). In contrast to other world regions, US solar investment is highly diversified across technology types – albeit with a particular predominance
13 This was confirmed by Robert Margolis of NREL, April 2011, personal communication.
14 Robert Margolis, NREL, personal communication April 2011.
Product Imports ExportsNet
Exports
Value Top Origins ValueTop Destinations
Polysilicon USD 84 Germany, Japan
USD 1,139 Japan, China USD 1,055
Modules USD 1,242 China, Mexico
USD 1,010 Germany, Canada
-USD 232
Cells USD 119 Taiwan, Germany
USD 115 Germany, Sweden
-USD 4
Wafers USD 13 Taiwan, China
USD 37 Germany, Japan
USD 24
Inverters USD 134 Germany USD 13 Canada -USD 121
Total of Above
USD 1,592 USD 2,314 USD 722
Table 3.10: USA solar PV Trade Flows, 2009, Million USD (gtm 2010)

46
driving technological innovation for a Low-Carbon society
in thin-film PV (USD 1.11 billion in the USA, of USD 1.52 billion globally). Venture capital is predominant in the USA and tends to be associated with long-term innovative technologies, in contrast to private equity which is predominant in Europe and is more commonly associated with capacity expansions (UNEP and Bloomberg New Energy Finance, 2011; US DOE, 2010a).
UtilitiesUtilities are key players in installing solar PV. In some cases, utilities construct their own ‘utility-scale’ PV installations,15 although there is an increasing trend in utility construction and ownership of distributed PV resources on residential or commercial sites. In other cases, utilities procure solar generation via power purchase agreements or sometimes leases. Thus, utility scale is not necessarily the same as utility ownership.
The absence of policies and incentives means that it is often prohibitively expensive for utilities to include significant amounts of PV in their electricity generation portfolio. Interviewees stated that renewable portfolio standards (RPS), particularly with solar set-asides, are the primary drivers of utility solar PV in the USA and that these have been assisted by other policies such as US DOE loan guarantees and the 30 per cent investor tax credit (ITC), which was made available to utilities in 2008 by the Energy Improvement and Extension Act of 2008. However, investor-owned utilities have less flexibility to implement the ITC than independent power producers, due to rules on how utilities must share the tax benefits of the ITC with rate-paying customers over the life of the asset instead of capturing all the benefits up front – an outcome which can make investor-owned utilities less competitive than independent power producers (Alvarez and Hodges, 2009). Nonetheless, one prominent utility interviewed reported that this aspect of the ITC, known as normalization, is less of a barrier than a ‘nuisance’, suggesting that it may have relatively little negative impact on the effect on incentivising solar PV development. The largest purchasers of PV-generated electricity are listed in Table 3.11.
Some utilities interviewed noted that the cost of solar PV is the biggest barrier to investment. Utilities and state regulators alike can be averse to such costs. For example, in a recent case in New Mexico, a regulated utility’s plan to develop and contract PV installations was denied by the state’s regulation commission, as it was considered too ambitious and too costly.16 Other significant barriers are the availability of financing (currently supplemented by the DOE Loan Guarantee programme) and contentious issues around the location of utility-scale plants, including issues linked to both private and federal land (Glennon, 2011; SEIA, 2010).
15 We are not aware of an accepted size threshold for defining ‘utility-scale’ installations. The SEIA classifies utility installations as those over 100 kW ‘on the utility side of the meter with a utility or wholesale power purchaser’ (SEIA 2010).
16 http://www.fortnightly.com/display_blog.cfm?blog=blog.fortnightly.com/2010/09/29/new-mexico-orders-pnm-to-scale-back-solar-plans/

47
stockholm environment institute
Table 3.11: Largest US purchasers of solar PV-generated electricity17 18 19
(Companies in italics are 3C companies)
Electricity purchaser
Purchaser headquarters
US utility-scale solar PV capacity as of early 2011 (MW)17
Number of installations
Areas of current PV installations
Technology type
Pacific Gas & Electric (PG&E)
San Francisco, CA
72 4 Mendota & Vacaville, CA; Clark County & Boulder City, NV
PV & Thin-film PV
Florida Power & Light Co. (FPL)
Juno Beach, FL 35 2 Arcadia & Kennedy Space Center, FL
PV
Tri-State Generation and Transmission Association, Inc.
Westminster, CO 30 1 Cimarron, NM Thin-film PV
Southern California Edison (SCE)
Rosemead, CA 21 1 Blythe, CA Thin-film PV
Duke Energy Charlotte, NC 17 1 Davidson County, NC
PV
CPS Energy San Antonio, TX 16 1 San Antonio, TX PV
Jacksonville Electric Authority (JEA)
Jacksonville, FL 15 1 Jacksonville, FL PV
Nellis Air Force Base
North Las Vegas, NV
14 1 Clark County, NV
PV
All Other18 various 57 14 Various PV & Thin-film PV
Total 27719
Interviewees reported that, thus far, instead of investing in utility-owned installations, utilities have primarily met their obligations under state RPS through power purchase agreements (PPAs), which help utilities manage costs and risk, avoid or limit capital costs, fix purchase prices for 20 to 25 years, avoid operation and maintenance responsibilities (Cory et al., 2008) and take advantage of the benefits of the ITC through a third-party owner. In addition, other taxes affecting PPAs – insurance, and property
17 Capacity of utility-scale PV projects in operation from ‘Utility-Scale Solar Projects in the United States: Operational, Under Construction, and Under Development.’ Updated Febrary 8, 2011. http://www.seia.org/galleries/pdf/Major%20Solar%20Projects.pdf
18 Companies comprising the top 80% of capacity are listed individually, with remaining capacity com-bined into ‘All Other’ electricity purchasers.
19 This figure by the SEIA is lower than the approximately 900 MW cited for the USA by the IEA (2011). It is possible that the IEA figure includes plants still under construction or under development, whereas the total here includes only those in operation as of February 2011.

48
driving technological innovation for a Low-Carbon society
and sales taxes, for instance, are waived by some states. For example, California waives property taxes for PV (Cory et al., 2008). Nevertheless, while not always the least cost option for electricity customers, some utilities choose to include some owned capacity in their PV portfolio in order to avoid complete reliance on third parties in meeting their RPS. One assessment predicts an increased trend for utility ownership of solar PV installations given that since 2008 utilities have been eligible for the ITC (Bolinger, 2009). This trend that has so far been manifested primarily through utility ownership of distributed, that is, customer-located PV resources (Wiser et al., 2010).
Utilities have invested relatively little in solar R&D themselves but when they do, interviewees report that they tend to focus on storage, reliability and demand response. Utilities are interested in these demand-side issues as they are concerned about being able to provide a reliable source of electricity, particularly as intermittent technologies such as solar and wind scale up.
3.3.2 Policies in the US solar PV innovation system
Market pull policiesCompared with the EU and its member states, the US federal government has a far less comprehensive and less ambitious national energy policy, particularly with respect to market pull strategies for renewable energy. For example, while the EU has a target of 20 per cent renewable energy by 2020, investing heavily through feed-in tariff policies, the US federal government’s involvement in the demand side of renewable energy, and solar energy in particular, has largely been limited to financial incentives such as federal loan guarantees and tax credits. Nevertheless, installed solar PV capacity is expected to increase in the coming years (Figure 3.10). As is discussed below, recent PV investment in the USA has been stimulated by a combination of federal tax and financial incentives as well as more comprehensive, state-level renewable energy standards and specific provisions designed to support solar power generation in particular.
There are two landmark federal policies in terms of supporting solar PV from the demand side (US DOE, 2011a; Jäger-Waldau, 2010; WRI, 2010):
• The Energy Policy Act (EPAct) of 2005 established the ITC for commercial and investor-owned utility installations at a rate of 30 per cent of the cost of the solar systems. The ITC is the most significant policy in place in the USA as of mid-2011 and, due to extensions implemented since 2005, it is currently authorised to 2016. The Energy Policy Act also established a loan programme for government, municipal utilities and rural electricity cooperatives financed by ‘Clean Renewable Energy Bonds’ (CREBs). The Act also expanded the longstanding production tax credit (PTC) of about USD 0.02/kWh, which had previously applied only to other renewables, to include solar power for a period of one year.
• The American Recovery and Reinvestment Act (ARRA) of 2009, an economic stimulus bill which allows ITC-eligible projects to take a Department of

49
stockholm environment institute
Treasury grant instead of the ITC, as the reduced or zero tax burdens of many companies since the recession reduce the effectiveness of tax credits. The ARRA also expands the funding available for federal loans financed by CREBs, among other provisions, and provides a substantial boost for solar R&D activities, as is discussed below.20
The USA has not seriously considered the national or widespread use of feed-in tariffs, which are used widely in Europe. Instead, national policy conversations and existing state-level policies to date most often focus on RPS, which require a certain percentage of electricity utilities’ power capacity or generation to be from renewable sources. The US Congress has debated implementing a national RPS several times. For example, the American Clean Energy and Security Act, passed in the US House of Representatives in 2009, included a 20 per cent RPS (Larsen et al., 2009), but that legislation did not advance in the Senate, which is required for a bill to become law. More recently, President Obama called in his 2011 State of the Union address for 80 per cent of the nation’s electricity to come from ‘clean’ energy technologies by 2035, and Congress has been debating a national ‘clean energy standard’ to support this goal (Kennedy et al., 2011). A clean energy standard is like an RPS but with a potentially broader definition of power sources that could qualify, such as more efficient coal-fired power.
Given the lack of a comprehensive national energy policy, much of the activity on ‘market pull’ policies for solar energy, including implementation of RPS, has occurred at the state level. In particular, more than half of states have implemented an RPS, representing over half of retail electricity sales (Wiser et al., 2010). While many RPS are designed to be technology neutral, more than 12 state-level RPS in the USA include specific support for solar PV, whereby there is either a specific requirement for a fraction of the RPS to be solar (i.e. a solar PV ‘set-aside’ or ‘carve-out’) or that solar generation or capacity is awarded an extra multiplier for determining compliance. The US DOE forecasts that under current policies (including RPS) installations of solar PV in the USA will rise to 9.1 GW in 2020, or over 250 per cent of 2011 levels (US EIA, 2011).
20 The act also instituted another type of ‘supply push’ measure: a manufacturing investment tax credit (which expired at the end of 2010) for manufacturers investing in new or expanded production facilities or renewable technologies, including solar PV.
0
20
40
60
80
100
2000 2005 2010 2015 2020 2025 2030 2035
Insta
lled
PV
cap
acit
y (
GW
)
Figure 3.10: Actual growth in installed capacity, US (2001-2010), and future growth according to the IEA Blue Map Scenario

50
driving technological innovation for a Low-Carbon society
Historically in the USA, over half of all installations have been non-residential (i.e. commercial, public sector or non-profit projects), but the residential and utility installations are now the fastest-growing segment of the market and each now contributes more than 25 per cent (SEIA, 2010). Utility installations, in particular, have seen substantial growth, with the number of annual installations tripling in each of the past two years (SEIA, 2010)21, where the installed utility scale solar PV capacity largely varies between the different states (Figure 3.11).
Figure 3.11: Utility scale installations by state in the USA data source: us doe (2011b)
US
uti
lity
-scale
PV
gen
era
tio
n b
y s
tate
(G
Wh
)
0
20
40
60
80
100
120
140
160
CA NV FL NJ OH IL AZ NC PA NM
PV MWh
These sectors have benefited from a range of policies, including tax incentives and RPS, the impacts of which are discussed in greater detail in the summary assessment below.
Several US states have been particular leaders. For example, California, the state with the highest PV capacity, has implemented a suite of financial incentives and regulatory standards, including a feed-in tariff for small-scale solar systems; an RPS, although it does not include a solar set-aside; the Million Solar Roofs Plan, expected to create one million solar roofs including at least 3 GW of installed PV capacity by 2018; and the California Solar Initiative, which offers rebates on PV systems to investor-owned and municipal utilities (Jäger-Waldau, 2010; US DOE, 2011a). New Jersey, the state with the second-highest PV capacity (Figure 3.12), has considerably less solar insolation but has benefited from a long-standing net metering policy that has no firm limit on the aggregate capacity of connected systems, exemplary interconnection standards and a suite of financial incentives that includes a rebate programme and a sales tax exemption (US DOE, 2011a).
Table 3.12 summarises the variety of incentives and regulations that support the deployment of solar PV in the USA, including a summary of state-level policies.
21 The SEIA defines utility PV projects as those over 100 kW ‘on the utility side of the meter with a utility or wholesale power purchaser’.

51
stockholm environment institute
Technology push policiesTechnology push policies and initiatives can take a number of forms, including R&D funding, loans, public-private research partnerships and tax incentives to incentivise manufacturing capacity. The US government makes significant investments in solar R&D, relative to other countries. In fact, the IEA has stated that the USA is ‘by far’ the largest investor in solar R&D (IEA, 2010b).
Since the oil shocks of the mid-1970s, the US DOE has funded energy R&D to help the country diversify its energy portfolio, deploy advanced technologies and meet future energy needs. The US DOE uses its budget allocation to fund research with both private companies (usually through competitive procurements) and the national laboratories. The US DOE’s budget for solar energy R&D was highest in the late 1970s (USD 6.9 billion in 1978),22 but declined dramatically during the Reagan administration to less than USD 3 billion where it remained until the Obama administration. In 2010, the US DOE allocated USD 3.3 billion to energy R&D. R&D in solar power has roughly mirrored this overall trend. Figure 3.13 shows US DOE funding for solar energy R&D since 1978.23
22 In 2005 dollars.
23 Solar includes biofuels, wind, and ocean until 1998.
Figure 3.12: Installed capacity in different US states source: http://openpv.nrel.gov/rankings
0
50
100
150
200
NJ PA FL AZ NV MA CO CT DE HI MD TX NY WI VT
Cap
acit
y (
MW
)
CA
1100
1150

52
driving technological innovation for a Low-Carbon society
Incentive/ policy
DescriptionScope and examples of state and local policies
Major federal policies enacted or proposed
Financial incentives
Cash payments
Direct cash payments for power provided or for installation of solar equipment. Includes feed-in tariffs, Renewable Energy Credit (REC) purchase programmes, equipment cost-share (e.g., rebates, grants).
Scope: 28 states and Washington, DC, 150 utilitiesExamples: rebates offered under California Solar Initiative, California’s feed-in tariff, rebates under Massachusetts Commonwealth Solar program; Gainesville (FL) Regional Utilities feed-in tariff
The US Congress has debated a national feed-in tariff (e.g., H.R. 5883 in the 111th Congress) but little momentum at present
Tax incentives
Reduction in business, income, sales or property taxes to support solar purchase, installation and generation
Scope: 30 states Examples: Oregon business 50% tax credit; Arizona property tax exemption and assessment
Existing federal investment tax credit (ITC) equal to 30% of expenditure on solar PV equipment with no maximum limit until 2016; utilities are eligibleExisting accelerated depreciation allows solar systems to be deducted on taxes over five years
Loan programmes
Government loans or loan guarantees for initial costs
Scope: 31 states Examples: New York Energy Smart Loan Fund; Orlando Utilities Commission low-interest loans
Existing loan guarantees via US DOE (no longer being offered) or USDA (for rural development)
Regulatory instruments
Renewable Portfolio Standards (RPS) and solar set-asides and credit multipliers
An RPS requires a certain percentage of electricity utilities’ power capacity or generation to be renewable. A solar set-aside requires so much of that power to be solar, whereas a multiplier gives extra weight to solar in meeting the RPS target.
Scope: RPS: 36 states plus Washington, DC; Solar provisions: 16 states plus Washington, DCExamples: Illinois (1.5% PV by 2025); Texas (double credit and 500 MW from non-wind by 2015)
In 2011, Congress is exploring the design of a national Clean Energy Standard (CES), similar to an RPS24
Congress debated several bills proposed in the 111th Congress25
Net metering
Allows customers that generate their own solar electricity to bank excess on the grid with kWh credits
Scope: 43 states plus Washington, DCExamples: Colorado net metering policy; New Jersey net metering policy
In 2011, the US House of Representatives introduced the Solar Opportunity and Local Access Rights Act (H.R. 1598) which addresses residential PV installations and generation
Table 3.12: Overview of PV Incentives and Policies (us doe 2011a)
24 25
24 In line with President Obama’s proposal during the State of the Union address to institute a CES requiring 80% of US electricity to be sourced from clean energy technologies by 2035, Senators Bingaman and Murkowski have produced a white paper exploring key questions and soliciting input on CES design. See: http://energy.senate.gov/public/_files/CESWhitePaper.pdf
25 Bills including provisions for RPS that were proposed in the 111th Congress include the American Clean Energy and Security Act (H.R. 2454, which was passed in the House but died in the Senate), Ameri-can Clean Energy Leadership Act of 2009 (S. 1462), Renewable Electricity Promotion Act of 2010 (S.3813), Practical Energy and Climate Plan Act (S.3464), and Clean Energy Standard Act of 2010 (S.20). For a comparison of the proposals, see Pew Climate (2011).

53
stockholm environment institute
1200
1000
800
600
400
200
0
2009 ARRA
Annual R&D
Bu
dg
et
(millio
ns U
SD
)
1978 1982 1986 1990 1994 1998 2002 2006 2010
Fiscal year
Figure 3.13: US DOE Budget Authority for Solar Energy R&D(gallagher and Anadon 2011)
The US DOE helps foster solar PV innovation through a variety of research projects and funding opportunities, most of which are coordinated by the DOE’s Solar Energy Technologies Program (SETP) and National Renewable Energy Lab (NREL). The DOE cites national energy security, economic development, climate mitigation and air quality as the rationales for pursuing solar energy. With input from laboratories, industry and universities, the DOE produces a series of PV Technology Roadmaps to help determine how best to guide R&D, allocate funding and assess progress. For several PV technologies, the DOE defines metrics to determine the technology’s status and potential, and maps an R&D strategy for closing any gap. The DOE uses these roadmaps to guide funding as part of its multi-year planning process, which sets benchmarks and milestones for PV. Interviews confirmed the central and trusted role of the DOE in setting the R&D agenda for solar PV in the USA.
The SETP’s efforts on developing and scaling up PV technologies in the USA focus on three areas:
• New devices. The focus on new devices includes the Next Generation PV project and the PV Technology Pre-Incubator, which works with prototypes.
• Pilot projects. The focus on pilot projects and demonstrability involves the Photovoltaic Technology Incubator project, which takes the Pre-Incubator to the next step, moving prototypes to pilots and full-scale production. Between 2007 and 2011, 31 awards were made to companies, over half of which are located in Silicon Valley, California.26
• Systems development and manufacturing. The focus on systems development and manufacturing deals with mass production and competitive costs, including the Advanced Manufacturing Partnerships, Technology Pathway Partnerships,
26 http://www1.eere.energy.gov/solar/pv_incubator.html

54
driving technological innovation for a Low-Carbon society
University Photovoltaic Product and Process Development, and PV Supply Chain and Cross-Cutting Technologies.
The DOE also houses the Advanced Research Projects Agency-Energy (ARPA-E), which focuses on transformational energy research on more risky ventures in which industry alone could not feasibly engage, including a project on an advanced manufacturing process for high-efficiency crystalline wafers and research into grid integration.
In addition to these established R&D programmes, the DOE is responsible for allocating one-off awards, such as those made as a result of economic stimulus funding established by the ARRA. The Act, which is intended to create jobs and promote investment during the recession, has channelled about USD 100 million in funding through the DOE for use in PV systems development and high-penetration solar deployment projects. Recipients have included national laboratories, manufacturers, utilities and cities.
The DOE has been consolidating its various solar efforts under the ‘SunShot’ initiative, which aims to reduce the cost of utility-scale solar PV27 systems by roughly 75 per cent by 2020 – to approximately USD 1 per watt installed including both the modules and all remaining necessary components. The premise behind this ambitious initiative is to make PV cost-competitive with fossil fuel-sourced electricity without targeted policies or incentives. To meet the SunShot goal, the DOE has allocated targets of USD 0.50/W for modules, USD 0.40/W for balance-of-system components, and USD 0.10/W for power electronics (US DOE, 2010b).
3.3.3 The US solar PV TIS: functionality, major barriers and driversThe overriding barrier to wider deployment of solar PV described by interviewees and in the literature is the high investment costs associated with the technology. A variety of other often-cited barriers relate to regulatory and administrative issues. Table 3.13 provides an overview of the functional pattern of the US solar PV innovation system and the most important drivers and barriers are elaborated below, including barriers and drivers linked to the role of the innovation system in the global context.
For the function entrepreneurial activity, it should be noted that the USA has a large number of emerging players in the field, and US companies pursue a range of technologies (US DOE, 2010a). The USA has played a central role in manufacturing, particularly of polysilicon (a 40 per cent global market share), the primary raw material for manufacturing crystalline PV wafers, although less so in manufacturing PV wafers themselves (a 3 per cent market share), cells (3 per cent) or modules (6 per cent) (GTM, 2010). The USA is also a significant player in thin-film manufacturing, due primarily to the facilities of First Solar, the world’s leading thin-film producer. The future role of the USA in manufacturing is unclear, however, in part because the supply chain
27 While the price reduction goal applies only to PV, the SunShot initiative also includes concentrating solar power (CSP).

55
stockholm environment institute
for PV components is highly globalised. The USA has been a net exporter of solar PV technologies, but recent factory closures and rising domestic demand mean this situation may not continue into the future. Three new factories are expected to open in 2011, however (SEIA, 2010), and given the lingering concern of US manufacturers over intellectual property rights and the potential for international knowledge spillover if new, proprietary technologies are manufactured overseas, there is likely to be a strong if not dominant role for US manufacturing for the foreseeable future. There is also an inherent conflict between broader free-market tendencies in the USA, which have generally supported manufacturing in lower-cost countries such as China, and resurgent protectionist interests, such as the US Department of Defense requirement for domestic PV.
In regard to knowledge development it is clear that the US government, companies, and investors play a central role globally in driving R&D in solar PV. This is evidenced,
Table 3.13: Functional pattern of the US PV TIS
Function Description
Entrepreneurial activity
The USA has a number of emerging players in the field. There were more than 200 solar start-ups in 2009. Furthermore, US investment is highly diversified, with companies pursuing a large range of technologies from wafer silicon to CIGS thin-films (US DOE 2010).
Knowledge development
Government R&D spending on solar technologies was about USD 200 million in 2010 (Gallagher and Anadon 2011). Venture capital investment is on a similar scale, as is R&D spending by established solar companies.
Knowledge diffusion
A bibliometric analysis of publications on PV in the USA suggests a close association between federal investment and knowledge production. California, with its high concentration of research laboratories and historical (space) solar research companies, has emerged as a locus of research, although recently significant national-level research has been concentrated at NREL in Colorado. One study suggests that direct collaboration between industry and the scientific community has declined in recent decades as the industry has matured and increasing competition has led to companies conducting their research privately in their own laboratories (Vidican, Woon and Madnick 2009).
Guidance The US DOE oversees a number of research programmes and projects. With multi-stakeholder collaboration, the DOE charts out PV Technology Roadmaps to guide R&D and has published a White Paper on reaching its ‘Sunshot’ goal of USD 1/watt installed cost (US DOE 2010). The cost reductions anticipated from the SunShot initiative and other R&D efforts may help demonstrate the growth potential of PV and continue to lure investors. Furthermore, a mix of state- and local-level regulations and policies serve to incentivise PV.
Market formation The US PV market is mature and internationally connected, accounting for USD 2.3 billion in exports and USD 1.6 billion in imports in 2009 (GTM 2010). Utility-scale demand is encouraged using targeted policies (e.g., RPS), as is distributed generation.
Resource mobilization
The most significant concern expressed is over the availability of funding for R&D activities, particularly since the recent recession. Industry contacts generally report that there is an adequate pool of research talent, although there is competition with other high-tech industries. Some concern has been expressed over whether an adequate workforce of solar installers exists (Margolis and Zuboy 2006), although this is a topic of debate, and the DOE is working with the Department of Labor to support the development of a solar workforce.
Legitimisation The Solar Energy Industries Association (SEIA) reports that more than 9 in 10 Americans think it important for the nation to develop and use solar energy.
56
driving technological innovation for a Low-Carbon society
most prominently, by their global dominance of annual R&D spending on solar PV, as documented by several sources, including both international agencies (IEA, 2010a) and finance-oriented researchers (UNEP and Bloomberg New Energy Finance, 2011), as well as the high number of patents (second only to Japan) for solar PV issued to US inventors (Haščič et al., 2010).
However, some barriers can also be identified in relation to this function. Knowledge spillover – where intellectual property can be easily replicated by others – can lead to concerns about reaping the benefits of R&D investment. Interviewees acknowledged that concern over knowledge spillover can be a disincentive for PV manufacturers to develop breakthrough technologies. Thus, many innovative ideas originate instead in universities and laboratories. One PV manufacturer interviewed explained that a tactic to manage intellectual property infringement and reverse engineering is to expand production overseas of only the older technologies, while retaining the most cutting-edge developments domestically.
The US solar PV market is mature and internationally connected. Still, the USA has not so far been a significant hub of demand globally, due in part to the lack of a comprehensive national renewable electricity policy, although a surge in demand in recent years has led to increased global attention on the USA as a source of demand, at least in the near future.
A number of regulatory and administrative factors further hinder the widespread deployment of solar PV in the USA. As is mentioned above, location issues on private and federal land present challenges when building utility-scale PV plants (Glennon, 2011). Interviewees and the literature highlight that difficult zoning and permitting procedures, complex access laws and inadequate building codes complicate smaller-scale PV (Margolis and Zuboy, 2006; IPCC, 2011). Further complications include inconsistent interconnection standards (Margolis and Zuboy, 2006) and the lack of time-variable utility rate structures to capture the benefits of electricity generated from distributed PV (IPCC, 2011).
Securing project financing is another significant barrier, particularly for developing technologies in markets characterised by short-term planning (IPCC, 2011). To date, solar PV installations have required substantial investment that, even though operational and maintenance costs are low, make the cost of solar power higher than that of the fossil-based electricity generation it would be replacing. As solar PV installations have scaled up in the past decade, with the help of federal and state incentives, the costs have come down. Efficiency improvements to existing technologies, the development of second- and third-generation PV, and cost reductions in “balance of system” (BoS) and power electronics are lowering the price of solar PV. This situation is expected to continue to the point at which grid-parity (where solar electricity costs the same as grid power) could be achieved in some areas of the USA by 2015 and in roughly half the country by 2020 (Breyer et al., 2009). However, grid parity is only one of the many factors that will dictate how fast the installation of solar PV technologies proceeds. To overcome the additional risks – some of which are described below – the cost of

57
stockholm environment institute
solar power may need to be comfortably below fossil-based power in order to upscale rapidly (Kann, 2011).
The most significant area of concern is linked to resource mobilisation. In addition to the substantial investment costs connected to solar PV installations as mentioned above, funding for R&D activities is also regarded as insufficient, particularly since the recent recession. Solar PV research and development is financed by both public research grants and private capital. Solar energy has the largest share of worldwide spending on R&D on renewable energy, up by 8 per cent from 2009 to 2010 when global R&D on solar totalled USD 3.6 billion. However, while public sector R&D more than doubled between 2009 and 2010, corporate spending fell by 19 per cent, which may be linked to private investment shifting from R&D to new production capacity. Yet, corporate R&D in the solar sector in 2010 was four times larger than that on wind power R&D, which is the second largest renewable energy technology when it comes to corporate R&D funding (UNEP and Bloomberg New Energy Finance, 2011).
Historically, R&D investment to reduce costs in new and improved technologies – both modules and BoS components – has been limited by the inability of investors to capture the larger societal benefits of solar PV technology. Since many of these benefits, which far exceed the monetary benefits of selling solar PV panels, accrue to wider society. The technology and renewable energy more broadly are often cited as an example of a market failure (Margolis and Kammen, 1999). A strong case can therefore be made for public support for R&D to overcome this market failure (Foxon and Pearson, 2008). Public research and policy interventions also help to address the hesitancy of the private sector to invest in new, risky technologies with uncertain markets (IPCC, 2011).
Lack of transmission lines is another key barrier, particularly for large-scale PV systems located far from electric load centres (IPCC, 2011). States with renewable portfolio standards in place have recognised the lack of investment in transmission as a critical barrier to meeting their RPS targets (Wiser and Barbose, 2008). This situation is exacerbated by the fact that the federal government has limited authority and influence over the interstate electricity transmission infrastructure, with most authority residing with the states (Vann, 2010).
One ambitious scenario for the USA, ‘A Solar Grand Plan’, outlines the widespread deployment of PV and concentrated solar plants (about 84 GW built by 2020) concentrated in the south-western USA. However, such large-scale deployment focused on the solar resource-rich region would necessitate building new high voltage direct current (HVDC) transmission lines to transport energy long distances while minimizing transmission losses (Zweibel et al., 2008).
Storage is also an issue, as there is often a disconnect between solar electricity generation during sunny hours and peak demand during periods of darkness or cold. Batteries can be either expensive or inefficient, but alternatives are being explored

58
driving technological innovation for a Low-Carbon society
such as compressed air energy storage (Zweibel et al., 2008). The DOE’s Solar Energy Technologies Program emphasises the need to improve storage for PV technologies.
3.3.4 Assessment of US policiesAn interesting feature of PV-related policy in the USA is the different levels of government concentrating on distinct strategies for increased deployment. Technology-push (e.g. R&D) activities are highly centralised, with DOE funding and competitive tenders as the locus. On the other hand, it is the individual states, not the federal government, that are largely driving renewable energy policy.
As is discussed above, market pull policies promote renewable energy generally and solar PV technology in particular. These consist of a patchwork of regulatory and financial instruments. Federal tax incentives, state-level rebates and incentive programmes for renewable energy, voluntary green power markets and renewable portfolio standards have all helped drive growth in PV capacity in the USA (Wiser et al., 2010).
These strategies are not mutually exclusive, and it is difficult to measure the individual contribution of a particular policy. One recent study (Wiser et al., 2010) found that between 65 and 91 per cent of solar PV capacity growth outside California in 2005–2009 occurred in states with RPS set-asides for solar or distributed generation. According to that study this finding ‘suggests that these policies have played a key role in accelerating solar deployment in the US’. Unfortunately, few other studies have focused specifically on solar-set-asides in an RPS context. Other, broader assessments of state-level policy on renewables have found conflicting results on the role of key policies, including RPS, on renewable energy capacity and/or generation (Yin and Powers, 2010; Delmas and Montes-Sancho, 2011; Carley 2011b) while highlighting that other factors – including the social and political climate of the state (Delmas and Montes-Sancho, 2011) or its renewable energy potential (e.g. solar insolation) (Carley, 2009) – may play an equal or even bigger role than the RPS. Further research is needed, given the prominence of RPS with solar set-asides in the USA and the fact that the RPS is still a relatively new policy mechanism.
One trend that seems clear is the trend away from the use of credit multipliers in state-level RPS, wherein each unit of solar or other, generally higher-cost, technology counts as more than one unit for compliance with the RPS. Unlike a solar set-aside, credit multipliers do not provide certainty of solar generation or capacity and can actually reduce the overall level of renewables attained under an RPS, since less solar energy is brought online than is counted under the multiplier (Wiser et al., 2010). Then again, RPS instruments can only provide so much certainty. For example, only one-third of states met their RPS obligations in 2008. Insufficient funding levels and limits on costs for utilities can hinder achievement of set-aside targets for more expensive technologies such as PV (Wiser and Barbose, 2008). The impacts of solar and distributed generation set-asides on retail electricity tariffs are estimated to have reached 1 per cent in some states in 2009, with greater impacts in those with higher set-aside levels (Wiser et al., 2010). Using the force majeure mechanisms adopted

59
stockholm environment institute
by some states, electricity suppliers may limit their purchases of renewable energy if they can convince regulators that electricity prices would be unjustifiably raised as a result. Stricter enforcement mechanisms may be needed, however, if RPS are to be successful at creating new solar PV installations (Carley, 2009), and companion mechanisms may be needed to decrease fossil-based generation (and/or reduce demand through efficiency improvements) to enable solar PV to continue to increase its share of electricity supply (Carley, 2011b).
The US experience has also demonstrated that long-term contracts and political stability are important factors in a successful RPS (van der Linden et al., 2005). High transaction costs, project size thresholds and strict metering requirements can discourage participation by smaller scale PV projects under the RPS. Uncertainty over renewable energy certificate ownership for projects benefiting from cash incentives or net metering can also discourage RPS participation (Wiser et al., 2010).
In addition to state-level RPS, the other major category of policies that has played a major role in incentivising solar PV development is tax policy, particularly the federal Investment Tax Credit and the ability to depreciate investment in solar technology on an accelerated (e.g., five-year) basis. One criticism of these tax incentives is that they incentivise investment in capacity rather than actual renewable electricity generation, thus providing little incentive for solar PV efficiency. As a result, some key state markets (e.g. California and New Jersey) are said to be moving towards incentives (such as feed-in tariffs) that better incentivise generation and efficiency than ITC policies do (Bolinger, 2009). The ITC also provides only limited incentives for entities with little or no tax burden (whether due to economic conditions or tax-exempt status), particularly because the ITC must be taken as a lump-sum in the first year, providing a strong incentive for ownership structures in which a third-party institutional investor (with higher tax overhead) owns the project and can more easily capture the full tax benefits, and subsequently either leases the PV system or sells its electricity through a power purchase agreement (Bolinger et al., 2010). The federal government has recently attempted to address this problem for taxable investors by offering the option of taking the ITC as a grant instead of a credit against a tax bill, thereby allowing taxable entities to gain the full benefit during a time of low tax bills, which could otherwise be too small to absorb the full credit.
Some studies have shown that fiscal incentives – such as grants, rebates and tax policies – are most effective when used in combination with other policies. For example, in the USA feed-in tariffs and tax incentives such as the ITC are sometimes used in conjunction with RPS to provide added financial support (Rickerson et al., 2008; Carley 2011b). Another policy, net metering, has been widely implemented in most US states, but the remuneration is typically insufficient to promote the growth of less cost-competitive technologies such as PV, as the generation costs substantially exceed retail prices (Klein et al., 2010), and the size thresholds are often set too low (e.g. 10 kW or smaller) to affect decisions that commercial and industrial customers may make about whether to invest in their own solar PV systems and connect them to the grid (Carley, 2011b).

60
driving technological innovation for a Low-Carbon society
The supply- and demand-side financial and regulatory structures for solar PV in the USA largely support multiple technology pathways. On the supply side, government R&D awards are generally made through technology-neutral competitive tenders with performance-oriented criteria rather than prescriptive technology requirements. On the other hand, some interviewees report a particular, although by no means single-minded, focus on R&D for thin-film, perhaps due to its lower cost which is already close to meeting Sunshot’s USD 1/watt goal. On the demand side, the use of renewable portfolio standards provides an interesting example of differing degrees of technology preference. Historically, most state-level RPS have been neutral about the type of renewable technology, a situation which has led to wind power meeting the vast majority of RPS requirements due to its lower cost. Increasingly, however, set-asides for solar PV have been employed to help incentivise this technology which, although more costly at present, is expected to decrease with wider deployment.
As is noted in the EU case, it is difficult to assess developments in fundamental technology costs based on recent module and system prices. In general, reported module costs in the USA have been somewhat lower than the OECD average and installation costs marginally higher, although all costs have followed the overall global trend as shown in Figure 3.4.
3.3.5 Concluding remarks Solar PV energy can help address climate challenge and provide significant additional benefits, including improved air quality and energy security. However, as most analysts agree, the high investment costs have substantially limited wider deployment of solar PV in the USA and globally. In addition, non-economic barriers and administrative hurdles, such as planning delays and in receiving authorization for grid connection, as well as technical challenges, such as intermittency, further hinder development. These challenges mean that there has been a substantial need for government policy intervention to correct market failure.
Based on our research into the US solar technology innovation system, we find that:
• Government R&D investment has been central to the success of solar technologies. High costs, the long-lived nature of energy infrastructure, intermittency and other barriers have limited the broader deployment of solar PV. These barriers have created significant risk for investors and limit the willingness of venture and other private capital to fund R&D. Government investment in R&D has been necessary to enable a long-term perspective to be taken and drive down costs (Henderson and Newell, 2010). Several assessments have highlighted that government investment in solar energy R&D, along with energy-related R&D in general, is still far below levels observed in the 1970s, and still far below what is needed to make solar a cost-competitive greenhouse gas emissions mitigation technology globally (IPCC, 2011; IEA, 2010a; Weiss and Bonvillian, 2009; Nemet and Kammen, 2007). More specifically, a recent IEA report estimates that global investment in solar R&D must increase from an estimated USD 680 million per year today to as much as USD 3.5 billion

61
stockholm environment institute
annually for solar power to play even a supporting role in the IEA’s global ‘Blue Map’ scenario, which aims to halve emissions by 2050 compared to 2005 levels, consistent with the goal of stabilizing the concentration of CO2 in the atmosphere at 450 ppm (IEA, 2010a; IEA, 2010c). The American Energy Innovation Council recommends investment in renewables of USD 2.4 billion annually in the USA alone, a significant portion of which would be devoted to solar power (American Energy Innovation Council, 2010).
• The US probably invests more (in dollar terms) in solar R&D than any other country, and is a significant driver of global solar innovation. Government investment in solar R&D in the USA is led by the DOE, and each dollar of government investment is matched by at least one dollar of private-sector matching funds. Altogether, annual investment in solar PV R&D in the USA is over USD 500 million. The combination of significant government investment with a highly active base of venture capital and private equity has helped the USA become a world leader in R&D activities.
• Demand for solar PV in the USA is influenced by a patchwork of state-level policies with no nationally coordinated energy strategy. State-level policies and trends underlie most of the demand for solar PV in the USA, a market which is still very small by global standards and far behind the global leader, the much smaller Germany. So far, with only limited national energy policy and no national climate policy, investing in solar PV has often been too risky to justify the high investment cost. While this situation is starting to change and solar PV is projected to achieve grid-parity in some areas of the USA by the middle of this decade, barriers remain and the recent rise in installations (especially utility-scale) may be short-lived without a longer-term strategy, as cost and siting barriers continue to constrain the industry, even in states with RPS policies with solar set-asides and vast sun resources (e.g. New Mexico). Interviewees report that a more unified national system would be of tremendous benefit, by overcoming the mismatched, patchwork array of state-level policies that, in some cases, probably have little effect. Research, too, has shown that a patchwork of state-level policies is much less likely than a national policy to bring about significant GHG emissions mitigation, in part because in many cases state-level RPS policies encourage emissions leakage through the continued or even expanded production of fossil-fuel based electricity generation in one state for export to neighbouring states (Carley, 2011a). A national policy for solar PV and other renewables would, in addition to avoiding leakage, also create the uniformity and predictability desired by utilities, investors and project developers, as well as virtually all other actors in the US solar PV innovation system (Carley, 2011b). Two recent high-level initiatives in the country have pushed for a national long-term energy strategy (PCAST, 2010; American Energy Innovation Council, 2010) and could be sources of momentum, as could the current discussions in the US Congress on a national clean energy standard (similar to an RPS), even though congressional staff acknowledge that the current discussions are unlikely to result in legislation in the short term.

62
driving technological innovation for a Low-Carbon society
• Additional, non-cost barriers remain to widespread adoption of solar PV in the USA Apart from costs, additional challenges include the siting of both utility-scale and smaller-scale distributed systems, inconsistent interconnection standards, financing, storage and need for transmission infrastructure.
The above discussion highlights our key findings on the US PV innovation system. Other researchers have proposed specific criteria for assessing such systems. For additional details on these criteria and a preliminary assessment of the US solar industry against these criteria, see Table 3.13.
Our case study demonstrates that the USA is likely to continue its central role in global solar PV innovation. Expanded efforts may be needed, however, as many have argued that a long-term national energy innovation framework and funding beyond the current push offered by the ‘Sunshot’ initiative will be needed to sustain the technology’s growth and ability to contribute to global climate mitigation. Furthermore, the USA has so far contributed relatively little to global demand for solar PV. Despite a surge in recent installations (900 MW installed in 2010 alone) and its vast solar resources – a large portion of the country’s south-west exceeds 6.5 kWh/m2/day – it remains to be seen whether, in the current contentious political climate, growth in US solar PV installations can keep pace with the surge in global demand.
3.4 Short case study: PV in China
ProductionChina today is the world’s largest solar photovoltaic manufacturer.28 Chinese solar PV manufacturing capacity doubled between 2009 and 2010 – to over 8GW or 53 per cent of global capacity. Tens of Chinese PV companies are listed on the stock market either in China or overseas. The turnover of China’s PV industry exceeds RMB 300 billion, and the workforce has reached 300,000 (SEMI, 2011). In 2006, the top 10 solar cell manufacturers in the world included only one (Suntech Power) from China (Li et al., 2007). By 2010, Suntech had overtaken First Solar to become the world’s single largest solar cell manufacturer and more than half the top ten PV companies were Chinese. Table 3.14 lists the top 10 Chinese solar PV companies in 2009.
The Chinese PV industry is the world’s largest, but this development is very recent. Until the late 1990s, the Chinese PV industry had extremely limited production capacity, using out-of-date technology on a small scale (Zhu, 2004). It was constrained by bottlenecks in equipment, resources and knowledge, and unable to deliver high quality products at competitive prices (Dai et al., 1999). Largely driven by strong demand in the European market, the PV industry in China has undergone transformative change since 2004, including a more than 100 per cent annual growth rate. More than 95 per cent of its products were exported before 2008.
28 Measured in solar cells, China has been the world largest solar module producer since 2009.

63
stockholm environment institute
Research and developmentThe main area of competitiveness underlying China’s rapid expansion of solar PV manufacturing has been its cheap labour and low production costs. To a great extent, China lacks both core technologies and raw materials, which means that it faces what have been called ‘both-ends-out’ constraints on upgrading its role in the production value chain. Taking the supply of polysilicon as an example, in 2010 only 50 per cent of its polysilicon was supplied from local sources. This leads to competition for polysilicon and keeps its price high. According to statistics from Chinese Customs, China imported 22,727 tonnes in 2009 and 47,549 tonnes in 2010.
Increasing international and domestic competition, rising labour costs in China and a policy environment that stimulates clean energy development have been strong drivers of solar PV R&D in China in the past decade. Significant progress has been made. Based on a survey of selected Chinese solar PV manufactures in 2005 and using a ‘technological capability’ framework, Marigo et al., (2010) explored the innovation capacities and performance of Chinese solar PV manufacturers. They concluded that, by 2005, solar PV companies in China had progressed well beyond basic operational capabilities and were quickly moving away from being mere users of imported PV components (Marigo et al., 2010). On the other hand, they also pointed out that learning had largely taken place around ‘know-how’ in the most mature PV technologies, and that innovation capacity remained very limited.
Since 2006, the government has made a radical move to extend financial support to solar PV R&D and projects, indicating a strategic shift from a reliance on foreign technologies to independent research (Yang and Pan, 2010). Many local equipment makers and raw material suppliers are also taking action to enhance R&D. China invested USD 30 billion in clean technology in 2009, more than any other nation in the world. As a result, China’s PV industry has moved into a fast ramp phase. Many
Table 3.14: Top 10 solar PV companies in China in 2009
Name No.Staff MWp Sold /2009
Panel Technology
Suntech Power 12000 675.1 Monocrystalline, Polycrystalline
Yingli Green Energy 6000 525.3 Monocrystalline, Polycrystalline
Trina Solar 7900 425 Monocrystalline, Polycrystalline
Solarfun Power 5310 342.8 Monocrystalline, Polycrystalline
Canadian Solar 7000 325.5 Monocrystalline, Polycrystalline
Eging Photovoltaic 2100 250 Monocrystalline, Polycrystalline
Jiangsu Aide Solar Energy 1000 200 Monocrystalline, Polycrystalline
ET Solar 2000 150 Monocrystalline, Polycrystalline
Jiawei Solarchina 1350 150 Monocrystalline, Polycrystalline
Zhaokun Solar Energy 250 150 Monocrystalline, Polycrystalline

64
driving technological innovation for a Low-Carbon society
key technologies in cell manufacturing, such as silicon purification, have been fully adopted by local companies. With manufacturing capacity rapidly expanding, full supply chains being developed and cost reductions being achieved, it is expected that the encouragement of R&D and a breakthrough in key technologies will change development and competition patterns in China’s PV industry (SEMI, 2011).
Market development and key policiesThe deployment of solar PV still lags behind solar thermal heating in China (Marigo et al., 2010). Before 2002, China’s domestic PV installation was basically non-existent with accumulated installation of less than 45 MWp; and its limited applications were mainly to rural electrification or for communications and industrial purposes, as well as for road signs and lighting (Li et al., 2007).
In 2002, China initiated a national Township Electrification Programme (Song Dian Dao Xiang), aimed at resolving power supply problems by using PV and small-scale wind electricity generation in more than 700 townships in seven western provinces. By the end of 2003, the cumulative installed capacity of solar PV had reached 55 MW (Li et al., 2007). The solar PV market in China saw slow and steady growth between 2003 and 2008, but exponential expansion in the two years to 2010 (see Figure 3.14).
For the application of solar PV in China, 2009 was a turning point. China announced a series of plans and subsidies intended to support the development of the Chinese solar power industry, including open bidding for solar power plant licences, the Solar Rooftop Plan and the Golden Sun Demonstration Programme. These activities aimed to develop large-scale solar power plants and urban rooftop solar power systems. One major reason behind the market development initiatives was to address the overcapacity in the Chinese PV industry resulting from the financial crisis and the economic recession in 2008.
In March 2009, the Ministry of Finance, together with the Ministry of Urban and Rural Development, introduced a national PV subsidy programme to promote the use of building-integrated PV (BIPV) applications and rooftop systems. In July 2009, the Ministry of Finance, together with the Ministry of Science and Technology, and the National Energy Administration of the National Development and Reform Commission, established a second national PV subsidy programme – the Golden Sun Demonstration Programme – which was designed to subsidize 600MW of PV demonstration projects in the following two to three years. The Golden Sun programme provides capital subsidies for solar PV installations on a project-by-project basis. Off-grid (stand-alone) installations receive 70 per cent capital subsidies while grid-connected installations receive 50 per cent subsidies (Martinot and Li, 2010).
Moreover, in a similar way to its early development of the wind power industry, the Chinese central government initiated a competitive bidding programme for solar PV projects in 2009. This programme has created new benchmark tariffs for solar PV (so-called ‘approved price levels’) on the basis of competitive bidding.

65
stockholm environment institute
In addition to the above-mentioned national incentive programmes, there are also provincial solar PV preferential tariffs. The provinces of Zhejiang and Jiangsu, for example, have established province-wide preferential tariffs for solar PV. Jiangsu province, which has the largest PV industry in China, published a plan to promote the technology and its production. The most impressive goal is to reduce the PV electricity price to RMB 2 per watt by 2011. Zhejiang province plans to install solar panels on 10 million m2 of roofing.
These government incentive programmes have created a surge in China’s PV market. China’s new PV installations in 2009 reached 160MW, a fourfold increase on 2008 levels, and another 400–500MW was installed in 2010. Many analysts believe that China will be able to increase its PV installations to 1GW in 2011.
Situating this development in a larger policy context, many of these market developments can be traced back to the enactment of a landmark 2005 Renewable Energy Law, which took effect in 2006 after the passage of detailed implementing regulations. A key element of that law was provision for renewable portfolio standards, along with feed-in tariffs for biomass, ‘government-guided’ prices for wind power, an obligation on utilities to purchase all the renewable power generated, new financing mechanisms and guarantees, as well as other market-enhancing provisions (Martinot and Li, 2010).
An update to the original 2005 law was adopted by the National People’s Congress in December 2009 and took effect on 1 April 2010. This update contains new provisions that will greatly enhance the development of renewable energy in China. For example, a renewable energy fund established by the Ministry of Finance as part of the 2005 law was strengthened and consolidated. The fund had been collecting a 0.4 fen/kWh (0.06 US cents/kWh) surcharge on electricity sales nationwide (with some customer class exemptions). The Ministry uses the fund for government-supported renewable energy projects and to meet the cost of the feed-in tariffs. However, the surcharge had not kept
0
100
200
300
400
500
600
700
800
1976 1980 1985 1990 1995 2000 2002 2004 2005 2006 2007 2008 2009 2010
MW
p
Annual installed
Cumulative installed capacity
Figure 3.14: Solar PV installation in China: 1976 – 2010 based on semi (2011) and Li et al., (2007)

66
driving technological innovation for a Low-Carbon society
pace with expenditure, so the revisions allow the Ministry to supplement the renewable energy fund with general revenues (Martinot and Li, 2010).
Future development Solar PV is an important component of China’s ambition to achieve a 15 per cent share of non-fossil fuel energy sources in its total energy mix by 2020. It is also a key measure contributing to its carbon intensity reduction goal of 40 to 45 per cent compared to 2005 levels by 2020. Transmission constraints on the further expansion of wind power mean that attention is expected to shift to solar PV, the potential of which has hardly been explored. The PV capacity installed in China in 2010 (400 MW) was a mere 2 per cent of the world total, significantly behind Germany (7407MW, 44 per cent), Italy (2118 MW, 12 per cent), Japan (1030 MW, 6 per cent) and the USA (878 MW, 5 per cent) (SEMI 2011). By the end of 2009, solar PV had only a negligible share (0.18 per cent) of renewable energy in China (Martinot and Li, 2010).
In the newly approved Twelfth five-year plan for 2011 to 2015, the target for total installed solar capacity by 2015 is 5GW – an increase from the level at the end of 2010, which was 0.7–0.8 GW. According to the still pending energy stimulus plan, China’s goal for solar PV is to reach 20 GW by 2020 (Martinot and Li, 2010). Using the IEA Solar PV Roadmap as a benchmark, in its most recent report, the SEMI PV Group, the SEMI China PV Advisory Committee and the China PV Industry Alliance (2011) recommend that China should have 60GW of installed PV capacity by 2020 and 270GW by 2030 just to reach the global average penetration level of 1.3 per cent PV electricity by 2020 and 4.6 per cent by 2030.
In the timeframe of the Twelfth Five-year Plan, China will continue to maintain its position as the global leader in solar PV manufacturing. At the same time, with the support of government policies, the domestic market for applications will grow quickly. In the light of the recently weakened international market and the strong movement on government support domestically, there is every indication that the solar PV market in China will continue to expand along current trends, if not faster.
3.5 Short case study: PV in India
India is a country with significant solar resources – similar to those in California and Spain,29 both of which are already important markets for solar power. In addition, the widespread lack of access to electricity – approximately 400 million people lack access to electricity according to the IEA – makes solar power an interesting potential tool for poverty alleviation. Solar power has long been seen as an important tool for economic development in India, particularly in rural areas, and the national government is now taking steps to accelerate its rise as a major energy source nationwide.
29 World Bank (http://www.wri.org/map/global-direct-normal-solar-radiation)

67
stockholm environment institute
The National Solar Mission In 2010, the federal government made solar power an official priority through the establishment of the Jawaharlal Nehru National Solar Mission (NSM). The NSM is officially part of the country’s action plan on climate change and, like the other elements of that plan, the NSM is viewed as a win-win for the climate and development.
DeploymentThe most important elements of the NSM are its targets for the deployment of solar energy, which cover both PV and thermal. These targets propose a ramp up to 1GW of installed capacity by 2013; either 3 or 10 GW by 2017; and 20 GW by 2022. Adoption of the 10 and 20 GW targets are conditional on the availability of international financing.
The targets are highly ambitious and could potentially create the conditions for growth – and volatility – that have previously been seen in Germany and Spain. On the other hand, the conditions for development differ significantly from these countries, with a less developed power and energy infrastructure, a less mature manufacturing sector and the need for a customized approach to solar PV product development. These conditions create challenges for the development of a domestic PV industry but they also create opportunities, in particular related to niche applications and products.
Grid-connected solar PVGrid-connected solar PV is being implemented through renewables portfolio standards and feed-in tariffs at the state level. Tariffs vary from state to state but are generally viewed by investors as quite generous, and this has led to a flurry of activity in the sector.
Because power markets are not fully deregulated, permission to build capacity has generally been distributed through ‘reverse auctions’, in which prospective producers attempt to submit the lowest competitive bid to secure the right to produce. In some states this has led to bids significantly below the tariff level, and to associated concerns that these will turn out to be ‘vapourware’ bids from firms who cannot deliver at the agreed price, or who cut corners on quality in order to meet targets.
In many respects this is the inverse of the overheating seen in Spain, where over-generous feed in tariffs led to a ‘bubble’ in solar construction, much at uncompetitive costs, and eventual pressure on the state to bring down the electricity prices facing consumers. In India, a failure to deliver on bids could eventually force state electricity boards to raise electricity prices rather than fall behind targets.
Like in other countries with subsidies for renewables, establishing the credibility of the new subsidy system with investors and banks is a major challenge. To date, this credibility has been correlated with the fiscal solvency of the state in question. States that have built an eventual ‘step down’ in to the tariff from the outset, such as Gujarat and Orissa, appear to have the greatest credibility. Investors have also been wary of states in which the authorities have expressed an interest in constructing solar capacity

68
driving technological innovation for a Low-Carbon society
with public funds. The federal government has urged states to involve the private sector, recognizing that the targets in the NSM cannot be met without large amounts of private capital, in particular from the banks.
A more distant – but major – source of uncertainty is the fact that the 2017 and 2022 goals are conditional on the availability of international financing. The lack of clarity associated with the global climate negotiations is likely to continue, and the only current international support system – the Clean Development Mechanism – is based on a concept of ‘additionality’ that is unlikely to be compatible with feed-in tariffs. Investors expect the Asian Development Bank, the IFC, and the World Bank Global Environmental Fund to be involved in financing, and there is hope that successor mechanisms to the CDM may be more compatible with domestic policy. Nonetheless, uncertainty over whether 3 or 10 GW is being built is likely to have major consequences for the entire supply chain.
The global supply chain and PV development in IndiaAlthough it has received less attention, the NSM also contains targets for the domestic solar photovoltaic industry: 700 GW of installed manufacturing capacity for panels and 2GW of silicon material manufacturing capacity. The NSM also has an R&D component, establishing national research priorities (material efficiency, system costs, storage and space intensity) and creating a National Centre of Excellence on solar R&D.
The NSM also includes a target of ‘grid parity’ – or fully competitive costs – for grid-connected solar power by 2022. Whether this target can be achieved is a question that will depend, in large part, on the global development of PV technologies. India’s own manufacturing sector for PV is small and immature. The NSM has provided an import duty exemption for imported goods, which should open the market and stimulate competition and innovation. At the same time, however, requirements for ‘domestic value added’ of anywhere between 30 and 70 per cent have been debated, with the aim of either stimulating Indian industry or favouring the domestic economy, depending on the perspective taken. Some project developers have expressed support for full competition while others see value in the development of a domestic industry, which would help guarantee supply in what has been a volatile marketplace while also increasing the political sustainability of the subsidies needed for deployment.
An open import market would mean competition from the European Union, the USA, and China. It seems likely that China will pursue a low-cost export strategy, while EU and US companies may explore both exports and technology licensing to local manufacturers as the Indian industry matures.
In the beginning, European engineering companies are likely to supply integrated systems. There will be opportunities to reduce costs through ‘learning-by-doing’ in this implementation phase. Learning could benefit from the small-scale, high-volume approach that is expect to predominate – ‘a revolution through thousands of 1 MW installations’ according to one industry executive.

69
stockholm environment institute
Potential also exists to customize panel and unit manufacture to specifically Indian conditions. Demand for off-grid solar powered appliances is already significant, and this market is being seized by social entrepreneurs and start-ups such as D.Light. Entrepreneurs are exploring small-scale, no-frills applications connected to mini-grids supporting a handful of villages. These may make use of the demand for baseload power from the mobile telephony towers that are now proliferating in rural India, which currently tend to be powered by diesel generators.
Whether the global supply PV supply chain will deliver these systems remains to be seen, but it may be that an Indian industry needs to develop in order to effectively serve its own market. Low-cost, flexible, thin-film technologies, such as those based on Cadmium Indium Gallium Selenide (CIGS) and Cadmium Telluride (CdTe), are already generating interest among project developers and may be the basis for Indian PV applications in the future.
Unfortunately, Indian observers do not yet see a visionary approach to such new technologies as part of the core of the NSM. While small-scale off-grid solar power is important politically for the NSM, there may be an untapped research opportunity linked to integrating US and European technologies with Indian applications. Engagement by large companies and the National Centre of Excellence could help accelerate the efforts of entrepreneurs in this area.

70
driving technological innovation for a Low-Carbon society
4. CArbon CApture And storAge
4.1 CCS introduction
Carbon Capture and Storage (CCS) technologies have come to prominence due to their potential to mitigate greenhouse gas emissions. The IPCC estimates that the technology has the potential to mitigate 15–55 per cent of cumulative emissions to 2100 (IPCC, 2005). IEA scenarios indicate a 10 per cent reduction potential, that is, one-fifth of the envisaged 50 per cent reduction, by 2050 (IEA, 2009). The expectations are similar for medium term contributions in both the European Union (EU) (Claes and Frisvold, 2009) and the USA (McKinsey & Company, 2007), which suggest that 13 per cent of the envisaged emissions reductions can be achieved by 2030. An influential set of actors advocates CCS primarily as a means to secure the future use of domestic fossil fuel resources and to enhance oil recovery (Pollack et al., 2011). It is clear, however, that large scale CCS would not be contemplated if it were not for the threat of climate change.
However, the technology is controversial even within the community of those who wish to combat climate change. The promotion of CCS has been criticized as an attempt by to preserve the generation of electricity from fossil fuels and to slow the rise of renewable sources of power. Some critics are concerned about the high costs and the uncertainties associated with CCS, although other analyses indicate that climate mitigation scenarios using CCS are significantly less expensive overall than scenarios in which the technology is not developed and deployed (IEA, 2009). In the analysis below, the aim is not to assess CCS compared to alternative climate change mitigation options, but to explore current development and the future potential of CCS as an option and contributor to reducing carbon dioxide (CO2) emissions.
In this study, the primary aim is to understand the development of CCS as applied in the power sector. Although CCS can be applied to a number of industrial processes, current R&D and many proposed demonstration plants focus on integrating CCS with coal power. Global CO2 emissions from coal-based power and heat generation are currently about 70 per cent (9GT) of the total 12.6 GT emitted from the combustion of coal (IEA, 2010e) and total emissions are expected to increase significantly. The power sector was one of the first to face regulation of CO2 emissions, and this has provided a regulatory driver for development and demonstration.
4.1.1 About the technologyAlthough often referred to as an emerging technology, CCS is in fact a suite of existing technologies combined for a new purpose – avoiding GHG emissions (Pollak et al., 2011). CCS involves the chemical separation and capture of CO2 from the flue gas produced by combustion, or other industrial processes, and the subsequent transportation and injection of that (usually liquefied) gas into a geological formation that prevents its release into the atmosphere. Transportation may involve the use of pipelines, trucks or ships, and storage can take place in oil and gas fields or the porous rocks of underground saline aquifers. The potential to store CO2 in the oceans has

71
stockholm environment institute
been considered but largely dismissed as environmentally problematic. Experimental techniques for direct absorption by some rocks and even biological material are being explored, as are injections of CO2 for the controlled cultivation of algae.
The capture, transportation and injection of CO2 into geological formations are all well known industrial processes (IEA, 2009). Capture technology emerged in the food and chemical industry (e.g. the carbonisation of beverages) in the 1930s, and separation of CO2 from natural gas streams was developed in the 1950 and 1960s (IEA, 2009). CO2 as a commodity has been produced and sold commercially for much of the 20th century, and a well developed infrastructure for CO2 production and storage already exists, albeit on a limited scale compared to the proposed industrial applications.
Interest in integrating these technologies to reduce CO2 emissions has grown significantly over the past decade, and the community working with these technologies has increasingly begun to focus on their potential role in climate change mitigation (Stephen et al., 2011). Integrated systems for capturing, transporting and storing CO2 have the potential to reduce emissions from a variety of the combustion processes used in the generation of electricity and heat, as well as in the chemical, steel, cement and paper industries. CCS widely applied to coal-based power generation and/or other industrial processes would give rise to flows of CO2 several orders of magnitude greater than those seen in existing applications. This would require a scaling up and an integration of the separation, transportation and storage technologies. The deployment of CCS requires the integration of a chemical plant and a power plant, according to one expert interviewed, although one might reasonably add ‘an oil field’ to the required infrastructure, given the nature of the storage component. It is clear from both previous research and our study that the key next step for CCS is this integration of two highly complex industrial plants and the resolution of parallel political, legal and economic
3 6
23
168
500
2.800
10.000
18.000
Glo
bal C
Osto
rage
for
2
mitig
ation, 2010
Annual em
issio
ns fro
m1G
W c
oal-fire
d p
ow
er
pla
nts
Glo
bal C
Ocaptu
re in a
ll2
larg
e s
cale
pro
jects
, 2010
IEA
targ
et fo
r C
Ocaptu
re2
and s
tora
ge, 2020
’Low
cost’
CO
captu
re2
pote
ntial (p
ure
str
eam
from
gas p
rocessin
g)
IEA
targ
et fo
r C
Ocaptu
re
and
2
sto
rage, 2030
IEA
targ
et fo
r C
Ocaptu
re
and
2
sto
rage, 2050
Anth
ropogenic
CO
em
issio
ns
availa
ble
2
for
captu
re (
exclu
des
transport
, fo
restr
y, e
tc.)
Figure 4.1: Comparison of CO2 volumes (MTpa) sources: ieA, global CCs institute (2011)

72
driving technological innovation for a Low-Carbon society
challenges to the storage of CO2. The magnitude of the challenge is illustrated in figure 4.1, which compares the number of pilot projects in 2010 and the amount of carbon captured with the future need for development in order to realise the potential discussed above.
4.1.2 The risks and negative impacts of CCSThere are risks and uncertainties related to the storage of CO2 in geological formations. To date, lessons have primarily been learned from enhanced oil recovery (EOR), or injection into natural gas fields – not in the saline formations that would be the primary storage sites for CO2 in future large scale CCS schemes. Figure 4.2 shows the role of large scale CCS projects to meet industrial demand for CO2. Although existing knowledge indicates a low likelihood of leakage, CCS for the purposes of climate change mitigation will require monitoring to ensure that no leakage occurs, as well as measurement of any leakage that does occur – potentially over hundreds of years.
In terms of environmental and health risks, some capture technologies rely on toxic chemicals for scrubbing CO2 from flue gases, and these must be controlled. High concentrations of CO2 can cause oxygen deprivation, so mass leakage could be seen as a risk, although this risk is generally regarded as very remote. These risks are much less problematic than those of widely used technologies such as natural gas transportation and storage, and much less problematic than those associated with nuclear waste. Within the CCS community, the primary framing of risk is related not to environmental or health risks, but to the risk that CCS will not be developed (Stephens et al., 2011).
60
34
Storage formitigation (demo)
30
Enhanced OilRecovery
20
CO demand
(global)2
23
Supplied by large-scale integrated projects
Supplied by other sources
MT
CO
2
Figure 4.2: Role of large-scale CCS projects in meeting industrial demand for CO2 source: global CCs institute (2011)

73
stockholm environment institute
4.1.3 Different types of CCS technologies Technologically, there are essentially three possible techniques for carbon capture: pre-combustion, post-combustion and oxy-fuel (see Box 4.1 ). A number of options for transportation exist, all of which require compression of CO2, a step that requires energy and increases costs. As is noted above, a number of options exist for permanent storage of CO2 in geological formations. For the capture and compression steps, technology development is centred on reducing the energy penalty. Throughout the system, up-scaling and the integration of the different sets of technologies are the major focus.
Storage and transportation in pipelines present few technological problems per se, but there are challenges related to integration and scaling. From a technological point of view, it is demonstration of larger scale capture that is the main requirement. In terms of the individual components, the most challenging option for capture is pre-combustion, which is conditioned on the development of advanced technologies for the gasification of coal to a hydrogen-rich gas from which CO2 can be separated before combustion. This technique requires advanced turbines designed for hydrogen combustion, and pre-combustion capture is the least suitable for retrofitting to existing power and industrial facilities. Post-combustion is the most mature capture technology. In this case, solvents and membranes are used to scrub CO2 after combustion, and R&D is concentrated on developing more efficient and environmentally friendly chemical solvents. Finally, oxyfuel has been demonstrated in steel plants, but not large scale coal plants. Integration and the energy penalty remain the major challenges, as well as identifying new materials (IEA, 2009).
The literature on CCS describes the individual technologies as mature, and demonstration of individual technologies is no longer sufficient to move CCS forward for the purpose of climate change mitigation. CCS is often said to be in the ‘valley of death’ between development and deployment, where mature technologies must be tested and improved in an integrated system that requires larger scale demonstration (Gough et al., 2011). It should be emphasised that this does not imply that no technological challenges are foreseen when large scale demonstration plants are built, only that, at the current stage
Box 4.1 The three key carbon capture technologies.
Post-combustion: Separates CO2 from the flue gas produced by fossil-fuel combustion in air. Is the most mature technology and relies on relatively well known technology from e.g. the chemical industry.
Pre-combustion: CO2 and H2 are separated from a syngas produced in an Integrated Gasification Combined Cycle (IGCC), which gasifies fossil-fuel under high pressure. This technology is closely tied to the development of advanced coal combustion technology.
Oxy-fuel: A highly concentrated CO2 stream is created by combusting coal with pure oxygen instead of air. The individual components are mature, but the integrated technology is the least tested.

74
driving technological innovation for a Low-Carbon society
of development, the operation of the component technologies is no longer the key concern. Therefore, much of the analysis below concentrates on understanding the development of such large scale demonstration plants.
4.1.4 Demonstration and the reduction of costs and risksThe objective of CCS demonstration plants is to improve effectiveness and reduce costs, of both construction and the operation of the technology, in order to establish a business case to invest in full-scale deployment on commercial terms. The energy penalty associated with the capture and compression of CO2 must be brought down in order to reduce costs, and plant designs and operational models must be tested to optimise efficiency and flexibility, and thus increase the electricity and revenues generated by the plants.
Funding for planned demonstration plants 2005–2015, including the UK as a key EU country-specific funder
EU: NER300 (Decision on demonstration support for CCS (2/3) and innovative renewable(1/3) of estimated € 5.5 Billion)
USD 5.13 Billion
EU: EERP (European Economic Recovery Plan) USD 1.40 Billion
UK: Demonstration Programme decision in October 2010 USD 1.60 Billion
USA: ARRA (American Recovery and Reinvestment Act) USD 3.40 Billion
USA: FutureGen2.0 (50% of 1.5 Billion) USD 0.75 Billion
Funding for R&D
EU: Annual R&D FP7 years (2007–2013) USD 0.55 Billion
USA: Annual R&D DOE (2008–2011) (Obama Task Force, and Stephens in Meadowcroft)
USD 0.40 Billion
USA: Annual R&D DOE (2008) not including other advanced coal (van Alphen et al., 2010)
USD 0.025 Billion
Total investment, current annual rate
EU USD 1.36 Billion/y
USA USD 0.82 Billion/y
Estimated costs of CCS in IEA scenario 2050
Total (over 40 years until 2050) USD 2500–3000 Billion
Average annual rate of investments needed 2011–2050 USD 60–75 Billion/y
Table 4.1: Public funding for CCS demonstration and R&D in the USA and Europesources: interviews, meadowcroft (2009), Congress report, markusson et al., geC, van Alphen
note: these are the most significant sources. smaller flows at the state level in the usA and among member states in the eu are not included. does not include private company spending. total amounts in the usA and the eu represent a significant proportion (roughly 2/3) of total global funding for CCs r&d and demonstration.

75
stockholm environment institute
A number of studies have attempted to assess the overall cost associated with the extra investment, the energy penalty and the storage required to deliver electricity from CCS-equipped fossil fuel plants. The results from a few notable studies are shown in Table 4.1.
While assumptions and results have varied, most studies see an overall ‘cost of abatement’ in line with the expected CO2 price needed to achieve ambitious climate mitigation scenarios. Indeed, CCS is often viewed as ‘the marginal technology’ expected to deliver reductions that could not otherwise be achieved without incurring larger economic costs (i.e. through higher penetration of renewables, early closure of profitable plants or demand destruction).
From an investor perspective, these costs must be borne by the long-run avoided cost of carbon, that is, they must be offset by the CO2 price. The risks associated with plant design and business models, however, are borne by the investor. Demonstration at scale is therefore needed to bring down the risks and the cost of capital associated with such investment.
The two case studies set out below – CCS in Europe and the USA – focus on the factors that constitute the drivers of and barriers to the development of large scale demonstration plants. They analyse aspects of the innovation system, such as the
Table 4.2: Large-scale CCS demonstration projects in operation
Project name Nation Region Capacity Year Type
Enid Fertilizer UNITED STATES
Oklahoma 0.68 Mtpa 2003 Fertiliser plant
Great Plains Synfuel Plant and Weyburn-Midale Project
CANADA Saskatchewan 3 Mtpa 2000 Synfuels plant including SNG
In Salah CO2 Storage
ALGERIA Ouargla Wilaya
1 Mtpa 2004 Natural gas processing plant
Century Plant (formerly Occidental)
UNITED STATES
Texas 8.5 Mtpa 2011 Natural gas processing plant
Shute Creek Gas Processing facility
UNITED STATES
Wyoming 7 Mtpa 1986 Natural gas processing plant
Sleipner CO2 Injection
NORWAY North Sea 1 Mtpa 1996 Natural gas processing platform
Snøhvit CO2 Injection
NORWAY Barents Sea 0.7 Mtpa 2007 Natural gas processing platform
Val Verde Natural Gas Plants (formerly Sharon Ridge)
UNITED STATES
Texas 1.3 Mtpa 1999 Natural gas processing plants

76
driving technological innovation for a Low-Carbon society
actors, uncertainty and risk, broader climate policy (e.g. carbon pricing), resource mobilization and legitimacy. Both cases are important as they represent the regions that are most advanced in terms of CCS research, development and demonstration (Meadowcroft and Langhelle, 2009a). A majority of the funding and the ongoing and planned projects are located in these two regions (see Table 4.2 and Figure 4.3). Canada, Australia and China could also have been included. 30
4.2 Case study: CCS in Europe
Over 50 per cent of EU electricity comes from fossil fuels and in spite of the new energy technologies being developed, electricity production is expected to continue to rely on fossil fuels at least until 2050 (e.g. CEC, 2007). If fossil fuel combustion remains a source of electricity, it is crucial that solutions are found to reduce the associated CO2 emissions.
The EU is a major driver of CCS development, linked to the EU’s climate targets based on commitments made in the Kyoto protocol. This section describes the actors in and policies of the European CCS innovation system, the functionality of the system and its main barriers and drivers. It also makes a policy assessment.
4.2.1 Actors in the European CCS innovation systemThe development of CCS as a potentially important low-carbon technology is dependent on projects developed by the utilities as well as those developed by engineering and manufacturing companies. The utilities are the most directly exposed to the price of carbon emissions set by the European Union Emission Trading System (ETS). They own and operate the assets into which the CCS technology will be integrated. Several utilities have taken the lead in piloting capture technology. The chemical industry uses post-combustion carbon capture. Many of the processes used in pre-combustion carbon capture are used in gasification processes in the petroleum industry (IEA, 2009). Coal-
30 http://sequestration.mit.edu/tools/projects/index.html accessed the 22nd June, 2011.
Siz
e in
MW
8000
7000
6000
5000
4000
3000
2000
1000
0USA EU+Norway Canada Rest of
the world
Oxyfuel
Pre
Post
Figure 4.3: Demonstration plants planned in the world according to the MIT CCS database30

77
stockholm environment institute
fired power plants have the highest emissions and therefore the greatest business risks from unabated operations.
Global engineering and manufacturing companies, such as Alstom and Siemens, and large engineering companies such as Aker Solutions are important players in the construction of integrated CCS plants, as well as in R&D of core components such as turbines.
This set of industry actors possesses the necessary competences for the kind of industrial integration projects necessary to demonstrate the commercial viability of CCS. There are important research organizations and academic institutions involved in R&D of CCS in Europe, but innovation in CCS is driven by the integration efforts coordinated by manufacturing and utility companies – with academic partners on specific issues. Smaller companies and academics with specialist competences contribute R&D to some extent in niches such as solvents, membranes and compressors.
In terms of commercial operations for the storage of CO2 in geological formations, the primary actors are found in the oil and gas industry. One of the first and largest carbon storage projects in the world is operated by Statoil in Norway. Since 1996, CO2 has been injected and stored offshore at the Sleipner gas field, after separation from the extracted natural gas mix which is around 9 per cent CO2. The technology was developed in response to climate policy putting a price on carbon emissions.
Table 4.3: Actors in the CCS TIS
Actor Interests
Power companies To earn money from electricity generation and reduce future CO2 emissions; have therefore developed pilot CCS plants and plan demonstration plants.
Equipment and manufacturing companies
To sell CCS technology and build integrated plants when the technology is commercially viable. Adequate subsidy for R&D.
Oil and gas companies To apply the technology developed for oil and gas recovery to storage projects. May have an interest in operating storage if regulatory uncertainty is reduced. May eventually apply CCS to own emissions associated with oil and gas production.
Universities and research organizations
Conducting research on subcomponents and technologies.
NGOs Achieving sharp reductions in CO2 emissions. Ensuring renewable energy is not disadvantaged as a side-effect of investment in CCS. If CCS is pursued, monitoring for leakage.
Policymakers Meeting ‘energy triangle’ objective: environmental sustainability, security of supply and cost competitiveness.
Local communities Health and environmental risk, jobs.

78
driving technological innovation for a Low-Carbon society
The central political actor is the European Commission, which governs CCS using both market and network instruments. First, the Commission has initiated policy processes that push CCS. These are explored further below. Second, together with industry, the Commission has initiated important networking and knowledge sharing activities in the EU including the Zero Emissions Platform (ZEP) and the CCSNetwork. ZEP has been the most important advisory body, lobby organization and knowledge sharing platform in the EU since it was set up in 2005. Participation in the CCSNetwork is both mandatory for, and limited to, the actors that receive financial support from the
Table 4.4: An overview of the policies supporting and regulating CCS in the EU
Policy Document/decision Description
Communication on CCS
January 2007, COM(2006) 843 final – Sustainable power generation from fossil fuels: aiming for near-zero emissions from coal after 2020
First European commission Communication on CCS
Climate policy March 2007, Conclusions from Spring European Council
EU 20-20-20 targets, outlining financing of up to 12 demos by 2015 as a key strategy
Communication on Climate
November 2007, COM (2007) 723 final – A European Strategic Energy Technology Plan (SET- Plan)
Communication on climate and energy outlining CCS as one of the strategic energy technologies to be developed until 2050
Communication on CCS
January 2008, COM(2008) 13 final – Supporting Early Demonstration of SustainablePower Generation from Fossil Fuels
Communication on CCS outlining demonstration plants and goal of commercial availability of CCS by 2020
Directive on budget for demonstration plants
April 2009, “ETS Directive” (2009/29/EC)
Budget of 300m allowances for CCS and innovative renewable energy projects, of which CCS get large proportion, estimated at EUR 5.5 billion
Directive on carbon storage
April 2009, “CCS Directive” (2009/31/EC)
Framework directive, requesting member states to implement regulation of carbon storage
EC Regulation on budget for economic recovery
April 2009, Regulation (EC) No 663/2009 establishing a programme to aid economic recovery by granting Community financial assistance to projects in the field of energy
Economic crisis recovery package regulation including a budget of EUR 1.05bn for CCS demonstration plants. Six plants subsequently selected for support
Call for applications for NER300 funding
November 2010 NER300 call for demonstration projects low carbon technologies, intended to support at least eight CCS projects

79
stockholm environment institute
EU to develop large scale demonstration plants. Other industry associations and trade organizations appear to play less of a role than these networks, at least within the EU.
Finally, NGOs in Europe are split on their views on CCS. Many are either sceptical or openly negative about CCS (Meadowcroft and Langhelle, 2009b). The most important arguments relate to the risks to human health and the environment from possible leakage, the possibility that support for CCS will divert resources from renewable energy and energy conservation, and the danger that supporting CCS supports the continued use of coal for electricity generation. However, there are also strong supporters, such as Bellona and NGOs such as WWF, which see the technology as necessary but a lower priority than renewable energy and energy efficiency. The key discussion is whether CCS should be seen as promoting the use of non-renewable fossil fuels, or as an important low-carbon technology that cannot be disregarded because the global energy system will continue to be dependent on fossil fuels for the foreseeable future (Stephens et al., 2011). An overview of actors in the innovation system for CCS in Europe is provided in Table 4.3.
4.2.2 Polices in the European CCS innovation systemCCS entered the political discourse on climate change in the EU only relatively recently. CCS was first mentioned formally by the European Commission in the 2005 Communication Winning the battle against climate change and the first dedicated CCS Communication was developed in 2006 and published in early 2007 (CEC, 2007). Claes and Frisvold (2009) believe this interest emerged from two agendas: security of energy supply and climate change. In particular, following on from the development of the Climate and Energy Package and the so-called 20-20-20 targets, CCS was suddenly included as a key solution to combating climate change. The recent emergence of CCS on the political agenda, and the associated developments in policy and funding since 2005, confirm the rapid development of a community of interest around the CCS technology (Stephens et al., 2011). Table 4.4 lists policies supporting and regulating CCS in the EU.
The rationale behind this development has been largely economic. It has been estimated that the cost of achieving stringent CO2 reductions across the EU by 2030 would be 40 per cent higher without CCS (CEC, 2008), and global estimates are that abatement will be between 50 per cent and 80 per cent more expensive without CCS (Azar et al., 2006). This economic reasoning motivates policymakers and, according to our interviews, the manufacturing and utility companies developing CCS technology. Most actors in the EU seem certain that CCS technology will be required sooner or later, and have therefore developed pilot projects in order to prepare for such a development.
Market pull policiesBecause CCS does not generate electricity, the economic value of the technology in large-scale power generation must be based on the reduction in carbon emissions. Therefore, the creation of a market for CCS is dependent on the development of the ETS.
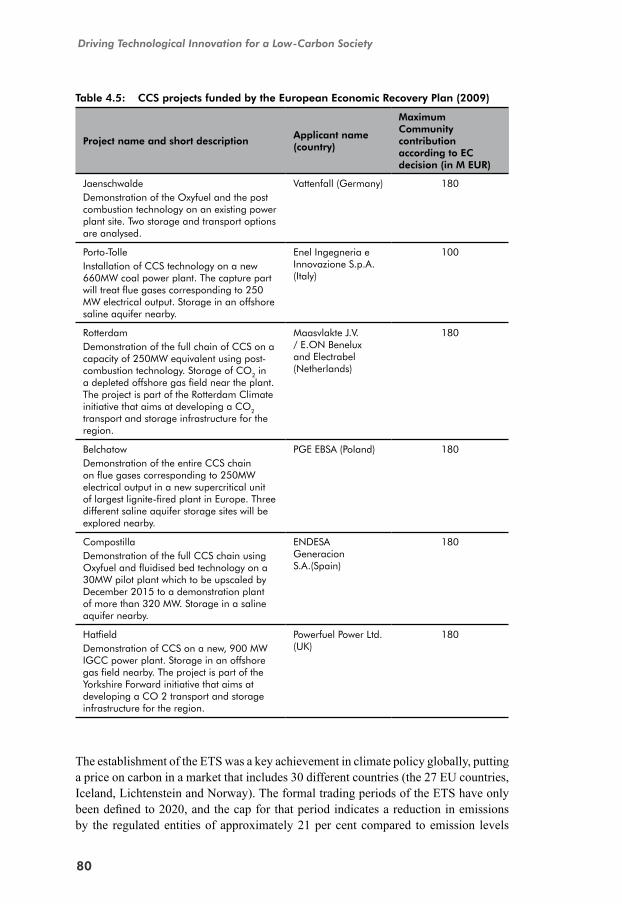
80
driving technological innovation for a Low-Carbon society
Table 4.5: CCS projects funded by the European Economic Recovery Plan (2009)
Project name and short descriptionApplicant name (country)
Maximum Community contribution according to EC decision (in M EUR)
Jaenschwalde Demonstration of the Oxyfuel and the post combustion technology on an existing power plant site. Two storage and transport options are analysed.
Vattenfall (Germany) 180
Porto-TolleInstallation of CCS technology on a new 660MW coal power plant. The capture part will treat flue gases corresponding to 250 MW electrical output. Storage in an offshore saline aquifer nearby.
Enel Ingegneria e Innovazione S.p.A. (Italy)
100
RotterdamDemonstration of the full chain of CCS on a capacity of 250MW equivalent using post-combustion technology. Storage of CO2 in a depleted offshore gas field near the plant. The project is part of the Rotterdam Climate initiative that aims at developing a CO2 transport and storage infrastructure for the region.
Maasvlakte J.V. / E.ON Benelux and Electrabel (Netherlands)
180
BelchatowDemonstration of the entire CCS chain on flue gases corresponding to 250MW electrical output in a new supercritical unit of largest lignite-fired plant in Europe. Three different saline aquifer storage sites will be explored nearby.
PGE EBSA (Poland) 180
CompostillaDemonstration of the full CCS chain using Oxyfuel and fluidised bed technology on a 30MW pilot plant which to be upscaled by December 2015 to a demonstration plant of more than 320 MW. Storage in a saline aquifer nearby.
ENDESA Generacion S.A.(Spain)
180
HatfieldDemonstration of CCS on a new, 900 MW IGCC power plant. Storage in an offshore gas field nearby. The project is part of the Yorkshire Forward initiative that aims at developing a CO 2 transport and storage infrastructure for the region.
Powerfuel Power Ltd. (UK)
180
The establishment of the ETS was a key achievement in climate policy globally, putting a price on carbon in a market that includes 30 different countries (the 27 EU countries, Iceland, Lichtenstein and Norway). The formal trading periods of the ETS have only been defined to 2020, and the cap for that period indicates a reduction in emissions by the regulated entities of approximately 21 per cent compared to emission levels

81
stockholm environment institute
Table 4.6: CCS projects applying for NER 300 funding
Country Name of project CCS technology
United Kingdom
5 pre-combustion Eston Grange (Progressive Energy)Lynemouthe (Rio Tinto Alcan, Progressive Energy)Killinghome (C Gen)Hatfield x2 (Powerfuel Power Ltd)
3 post-combustion Longannet (Scottish Power)Peterhead (Scottish & Southern Energy)Hunterston (AP Ayrshire Power Limited)
1 Oxyfuel Selby (Drax)
Netherlands 1 pre-combustion Buggenum (Vattenfall)
1 post-combustion Eemshaven (Essent/RWE)
1 Oxyfuel ULCOS (Corus)
1 Industrial Botlek (Air Liquide)
France 1 Post-combustion Florange (Arcelor Mittal)
Germany 1 Oxyfuel Jänschwalde (Vattenfall)
Italy 1 post-combustion Porto Tolle (Enel-Eni)
Poland 1 Post-combustion Belchatow (PGE)
Spain 1 Oxyfuel Compostilla (Endesa)
Romania 1 Post-combustion Turceni (ISPE)
in 1990. Given that CCS is envisaged as a tool for much deeper reductions, and that large-scale plants could not possibly be ready before 2020, the ETS is not designed in a way that can definitively drive investment in CCS. However, as an instrument the ETS has no ‘sunset clause’ and this makes the Europe-wide CO2 price the de facto market pull instrument for CCS in the future. In addition, the UK has discussed the creation of dedicated subsidies or feed-in tariffs for CCS at the national level.
A key political commitment on CCS in the EU was the 2007 decision to develop a directive on storage. In 2009 this became a framework for storage legislation across the EU, requesting member states to develop national legislation on CCS storage (CEC, 2009). These national laws will create the market framework for storage of CO2.
Technology push policiesThe ‘market pull’ function for all practical purposes will begin after 2020. CCS development in the short term is therefore driven by policies and funding to encourage research and CCS demonstration projects.
In 2007, the EU developed a strategy to develop up to 12 demonstration plants by 2015 (Claes and Frisvold, 2009). Efforts are centred on raising funds to support the construction of these plants. In 2009, EUR 1 billion was committed to CCS demonstration projects by the European Economic Recovery Plan. An additional EUR 3–4 billion will come from The New Entrants’ Reserve (NER) 300, which will

82
driving technological innovation for a Low-Carbon society
sell the 300 million CO2 allowances that had been set aside for ‘new entrants’ into the ETS (CEC, 2009c). The NER 300 is expected to bring in some EUR 5–6 billion, of which two-thirds is expected to be dedicated to CCS demonstration projects. Table 4.5 shows the CCS projects funded by the European Economic Recovery Plan and Table 4.6 displays the projects applying for NER funding. The EU countries are also committed to support demonstration projects, most notably the UK which has made EUR 1 billion available for demonstration plants.
The current annual R&D budget for CCS in the EU is estimated to be EUR 360 million. The total R&D budget for energy and climate projects in the seventh EU framework programme is EUR 848 million, which indicates that CCS is a major priority. CCS has been actively funded in research programmes since the early 1990s (Claes and Frisvold, 2009), and public R&D funding of the technology in the EU is on a par with or above US levels.
4.2.3 The European CCS TIS: functionality, barriers and driversIn general the pace of development of the CCS innovation system in Europe has been quite fast in recent years. Globally, the number of academic publications has significantly increased in the past 10 years from approximately 100 publications a year in 2000 to almost 1000 publications a year in 2010 (according to the Scopus database). Studies in Europe have highlighted that R&D and technological development are not key barriers for CCS (van Alphen et al., 2010a). The most important global companies that supply CCS technology solutions, such as Alstom and Siemens, have well developed concepts and are ready to take orders for large scale CCS plants, and to give cost and performance guarantees. In technological terms, in comparison with other aspects of the CCS innovation system, neither the three capture technologies, nor transport or storage constitute a significant barrier.
Previous CCS innovation system studies (e.g. van Alphen et al., 2010a) have identified some aspects of innovation system functionality as particularly weak: entrepreneurial activity, market creation and resource mobilization. Our study confirms this picture. An overview of the European innovation system functional pattern is provided in Table 4.7. The key functions and how to improve them are discussed below.
In the language of TIS analysis, the direction of search, or guidance, of the EU CCS innovation system clearly favours the continued development of the technology. But the sheer volume of public funding required suggests that stronger inducement mechanisms are needed in order to realise the current vision. In addition, the slow pace at which key regulatory barriers on storage and transportation are being resolved calls for more conservative estimates of the potential for CCS in the coming years. Uncertainty around storage is already a major hurdle for demonstration plants, which, even though they are not full scale, will produce unprecedented volumes of CO2 for storage.
Resource mobilisation together with legal constraints have consistently been seen as the key blocking mechanisms in previous studies of the EU CCS innovation system (van

83
stockholm environment institute
Table 4.7: TIS functions for CCS in Europe
Function Description
Entrepreneurial activity
Some activity exists in terms of storage linked to climate policy in Norway, and EOR. It is also the case that diverse capture technologies are being pursued. However, almost all activities with regard to CCS development and commercialization are being pursued by large industrial actors, and there is only limited activity in terms of new entrants or possible business cases for private sector actors on the storage or transportation of CO2.
Knowledge development
The most highly developed of all the functions according to both the literature and the interviews conducted. Knowledge is primarily developed among international companies, and basic knowledge on, for example, the chemical processes is widely established (e.g. IEA, US Congress report). To improve this function further would require the development of large scale demonstration projects (Stephens 2010). There is no discernable difference between the EU and the USA. CCS technology is known, and pursued in the same way in the USA and the EU (Congress report, IEA), and the actors delivering this knowledge are often global.
Knowledge diffusion
Several networks are emerging from collaborations between industry and policymakers. The policy-driven quest for knowledge sharing as a condition of funding (i.e. EEPR funding and CCSNetwork) ensures the diffusion of lessons learned during the current planning phase and the future deployment of demonstration plants. Furthermore, there are well established academic networks (e.g. conferences) on CCS, and knowledge is therefore well diffused in both industry and academia.
Influence on the direction of search
Given the rapid development of the European CCS TIS in the past five years, largely due to political support linked to the climate change policy agenda, this function is assessed as fairly well developed. The EU has also recently adopted a legal framework for carbon storage (the CCS Directive) and CCS is clearly envisaged as a key low carbon technology by the European Commission. However, there are no policy goals on the share of energy production as there are in the case of renewable energy and energy efficiency (RES Directive) (EC 2009).
Market formation
It is the assessment of this study that there will not be a market for CCS as a low carbon technology in the next 10 years. While actors indicated their belief that the technology will eventually be deployed, uncertainty remains over the timing and scale of market development The current cap on emissions and the link to the CO2 price are not currently sufficient to create a market for CCS. Given current climate goals and policies, renewable energy and energy efficiency will deliver the required reductions until 2020, with the result that the CO2 price will remain below the EUR 30–70 range needed to support CCS deployment. Actors are uncertain about whether and how this situation will change between 2020 and 2030.
Resource mobilization
The most significant lack of resources is financial. However, polices and financing for CCS are rapidly developing, and the negative outlook provided in this assessment could change with renewed commitment from members state and private sector actors. Human resources are a barrier in terms of storage. Competence in integration exists among the utilities and chemical industry actors.
Legitimisation Public opinion is a barrier which has increased recently, as pilot projects have initiated storage on-shore. Although there are also positive examples where the local community has engaged, CCS remains largely an unknown and poorly regulated technology, leading to low levels of legitimacy overall.

84
driving technological innovation for a Low-Carbon society
Alphen et al., 2010a), and our research shows that the past two years have not changed the picture significantly. In order for CCS to achieve emissions reductions in the order of those described in the IEA’s scenarios (IEA, 2009), and at the level conceived by EU policymakers, the long term funding requirement is an order magnitude greater than the current level (see Table 4.7).
Funding for demonstration plants is now available at a level not previously seen. However, despite clear inducement mechanisms such as the recent increase in financial and political support, and the readiness of the range of technologies involved, the outlook for CCS to deliver on both short-term political goals and medium term CO2 emission reductions is not positive. From a commercial actor’s point of view, high levels of uncertainty constrain development. Perceived risks are slowing the mobilization of private capital in the demonstration phase, and a lack of key legislation has prevented the mobilization of resources to demonstrate large-scale storage. It is not clear that the plants planned in the EU will deliver sufficient learning and progress to make commercial operation possible by 2020, or whether these projects will even be realized at all.
Six large scale demonstration plants have received public funding in the EU, but all the interviews conducted presented a rather dim outlook on whether any will be constructed as envisaged. Large scale CCS projects also have to navigate a complex legal landscape. More fundamentally, interviewees indicated that without substantial additional financial commitments from member states, private actors or the EU, only one or two of the projects will be realized by 2015. The total capital costs for CCS demonstration plants exceed EUR 1 billion. The estimated EUR 3.7 billion from the NER 300 may eventually be spread over as many as 10 projects, which means private investors will need to invest EUR 700 million or more. Such investment is seen as highly risky. Interviewees indicated that concentrating the funding on support for a few of the strongest projects might have been preferable, but the funding has been spread too thinly for political reasons. Consequently, the EU’s previously stated vision of commercially available CCS by 2020 appears unrealistic.
Finally, resources need to be mobilized to develop storage capacity. Aside from the regulatory issues, the most significant risks and uncertainties surrounding CO2 storage are linked to leakage and monitoring. CCS projects in the EU are primarily being developed by the utility companies, which have core competencies related to power plants – a long way from the storage of liquefied gas. Storage competencies exist in the oil and gas companies. In addition, every storage site is unique, and the significant lessons learned on the storage of CO2 through enhanced oil recovery pilot projects, and the lessons on separating CO2 in the production of natural gas at the Sleipner field in Norway, would not necessarily be applicable to a new site. As is noted above, regulation must be further developed in order for oil and gas companies with the right competencies to develop business models for storage.
85
stockholm environment institute
Knowledge development and knowledge diffusion are seen as sufficient at the international level, and development of the technology is perceived in largely the same way around the world. Some authors highlight problems with intellectual property rights associated with eventual technology transfer to developing countries (van Alphen et al., 2010a), and these may need to be resolved if demonstration is to be a global effort. This is primarily a problem for the global innovation system, however, and does not constitute a significant barrier at the EU level.
Within Europe the CCS innovation system is relatively well advanced. The European system fully embraces global private sector actors (most of which are European in origin) and has taken the initiative on two knowledge-sharing platforms (the ZEP and the European Economic Recovery Plan, EERP), which have been influential not just in Europe but also globally. The sharing of lessons learned between different actors is working well, and interviews indicate that it is not critical to the success of CCS for work to be carried out on further networking and coordination. For the past five years the ZEP has played an important role as a broker between technology suppliers, utility companies and policymakers, enabling the formation of a shared view on how, and in what form, knowledge should be shared, taking account of intellectual property rights.
Regarding market formation, it is clear that in the long-term CCS will be dependent on there being a high price for carbon. Commercially available CCS, that is, where CCS plants are operated not primarily for the purposes of demonstration but to deliver a competitive return on investment, and manufacturers are able to sell CCS technology or complete integrated plants in a market, would be totally dependent on a high and predictable value being placed on avoided CO2 emissions. The estimated price of CO2 required for CCS to become a significant contributor to CO2 emission reduction, and thereby enable a significant new market for new jobs, is in the range of USD 40–120/tCO2. This is between five and ten times higher than current EU ETS prices. To develop such a market would require either political commitment to a more stringent cap (and therefore higher CO2 prices) under the ETS or alternative pricing mechanisms for CO2, as well as the development of large scale demonstration plants to test operating and design paradigms and reduce costs and risks. There is uncertainty about the timing and size of future commitments within the ETS, even if some progress is being made with the European Commission’s Roadmap 2050 process (ECF 2010).
Subsidised renewables reduce the need for emissions reductions to be achieved elsewhere in the power sector, including those driven by the EU ETS. If investors expect such subsidies to continue, they might also expect the CO2 price to remain lower for longer. Given their capital intensity, the timing of investment in CCS projects is crucial. Demonstration plants are likely to be timed in accordance with the overall expectation of when the CO2 market will ‘pull’ CCS into the system at full scale. Thus, uncertainty over carbon pricing creates difficulties for investors planning for future capacity. Domestic efforts such as the tariff proposed in the UK could remove some uncertainty, although they would also undermine the CO2 price signal at the EU level, perhaps reducing prospects elsewhere. Supporting substantial market formation for

86
driving technological innovation for a Low-Carbon society
CCS will require increased clarity about the ETS cap and its relation to targets for renewables and energy efficiency.
As is noted above, coal plants with CCS need new business models because they will be operated and optimized differently in order to fulfil different functions, such as meeting base load and peak demand. In addition, it is probably the case that future large scale CCS plants will require greater levels of redundancy (i.e. extra boilers to make room for longer servicing periods). Integration in practice means both new human resources and new business models. The economics and profitability of coal power under new operational conditions are therefore uncertain. Large-scale, grid-connected demonstration plants will be needed over a period of years to resolve these issues and create a business case that can support multi-billion euro investments.
Interviewees stress that storage is one of the most problematic and least developed elements linked to CCS. Due to the lack of regulation, and uncertainties about eventual liability for any leakage, companies are not able to credibly assess the costs related to transportation and storage. Local resistance, from both local/regional governments and community stakeholders, also represents a barrier that policy has not been able to resolve. In Germany, the necessary legislation permitting storage is likely to give an ‘opt out’ for individual states, creating uncertainty about whether sufficient storage will be made available. In the Netherlands, a decision has been taken to move eventual storage of CO2 offshore. This introduces significantly greater transport costs as longer pipelines will be needed and may also sometimes require complex sets of permits from a range of jurisdictions. Focusing on offshore sites also decreases the overall available storage capacity. In TIS terminology, this issue is linked to entrepreneurial activity. Without clear regulation, and limitations on liability, business models for carbon storage will not be developed in Europe.
The technology has achieved certain legitimacy at the EU level through political support, but it has struggled in local contexts. A political vision has been advanced that implies a future need for CCS, even if important uncertainties about market formation remain. Significant resources have been mobilized from both public and private sources. All actors acknowledge the importance of the demonstration phase as a next step to ensuring progress.
4.2.4 Assessment of EU CCS policiesPolitical ambitions for CCS have been high, and policies are ambitious. R&D funding is at least comparable to that for other technologies and to funding for CCS research in other parts of the world. Public funds for demonstration projects are likely to surpass EUR 5 billion by 2015. In addition, the ETS is the most significant and far-reaching carbon pricing instrument worldwide, which creates the long-term prospect of a market pull for CCS. Nonetheless, it is clear from the interviews conducted for this study that these policy initiatives are not sufficient, at least in terms of meeting the previously expressed political ambition of commercial viability by 2020. Indeed, prospects for 2025 are not seen as positive.
87
stockholm environment institute
To date, the contribution of the ETS to emissions reductions has been limited, as the short-term emission reductions set by the system are largely being achieved through decreased demand and the effects of separate policies supporting renewable energy. The price levels expected through to 2020 will not create a market for CCS (von Stechow et al., 2011). Beyond 2020, there is a high level of uncertainty about the future carbon price, which is partly linked to the support provided to renewables.
Similarly, the EU CO2 storage directive has proved unable to resolve the uncertainty about the future of storage. Some national legislation has forbidden onshore storage, while crucial legislation in Germany has allowed regional ‘opt-outs’. Implementation of the directive at the national level risks making CCS storage commercially unviable.
Nor is it clear that the envisaged programme of demonstration projects will be enough to push the technology to commercialisation. The IEA argues in its CCS Roadmap that nearly 100 demonstration projects, additional to those already in operation, are needed globally by 2020 (IEA, 2009). Despite the EU’s prominent role in pushing CCS technology, the level of ambition in the region’s demonstration effort may not be sufficient. Furthermore, it is not clear whether the funding committed is enough even to deliver the plants currently planned in the EU, especially as private capital has become more scarce and conservative since 2008.
There are no indications that policies support a certain technology more than others. The problems that policies address are systemic (funding for large scale demonstration, and policy frameworks for storage). It is also possible to conclude that the character of the EU CCS innovation system is at an early stage, and that currently there is no risk of locking development into a certain trajectory. All three types of capture technology feature in planned large scale demonstration projects in the EU, including the more advanced oxyfuel technology.
4.2.5 Concluding remarks The EU has developed a political vision for demonstration plants by 2015 and commercial CCS by 2020 or shortly thereafter, as well as a trajectory where CCS will provide a substantial share of CO2 reductions by 2050. While this report finds that CCS in the EU has progressed rapidly, and that CCS could be a vital low carbon technology in order to achieve the stringent targets on atmospheric CO2 concentrations (see Stechow et al., 2011), current policy support is insufficient and a number of barriers need to be removed. The key determinants for the continued development of CCS in the EU are a stringent climate change policy, strong and stable political and financial support for demonstration projects and the resolution of regulatory uncertainty.
The European Commission has made CCS an eligible mitigation strategy under the ETS, signalling that the ETS is the key policy instrument on which the technology will have to rely on in the future. However, uncertainties about the CO2 price imply that the ETS is unlikely to support the commercialisation of CCS by 2020 or shortly thereafter.

88
driving technological innovation for a Low-Carbon society
The EU and its member states have provided significant financial and political support for demonstration plants, but the outlook for the planned projects is currently negative. Investors consider these plants too risky to justify the large capital expenditures needed to complement public funding. These risks are largely systemic: belief is waning that demonstration efforts will be sufficient to allow commercial operation by 2020, which makes investing in demonstration for 2015 less attractive. In addition, major regulatory and political hurdles remain related to the transportation and storage of the captured CO2. Resolution of these uncertainties will be a prerequisite for demonstration and continued progress with the technology.
European initiatives on climate change and CCS policy, including the ETS, demonstration plants and networking platforms such as ZEP and EERP, are important drivers of the global CCS innovation system. Current European developments are seen as important in pushing CCS technology forward in developed countries, and in order for CCS to be transferred to developing countries. However, the success of European efforts to develop and demonstrate CCS technology is also dependent on global progress. A global market in carbon remains an unlikely prospect for the coming decades, but increasingly global resource mobilization, particularly around demonstration plants, would help reduce the burden carried by EU actors. A globalisation of this function would also broaden the potential to learn through demonstration and decrease each actor’s own perceived exposure to technology-, policy- and local legitimacy-related risks.
For now, pessimism among EU actors reflects a negative feedback loop. The EU’s efforts in market formation and resource mobilization are perceived as increasingly isolated and unlikely to be sufficient, and thus confidence among key actors declines and the prospects for demonstration darken.
4.3 Case study: CCS in the USA
The USA can be described as a leader in CCS technology for several reasons. Technology for carbon capture emerged in the food industry in the 1930s, and separation of CO2 from natural gas streams was developed in the 1950s and 1960s and subsequently applied to EOR in the1970s and 1980s (IPCC, 2005). Commercial actors have driven these developments. Significant public investment in R&D began in 1990 (Langhelle and Meadowcroft, 2009b).
Fossil fuels contribute substantially to electricity production in the USA, and emissions from power plants constitute about 40 per cent of total US emissions (Global CCS Institute, 2011). In 2010, for example, CO2 emissions from power plants totalled around 2.42 GT (ibid). However, although the potential for CCS to reduce CO2 emissions is a key political reason for pursuing CCS in USA – to the extent that CCS is sometimes described as the core of US climate policy – progress has been limited in terms of the actual development of large-scale projects. This case study focuses on understanding the barriers to and functioning of the innovation system.

89
stockholm environment institute
Table 4.8: Existing and proposed large-scale CCS projects in the US
Project Name Asset Lifecycle Stage
State / District
Volume CO2
Operation Date
Facility Details
ADM Company Illinois Industrial CCS
Define Illinois 1 Mtpa 2012 Ethanol plant
Air Products Steam Methane Reformer EOR Project
Define Texas 1 Mtpa 2015 Hydrogen production at oil refinery
Cash Creek Generation
Evaluate Kentucky 2.5 Mtpa 2015 565 MW IGCC and 130 MSCF/day SNG gasifier
Coffeyville Gasification Plant
Define Kansas 0.585 Mtpa
2013 Fertiliser plant
Enid Fertilizer Operate Oklahoma 0.68 Mtpa 2003 Fertiliser plant
FutureGen 2.0 Oxy-Combustion Large Scale Test
Evaluate Illinois 1 Mtpa 2020 200 MW coal-fired oxyfuel combustion plant
Good Springs IGCC Identify Pennsylvania 1 Mtpa 2015 270 MW coal-fired IGCC power plant
HECA LLC Define California 2 Mtpa 2016 250 MW net multi-fuel-fired IGCC power plant
Indiana Gasification Evaluate Indiana 1 Mtpa 2020 Coal to SNG plant
Lake Charles Gasification Plant
Define Louisiana 4 Mtpa 2014 Petcoke to SNG plant
Mississippi Gasification (Leucadia)
Evaluate Mississippi 4 Mtpa 2014 Petcoke to SNG plant
Lost Cabin Gas Plant Define Wyoming 1 Mtpa 2014 Natural gas processing plant
Medicine Bow Coal-to-Liquids Facility
Define Wyoming 3.6 Mtpa 2014 to 2015
Coal-to-transport fuels (coal-to-liquids) plant
Entergy Nelson 6 Carbon Capture & Sequestration Project
Define Louisiana 4 Mtpa 2015 585 MW coal-fired power plant
Century Plant (formerly Occidental)
Operate Texas 8.5 Mtpa 2011 Natural gas processing plant
Plant Ratcliffe (formerly Southern Company IGCC)
Execute Mississippi 2.5 Mtpa 2014 582 MW net coal-fired IGCC power plant
CO2 Global – Project Viking
Identify New Mexico 1.2 Mtpa 2014 150 MWe oxyfuel combustion using synthetic fuel oil
PurGen One LLC Evaluate New Jersey 2.6 Mtpa 2016 500 MW coal-fired IGCC power plant

90
driving technological innovation for a Low-Carbon society
Shute Creek Gas Processing facility
Operate Wyoming 7 Mtpa 1986Natural gas processing plant
Quintana South Heart Project
Evaluate North Dakota 2.1 Mtpa 2017175 MW net lignite-fired IGCC plant
Sweeny Integrated Gasification Combined Cycle Power Project
Evaluate Texas 3 Mtpa 2015680 MW petcoke IGCC power plant
Taylorville Energy Center
Evaluate Illinois 1.9 Mtpa 2015716 MW gross hybrid IGCC coal power plant
Texas Clean Energy Project
Define Texas 2.7 Mtpa 2014
400 MW coal-fired IGCC power/ poly-generation plant
Tenaska Trailblazer Energy Center
Define Texas 5.75 Mtpa 2016600 MW net supercritical PC power plant
Val Verde Natural Gas Plants (formerly Sharon Ridge)
Operate Texas 1.3 Mtpa 1999Natural gas processing plants
4.3.1 Actors in the US CCS innovation system In 2002, the FutureGen project brought together a range of actors in order to increase knowledge sharing in a new network and to develop CCS specifically for CO2 mitigation. In the same year, seven regional CCS partnerships were launched, creating networks of academic actors, national laboratories and industry actors (Wilson et al., 2009). The interviews conducted for this study confirm that these are now delivering important lessons in areas such as the characterisation of storage sites.
However, projects such as FutureGen, which are oriented towards climate change mitigation, are the exception in the USA. The actors currently driving technology development and demonstration projects in the USA are not utilities but oil and gas companies (Stephens, 2009). Indeed, van Alphen et al., (2010b) found that British Petroleum (BP) is the most centrally placed actor in the US CCS network. A set of oil and gas actors and their associated manufacturers and suppliers have driven CCS technology for EOR. Currently, 50 million tonnes of CO2 per year is injected in 114 CO2 EOR projects (US DOE, 2010c), and there is 5800 kms of CO2 pipeline in the USA. Planned but not yet constructed CCS projects in the USA represent an additional 15–25 million t CO2/year in projected captured CO2, of which most will be used in new EOR applications31. Table 4.8 provides an overview of existing and proposed large-scale CCS projects in the USA.
31 Estimate based on MIT CCS project database, June 2011. Lower level (15 MtCO2/y ) based on given capture rates, and upper level (25MtCO2/y) based on all projects’ stated capacity in MW applying average capture rates for planner projects.
91
stockholm environment institute
The process of recovering more oil from otherwise economically unattractive oil wells by maintaining high pressure through the injection of captured CO2 is an increasingly important technology for US domestic oil production. Oil and gas companies are thus important actors in developing and testing technologies for CCS, not only because of their expertise in the transportation and injection of CO2 (Stephens and Jiutso, 2010), but also because of their political influence over legislation and the framing of CCS as a tool for energy security rather than climate change mitigation (Pollack et al., 2011). It is clear that the importance of EOR is the current driving force behind CCS in the USA.
Public opinion in terms of local opposition to CCS appears to be less of a constraint in the USA in comparison to the EU. The USA is dependent on coal for 50 per cent of its electricity production (Stephens, 2009), and the coal mining and utility companies are seen as important parts of state and local economies. Although there are great regional differences, the federal system allows these actors to have a significant influence on national policy. Conversely, criticisms of CCS by the public and NGOs are often part of a broader ‘anti coal’ agenda. The result is that many actors outside of industry, including NGOs, are torn between the need for CCS to combat climate change and their criticisms of the role of coal. According to both our interviews and the literature, a common denominator among critics is that there should be ‘no new coal without CCS’ (Stephens, 2009). The varying motivations for different actors’ positions on CCS have had implications for the development of the US CCS innovation system. These are elaborated further below.
4.3.2 Policy on the US CCS innovation system Polices supporting CCS in the USA have historically focused primarily on R&D. The political commitment to support R&D rather than provide market incentives is primarily explained by the withdrawal of the USA from the Kyoto framework in 2001, and its failure to develop a national climate policy since. However, it is also the case that support for R&D, rather than regulation, is in general the politically preferred solution to market failure in the USA, and CCS is a prime example of this (Stephens, 2009).
Instead of policies for CO2 emission reductions, policy has focused on domestic technology development intended to enable more affordable future emission reductions (ibid). Following this overarching policy direction, a number of important initiatives were initiated at the federal, regional and state levels that treat CCS as a key future CO2 mitigation strategy. These focus on the characterisation of storage sites, further research and evaluation of CCS technologies, the design of CCS plants, and the removal of barriers to commercial deployment. Table 4.9 lists the policies and suggested policies on CCS in the USA, and some of these are further described below.

92
driving technological innovation for a Low-Carbon society
Table 4.9: Key existing US policies on CCS 32 33 34 35 36 Policy / suggested policy
Document / decision Description
Law Energy Policy Act, 2005, section 963.
Establishes a 10-year carbon capture R&D programme for existing and new coal facilities.32
Law American Recovery and Reinvestment Act, 2009 (ARRA).
Funding from DOE’s Office of Fossil Energy for R&D initiatives focused on making coal use cleaner and more efficient.33
Law Industry Director Directive no. 1 on Enhanced Oil Recovery Credit.
Establishes a USD 10/t CO2 EOR Tax Credit.
Suggested climate legislation with CCS implications
American Energy and Security Act, 2009 (H.R. 2454, “Waxman-Markey”).
Clean energy and efficiency requirements, and national cap-and-trade system, including a number of provisions concerning CCS.34
Suggested climate legislation with CCS implications
American Clean Energy Leadership Act (ACELA), 2009 (S. 1462); American Power Act (APA), 2010 (Kerry-Lieberman);35 Carbon Limits and Energy for America’s Renewal (CLEAR) Act (S. 2877, Cantwell-Collins); Practical Energy and Climate Plan (PECP) Act, 2010 (S. 3464, Lugar, Graham, & Murkowski).
All aim to create new bodies or task existing agencies to make recommendations on CCS technologies and barriers, as well as funding programmes for CCS development and deployment.
Suggested climate legislation with CCS implications
Department of Energy Carbon Capture and Sequestration Program Amendments, 2011 (S. 699).
Would amend the 205 Energy Policy Act and authorise the DOE to carry out a demonstration programme of commercial scale geological storage, entering into agreements with up to ten projects for which it would provide liability protection and Federal indemnity.36
Regulation of CO2 storage (through regulation of injection)
State level dependent, derived from Federal Safe Drinking Water act (SDWA) 1947, and EPA Underground Injection Control (UIC) Program governing Class II wells (CFR paras 144–147).
Injection of CO2 is most commonly regulated at the state level under existing regulations for enhanced oil recovery (Pollak et al., 2011).
EPA regulation of greenhouse gases under the Clean Air Act
Clean Air Act Permits for Greenhouse Gas Emissions EPA 40 CFR Part 52.
EPA regulation that will regulate GHG emissions from industrial facilities. In the initial phase this will apply to facilities that require permits for other emissions, if their GHG emissions are 75 kt/yr or more. In a second phase the regulation would apply to all new builds associated with 100 kt/yr of GHG emissions.
note: includes the recently suggested but not adopted national climate policy. there are also a number of regional and state level initiatives.
32 http://frwebgate.access.gpo.gov/cgi-bin/getdoc.cgi?dbname=109_cong_bills&docid=f:h6enr.txt.pdf
33 http://fossil.energy.gov/recovery/index.html
34 S. 1733: Clean Energy Jobs and American Power Act of 2009 (CEJAPA), also known as Kerry-Boxer, was published on October 23, 2009, and closely follows Waxman-Markey.
35 http://kerry.senate.gov/imo/media/doc/APASectionbySection.pdf
36 http://www.wri.org/stories/2011/04/wri-summary-s-699-department-energy-carbon-capture-and-sequestration-program-amendme

93
stockholm environment institute
Market pull policiesThe political debate over whether to regulate or support a commercial market for CCS in the USA is clearly integrated into the climate change and energy policy discourse. However, to date, few bills addressing CCS have become law, although various proposals on climate change and CCS have been explored in the US Congress.
A number of bills relevant to CCS have been tabled and discussed in Congress, but these have either been abandoned or are still being reworked. A notable example is the American Energy and Security Act of 2009, also known as Waxman-Markey (Waxman, 2009). This bill sought to establish clean energy and energy efficiency requirements as well as a national cap-and-trade system, and contained a number of provisions concerning CCS. Market formation would have been stimulated by the capping of emissions, and the bill would have required Federal agencies to develop a comprehensive strategy for the commercial deployment of CCS. Waxman-Markey also explored regulatory, legal and liability issues, for instance, by establishing regulations requiring emissions reporting on geological storage, and establishing a taskforce to provide recommendations on legal frameworks related to risk, liability and subsurface property rights. Waxman-Markey was passed by the US House of Representatives in June 2009 but was blocked in the Senate in 2010.
Following this setback in the US Senate, the US Environmental Protection Agency (EPA) announced in late 2010 that greenhouse gases would in future require permits, as such emissions influence the health of US citizens. The announcement has withstood several court challenges, and a Supreme Court ruling of 20 June 2011 upheld the authority of the Clean Air Act to regulate CO2 emissions. Implementation of the regulation continues. CCS-specific policy support, such as that included in Waxman-Markey, however, will not come under the EPA’s remit.
At the local level, a number of states have taken steps to foster CCS deployment. For instance, various states have established taskforces and directed agencies and universities to research CCS, including the potential for storage sites, and to make recommendations on identifying and overcoming barriers. Some states are already taking action to remove such barriers, introducing legislation and regulations addressing injection and permitting rules, liability and property rights (Pollack et al., 2011). Several states are also providing incentives for CCS using a portfolio of standards along with requirements for generation from CCS-equipped power plants, a variety of tax incentives and cost recovery mechanisms, among other things (US DOE, 2010c).
The role of CCS is also being considered in the context of broader climate policies at the state level. For instance, the California Carbon Capture and Storage Review Panel has explored CCS in the context of AB 32 (California’s 2006 Global Warming Solutions Act). It identified a need for clear rules on reductions in CO2 from CCS projects and made specific recommendations California Carbon Capture and Storage Review Panel (2010). According to Stephens et al., (2011) several US states, including Florida, California, Georgia and Kansas, have made it clear that no new coal fired plants can be built without CCS being included.

94
driving technological innovation for a Low-Carbon society
In addition to state-level efforts, numerous regional partnerships on climate change have also promoted CCS, including the Midwestern Energy Security and Climate Stewardship Platform, the Midwestern Regional Greenhouse Gas Reduction Accord, the Regional Greenhouse Gas Initiative (RGGI), the Western Climate Initiative (WCI), and the Western Governors’ Association (WGA) Clean and Diversified Energy Initiative (US DOE, 2010c).
Technology push policiesSignificant public investment in R&D for CCS began in 1990 (Langhelle and Meadowcroft, 2009a), and the USA is the country that has spent the largest amount of money on R&D in absolute terms over the past 20 years (Stephens, 2009). In the past 10 years, public R&D has been intensified, with funding for demonstration plants made available and increased research on both advanced coal and CCS-specific technologies.
At the federal level, one successful proposal which has been signed into law, and which illustrates the focus on R&D, is the Energy Policy Act of 2005. Section 963 establishes a 10-year carbon capture R&D programme for existing and new coal facilities (US Congress, 2005). This involves CCS technology development and system efficiency improvements, and promotes carbon sequestration programmes and public-private partnerships. Under the failed Waxman-Markey bill, R&D funding would have been processed through an established Carbon Storage Research Corporation that would have collected funds through a feed-in tariff and provided financial assistance (e.g. grants) for commercial-scale CCS demonstrations.
Recent presidential administrations have committed to the development of cleaner fossil fuels, focusing efforts on research, development and demonstration. Funding for R&D and demonstration plants is generally channelled through the US Department of Energy (DOE) and a key mechanism to date is the 2009 American Recovery and Reinvestment Act (ARRA), also referred to as the Stimulus Act. ARRA funding from the DOE’s Office of Fossil Energy for R&D initiatives focuses on making the use of coal cleaner and more efficient. Multiple demonstration projects are being funded from a budget of USD 3.4 million (US DOE, 2010c). Other funding has included nearly USD 1.6 billion for industrial CCS projects, geological formation site characterisation, and CO2 sequestration training and research grants (US DOE, 2009).
Like in Europe, the next crucial step for CCS development in the USA is the deployment of larger scale demonstration plants. The US flagship project of the past decade is the FutureGen project, initiated in 2002 and intended to be a public-private partnership between the DOE and private sector energy companies (Markusson et al., 2011). However, governmental support has been volatile and the project was restructured in 2008. The problems have been both economic and political, with reduced budgets and changes to the planned technology and its location.

95
stockholm environment institute
4.3.3 The US CCS innovation system: functionality, barriers and driversThe innovation system for CCS in the USA has been shaped by three factors: (i) the struggle to establish a wider policy on climate change; (ii) the potential of enhanced oil recovery; and (iii) the importance of the domestic coal industry. An overview of the functions of the innovation system is provided in Table 4.10, and the main barriers and drivers are discussed below.
The direction of search has see-sawed somewhat. Efforts to steer CCS activity in accordance with climate goals have been volatile and, since the 2009 defeat of Waxman-Markey, largely unsuccessful. Efforts to frame CCS as part of an energy security strategy – roughly a quarter of US primary energy comes from coal and the USA has one-third of the verified coal reserves in the world (BP, 2010) – have been more successful. The Bush administration and later the Obama administration have made clear that clean coal is an important part of the future US energy system, and supported the technological development of CCS and advanced coal in terms of more efficient and cleaner coal technologies. Both the coal and the oil and gas industries support this agenda.
Nonetheless, in the absence of policies requiring emission reductions, the framing is less urgent and has helped put the focus on R&D and marginal improvements to the technology for future deployment, rather than accelerate development through large-scale integration today. Previous research has made it clear that two advocacy coalitions are arguing for CCS in two different ways in the USA, with “very different ideas of why geological storage is happening”; and that “…the energy coalition has had greater success than the climate coalition in shaping laws and rules to align with its policy preferences” (Pollack et al., 2011).
The innovation system in the USA has had very different drivers to the innovation system in the EU. Markets for enhanced oil recovery have played the role that carbon markets have played in Europe, and a political focus on R&D has emerged in the absence of an overarching climate policy of the kind that exists in the EU. Interviewees indicated that this has resulted in less momentum in the USA than in the EU, and even that US actors will look to EU markets to drive technology development in the future.
Market formation has followed two tracks. There is significant interest in using CCS for enhanced oil recovery, and this market appears to be forming around the revenues that can be generated from the oil extracted. Conversely, the (much larger) market for emissions reductions needed to support CCS for climate mitigation has not formed at the national level. Local and regional attempts to regulate emissions have been fragmented and do not appear to be driving major investments in CCS demonstration projects. The planned demonstration projects that do exist are dependent on the market for EOR. Given the limited nature of this market, and the fact that EOR projects will not contribute to developing storage in saline aquifers, market formation can be seen as a major blocking mechanism for continued development.
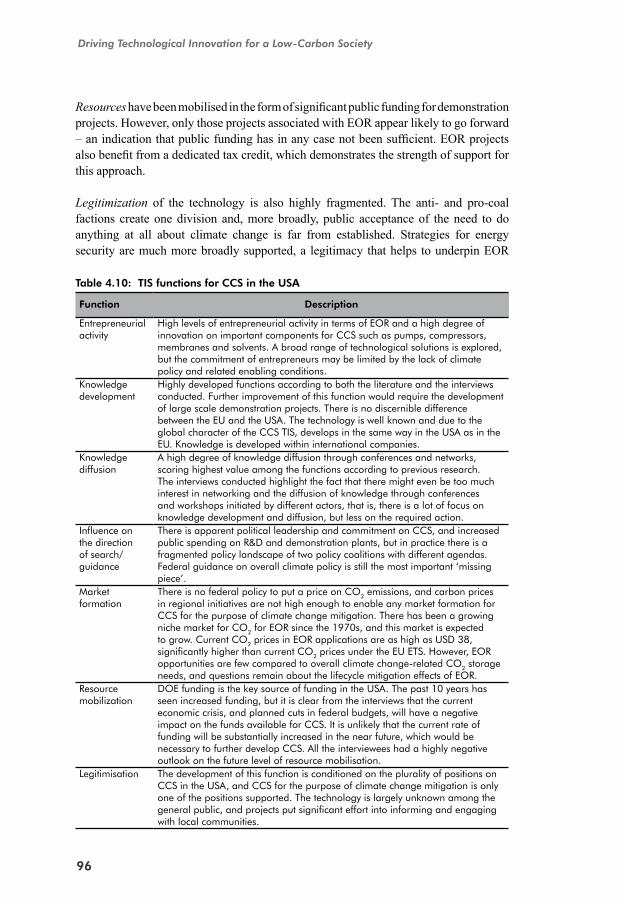
96
driving technological innovation for a Low-Carbon society
Resources have been mobilised in the form of significant public funding for demonstration projects. However, only those projects associated with EOR appear likely to go forward – an indication that public funding has in any case not been sufficient. EOR projects also benefit from a dedicated tax credit, which demonstrates the strength of support for this approach.
Legitimization of the technology is also highly fragmented. The anti- and pro-coal factions create one division and, more broadly, public acceptance of the need to do anything at all about climate change is far from established. Strategies for energy security are much more broadly supported, a legitimacy that helps to underpin EOR
Table 4.10: TIS functions for CCS in the USA
Function Description
Entrepreneurial activity
High levels of entrepreneurial activity in terms of EOR and a high degree of innovation on important components for CCS such as pumps, compressors, membranes and solvents. A broad range of technological solutions is explored, but the commitment of entrepreneurs may be limited by the lack of climate policy and related enabling conditions.
Knowledge development
Highly developed functions according to both the literature and the interviews conducted. Further improvement of this function would require the development of large scale demonstration projects. There is no discernible difference between the EU and the USA. The technology is well known and due to the global character of the CCS TIS, develops in the same way in the USA as in the EU. Knowledge is developed within international companies.
Knowledge diffusion
A high degree of knowledge diffusion through conferences and networks, scoring highest value among the functions according to previous research. The interviews conducted highlight the fact that there might even be too much interest in networking and the diffusion of knowledge through conferences and workshops initiated by different actors, that is, there is a lot of focus on knowledge development and diffusion, but less on the required action.
Influence on the direction of search/guidance
There is apparent political leadership and commitment on CCS, and increased public spending on R&D and demonstration plants, but in practice there is a fragmented policy landscape of two policy coalitions with different agendas. Federal guidance on overall climate policy is still the most important ‘missing piece’.
Market formation
There is no federal policy to put a price on CO2 emissions, and carbon prices in regional initiatives are not high enough to enable any market formation for CCS for the purpose of climate change mitigation. There has been a growing niche market for CO2 for EOR since the 1970s, and this market is expected to grow. Current CO2 prices in EOR applications are as high as USD 38, significantly higher than current CO2 prices under the EU ETS. However, EOR opportunities are few compared to overall climate change-related CO2 storage needs, and questions remain about the lifecycle mitigation effects of EOR.
Resource mobilization
DOE funding is the key source of funding in the USA. The past 10 years has seen increased funding, but it is clear from the interviews that the current economic crisis, and planned cuts in federal budgets, will have a negative impact on the funds available for CCS. It is unlikely that the current rate of funding will be substantially increased in the near future, which would be necessary to further develop CCS. All the interviewees had a highly negative outlook on the future level of resource mobilisation.
Legitimisation The development of this function is conditioned on the plurality of positions on CCS in the USA, and CCS for the purpose of climate change mitigation is only one of the positions supported. The technology is largely unknown among the general public, and projects put significant effort into informing and engaging with local communities.

97
stockholm environment institute
efforts. However, EOR projects will do little to contribute to the eventual legitimacy of geological storage in saline aquifers.
In many ways, it is the split between CCS for climate change mitigation and CCS for EOR that is most characteristic of the innovation system in the USA (Pollack et al., 2011). However, it is not clear whether this split functions as an inducement or a blocking mechanism to the development of the technology. EOR has clearly been important to the early lead in technology development and knowledge about CCS. In the absence of a climate vision or prospects for a carbon market, the business case for EOR has been essential to bringing CCS applications on line. Knowledge has been gained about the costs of CO2 transportation and injection, and a market value for CO2 has been created.
However, should CCS for EOR become the dominant framing, this may serve to block the development of the technology for climate mitigation purposes. Enabling legislation in terms of regulation of storage may not be developed, as the legislation that exists is predominantly focused on EOR. As in the European case, interviewees point out that uncertainty about long-term storage liability is a key blocking mechanism.
The Legitimacy of CCS as a mitigation tool may also be undermined, as there are divergent views about whether CCS for EOR produces any climate benefit. According to Pollak (2011), roughly 0.75 tonnes of additional CO2 is emitted by the eventual combustion of oil recovered by one tonne of CO2 injected.37 Whether the CO2 from the oil should be allocated to the EOR process or whether it would have been extracted and emitted anyway at a higher price or from a different well is a matter of debate, and depends on where system boundaries are drawn. However, one view is that unless oil from an EOR project replaces energy with higher CO2 emissions, the net effect is negative (Jaramillo et al., 2009). It is certainly clear that much EOR today uses CO2 extracted from fossil deposits rather than from combustion processes, and hence provides no benefit.
Finally, the role of EOR demonstration projects must be examined. As is indicated above, it appears that EOR is increasingly becoming a precondition for progress with planned projects. This marks out the technique as an inducement mechanism, but also limits the diversity of projects undertaken and therefore the potential for learning and technological progress. If scarce public funds are allocated only to EOR projects, this limitation will increase.
While it is possible to conclude that EOR is a favoured application in the USA, there appears to be no bias in terms of specific capture technologies. Although there appears to be less variety in capture technologies in future demonstration plants in the USA (see Table 4.8), existing commercial plants for EOR apply both pre- and post-combustion technologies (UD DOE, 2010c), and all three technologies are
37 Assuming all oil is in the end combusted (93% of all carbon in oil is combusted (Jaramillo et al., 2009)), and WTI oil wit density 0,874kg/l, energy content 4.3*10^7 J/Kg, and 7,5235tCO2/J each bbl emits 0,45tCO2

98
driving technological innovation for a Low-Carbon society
represented among operational pilot schemes (MIT CCS Database, 2011). The slight preference for pre-combustion technology and the relative dearth of projects that plan to use oxy-fuel technology in large scale facilities are not sufficient to draw any conclusions about political support.
Assessing the risks associated with CCS for the purpose of CO2 mitigation is, as in Europe, a matter of understanding uncertainties over costs, local public opinion, regulation and liability for future storage sites. However, a key difference exists between planned large scale CCS demonstration projects in the EU and those in the USA. In the USA, almost all projects rely on EOR, and without this extra income stream projects would not be developed at all. The risk management strategy is therefore different. In the EU, utility companies are hedging future climate policy. Given the even larger uncertainties in US climate policy, investors appear to be avoiding such risk entirely and taking on oil price risks through EOR revenues.
4.3.4 Assessment of US CCS policiesThe failure of Waxman-Markey, which had significant industry and NGO support, was a major setback for US climate policy and thus for market prospects for CCS. In some ways, it was also an attempt to create a market-based system that would pre-empt regulation by the EPA, which is now being strongly opposed by the power industry. Nonetheless, Clean Air Act permit processes may eventually create a market for emissions reduction technologies – including CCS. The extent to which these permits will actually limit CO2 emissions is unclear, and the development of these regulations has been put under heavy political pressure, despite the protection from the courts. This may place de facto political limits on the EPA’s ambitions.
Although highly uncertain, the possibility of future stringent regulation of CO2 emissions has influenced decision making on planning for new coal power (Stephens, 2009), slowing movement from planning to commissioning and construction. Thus, although 2010 brought more coal-fired electricity online in the USA than had been seen since mid-1980s, it is likely that the amount would have been even greater if it were not for state level political initiatives to limit new coal power. This trend has been compounded by the glut of natural gas, leading some forecasters to project a long-term trend of fuel switching from coal to gas in the US electricity sector (e.g. IEA, 2011a).38
There has been consistent support for CCS from the executive branch and particularly the DOE. However, it is clear that the agenda is tightly coupled with that of security of supply, including the continued use of domestic coal reserves and increasing use of oil reserves through EOR, rather than climate change mitigation. In total, the DOE budget for R&D on coal technology has increased significantly; in 2009 it was USD 648 million. However, these funds are for all types of advanced coal rather than for CCS alone (Stephens, 2009). Overall, the level of stimulus funding dedicated to
38 E.g. IEA’s Golden Age of Gas Scenario (WEO-2011); Black and Veatch 2010, cited in http://green.blogs.nytimes.com/2010/12/06/a-crystal-ball-for-electricity/; ,

99
stockholm environment institute
CCS in 2009 was comparable to that in the EU and, like the EU, the USA aims to establish some five to ten demonstration project in the next five years (in the USA, the target is 2016 rather than 2015).
However, FutureGen has still not been built 10 years after its initiation and, having been restructured several times, the future of this flagship project is in doubt. Several other setbacks occurred in 2007–2008, when a number of high-profile projects were either cancelled or postponed (van Alphen et al., 2010b). The key problem has been lack of funding. The prospects in terms of larger-scale CCS projects for the purpose of climate change mitigation are generally highly negative and, as in Europe, there is still no large scale CCS coal power project in operation.
Furthermore, the interviews conducted for this case study highlight that all the projects in the USA, both existing and under development, are conditional on revenues from EOR. Indeed, the inventory of projects made by a recent report by the Obama taskforce confirms that the vast majority of the projects supported are happening due to EOR (US DOE, 2010c), and that large-scale demonstration for the purpose of climate change mitigation is still not being pursued.
4.3.5 Concluding remarks Current federal and state legal frameworks are adequate for the envisaged five to ten demonstration and commercial (in combination with EOR) projects (US DOE, 2010c). Current levels of funding are also enough to realise at least a share of this initial set of projects. However, this model for demonstration, and the regulatory frameworks that facilitate EOR, will not be enough to support the development of CCS for the purpose of climate change mitigation on a large scale.
Given the significant amount of CO2 in EOR applications, this approach could play a role in climate mitigation. Realizing this potential would require the separate policy agendas for EOR and climate change to merge, including a new set of regulations to ensure the integrity of long term storage, and establishing a lifecycle assessment that addresses secondary emissions from oil combustion. Such a merger is extremely unlikely unless the USA develops an overall climate policy.

100
driving technological innovation for a Low-Carbon society
5. Cross-CAse AnALysis And disCussion
In this report, the 3C-SEI research programme has focused on policy mechanisms to stimulate the development of low-carbon technologies, in particular carbon capture
and storage (CCS) and solar photovoltaics (PV), two quite different technology groups that are among those identified as likely to play an important role in climate change mitigation (e.g. IEA 2010c; McKinsey & Company, 2009). Case studies considered these technologies in Europe and the USA. The EU is the leading market for PV today and an important player in PV development. The USA is a key player in PV innovation and has significant solar resources that remain largely untapped. Both regions are also important for the development and demonstration of CCS. Shorter case studies considered China’s role in the development and deployment of solar PV, especially as a major supplier of solar PV cells, as well as India’s ambitious plans and unique conditions for deployment. This section revisits the analytical questions posed in Chapter 1 in the light of the findings of the case studies.
5.1 What are the barriers to and drivers of innovation in the respective innovation system?
The four case studies presented in this report describe a number of barriers that constrain deployment of and innovation in PV and CCS technologies. A primary barrier to deployment, and the key reason for the need for further technological development, is the high costs, and the associated risks and financing barriers, that constrain the deployment of both PV and CCS in Europe and the USA. Achieving cost reductions is a major research priority for PV suppliers globally. Increased international competition provides potential for such cost reductions.
The costs of solar PV are coming down rapidly – particularly for the panels themselves – and grid parity is likely to be achieved this decade in key, high-insolation areas of both the USA and the EU. Nonetheless, further developments are critical to drive down the costs of ‘balance of system’ (BoS) components and attain a net cost below fossil-generated electricity for much wider sections of both continents and the globe.
Barriers to PV technology development and deployment include:
• the diminishing public support for feed-in tariffs in Europe;
• the difficulty of establishing the level of feed-in tariffs and similar support mechanisms – too high tariffs do not stimulate enough technological development but too low tariffs, in particular if they are changed too abruptly, will cause difficulties for the PV companies;
• the lack of progress in enabling technologies such as batteries and energy management;

101
stockholm environment institute
• the absence of a grid infrastructure that can effectively integrate with technologies such as PV, for which the amounts of energy supplied will vary;
• the lack of R&D funding; and,
• administrative issues that create barriers to deployment.
It is obvious that electricity generation from coal with carbon capture will always be substantially more costly than conventional electricity generation from coal without carbon capture. Relatively ambitious levels of carbon pricing will therefore be a crucial element of the governance of CCS.
With respect to CCS as a tool for emissions reduction, the EU and the USA have arrived at a similar place via different routes: in the valley of death where component technologies are mature and large-scale demonstration is necessary. Both have made public funding available to address this problem, and in both cases this funding is judged to be insufficient by many project developers. In both cases the lack of legislation governing storage and liability is a barrier. In both cases there are uncertainties over long-term market formation. Yet, the prospects for a policy-driven market are much dimmer in the USA, and this may result in the US innovation system turning away from climate mitigation and developing CCS solely as a technology for enhanced oil recovery. This will mean that the applications needed to demonstrate abatement in the power sector will not be prioritised.
The key challenge for CCS is to enable demonstration projects. Barriers to such projects include:
• the limited commitment to climate change mitigation targets (in particular in the USA);
• public opposition to pilot projects, in particular on-shore projects;
• the lack of certainty about long-term liability; and,
• insufficient piloting and demonstration funding.
According to the International Energy Agency, the USA is the country that has invested the most in R&D for solar PV and CCS. However, while this may be true on an absolute basis, Table 5.1 shows that, as a fraction of GDP, the investment by Germany, France, Italy and Spain in solar R&D all exceed that of the USA. Furthermore, in Europe there is not only national R&D support but also support funded through the European Commission.
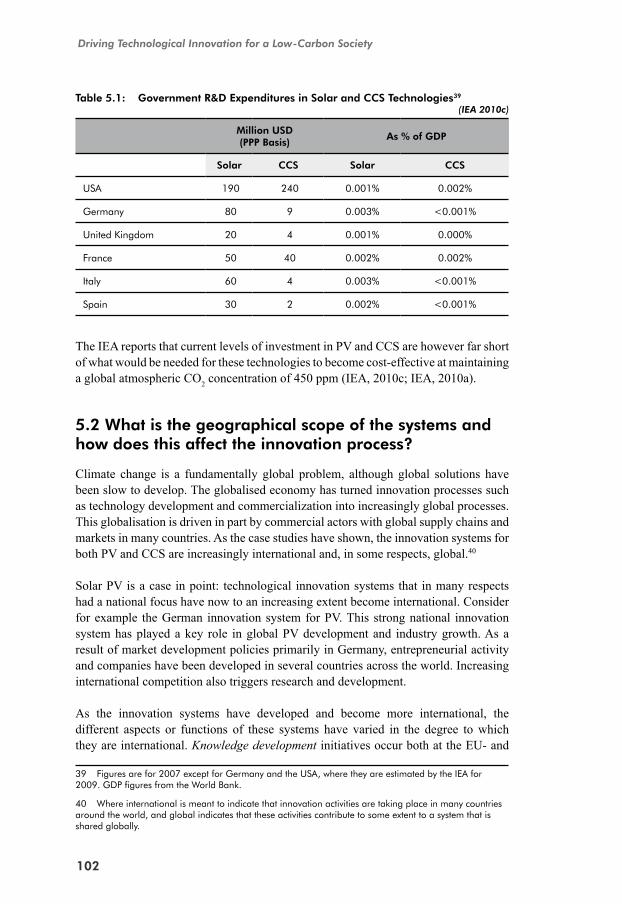
102
driving technological innovation for a Low-Carbon society
Table 5.1: Government R&D Expenditures in Solar and CCS Technologies39
(ieA 2010c)
Million USD (PPP Basis)
As % of GDP
Solar CCS Solar CCS
USA 190 240 0.001% 0.002%
Germany 80 9 0.003% <0.001%
United Kingdom 20 4 0.001% 0.000%
France 50 40 0.002% 0.002%
Italy 60 4 0.003% <0.001%
Spain 30 2 0.002% <0.001%
The IEA reports that current levels of investment in PV and CCS are however far short of what would be needed for these technologies to become cost-effective at maintaining a global atmospheric CO2 concentration of 450 ppm (IEA, 2010c; IEA, 2010a).
5.2 What is the geographical scope of the systems and how does this affect the innovation process?
Climate change is a fundamentally global problem, although global solutions have been slow to develop. The globalised economy has turned innovation processes such as technology development and commercialization into increasingly global processes. This globalisation is driven in part by commercial actors with global supply chains and markets in many countries. As the case studies have shown, the innovation systems for both PV and CCS are increasingly international and, in some respects, global.40
Solar PV is a case in point: technological innovation systems that in many respects had a national focus have now to an increasing extent become international. Consider for example the German innovation system for PV. This strong national innovation system has played a key role in global PV development and industry growth. As a result of market development policies primarily in Germany, entrepreneurial activity and companies have been developed in several countries across the world. Increasing international competition also triggers research and development.
As the innovation systems have developed and become more international, the different aspects or functions of these systems have varied in the degree to which they are international. Knowledge development initiatives occur both at the EU- and
39 Figures are for 2007 except for Germany and the USA, where they are estimated by the IEA for 2009. GDP figures from the World Bank.
40 Where international is meant to indicate that innovation activities are taking place in many countries around the world, and global indicates that these activities contribute to some extent to a system that is shared globally.

103
stockholm environment institute
the US-wide level as well as on a national scale, although regional clusters also play an important role. Privately as well as publicly funded PV research can be found in most advanced countries. Companies have been developed in several countries and the function entrepreneurial activity has increasingly become more international, with production as well as research located in several different countries. It could be argued that the legitimacy of PV as an energy technology has also been broadly globalised, as more actors see concrete benefits from the development of PV. Entrepreneurial activity in the PV sector has been strong, and there have been many opportunities to find commercial niches, primarily driven by demand in Europe. Significant resources have been mobilised – public equity and bank capital in the EU, private equity and venture capital in the USA, and industrial investment in China – where all actors see an opportunity to benefit.
However, the least globalised aspect of the innovation system is market formation. The main markets have long been in Europe. Here, policies at the EU level influence the overall direction of search although market formation is primarily driven by national market pull policies. As companies in different parts of the world primarily target this market, the research focus of companies in different countries around the world is broadly similar.
Still, some geographical variation can be identified in the global PV research as well as in the technological focus of PV suppliers. These differences can generally be characterised as a useful specialisation rather than negative fragmentation, as different actors push different elements of the technology in a way that serves the overall objective of reducing costs, improved functionality and increased deployment. In general, this specialisation is driven by the dominant policy orientation in the geographical areas studied:
• a strong political focus in the EU on PV deployment and market formation, which has to some extent favoured research on mature technologies such as crystalline PV and the development of entire PV systems solutions, although other PV technologies and research are also supported directly;
• a political focus in the USA primarily on R&D, supporting investment in and research on newer technologies and applications; and,
• a political focus in China on export opportunities, driving the expansion of low-cost module production.
Although both EU and US research grants finance all kinds of PV technologies, access to the markets created by deployment policy has led German companies to focus on the more mature crystalline PV technologies, linked to the strong focus on market development in Germany, from a very early stage of technology development. Chinese suppliers, which are also seeking to meet immediate market demand, have also favoured crystalline PV technology. Within these technologies, suppliers have differentiated based on cost (where China is the leader) and reliability (were German

104
driving technological innovation for a Low-Carbon society
and US companies are so far perceived as leaders). Furthermore, many European suppliers indicate that they will be focusing on tailor-made system solutions adjusted to fit the client’s needs.
Thus, rather than being a product of technology favouritism, these differences seem to reflect the broader political orientations of the EU and the USA, with the former focused more on deployment and targets for installed capacity than the latter, which is instead primarily promoting R&D and the achievement of lower costs.
However, as market formation is still only limited to a small number of countries in which markets are also dependent on policies, a global industry has been left vulnerable to political decisions in just a few countries – a vulnerability that was exposed in the wake of the economic recession which began in 2008. It is crucial for new markets to develop if the industry and the technologies are to continue to grow. A global commitment to climate change mitigation would contribute significantly to the creation of more and bigger markets for PV technologies, at least in the long term.
For CCS, the development of the component technologies involved has been driven by commercial requirements in the food and beverage, chemical, and oil and gas industries, all of which are highly globalised. For the purposes of climate change mitigation, however, the essential step is to demonstrate the integration of these industrial technologies on a large scale, reducing costs and the cost of capital through ‘learning-by-doing’. Nonetheless, the prospects for global deployment benefit from the existence of global companies with competencies in mature technologies. Similarly, integrating the technologies into full scale demonstration plants will be led primarily by large global engineering companies, which have done a great deal to facilitate knowledge development and diffusion at the global level.
However, resource mobilization for the purposes of large-scale demonstration has not been a global process. The capital requirements for demonstration of CCS are very large (more than EUR 1 billion) and in practice only a few actors – large power companies, some industrial players and owners of oil and gas assets – have any incentive to undertake these demonstrations. This concentrates the risk of investing in CCS and creates a ‘first-mover disadvantage’ – as the first demonstration plants to be developed may not be as successful as the second and third generations. Governments have attempted to intervene with financial support, but even these significant commitments appear to be too small for the task, as evidenced by the recent cancellation of a CCS pilot in West Virginia due to the poor economics, as political commitment to climate change mitigation is currently not sufficient. A global effort to pool resources and share risks has thus far not emerged.
While technology supply resources are global, demand-side resources come from utilities and governments and have not yet been coordinated at the global level. The United Nations Framework Convention on Climate Change has initiated discussions about including CCS as an approved abatement technology

105
stockholm environment institute
for flexible mechanisms (such as the Clean Development Mechanism (CDM), and Joint Implementation (JI)), which might allow rich countries to finance CCS projects in developing economies, but this is still in the early stages of consideration. Market formation is built around the market for reductions in CO2, which, despite the Kyoto Protocol, has emerged at scale only in Europe, with smaller and more fragmented markets in parts of the USA, New Zealand and Australia. Legitimacy is also lacking, as the technology is generally poorly understood by the general public.
5.3 What policies have been used and how have they contributed to achieving innovations and deployment?
Policies that support research and market development have made a key contribution to the cost reductions achieved. However, the technologies are still more costly than conventional ones, and further governance measures will be needed to drive costs down.
It is often suggested that technology push policies should be used to support R&D in the early phases of technology development, while market development policies should be favoured in the later stages (e.g. IEA, 2010c). The solar PV case studies indicated higher emphasis on cost reductions through ‘technology push’ mechanisms in the USA, as a precursor to broader deployment. This is in contrast to the European approach which has emphasised deployment and driven cost improvements through economies of scale and learning-by-doing. The scale of the European effort has been dominant to date. Although costs have decreased drastically since the 1970s, the cost development of modules in the past decade seems to be more closely linked to the market situation rather than technological development. Increased globalization of the supply chain means that this is also the case in the USA as well as in other countries with PV supply. As the market matures, and support mechanisms are adjusted, technology-led cost reductions may become more visible.
As industries grow, more resources can be used to finance research. The availability of private capital varies, however, in part linked to market fluctuations. Furthermore, industry R&D often tends to focus on short term development issues rather than long term research goals. A balance between market support and support to research throughout the development of the technologies, with continued public support to research thus seems appropriate.
The development and deployment of technologies for climate change mitigation is inherently political, but the importance of letting the market choose which technologies succeed is often stressed. Broadly speaking, policy will be most cost-effective if it encourages a variety of technologies that can meet energy and environmental goals, and allows the market to choose the specific technologies based on their competitiveness. Nonetheless, technology-specific support measures may be needed to ensure a market for technologies that are not yet competitive.

106
driving technological innovation for a Low-Carbon society
As is mentioned in the case studies, policies such as feed-in tariffs that favour PV and other less mature energy technologies have proved highly effective at creating markets for these less mature technologies and stimulating innovation. More broad based policies are more suitable for encouraging the deployment of and innovation in more mature technologies. To ensure that cost reductions are achieved within the industry, however, the support provided to these technologies will need to be reduced over time. Policymakers therefore face many challenges when designing technology support. Although some variation in technological focus in different parts of the world has resulted from the policies, for example more focus on crystalline silicon technology in Germany and thin film in the USA as mentioned in the previous section, policies have in general been designed to favour all different PV technologies.
Policy on carbon capture also appears to be largely technology-neutral. While post-combustion technologies are more common and more mature, this reflects market preferences related to purely commercial applications rather than policy bias against pre-combustion or oxyfuel technologies. There has been some policy-driven movement towards the promotion of offshore storage, as local communities and authorities have rejected the location of storage sites near populations. However, rather than being linked to one technology regarded as better than the other, this appears to reflect political considerations related to public opinion as offshore storage is likely to be more complicated, more costly and more limited. Storage in oil and gas reservoirs – and potentially coal beds from which methane has been extracted – is commercially advantageous because of the revenues associated with enhanced fossil fuel extraction. As would be expected, these storage sites have been the most attractive options for project developers, a result that is entirely in line with market logic. However, as a result, US legislation regulating carbon storage has been designed specifically for EOR projects, further disadvantaging saline aquifer storage. Once again this appears to be a policy distortion rather than a case of ‘picking winners’.
The long term economic benefits of low-carbon technology are well established and a strong economic case has been made for investing in climate change mitigation technologies to avoid the tremendous costs of climate change (Ackerman and Stanton, 2011; Stern, 2007), but governments still often struggle with goal conflicts when trying to achieve short term economic targets and long term, global targets on matters such as climate change. Both solar PV and CCS development would benefit from a global commitment to climate change mitigation. In addition, solar PV also benefits from targets of switching to renewable energy sources, for the sake of energy security. Further, solar PV has also benefitted from targets to create economic growth and create jobs. The recent IPCC Special Report on Renewables for example, cites solar PV as the energy technology with the greatest potential for job creation, with the potential to create approximately 0.87 job-years per GWh created (the next best is concentrating solar power with 0.23 job-years per GWh) (IPCC, 2011). It is clear that both the European Commission and the US government see such targets as a major reason to focus on renewable energy technologies. Using this logic, many US states have framed their RPS and other policies on the promotion of renewable energy as beneficial for economic development, specifically in terms of in-state job

107
stockholm environment institute
creation driven by the development of new energy sources (Jäger-Waldau, 2010). The US government has estimated significant job creation associated with the American Recovery and Reinvestment Act.
The European Commission also believes that renewable energy technologies have the potential to create economic growth and jobs (CEC, 2011a). According to an EC Communication, the industry currently employs over 1.5 million people and could by 2020 employ nearly 3 million more. The EU PV Platform (2009) estimates that the global PV industry has grown by on average 25 per cent annually over the past two decades and grew by around 50 per cent per year between 2003 and 2008. It states that in Germany between 2000 and 2008, employment in the PV sector rose from 1500 to 30,000, and that the PV industry has the potential to create more than 200,000 jobs in the EU by 2020 and ten times as many worldwide.
Concerns are raised both in the USA and in Europe about the increasing international competition, leading to suggestions such as the Italian one to increase feed-in tariff levels for solar PV installations that primarily use European suppliers. In a similar way, some government agencies in the USA (e.g. the US Department of Defense) have specified requirements that panels must be made domestically – specifications designed to boost domestic employment but which may fall foul of international trade rules. While such suggestions may be positive for domestic economic growth and job creation, it is not clear that they are ideal for technology development. They are also highly controversial. However, BSW Solar (2011) for example point out that although a large part of the solar cells installed in Germany are imported, around 10 billion of the value added in 2010 remained in Germany and the PV industry created around 133,000 full time jobs in Germany in 2010.
Industry policy has also had positive effects on PV market formation and industry growth also in other countries For example, the downturn in the markets of Europe linked to the economic recession in 2008 led to an oversupply in the Chinese PV industry, which was one of the reasons behind a number of market formation initiatives in China to ensure markets for the growing Chinese PV industry.
For CCS, jobs will be created in research and in the engineering of demonstration plants in the development and demonstration phase. From an EU perspective, there is some potential to develop export strength in CCS technologies, although the companies leading the market are very much global firms and many of the jobs created if CCS spreads globally will be in implementation in other countries. Overall, however, CCS plants will always be inherently more costly than the same plants without capture and storage. While climate change mitigation as a whole can be justified economically (e.g. Stern, 2007; Ackerman and Stanton, 2011), it is unlikely that CCS will promote growth or job creation per se, since the initial macroeconomic impact of the technology will increase electricity prices. It should be emphasised that this assessment is valid from the perspective of CCS for the purpose of CO2 mitigation. From the perspective of enhanced oil recovery, CCS is already commercially viable under certain conditions, and entrepreneurial activity and innovation may offer the prospect of a growth industry.

108
driving technological innovation for a Low-Carbon society
In the long-term, CCS will depend on the creation of carbon markets. Here, as in PV, it is clear that European climate policy initiatives are playing an outsized role. US regulation is fragmented. While recent US administrations have stated that ‘clean coal’ is an important element of the future US energy supply, no federal policy on either climate change or permanent storage of CO2 has emerged (IEA, 2011b). US CCS actors are looking increasingly to Europe, where the development of a long-term carbon market appears more likely. European investors, however, face uncertainty over the long-term level of carbon prices, which are affected by the prospects for global action. Plans for a carbon market in Australia, which has been a leading country in CCS development, may support gradual globalization of the market for the technology but for now, as with PV, a dangerous level of dependency on European policy may hinder the technology’s development.

109
stockholm environment institute
6. referenCes
Ackerman, F. and Stanton, E. (2011) Climate Risks and Carbon Prices: Revising the Social Cost of Carbon. Economics for Equity and the Environment Network.
van Alphen, K., Hekkert, M. P. and Turkenburg, W. C. (2010a) Accelerating the deployment of carbon capture and storage technologies by strengthening the innovation system. International Journal of Greenhouse Gas Control 4: 396-409.
van Alphen, K., Noothout, P. M., Hekkert, M. P. and Turkenburg, W. C. (2010b) Evaluating the development of carbon capture and storage technologies in the United States. Renewable and Sustainable Energy Reviews 14: 971–986.
Alvarez, P., and Hodges, B. (2009) Buying into Solar: Rewards, Challenges, and Options for Rate-based Investments. Public Utilities Fortnightly, December.
American Energy Innovation Council (2010) A Business Plan for America’s Clean Energy Future. American Energy Innovation Council, the Bipartisan Policy Center, and the ClimateWorks Foundation.
Archibugi, D. and Iammarino, S. (2002) The Globalization of Technology and National Policies. In: D. Archibugi and B-Å. Lundvall (Eds.), The Globalizing Learning Economy. Oxford, UK: Oxford University Press.
Archibugi, D. and Michie, J. (1995) The globalisation of technology: a new taxonomy. Cambridge Journal of Economics. 19: 121-140.
Asheim, B. and Gertler, M. (2006) The Geography of Innovation: Regional Innovation Systems. In: J. Fagerberg, D. Mowery, R. Nelson (Eds.), The Oxford Handbook of Innovation. Oxford, UK: Oxford University Press.
Aycaguer, A.-C., Lev-On, M. and Winer, A. M. (2001) Reducing Carbon Dioxide Emissions with Enhanced Oil Recovery Projects: A Life Cycle Assessment Approach. Energy & Fuels 15 (2): 303-308.
Azar, C., Lindgren, K., Larson, E., Möllersten, K. (2006) Carbon capture and storage from fossil fuels and biomass - Cost and potenital role in stabalizing teh atmosphere. Climatic Change.
Bache, I. and Flinders, M. (Eds.) (2004) Multi-level governance and environmental policy. Oxford, UK: Oxford University Press.
Bergek, A. and Jacobsson, S. (2010) Are tradable green certificates a cost-efficient policy driving technical change or a rent-generating machine? Lessons from Sweden 2003-2008. Energy Policy. 38: 1255-1271.
110
driving technological innovation for a Low-Carbon society
Bergek, A., Jacobsson, S., Carlsson, B., Lindmark, S. and Rickne, A. (2008) Analyzing the functional dynamics of technological innovation systems: A scheme of analysis. Research Policy, 37: 407-429.
Bolinger, M. (2009) Financing Non-residential Photovoltaic Projects: Options and Implications. Berkeley, CA: Ernest Orlando Lawrence Berkeley National Laboratory and National Renewable Energy Laboratory, January.
Bolinger, M., Wiser, R. and Darghouth, N. (2010) Preliminary Evaluation of the Impact of the Section 1603 Treasury Grant Program on Renewable Energy Deployment in 2009. Berkeley, CA: Ernest Orlando Lawrence Berkeley National Laboratory and National Renewable Energy Laboratory, April.
Bony, L., Doig, S. Hart, C., Maurer, E. and Newman, S. (2010) Achieving Low-Cost Solar PV: Industry Workshop Recommendations for Near-Term Balance of System Cost Reductions. Rocky Mountain Institute.
Breyer, C., Gerlach, A., Mueller, J., Behacker, H. and Milner, A. (2009) Grid-Parity analysis for EU and US regions and market segments - Dynamics of grid-parity and dependence on solar irradiance, local electricity prices and PV progress ratio. In: Proceedings of the 24th European Photovoltaic Solar Energy Conference, Hamburg, Germany.
BSW Solar (2011) Statistic data on the German solar power (photovoltaic) industry. German Solar Industry Association (BSW-Solar), June 2011. http://www.solarwirtschaft.de/
Bugge, L. and Salvesen, F. (2011) National Survey Report of PV Power Applications in Norway 2010. International Energy Agency Co-operative Programme on Photovoltaic Power Systems. Task 1. Exchange and dissemination of information on PV power systems.
California Carbon Capture and Storage Review Panel (2010) Findings and Recommendations by the California Carbon Capture and Storage Review Panel.
Campoccia, A., Dusonchet, L., Telaretti, E. and Zizzo, G. (2009) Comparative analysis of different supporting measures for the production of electrical energy by solar PV and Wind systems: four representative European cases. Solar Energy 83, 287–297.
Candelise, C., Spiers, J. and Gross, R. (2011) Materials availability for thin film (TF) PV technologies development: a real concern? ICEPT Working Paper. Imperial College Centre for Energy Policy and Technology.

111
stockholm environment institute
Cansino, J., Pablo-Romero, M., Román, R. and Yñiguez, R. (2010) Tax incentives to promote green electricity: An overview of EU-27 countries. Energy Policy. 38(10): 6000-6008.
Cantwell, J. (2006) Innovation and Competitiveness. In: J. Fagerberg, D. Mowery, R. Nelson (Eds.), The Oxford Handbook of Innovation. Oxford, UK: Oxford University Press.
Carley, S. (2009) State renewable energy electricity policies: An empirical evaluation of effectiveness. Energy Policy 37 (8): 3071-3081.
Carley, S. (2011a) Decarbonization of the U.S. electricity sector: Are state energy policy portfolios the solution? Energy Economics 33 (5): 1004-1023.
Carley, S. (2011b) The Era of State Energy Policy Innovation: A Review of Policy Instruments. Review of Policy Research 28 (3): 265-294.
Carlsson, B. and Stankiewicz, R. (1991) On the nature, function and composition of technological systems. Journal of Evolutionary Economics 1: 93-118.
CEC (2005) Winning the Battle Against Global Climate Change. COM(2005) 35 final. Brussels, European Commission.
CEC (2007) Sustainable power generation from fossil fuels: aiming for near-zero emissions from coal after 2020. COM(2006) 843 final. Brussels, European Commission.
CEC (2008) Commission staff working document. Accompanying document to the proposal for a Directive of the European Parliament and of the Council on the geological storage of carbon dioxide and amending Council Directives 85/337/EEC, 96/61/EC, Directives 2000/60/EC, 2001/80/EC, 2004/35/EC, 2006/12/EC and Regulation (EC) No 1013/2006. Impact assessment. Brussels, European Commission.
CEC (2009a) 2009 Technology Map of the European Strategic Energy Technology Plan (SET-Plan). Part – I: Technology Descriptions. JRC Scientific and Technical Reports. Brussels, European Commission.
CEC (2009b) Directive 2009/31/EC of the European parliament and of the council of 23 April 2009 on the geological storage of carbon dioxide. Brussels, European Commission.
CEC (2009c). Directive 2009/29/EC of the European Parliament and of the council of 23 April 2009 amending Directive 2003/87/EC so as to improve and extend the greenhouse gas emission allowance trading scheme of the Community.

112
driving technological innovation for a Low-Carbon society
CEC (2010) Energy 2020. A strategy for competitive, sustainable and secure energy. COM (2010) 639 final. Brussels, European Commission.
CEC (2011a) Renewable Energy: Progressing towards the 2020 target. COM(2011) 31 final. Brussels, European Commission.
CENER (2011). http://www.cener.com/es/energia-solar-fotovoltaica/index.asp
Claes, D. H. and Frisvold, P. (2009) CCS and the European Union: magic bullet of pure magic? In Meadowcroft, J. and Langhelle, O. (Eds.): Chaching the carbon - The politcs and policy of carbon capture and storage. Cheltenham, UK: Edward Elgar Publishing Limited.
Colatat, P., Vidican, G. and Lester, R. (2009) Innovation Systems in the Solar Photovoltaic Industry:The Role of Public Research Institutions. Working Paper. Industrial Performance Center, Massachusetts Institute of Technology.
Cory, K., Coughlin, J. and Coggeshall, C. (2008) Solar Photovoltaic Financing: Deployment on Public Property by State and Local Governments. Technical Report NREL/TP-670-43115. National Renewable Energy Laboratory, US Department of Energy, Office of Energy Efficiency and Renewable Energy.
Dai, Y., Shi, Z. and Xi, X. (1999) Technological innovation of the Chinese photovoltaic industry. Prepared for the Center for the Integrated Study of the Human Dimensions of Global Change, Carnegie Mellon University.
Delmas, M. A. and Montes-Sancho, M. J. (2011) U.S. state policies for renewable energy: Context and effectiveness. Energy Policy 39 (5): 2273-2288.
Dijk, M., Kemp, R. and Valkering, P. (2011) Incorporating social context and co-evolution in an innovation diffusion model – with an application to cleaner vehicles. Journal of Evolutionary Economics. August.
Dosi, G. (1982) Technological paradigms and technological trajectories. A suggested interpretation of the determinants and directions of technical change. Research Policy 11: 147-162.
Dusonchet, L. and Telaretti, E. (2010) Economic analysis of different supporting policies for the production of electrical energy by solar photovoltaics in western European Union countries. Energy Policy 38: 3297-3308.
EACI (2009) Renewable energy in buildings. Make your building smile. Project report. Renewable Energy. 25 Projects funded by the Intelligent Energy Europe Programme. Executive Agency for Competitiveness and Innovation of the European Commission (EACI).

113
stockholm environment institute
ECF (2010) Roadmap 2050. A practical guide to a prosperous, low-carbon Europe. European Climate Foundation.
Edquist, C. (2002) Innovation Policy - A Systemic Approach. In: D. Archibugi and B-Å. Lundvall (Eds.), The Globalizing Learning Economy. Oxford, UK: Oxford University Press.
Edquist, C. and McKelvey, M. (2000) Systems of Innovation: Growth, Competitiveness and Employment. Edward Elgar Publishing Limited. Cheltenham, UK.
EPIA (2009) SET for 2020, Solar Photovoltaic Electricity: A Mainstream power source in Europe by 2020, European Photovoltaic Industry Association.
EPIA (2010) Global market outlook for photovoltaics until 2014. May 2010 update. European Photovoltaic Industry Association.
EPIA (2011a). Solar Generation 6. Solar Photovoltaic Electricity Empowering the World. European Photovoltaic Industry Association.
EPIA (2011b). Solar Photovoltaics. Competing in the energy sector. On the road to competitiveness. European Photovoltaic Industry Association.
EPIA (2011c). Global market outlook for photovoltaics until 2015. European Photovoltaic Industry Association.
EREC (2011) http://www.erec.org/
Etzkowitz, H. (2003) Innovation in innovation: the Triple Helix of university-industry-government relations. Social Science Information. 42 (3): 293-337.
EurActiv (2007) EU renewable energy policy. http://www.euractiv.com/en/energy/eu-renewable-energy-policy-linksdossier-188269. Published 2007; updated 2011; retrieved 2011-08-11.
EU PV Platform (2009) Today’s actions for tomorrow’s PV technology. An Implementation Plan for the Strategic Research Agenda of the European Photovoltaic Technology Platform.
EU PV Platform (2010) Solar Europe Industry Initiative Implementation Plan 2010-2012.
Folger, P. (2010) Carbon Capture: A Technology Assessment. Congressional Reserach Service.

114
driving technological innovation for a Low-Carbon society
Fouquet, D and Johansson, T. (2008) European renewable energy policy at crossroads – Focus on electricity support mechanisms. Energy Policy 36: 4079-4092.
Foxon, T., and Pearson, P. (2008) Overcoming barriers to innovation and diffusion of cleaner technologies: some features of a sustainable innovation policy regime. Journal of Cleaner Production 16 (1, Supplement 1): S148-S161.
Fraunhofer ISE (2011) http://www.ise.fraunhofer.de/about-us
Freeman, C. and Louca, F. (Eds.) (2001) As Time Goes By. From the Industrial Revolution to the Information Revolution. Oxford University Press.
Frondel, M., Ritter, N., Schmidt, C. and Vance, C. (2010) Economic impacts from the promotion of renewable energy technologies: The German experience. Energy Policy. 38: 4048-4056.
Gallagher, K. S. and Diaz Anadon, L. (2011) DOE Budget Authority for Energy Research, Development, & Demonstration Database. Energy Technology Innovation Policy research group, Belfer Center for Science and International Affairs, Harvard Kennedy School.
Geels, F.W. (2004) From sectoral systems of innovation to socio-technical systems. Insights about dynamics and change from sociology and institutional theory. Research Policy 33: 897-920.Geels, F. and Raven, R. (2006) Non-linearity and Expectations in Niche-Development Trajectories: Ups and Downs in Dutch Biogas Development (1973-2003). Technology Analysis and Strategic Management. 18 (3-4): 375-392.
Glennon, R. (2011) Large-scale deployment depends on getting the policies right, overcoming siting barriers and winning support for solar on federal lands. Solar Today, April.
Global CCS Institute (2011) http://www.globalccsinstitute.com/
Gough, C.,Mander, S. and Haszeldine, S. (2010). A roadmap for carbon capture and storage in the UK. International Journal of Greenhouse Gas Control 4: 1–12.
Grubb, M. (2004) Technology Innovation and Climate Change Policy: an overview of issues and options. Keio Economics Studies 21 (2): 103-132.
GTM (2010) U.S. Solar Energy Trade Assessment 2010: Trade Flows and Domestic Content for Solar Energy-Related Goods and Services in the United States. A GTM Research Study. Prepared for Solar Energy Industries Association.
115
stockholm environment institute
Haas, R., Resch, G., Faber, T., Huber, C., Held, A. and Ragwitz, M. (2007) Lessons learned from recent promotion strategies for electricity from renewables. In Proceedings of ISES Solar World Congress 2007: Solar Energy and Human Settlement. pp. 2833 – 2837.
Haščič, I., Johnstone, N., Watson, F. and Kaminker, C. (2010) Climate Policy and Technological Innovation and Transfer: An Overview of Trends and Recent Empirical Results. Environment Working Paper. Paris: OECD.
Hekkert, M.P., Suurs, R.A.A., Negro, S.O., Kuhlmann, S. and Smits, R.E.H.M. (2007) Functions of innovation systems: A new approach for analysing technological change. Technological Forecasting & Social Change. 74 (413-432).
Henderson, R., and Newell, R.G. (2010) Accelerating Energy Innovation: Insights from Multiple Sectors. Harvard Business School Working Paper 10-067.
Hillman, K., Nilsson, M. and Magnusson, T. (2011) Fostering sustainable technologies: a framework for analysing the governance of innovation systems. Science and Public Policy 38 (5): 403-415.
IEA (2009) Technology Roadmap. Carbon capture and storage. Paris, IEA Publications.
IEA (2010a) Global Gaps in Clean Energy RD&D: Update and Recommendations for International Collaboration. IEA Report for the Clean Energy Ministerial. Paris, International Energy Agency.
IEA (2010b) Technology Roadmap. Solar photovoltaic energy. Paris, International Energy Agency.
IEA (2010c) Energy Technology Perspectives 2010: Scenarios & Strategies to 2050. Paris: International Energy Agency.
IEA (2010d) World Energy Outlook 2009. IEA Publications.
IEA (2010e) CO2 emissions from fuel combustion. Highlights. Paris, International Energy Agency.
IEA (2011a) World Energy Outlook 2011. Paris, International Energy Agency. IEA (2011b). Cabon Capture and Storage - Legal and Regulatory Review - Edition 2. Paris.
IEA PVPS (2011a) Trends in Photovoltaic Applications. Survey report of selected IEA countries between 1992 and 2010. IEA Photovoltaic Power Systems Programme. Report IEA-PVPS T1-20:2011.

116
driving technological innovation for a Low-Carbon society
IEA PVPS (2001) Trends in Photovoltaic Applications in selected IEA countries between 1992 and 2000. IEA Photovoltaic Power Systems Programme. Report IEA-PVPS T1-10:2001.
IEA PVPS (2002) Trends in Photovoltaic Applications in selected IEA countries between 1992 and 2001. IEA Photovoltaic Power Systems Programme. Report IEA-PVPS T1-11:2002.
IEA PVPS (2003) Trends in Photovoltaic Applications. Survey report of selected IEA countries between 1992 and 2002. IEA Photovoltaic Power Systems Programme. Report IEA-PVPS T1-12:2003.
IEA PVPS (2004) Trends in Photovoltaic Applications. Survey report of selected IEA countries between 1992 and 2003. IEA Photovoltaic Power Systems Programme. Report IEA-PVPS T1-13:2004.
IEA PVPS (2005) Trends in Photovoltaic Applications. Survey report of selected IEA countries between 1992 and 2004. IEA Photovoltaic Power Systems Programme. Report IEA-PVPS T1-14:2005.
IEA PVPS (2006) Trends in Photovoltaic Applications. Survey report of selected IEA countries between 1992 and 2005. IEA Photovoltaic Power Systems Programme. Report IEA-PVPS T1-15:2006.
IEA PVPS (2007) Trends in Photovoltaic Applications. Survey report of selected IEA countries between 1992 and 2007. IEA Photovoltaic Power Systems Programme. Report IEA-PVPS T1-16:2007.
IEA PVPS (2008) Trends in Photovoltaic Applications. Survey report of selected IEA countries between 1992 and 2007. IEA Photovoltaic Power Systems Programme. Report IEA-PVPS T1-17:2008.
IEA PVPS (2009) Trends in Photovoltaic Applications. Survey report of selected IEA countries between 1992 and 2008. IEA Photovoltaic Power Systems Programme. Report IEA-PVPS T1-18:2009.
IEA PVPS (2010) Trends in Photovoltaic Applications. Survey report of selected IEA countries between 1992 and 2009. IEA Photovoltaic Power Systems Programme. Report IEA-PVPS T1-19:2010.
IEA PVPS (2011a) Trends in Photovoltaic Applications. Survey report of selected IEA countries between 1992 and 2010. IEA Photovoltaic Power Systems Programme. Report IEA-PVPS T1-20:2011.

117
stockholm environment institute
IEA PVPS (2011b). PVPS Annual Report 2010: Implementing Agreement on Photovoltaic Power Systems. IEA Photovoltaic Power Systems Programme.
IES (2011). http://www.ies.upm.es/
IPCC (2005) IPCC Special Report on Carbon Dioxide Capture and Storage. Prepared by Working Group III of the Intergovernmental Panel on Climate Change. B. Metz, O. Davidson, H. C. de Coninck, M. Loos, and L. Meyer (Eds.). Cambridge University Press.
IPCC (2007) IPCC Fourth Assessment Report. Intergovernmental Panel on Climate Change, Geneva.
IPCC (2011) IPCC Special Report on Renewable Energy Sources and Climate Change Mitigation. O. Edenhofer, R. Pichs-Madruga, Y. Sokona and K. Seyboth (Eds.). Cambridge University Press.
Jacobsson, S., Andersson, B. and Bångens, L. (2002) Transforming the energy system – the evolution of the German technological system for solar cells. Electronic Working Paper Series, Paper No. 84. SPRU Science and Technology Policy Research. Sussex, UK.
Jacobsson, S. and Bergek, A. (2004).Transforming the energy sector: the evolution of technological systems in renewable energy technology. Industrial and Corporate Change, 13 (5): 815-849.
Jacobsson, S. and Lauber, V. (2006) The politics and policy of energy system transformation – explaining the German diffusion of renewable energy technology. Energy Policy. 34: 256-276.
Jaramillo, P., Griffin, W. M. and McCoy, S. T. (2009) Life Cycle Inventory of CO2 in an Enhanced Oil Recovery System. Environmental Science and Technology 43 (21): 8027–8032.
Johnstone, N., Haščič, I. and Popp, D. (2010) Renewable Energy Policies and Technological Innovation: Evidence Based on Patent Counts. Environmental and Resource Economics. 45 (1): 133-155.
Jäger-Waldau, A. (2009) Research, Solar Cell Production and Market Implementation of Photovoltaics. European Commission, DG Joint Research Centre, Institute for Energy, Renewable Energy Unit.
Jäger-Waldau, A. (2010) Photovoltaics Status Report 2010: Research, Solar Cell Production and Market Implementation of Photovoltaics. Luxembourg: Office for Official Publications of the European Union.

118
driving technological innovation for a Low-Carbon society
Jäger-Waldau, A. (2011) PV Status Report 2011. Research Solar Cell Production and Market Implementation of Photovoltaics. European Commission, DG Joint Research Centre, Institute for Energy, Renewable Energy Unit. Luxembourg: Office for Official Publications of the European Union. Kann, S. (2011) Does Grid Parity Matter? Greentechsolar, June 22. http://www.greentechmedia.com/articles/read/does-grid-parity-matter/.
Kemp, R., Schot, J. and Hoogma, R. (1998) Regime Shifts to Sustainability Through Processes of Niche Formation: The Approach of Strategic Niche Management. Technology Analysis & Strategic Niche Management. 10(2): 175-195.
Kennedy, K., Larsen, J., Bradbury, J., Forbes, S., Goodward, J. and Weischer, L. (2011) Submission to the U.S. Senate Committee on Energy and Natural Resources: Response to the Committee’s White Paper on a Clean Energy Standard. Washington D.C.: World Resources Institute.Klein, A., Merkel, E., Pfluger, B., Held, A, Ragwitz, M., Resch, G. and Busch, S. (2010) Evaluation of Different Feed-in Tariff Design Options - Best Practice Paper for the International Feed-in Cooperation, 3rd edition. Vienna, Austria and Karlsruhe, Germany: Energy Economics Group and Fraunhofer Institute Systems and Innovation Research.
Kline, S.J. and Rosenberg, N. (1986) An overview of innovation. In: Landau, R., Rosenberg, N. (Eds.), The Positive Sum Strategy: Harnessing Technology for Economic Growth. Washington, DC: National Academy Press.
Langhelle, O. and Meadowcroft, J. (2009) CCS in compariative perspective. In J. Meadowcroft and O. Langhelle (Eds.), Caching the carbon: The politics and policy of carbon capture and storage. Edward Elgar Publishing Limited.
Larsen, J., Kelly, A. and Heilmayr, R. (2009) WRI Summary of H.R. 2454, the American Clean Energy and Security Act (Waxman-Markey). Washington D.C.: World Resources Institute.
Lesser, J. and Su, X. (2008) Design of an economically efficient feed-in tariff structure for renewable energy deployment. Energy Policy. 36: 981-990.
Li, J., Wang, S., Zhang, M. and Ma, L. (2007) China Solar PV Report 2007, Beijing, China: Environmental Science Press.
van der Linden, N.H., Uyterlinde, M.A., Vrolijk, C., Nilsson, L.J., Khan, J., Åstrand, K. , Ericsson, K. and Wiser, R. (2005) Review of International Experience with Renewable Energy Obligation Support Mechanisms. Petten, The Netherlands: Energy Research Centre of the Netherlands.

119
stockholm environment institute
Lorenzoni, A. (2010) The Support Schemes for the Growth of Renewable Energy. IEFE – The Centre for Research on Energy and Environmental Economics and Policy at Bocconi University. Working Paper n. 33.
Lundvall, B-Å. (2002) Innovation Policy in the Globalizing Learning Economy. In: D. Archibugi and B-Å. Lundvall (Eds.), The Globalizing Learning Economy. Oxford: Oxford University Press.
Lundvall, B.-Å. (2004) National Innovation Systems – Analytical concept and development tool. Paper to be presented at the DRUID Tenth Anniversary Summer Conference 2005 on Dynamics of Industry and Innovation: Organizations, Networks and Systems. Copenhagen, Denmark, June 27-29, 2005.
Lundvall, B.-Å. (2010a) User-Producer Relationships, National Systems of Innovation and Internationalisation. In: B.-Å. Lundvall (Ed.): National Systems of Innovation: Toward a Theory of Innovation and Interactive Learning. Anthem Press.
Lundvall, B-Å. (Ed.) (2010b) National Systems of Innovation: Toward a Theory of Innovation and Interactive Learning. Anthem Press.
Lüthi, S. (2010) Effective deployment of photovoltaics in the Mediterranean countries: Balancing policy risk and return. Solar Energy 84 (1059-1071).
Magnusson, T. (2011) Governance of Innovation for Sustainable Transport. Hybrid-electric Vehicle Technology in Sweden 1990-2010. Project Report, Stockholm Environment Institute.
Malerba, F. (2006) Sectoral Systems: How and Why Innovation Differs across Sectors. In Fagerberg, J., Mowery, D., and Nelson, R. (Eds.), The Oxford Handbook of Innovation. Oxford: Oxford University Press.
Margolis, R., and Kammen, D. M. (1999) Underinvestment: The Energy Technology and R&D Policy Challenge. Science 285 (5428): 690 -692.
Margolis, R., and Zuboy, J. (2006) Nontechnical Barriers to Solar Energy Use: Review of Recent Literature. National Renewable Energy Laboratory, US Department of Energy, Office of Energy Efficiency and Renewable Energy.
Marigo, N., Foxon, T.J. and Pearson, P.J.G. (2010) Chinese low-carbon innovation:Developing technological capabilities in the solar photovoltaic manufacturing industry. Journal of Knowledge-based Innovation in China. 2 (3): 253-268.

120
driving technological innovation for a Low-Carbon society
Markusson, N.,Ishii, A., Stephens, J. C. (2011).The social and political complexities of learning in CCS demonstration projects. Global Environmental Change 21(2): 293-302.
Martinot, E. and Li, J. (2010) China’s latest leap: An update on renewables policy. Renewable Energy World. 13(4): 51-57.
McKinsey & Company (2009) Pathway to a Low-Carbon Economy. Version 2 of the Global Greenhouse Gas Abatement Cost Curve.
McKinsey & Company (2007) Reducing U.S. Greenhouse Gas Emissions: How Much at What Cost? U.S. Greenhouse Gas Abatement Mapping Initaive - Executive Report.
Meadowcroft, J. and Langhelle, O. (Eds.) (2009a) Caching the carbon: The politics and policy of carbon capture and storage. Edward Elgar Publishing Limited.
Meadowcroft, and J.Langhelle, O. (2009b) The Politics and policy of carbon capture and storage. In J. Meadowcroft and O. Langhelle (Eds.), Caching the carbon: The politics and policy of carbon capture and storage. Edward Elgar Publishing Limited.
Menanteau, P. (2000) Learning from Variety and Competition Between Technological Options for Generating Photovoltaic Electricity. Technological Forecasting and Social Change. 63: 63-80.
Menna, P., Gambi, R., Hercsuth, A., Gillett, W., Tondi, G. and Piontek, A. (2010) European Photovoltaic Actions and Research Programmes 2010. European Commission.
MIT CCS Database (2011) http://sequestration.mit.edu/
Nelson, R. (1995) Recent Evolutionary Theorizing About Economic Change. Journal of Economic Literature. 33(1): (48-90)
Nemet, G. (2008) Demand-pull energy technology policies, diffusion and improvements in California wind power. In Foxon, T., Köhler, J., and Oughton, C. (Eds), Innovations for a Low Carbon Economy. Economics, Institutional and Management Approaches.
Nemet, G. F. and Kammen, D. M. (2007) U.S. energy research and development: Declining investment, increasing need, and the feasibility of expansion. Energy Policy 35 (1): 746-755.
Nemet, G. F. (2009) Demand-pull, technology-push, and government-led incentives for non-incremental technical change. Research Policy. 38 (700-709).

121
stockholm environment institute
Neuhoff, K. (2005) Large-Scale Deployment of Renewables for Electricity Generation. Oxford Review of Economic Policy. 21(1): 88-110.
Nilsson, M., Varnäs, A., Kehler Siebert, C., Nilsson, L. J., Nykvist, B. and Ericsson, K. (2009) A European Eco-Efficient Economy. Governing climate, energy and competitiveness. Report for the 2009 Swedish Presidency of the Council of the European Union. Project Report, Stockholm Environment Institute.
NREL (2008) A Historical Analysis of Investment in Solar Energy Technologies (2000-2007). December. National Renewable Energy Laboratory, US Department of Energy, Office of Energy Efficiency and Renewable Energy.
NREL (2011) U.S. Solar Resource Maps. National Renewable Energy Laboratory, US Department of Energy, Office of Energy Efficiency and Renewable Energy. http://www.nrel.gov/gis/solar.html.
Nuur, C., Gustavsson, L. and Laestadius, S. (2009) Promoting Regional Innovation Systems in a Global Context. Industry and Innovation. 16(1): 123-139.
Nygaard, S. (2008) Co-Evolution of Technology, Markets and Institutions. The Case of Fuel Cells and Hydrogen Technology in Europe. Centre for Innovation, Research and Competence in the Learning Economy, Lund University. Lund, Sweden.
PCAST (2010) Report to the President on Accelerating the Pace of Change in Energy Technologies Through an Integrated Federal Energy Policy. President’s Council of Advisors on Science and Technology.
Pew Center (2008) Addressing Emissions From Coal Use in Power Generation. Congressional Policy Brief. Washington D.C., Pew Center on Global Climate Change
Pew Center (2011) Comparison of Electricity Portfolio Standard Provisions in Climate and Energy Legislation in the 111th Congress. Washington D.C., Pew Center on Global Climate Change.
Photon (2010) Solar modules 2010. Making the right decision. Photon, February 2010.
Pierre, J. and Peters, B. G. (2005) Governing Complex Societies. New York: Palgrave Macmillan.
Pollak, M., Phillips, S. J. and Vajjhala, S. (2011) Carbon capture and storage policy in the United States: A new coalition endeavors to change existing policy. Global Environmental Change 21(2): 313-323.

122
driving technological innovation for a Low-Carbon society
Porter, M. (1990) The Competitive Advantage of Nations. Harvard Business Review. March-April.
PV Group (2011) http://www.pvgroup.org/node/1291
PV Magazine (2011) http://www.pv-magazine.com/news/details_/beitrag/the-search-for-ways-against-a-fabless-europe_100002992/8/
REC Group (2011) http://www.recgroup.com/en/tech/rd/
Renewables International (2011) http://www.renewablesinternational.net/german-fits-for-pv-to-reman-unchanged-in-2011/150/510/31204/
REN21 (2011) Renewables 2011: Global Status Report. Renewable Energy Policy Network for the 21st Century.
Rickerson, Wilson, Florian Bennhold, and James Bradbury (2008) Feed-in Tariffs and Renewable Energy in the USA - a Policy Update. Raleigh, NC, USA; Berlin, Germany; and Washington, DC, USA: North Carolina Solar Center, Heinrich Boll Foundation, and World Future Council.
Sandén, B. and Azar, C. (2005) Near-term technology policies for long-term climate targets – economy wide versus technology specific approaches. Energy Policy. 33: 1557-1576.
Sandén, B. (2005) The economic and institutional rationale of PV subsidies. Solar Energy 78: 137-146.
SEIA (2010) U.S. Solar Market Insight. GTM Research for Solar Energy Industries Association.
SEMI (2011) China’s Solar Future: A Recommended China PV Policy Roadmap 2.0. 2011. SEMI, SEMI China PV Advisory Committee, and China PV Industry Alliance (CPIA).
Solar Industry (2011) Italy’s New Solar FITs: Doom And Gloom Or Key To Grid Parity? http://solarindustrymag.com/e107_plugins/content/content.php?content.7843
Solow, R., (1956) A contribution to the theory of economic growth. Quarterly Journal of Economics 70 (1), 65–94.
Šúri, M., Huld, T.A., Dunlop, E.D. and Ossenbrink, H.A. (2007) Potential of solar electricity generation in the European Union member states and candidate countries. Solar Energy 81: 1295-1305.

123
stockholm environment institute
von Stechow, C.,Watson, J. and Praetorius, B. (2011) Policy incentives for carbon capture and storage technologies in Europe: A qualitative multi-criteria analysis. Global Environmental Change 21(2): 346-357.
Stephens, J. C. (2009) Technology leader, policy laggard: CCS development for climate mitigation in teh US politicl context. In J. Meadowcroft and O. Langhelle (Eds.) Caching the carbon: The politics and policy of carbon capture and storage. Edward Elgar Publishing Limited.
Stephens, J. C.,Hansson, A., Liu, Y., De Coninck, H. And Vajjhala, S. (2011). Characterizing the international carbon capture and storage community. Global Environmental Change 21(2): 379-390.
Stephens, J. C. and Jiusto, S. (2010) Assessing innovation in emerging energy technologies: Socio-technical dynamics of carbon capture and storage (CCS) and enhanced geothermal systems (EGS) in the USA. Energy Policy 38: 2020-2031Stern, N. (2007) Stern Review: The Economics of Climate Change. Cambridge: Cambiridge University Press.
SVTC (2009). Toward a Just and Sustainable Solar Energy Industry. A Silicon Valley Toxics Coalition White Paper.
SVTC (2011) Solar Scorecard 2011. Silicon Valley Toxics Coalition (SVTC).
UNEP and Bloomberg New Energy Finance (2011) Global Trends in Renewable Energy Investment 2011. Frankfurt: Frankfurt School for UNEP and Bloomberg New Energy Finance.
US Congress (2005) Act to ensure jobs for our future with secure, affordable, and reliable energy. Public Law 109–58, 109th Congress.
US DOE (2009) The American Recovery and Reinvestment Act of 2009 (Recovery Act). http://fossil.energy.gov/recovery/index.html
US DOE (2010a) 2008 Solar Technologies Market Report. US Department of Energy. Energy Efficiency & Renewable Energy.
US DOE (2010b) $1/W Photovoltaic Systems: White Paper to Explore A Grand Challenge for Electricity from Solar. Washington D.C.: U.S. Department of Energy.
US DOE (2010c). Report of the Interagency Task Force on Carbon Capture and Storage.
US DOE (2011a) Database of State Incentives for Renewables & Efficiency. http://www.dsireusa.org.

124
driving technological innovation for a Low-Carbon society
US DOE (2011b). http://energy.gov/
US EIA (2011) Annual Energy Outlook 2011 with Projections to 2035.
Vann, A. (2010) The Federal Government’s Role in Electric Transmission Facility Siting. Washington, D.C.: Congressional Research Service.
Verspagen, B. (2006) Innovation and Economic Growth. In: J. Fagerberg, D. Mowery, R. Nelson (Eds.), The Oxford Handbook of Innovation. Oxford: Oxford University Press.
Vidican, G., Woon, W. L. and Madnick, S. (2009) Measuring Innovation Using Bibliometric Techniques: The Case of Solar Photovoltaic Industry. Working Paper CISL # 2009-05, April.
Waxman, H. (2009) H.R. 2454. A bill to create clean energy jobs, achieve energy independence, reduce global warming pollution and transition to a clean energy economy.
Weiss, C. and Bonvillian, W. B. (2009) Stimulating a Revolution in Sustainable Energy Technology. Environment, July-August.
Wilson, E., Zhang, D. and Zheng, L. (2009) The socio-political context for deploying CCS in China and the U.S. Global Environmental Change 21(2): 324-335.
Wiser, R., and Barbose, G. (2008) Renewables Portfolio Standards in the United States: A Status Report with Data Through 2007. Berkeley, CA: Ernest Orlando Lawrence Berkeley National Laboratory, April.
Wiser, R., Barbose, G. and Holt, E. (2010) Supporting Solar Power in Renewables Portfolio Standards: Experience from the United States. Berkeley, CA: Ernest Orlando Lawrence Berkeley National Laboratory.
Wissing, L. (2009) National Survey Report of PV Power Applications in Germany 2008. Version 2. International Energy Agency Co-operative Programme on Photovoltaic Power Systems. Task 1. Exchange and dissemination of information on PV power systems. Prepared on behalf of BMU – German Federal Ministry for the Environment, Nature Conservation and Nuclear Safety.
Wissing, L. (2011) National Survey Report of PV Power Applications in Germany 2010. International Energy Agency Co-operative Programme on Photovoltaic Power Systems. Task 1. Exchange and dissemination of information on PV power systems. Prepared on behalf of BMU – German Federal Ministry for the Environment, Nature Conservation and Nuclear Safety.

125
stockholm environment institute
WRI (2010) The Bottom Line on Renewable Energy Tax Credits. Washington, D.C.: World Resources Institute.
Q-Cells (2011) http://www.q-cells.com/
Yang, C.-J. (2010) Reconsidering solar grid parity. Energy Policy 38: 3270-3273.
Yang, M. and Pan, R. (2010). Harvesting sunlight solar photovoltaic industry in China, in EAI Background Brief No. 562. East Asian Institute, National University of Singapore.
Yin, H., and Powers, N. (2010) Do state renewable portfolio standards promote in-state renewable generation? Energy Policy 38 (2): 1140-1149.
Zhu, L. (2004) Made in China: PV manufacturing breaks new ground. Renewable Energy World. 7(1): 70-85.
Ziman, J, (Ed.) (2000). Technological Innovation as an Evolutionary Process. Cambridge: Cambridge University Press.
Zweibel, K., Mason, J. and Fthenakis, V. (2008) A Solar Grand Plan. Scientific American.

Stockholm Environment InstituteSEI is an independent, international research institute. It has been engaged in environment and development issues at local, national, regional and global policy levels for more than a quarter of a century. SEI’s goal is to support decision making for sustainable development by bridging science and policy.
Technological change is crucial for reducing emissions of greenhouse gases. Some of the technologies needed to achieve a low carbon society are ready to implement now, while others need further development and cost reductions to become affordable, attractive, and scalable alternatives. The long term economic case for investing in climate mitigation technologies is strong and well-established, and some economic benefits (e.g. technology sales, jobs) can be realized in the short term. This study, which has been carried out within the partnership between SEI and the business leaders’ initiative 3C (Combat Climate Change), uses the technological innovation systems framework to analyse and describe innovations in solar PV and CCS in the USA and Europe. The study maps the actors and policies relevant to these technologies using a literature review and interviews.
ISBN: 978-91-86125-38-7
sei-international.org
Annika Varnäs works as a Research Fellow at SEI Stockholm and is coordinating the SEI work within the 3C-SEI partnership. Her research focuses on climate and innovation policy and as well sustainable consumption and production assessments and policies.
Jesse Fahnestock is an advisor on climate policy and Corporate Social Responsibility for 3C (Combat Climate Change) and the power company Vattenfall. He is the co-author of A One Tonne Future: A Guide to the Low-Carbon Century (2009) and 3C’s policy papers on carbon markets, efficiency, and technology.
FSC logo here
Björn Nykvist works as a Research Associate at SEI Stockholm. His research focuses on policy and institutional analysis, learning, resilience, polices for innovations and transitions between different socio-technical regimes, in the fields of climate change and sustainable mobility
Chelsea Chandler is a Staff Scientist in SEI’s Seattle office. Her research has focused especially on the role of cities in climate mitigation.
Peter Erickson is a Staff Scientist in SEI’s Seattle office. His research focuses on climate change policy, with a particular focus on in the role of offsets in cap-and-trade programs, trade, and industrial policy.
Måns Nilsson is Deputy Director and Research Director at SEI and Visiting Professor at the Royal Institute of Technology (KTH) in Stockholm. Guoyi Han is Senior Research Fellow and Managing Environmental Systems theme co-leader at SEI. Michael Lazarus is Senior Scientist and Director of the SEI’s Seattle office. Karl Hallding is Senior Research Fellow and head of SEI’s China Cluster.

Drivin
g Tech
nolo
gica
l Inn
ova
tion
for a
Low
-Carb
on
Society
V
arn
äs, Fa
hn
estock, et al.
Björn Nykvist is xxx xxxx. Pete Erickson is xxx xxxx. Chelsea Chandler is xxx xxxx. Måns Nilsson is xxx xxxx. Guoyi Han is xxx xxxx. Michael Lazarus is xxx xxxx. Karl Hallding is xxx xxxx.