driving profit and growth through store operations … profit and growth through store operations...
TRANSCRIPT
Driving Profit and Growth Through Store Operations Excellence
Adam Pressman Partner [email protected] Mobile – 773.251.1667 www.atkearney.com

A.T. Kearney 82/29951/5ert4rQlkR01QQI0R1 2
Why is store operations important?
The top 25 retailers in the U.S. spend ~$100 billion on store labor
In the U.S., retailers lease or own over 14 billion square feet of retail space
For a typical retailer, every $10MM in store operations improvements is worth more than
$100-$150 million in market value

A.T. Kearney 82/29951/5ert4rQlkR01QQI0R1 3
Common Questions
■ “How do I ensure my store operations drive improved customer experience?”
■ “Am I getting the maximum productivity from the store team?”
■ “How can I achieve better compliance across my store network?”

A.T. Kearney 82/29951/5ert4rQlkR01QQI0R1 4
• Overview of AEROTM survey
• Overview of survey findings and our insights
• Next steps for retailers
A.T. Kearney 82/29951/5ert4rQlkR01QQI0R1 5
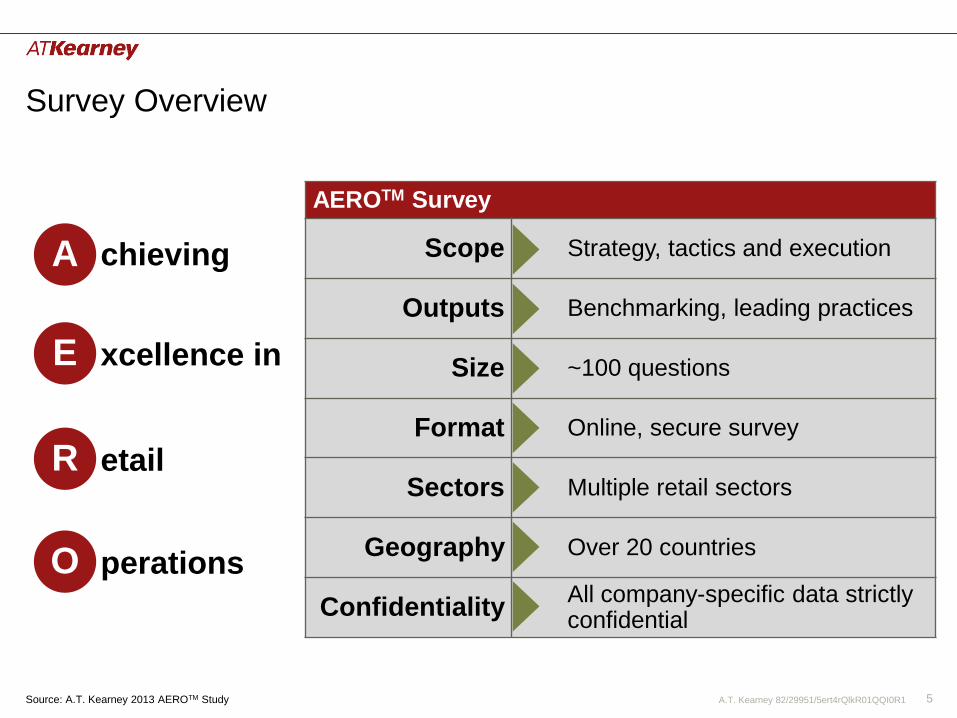
Survey Overview
Source: A.T. Kearney 2013 AEROTM Study
AEROTM Survey
Scope Strategy, tactics and execution
Outputs Benchmarking, leading practices
Size ~100 questions
Format Online, secure survey
Sectors Multiple retail sectors
Geography Over 20 countries
Confidentiality All company-specific data strictly confidential
E
R
O perations
A chieving
xcellence in
etail
A.T. Kearney 82/29951/5ert4rQlkR01QQI0R1 6
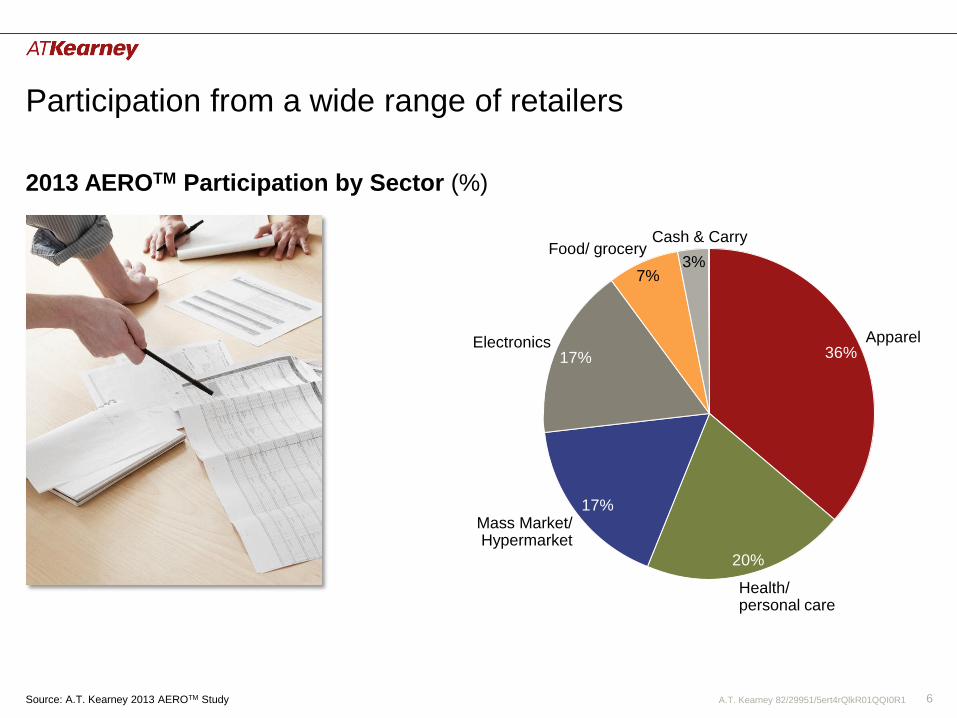
Participation from a wide range of retailers
2013 AEROTM Participation by Sector (%)
17%
17%
20%
36%
3%7%
Apparel
Health/ personal care
Cash & Carry Food/ grocery
Electronics
Mass Market/ Hypermarket
Source: A.T. Kearney 2013 AEROTM Study
A.T. Kearney 82/29951/5ert4rQlkR01QQI0R1 7
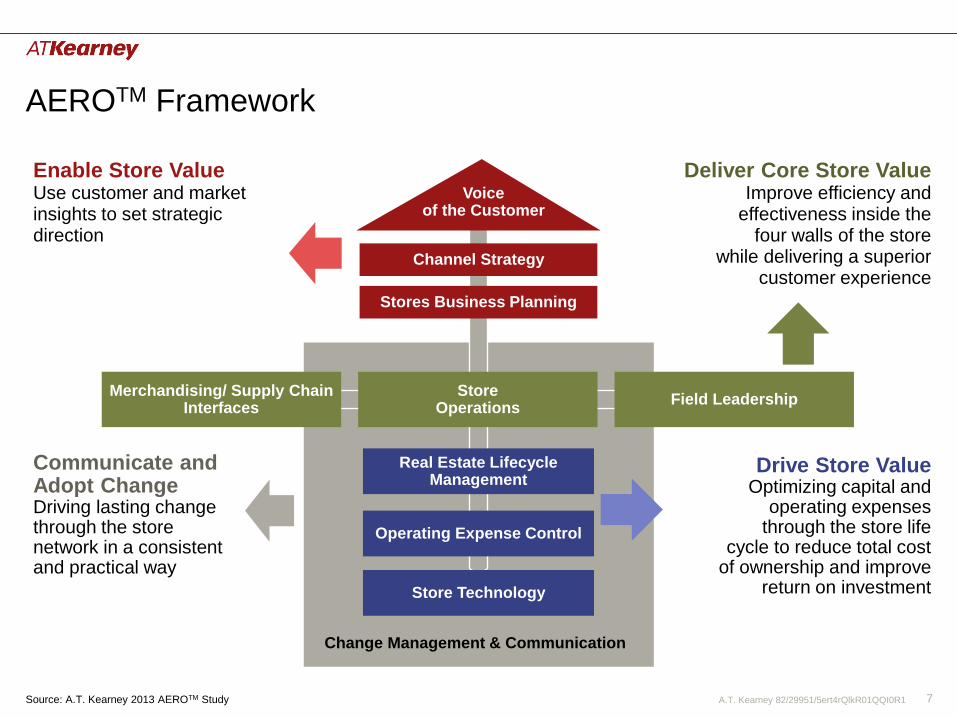
Deliver Core Store Value Improve efficiency and
effectiveness inside the four walls of the store
while delivering a superior customer experience
Communicate and Adopt Change Driving lasting change through the store network in a consistent and practical way
Enable Store Value Use customer and market insights to set strategic direction
Drive Store Value Optimizing capital and
operating expenses through the store life
cycle to reduce total cost of ownership and improve
return on investment
AEROTM Framework
Merchandising/ Supply Chain Interfaces
Store Operations
Field Leadership
Stores Business Planning
Channel Strategy
Voice of the Customer
Store Technology
Operating Expense Control
Real Estate Lifecycle Management
Change Management & Communication
Source: A.T. Kearney 2013 AEROTM Study

A.T. Kearney 82/29951/5ert4rQlkR01QQI0R1 8
Lessons from AEROTM
Measure, Analyze and
Act
Unleash field leadership
Enable with technology
Don’t leave the front line behind
1 2 3 4
A.T. Kearney 82/29951/5ert4rQlkR01QQI0R1 9
• Overview of AEROTM survey
• Overview of survey findings and our insights
• Next steps for retailers
A.T. Kearney 82/29951/5ert4rQlkR01QQI0R1 10
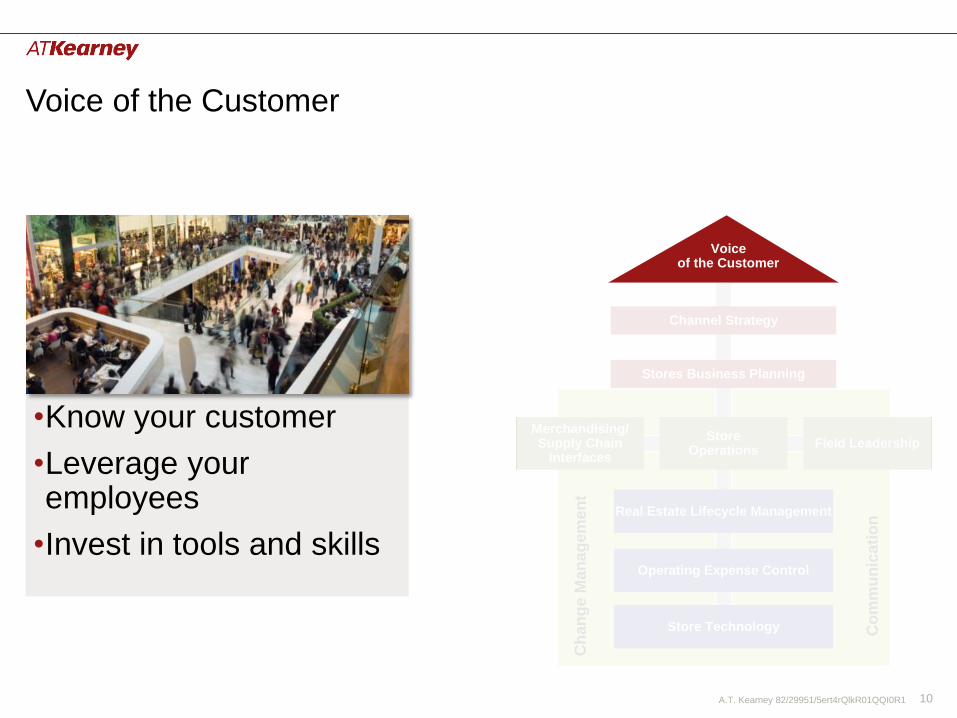
•Know your customer
•Leverage your employees
•Invest in tools and skills
Voice of the Customer
Co
mm
un
ica
tio
n
Merchandising/ Supply Chain
Interfaces
Store Operations
Field Leadership
Stores Business Planning
Channel Strategy
Voice of the Customer
Store Technology
Operating Expense Control
Real Estate Lifecycle Management
Ch
an
ge
Man
ag
em
en
t

A.T. Kearney 82/29951/5ert4rQlkR01QQI0R1 11
Limited use of customer data sources
1. Frequency of use of data ranges from less than 25% of respondents (“rarely”) to in excess of 75% of respondents (“common”) Source: A.T. Kearney 2013 AEROTM Study
Frequency of Use of Selected Customer Data (percentage responses)
Rarely Commonly
POS Transactions,, Units
Survey Customer Surveys, Focus Groups, Intercepts
Loyalty Loyalty Program data
External Industry Research, Vendor-Led
On-line Social Networks – Corporate and 3rd Party
Product Review Products Reviews
Examples
Contact Center Contact Center data
Store Employee Store Employee generated insights
In-Store Traffic, Conversion Rate, Traffic Flow
Co
mm
un
ica
tio
n
Merchandising/ Supply Chain
Interfaces
StoreOperations
Field Leadership
Stores Business Planning
Channel Strategy
Voice of the Customer
Store Technology
Operating Expense Control
Real Estate Lifecycle Management
Ch
an
ge
Ma
na
ge
me
nt
A.T. Kearney 82/29951/5ert4rQlkR01QQI0R1 12
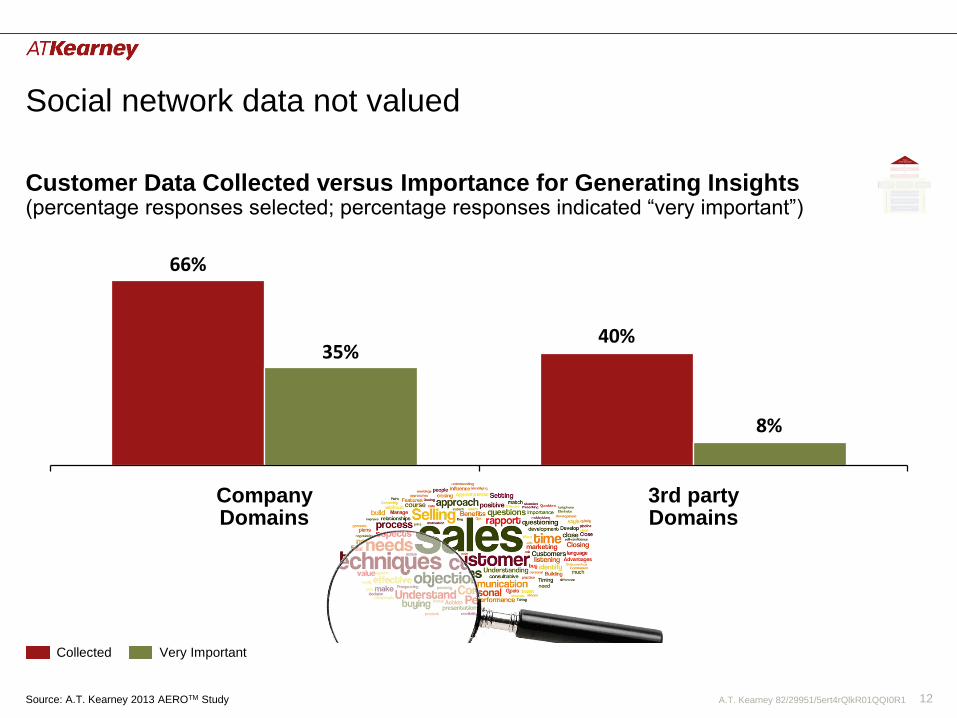
Social network data not valued
66%
40% 35%
8%
3rd party Domains
Company Domains
Very Important Collected
Customer Data Collected versus Importance for Generating Insights (percentage responses selected; percentage responses indicated “very important”) C
om
mu
nic
ati
on
Merchandising/ Supply Chain
Interfaces
StoreOperations
Field Leadership
Stores Business Planning
Channel Strategy
Voice of the Customer
Store Technology
Operating Expense Control
Real Estate Lifecycle Management
Ch
an
ge
Ma
na
ge
me
nt
Source: A.T. Kearney 2013 AEROTM Study
A.T. Kearney 82/29951/5ert4rQlkR01QQI0R1 13
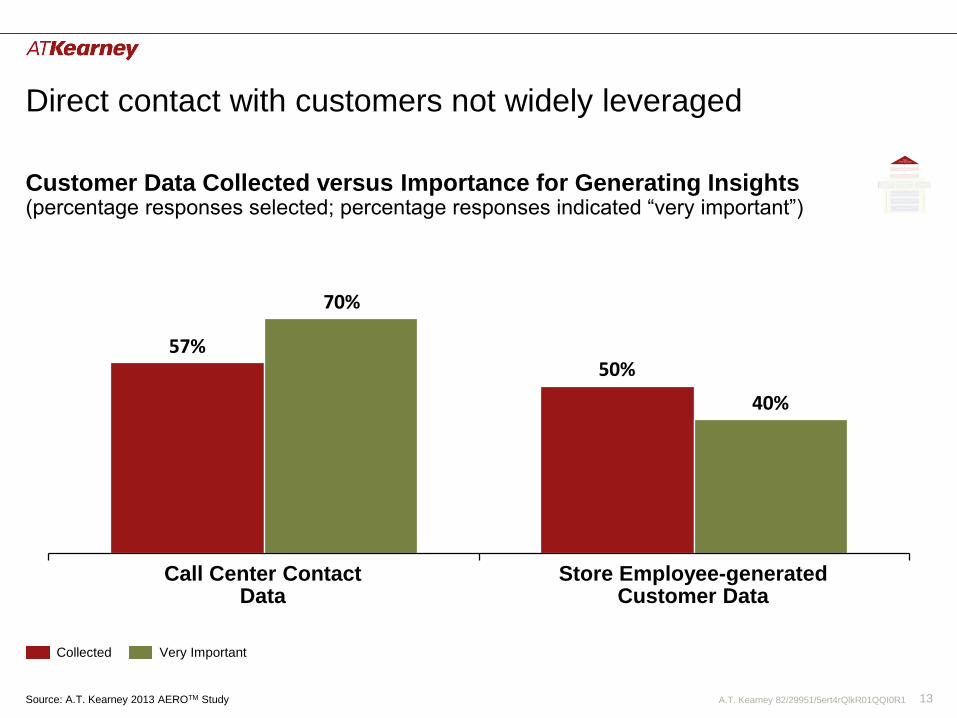
Direct contact with customers not widely leveraged
Customer Data Collected versus Importance for Generating Insights (percentage responses selected; percentage responses indicated “very important”)
57% 50%
70%
40%
Store Employee-generated Customer Data
Call Center Contact Data
Very Important Collected
Co
mm
un
ica
tio
n
Merchandising/ Supply Chain
Interfaces
StoreOperations
Field Leadership
Stores Business Planning
Channel Strategy
Voice of the Customer
Store Technology
Operating Expense Control
Real Estate Lifecycle Management
Ch
an
ge
Ma
na
ge
me
nt
Source: A.T. Kearney 2013 AEROTM Study

A.T. Kearney 82/29951/5ert4rQlkR01QQI0R1 14
Those that invest in enabling store employee feedback put it to use
Use technology to enable employee feedback
None 38%
Limited 21%
Neutral 3%
Somewhat 17%
Extensively 21%
Technology-enabled Store Employee Feedback (% respondents)
Prevalence of Analyses of Store Employee Input (% respondents)
20%
-70%
Moderate use of
technology
to enable employee
feedback
Extensive use of
technology
to enable employee
feedback
66%
Co
mm
un
ica
tio
n
Merchandising/ Supply Chain
Interfaces
StoreOperations
Field Leadership
Stores Business Planning
Channel Strategy
Voice of the Customer
Store Technology
Operating Expense Control
Real Estate Lifecycle Management
Ch
an
ge
Ma
na
ge
me
nt
Source: A.T. Kearney 2013 AEROTM Study

A.T. Kearney 82/29951/5ert4rQlkR01QQI0R1 15
Over half still do not mine loyalty data regularly
Frequency of Loyalty Data Analysis (% respondents, 2009 v 2012)
Barriers to Increased Consumer Insights from Loyalty Data (% respondents)
28%
10%10%
51%
19%
11%
22%
48%
0
5
10
15
20
25
30
35
40
45
50
55
Continuously/ Monthly
Rarely/ Never
Every 1 to 3 years
Quarterly/ Semi-
Annually
2012 2009
27%
43%
60% Technology
3%
Legal Restrictions
Workforce Capability
Lack of Perceived Need
Co
mm
un
ica
tio
n
Merchandising/ Supply Chain
Interfaces
StoreOperations
Field Leadership
Stores Business Planning
Channel Strategy
Voice of the Customer
Store Technology
Operating Expense Control
Real Estate Lifecycle Management
Ch
an
ge
Ma
na
ge
me
nt
Source: A.T. Kearney 2013 AEROTM Study
A.T. Kearney 82/29951/5ert4rQlkR01QQI0R1 16
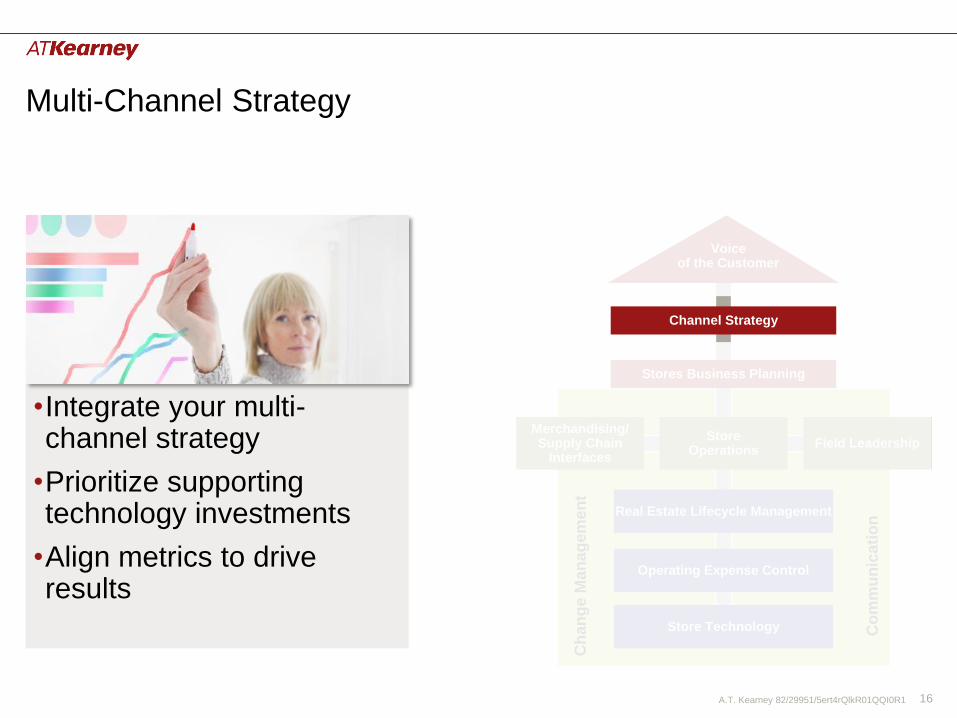
•Integrate your multi-channel strategy
•Prioritize supporting technology investments
•Align metrics to drive results
Multi-Channel Strategy
Co
mm
un
ica
tio
n
Merchandising/ Supply Chain
Interfaces
Store Operations
Field Leadership
Stores Business Planning
Channel Strategy
Voice of the Customer
Store Technology
Operating Expense Control
Real Estate Lifecycle Management
Ch
an
ge
Man
ag
em
en
t

A.T. Kearney 82/29951/5ert4rQlkR01QQI0R1 17
Consumers expect to use both physical and digital channels in their journey
How Consumers Shop?
After Sales Experience
Product Pick-Up / Delivery
Purchase Trial / Test Research Product
Description • Discovery of products
• Customer considers various product/ service options
• After making a preliminary selection, customer verifies that it is the right product
• Customer obtains and pays for product
• Customer obtains products purchased (pick-up in store or delivery)
• Customer satisfaction is maintained post-purchase (including returns)
Increasingly Common Behaviours / Expectations
• Read dozens of 3rd party reviews online
• Influenced by social media
• Visit product in store to test / trial / try-on products researched online
• Purchase in-store but have shipped to home; “Select and Ship” stores
• Order product online and pick-up in store same day
• Return items bought online or in-store and vice versa
Source: A.T. Kearney Future of Stores Survey
45%
55%
19%
81%
24%
76%
24%
76%
17%
83% Online
Stores
Cross-Channel Capabilities in Consideration
• “Customers Like You Also Purchased…”
• Shipping samples to home (lengthy trials)
• Triggered by targeted offer
• Beacons / micro-location targeting
• Order online for “drive-up” pick-up
• Share / post purchases (e.g., Twitter)
A.T. Kearney 82/29951/5ert4rQlkR01QQI0R1 18
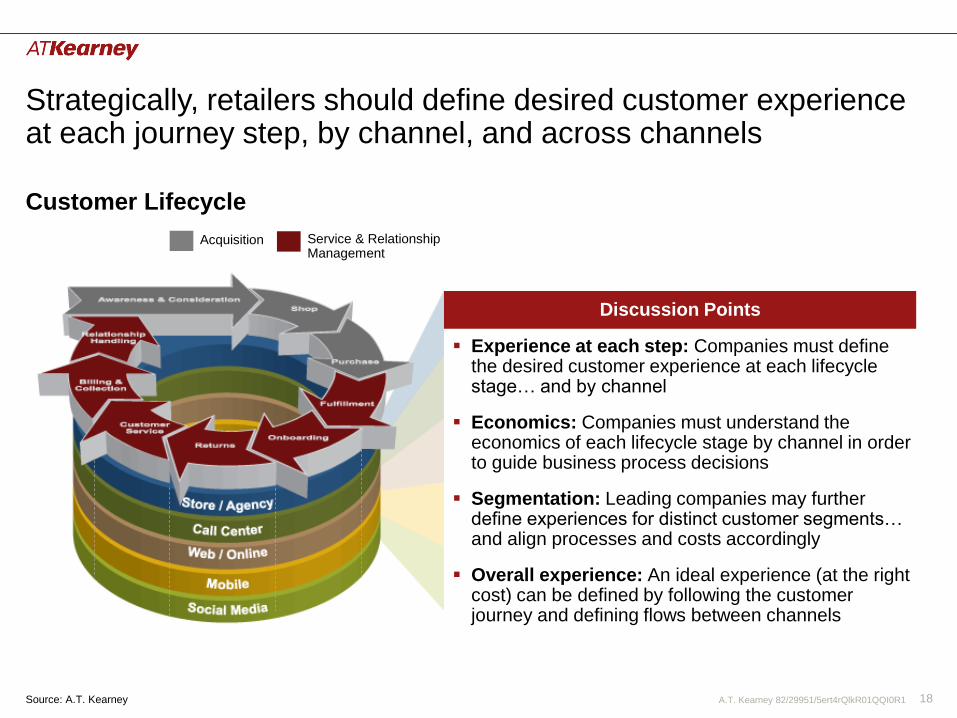
Strategically, retailers should define desired customer experience at each journey step, by channel, and across channels
Acquisition Service & Relationship Management
Customer Lifecycle
Discussion Points
Experience at each step: Companies must define the desired customer experience at each lifecycle stage… and by channel
Economics: Companies must understand the economics of each lifecycle stage by channel in order to guide business process decisions
Segmentation: Leading companies may further define experiences for distinct customer segments… and align processes and costs accordingly
Overall experience: An ideal experience (at the right cost) can be defined by following the customer journey and defining flows between channels
Source: A.T. Kearney

A.T. Kearney 82/29951/5ert4rQlkR01QQI0R1 19
Consumers go to stores to fill immediate needs, try out new products, and to spend time with others
What Drives Consumers To Stores?
Top Stated Reasons
Note: n=2400; Survey question: What are the top 5 reasons you go to STORES as opposed to shopping another channel (online, by your mobile phone, or by catalogue)? Source: A.T. Kearney Future of Stores Survey
• Survey respondents highlighted immediacy, and experiential factors (e.g. product touch/feel) as motivators for in-store shopping
• Essential for retailers to convert trial/test to purchase and to manage inventory to ensure products are in-stock and available for purchase
• A trip to the store remains a social occasion with consumers going to stores to spend time with friends and family
Store Shopping Drivers
7%
9%
13%
15%
24%
To trial/test (try on)
products
To fill an immediate
need
To find promotions & special
offers
To compare prices
To spend time with
friends/family
“I like the instant
gratification of taking
an item home “
“I like the
personal touch
of a store”
“Stores that treat me
like a person and not
a number get my
business.”
“Like being able
to get items right
away, trying it
out”

A.T. Kearney 82/29951/5ert4rQlkR01QQI0R1 20
The key is to understand the role of the store…for your industry…and your customers

A.T. Kearney 82/29951/5ert4rQlkR01QQI0R1 21
Customers report that Online, Mobile, Social and Self-Service Kiosks show growing usage
Net percent change in channel usage versus prior year (2013 over 2012)
Source: A.T. Kearney 2013 integrated Channel Engagement Survey
Though the online channel reported the highest increase in usage, channel growth is slowing when compared to 2012’s study
Discussion Points
Physical Stores:
Net contracting usage, according to consumers
Loyalty data, script pickups, and or credit card data should indicate trends in number of visits
Online + Mobile: Additional evidence of the urgency to position for on-line and mobile as customers report significant growing use
Experience: While use of given channels is rising / falling, an overall integrated experience across channels is increasingly expected by consumers
A.T. Kearney 82/29951/5ert4rQlkR01QQI0R1 22
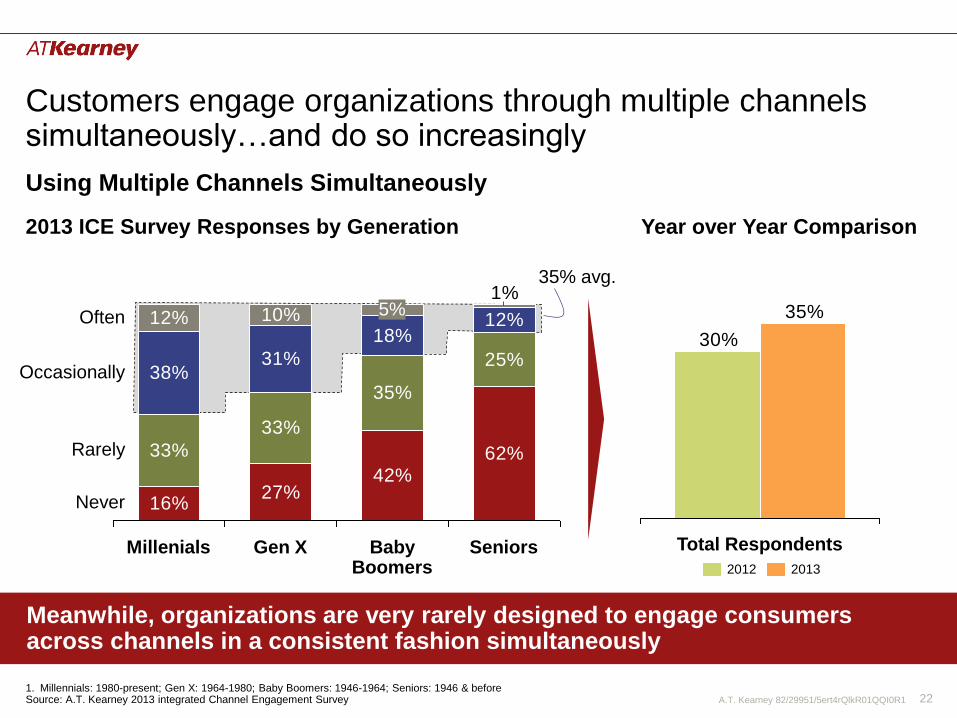
16%27%
42%62%33%
33%
35%
25%38%
31%
18%12%12% 10%1%
Occasionally
Often
Never
Seniors
Rarely
Baby Boomers
5%
Gen X Millenials
Customers engage organizations through multiple channels simultaneously…and do so increasingly
1. Millennials: 1980-present; Gen X: 1964-1980; Baby Boomers: 1946-1964; Seniors: 1946 & before Source: A.T. Kearney 2013 integrated Channel Engagement Survey
30%
35%
Total Respondents
2013 2012
Using Multiple Channels Simultaneously
Year over Year Comparison 2013 ICE Survey Responses by Generation
35% avg.
Meanwhile, organizations are very rarely designed to engage consumers across channels in a consistent fashion simultaneously

A.T. Kearney 82/29951/5ert4rQlkR01QQI0R1 23
Few truly integrate channels
Types of Multi-channel Offerings (% respondents)
50%
40% 37%
17%
Buy from other channel and
return to store
Buy on-line and pick up in store
Ship from store to home
Competitive price checks
Store inventory visibility through other channels
Source: A.T. Kearney 2013 AEROTM Study
58% cite technology as greatest barrier
Co
mm
un
ica
tio
n
Merchandising/ Supply Chain
Interfaces
StoreOperations
Field Leadership
Stores Business Planning
Channel Strategy
Voice of the Customer
Store Technology
Operating Expense Control
Real Estate Lifecycle Management
Ch
an
ge M
an
ag
em
en
t
57%
A.T. Kearney 82/29951/5ert4rQlkR01QQI0R1 24
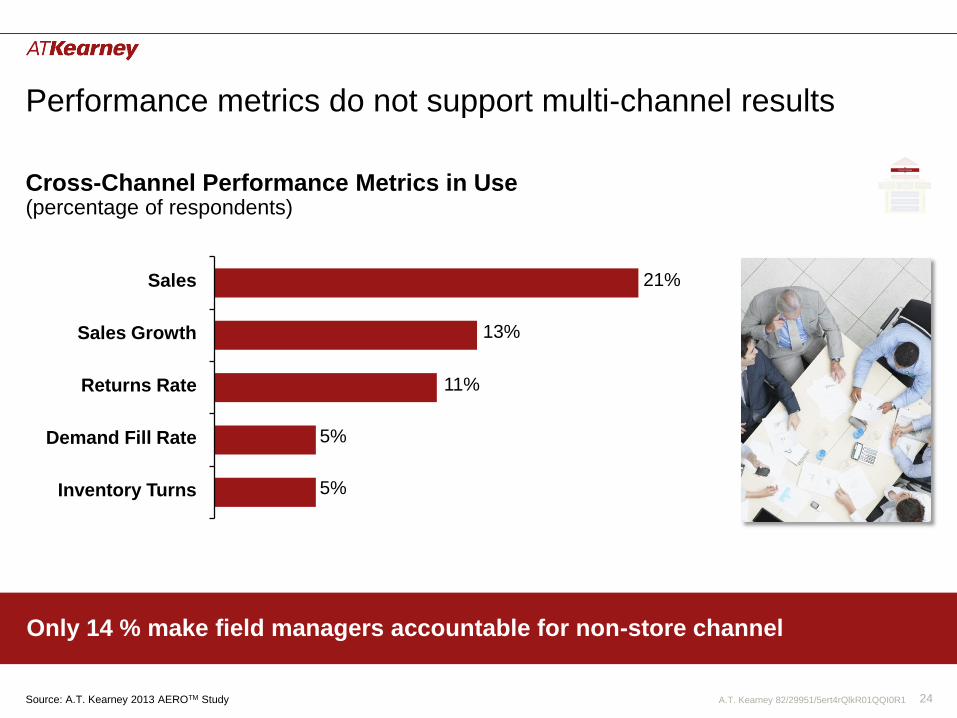
Only 14 % make field managers accountable for non-store channel
Performance metrics do not support multi-channel results
21%
13%
11%
5%
5%
Demand Fill Rate
Returns Rate
Sales Growth
Sales
Inventory Turns
Cross-Channel Performance Metrics in Use (percentage of respondents)
Source: A.T. Kearney 2013 AEROTM Study
Co
mm
un
ica
tio
n
Merchandising/ Supply Chain
Interfaces
StoreOperations
Field Leadership
Stores Business Planning
Channel Strategy
Voice of the Customer
Store Technology
Operating Expense Control
Real Estate Lifecycle Management
Ch
an
ge M
an
ag
em
en
t
A.T. Kearney 82/29951/5ert4rQlkR01QQI0R1 25
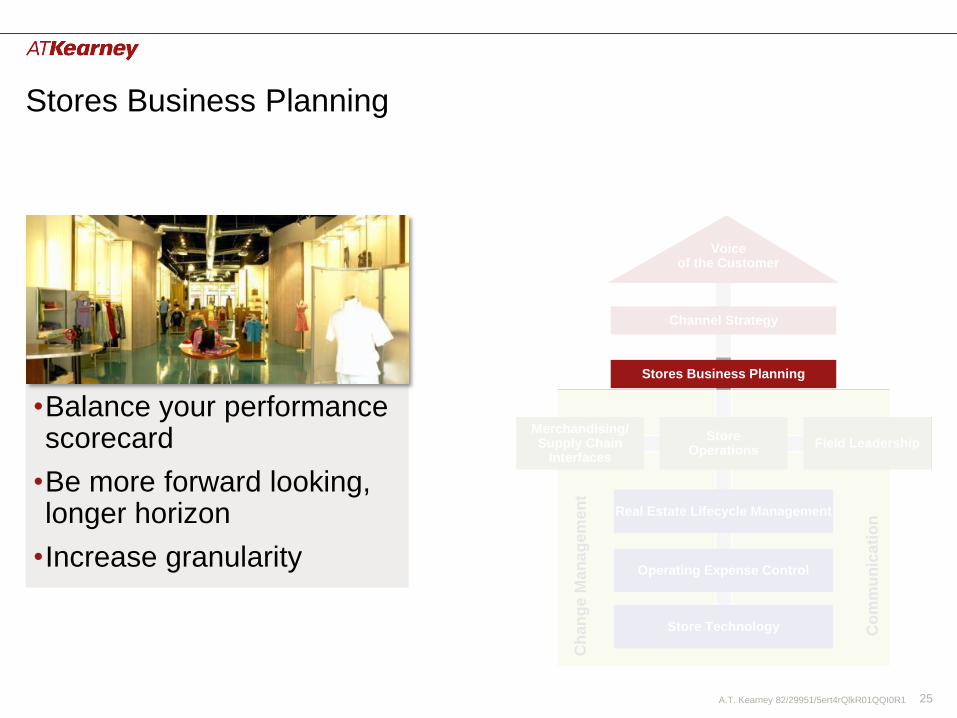
•Balance your performance scorecard
•Be more forward looking, longer horizon
•Increase granularity
Stores Business Planning
Co
mm
un
ica
tio
n
Merchandising/ Supply Chain
Interfaces
Store Operations
Field Leadership
Stores Business Planning
Channel Strategy
Voice of the Customer
Store Technology
Operating Expense Control
Real Estate Lifecycle Management
Ch
an
ge
Man
ag
em
en
t

A.T. Kearney 82/29951/5ert4rQlkR01QQI0R1 26
Employee and operational dimensions underweighted
Employees 4%
Operations 23%
Customers 31%
Financials 61%
Only half measure all four performance dimensions
Average Weighting of Performance Dimension (percentage of responses)
Important Very Important Most Important
Source: A.T. Kearney 2013 AEROTM Study
Co
mm
un
ica
tio
n
Merchandising/ Supply Chain
Interfaces
StoreOperations
Field Leadership
Stores Business Planning
Channel Strategy
Voice of the Customer
Store Technology
Operating Expense Control
Real Estate Lifecycle Management
Ch
an
ge M
an
ag
em
en
t

A.T. Kearney 82/29951/5ert4rQlkR01QQI0R1 27
Store-level plans often exclude key inputs
100%
83%
62%
45%
38%
10%
Above + Demographic
Above + Economic
Above + Competitive
Above + Promo Plans
Historical Store-level
All Inputs Included in Store-level Business Plans (percentage of respondents)
Source: A.T. Kearney 2013 AEROTM Study
Above + Weather
Co
mm
un
ica
tio
n
Merchandising/ Supply Chain
Interfaces
StoreOperations
Field Leadership
Stores Business Planning
Channel Strategy
Voice of the Customer
Store Technology
Operating Expense Control
Real Estate Lifecycle Management
Ch
an
ge M
an
ag
em
en
t
A.T. Kearney 82/29951/5ert4rQlkR01QQI0R1 28
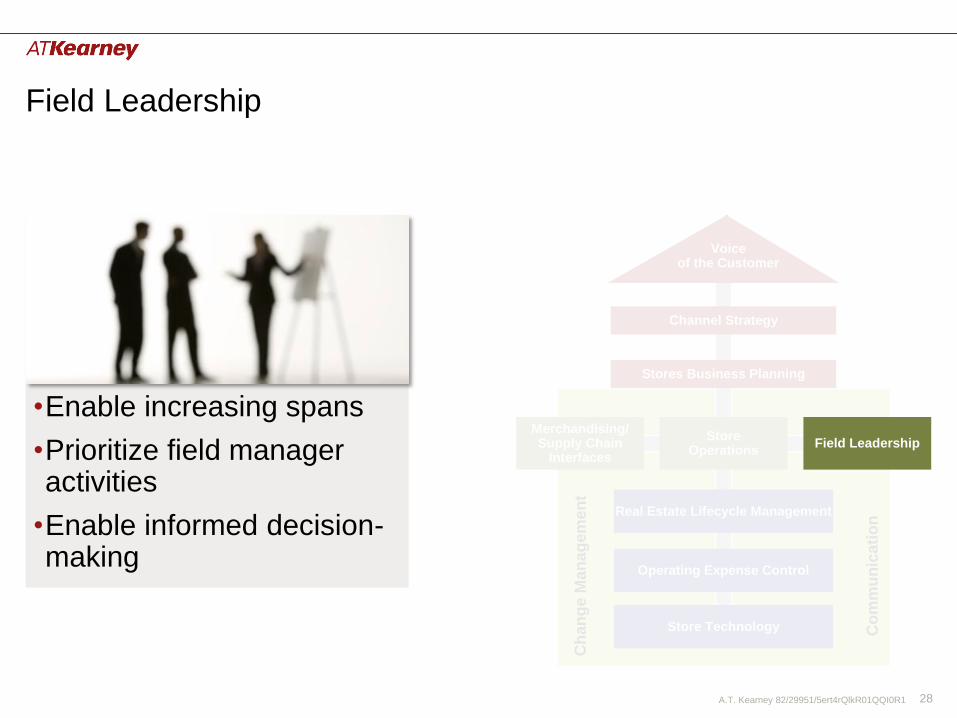
Field Leadership
•Enable increasing spans
•Prioritize field manager activities
•Enable informed decision-making
Co
mm
un
ica
tio
n
Merchandising/ Supply Chain
Interfaces
Store Operations
Stores Business Planning
Channel Strategy
Voice of the Customer
Store Technology
Operating Expense Control
Real Estate Lifecycle Management
Ch
an
ge
Man
ag
em
en
t
Field Leadership

A.T. Kearney 82/29951/5ert4rQlkR01QQI0R1 29
Field leaders managing more stores
38%
57%
56%
47%
42%
26% Level 0 (Store)
Level One
Level Two
Level Three
Level Four
Level Five
Increase in Average Number of Stores per Management Level (percentage of respondents)
Source: A.T. Kearney 2013 AEROTM Study
Co
mm
un
ica
tio
n
Merchandising/ Supply Chain
Interfaces
StoreOperations
Stores Business Planning
Channel Strategy
Voice of the Customer
Store Technology
Operating Expense Control
Real Estate Lifecycle Management
Ch
an
ge M
an
ag
em
en
t
Field Leadership

A.T. Kearney 82/29951/5ert4rQlkR01QQI0R1 30
More time spent on administration than customers and team
Management Time Allocation (mean percentage of responses, selected activities)
Source: A.T. Kearney 2013 AEROTM Study
Co
mm
un
ica
tio
n
Merchandising/ Supply Chain
Interfaces
StoreOperations
Stores Business Planning
Channel Strategy
Voice of the Customer
Store Technology
Operating Expense Control
Real Estate Lifecycle Management
Ch
an
ge M
an
ag
em
en
t
Field Leadership
Store Management Field Management
• Customer service
• Customer complaints
• Customer satisfaction analysis
• Management reporting
• Planning & scheduling
• Purchasing (operative)
• Trainings
• Target setting
• Performance reviews
• Implementation of corporate initiatives
• Controlling of compliance
• Assessing feedback
Tasks
To be
reduced
7%
20%
38%
4%
Corporate compliance
Customer interaction
Coaching direct reports
Administration
11%
18%
19%
34%

A.T. Kearney 82/29951/5ert4rQlkR01QQI0R1 31
Leaders provide HR and finance training
43%
67%
HR skills
Financial skills
Training Provided to Field Management (percentage responses)
Source: A.T. Kearney 2013 AEROTM Study
Co
mm
un
ica
tio
n
Merchandising/ Supply Chain
Interfaces
StoreOperations
Stores Business Planning
Channel Strategy
Voice of the Customer
Store Technology
Operating Expense Control
Real Estate Lifecycle Management
Ch
an
ge M
an
ag
em
en
t
Field Leadership
89%
89%
Others Leaders

A.T. Kearney 82/29951/5ert4rQlkR01QQI0R1 32
Varying levels of store manager autonomy
Store Manager Degrees of Autonomy (percentage of respondents)
Labor Scheduling
11% 50% 32%
Hiring 15% 11% 67% 7%
Customer Complaint Resolution
31% 50% 19%
Source: A.T. Kearney 2013 AEROTM Study
Limited Decisions Own Decision within Guidelines Own Decision Headquarters
Co
mm
un
ica
tio
n
Merchandising/ Supply Chain
Interfaces
StoreOperations
Stores Business Planning
Channel Strategy
Voice of the Customer
Store Technology
Operating Expense Control
Real Estate Lifecycle Management
Ch
an
ge M
an
ag
em
en
t
Field Leadership
A.T. Kearney 82/29951/5ert4rQlkR01QQI0R1 33
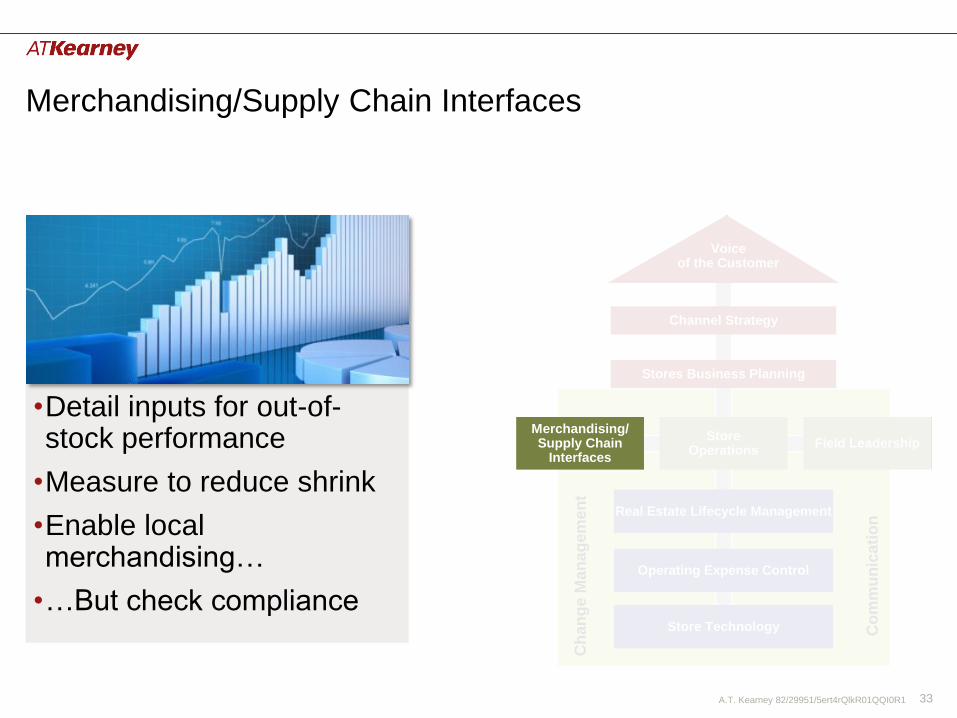
Merchandising/Supply Chain Interfaces
•Detail inputs for out-of-stock performance
•Measure to reduce shrink
•Enable local merchandising…
•…But check compliance
Co
mm
un
ica
tio
n
Store Operations
Stores Business Planning
Channel Strategy
Voice of the Customer
Store Technology
Operating Expense Control
Real Estate Lifecycle Management
Ch
an
ge
Man
ag
em
en
t
Field Leadership Merchandising/ Supply Chain
Interfaces
A.T. Kearney 82/29951/5ert4rQlkR01QQI0R1 34
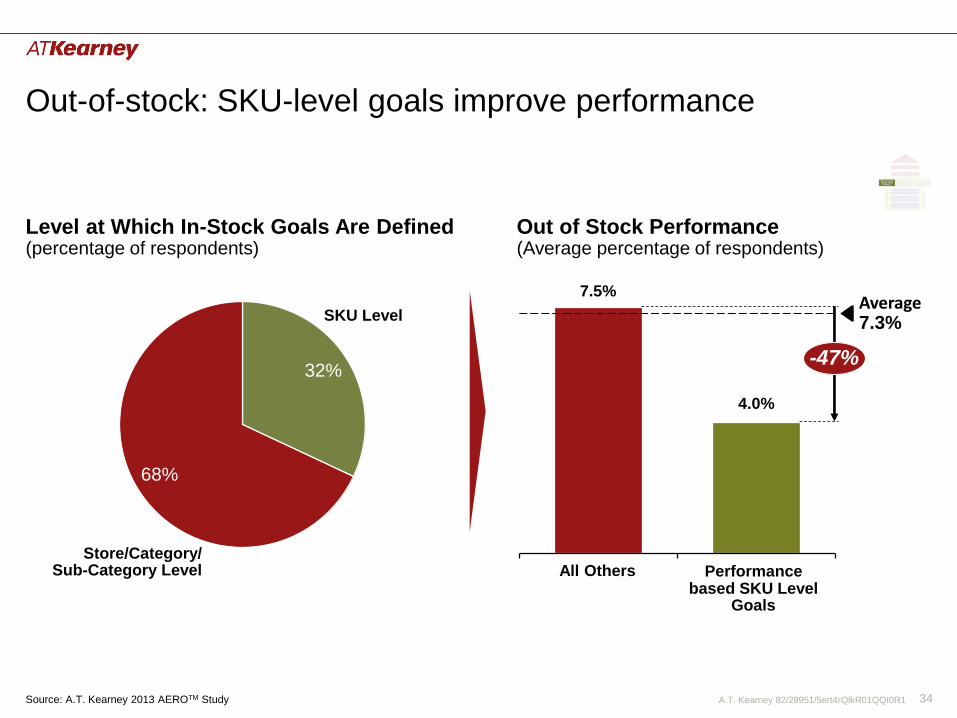
Out-of-stock: SKU-level goals improve performance
Store/Category/ Sub-Category Level
68%
SKU Level
32%
7.5%
4.0%
Average 7.3%
-47%
All Others
Level at Which In-Stock Goals Are Defined (percentage of respondents)
Out of Stock Performance (Average percentage of respondents)
Source: A.T. Kearney 2013 AEROTM Study
Performance based SKU Level
Goals
Co
mm
un
ica
tio
n
StoreOperations
Stores Business Planning
Channel Strategy
Voice of the Customer
Store Technology
Operating Expense Control
Real Estate Lifecycle Management
Ch
an
ge M
an
ag
em
en
t
Field Leadership Merchandising/ Supply Chain
Interfaces

A.T. Kearney 82/29951/5ert4rQlkR01QQI0R1 35
Shrink: Set targets by category
Shrink Management Approaches (percentage respondents indicating “extensive” or “somewhat”)
38%
54%58%
65%65%
81%85%
Establish shrink
targets by category
Use financial incentives
Establish shrink targets
by store
Shrink is a key performance
metric
Use technology to
manage shrink
Formal process in place
Well documented
strategy
Leading Practice
Source: A.T. Kearney 2013 AEROTM Study
Co
mm
un
ica
tio
n
StoreOperations
Stores Business Planning
Channel Strategy
Voice of the Customer
Store Technology
Operating Expense Control
Real Estate Lifecycle Management
Ch
an
ge M
an
ag
em
en
t
Field Leadership Merchandising/ Supply Chain
Interfaces

A.T. Kearney 82/29951/5ert4rQlkR01QQI0R1 36
Local merchandising: Limited degree of local influence
High Degree
15%
No Influence
21%
Low Degree
64%
Portion of End Caps/Aisles
All End Caps
50%
7%
Store Influence on Assortment (% responses)
Autonomy over Merchandise Display (% responses)
Source: A.T. Kearney 2013 AEROTM Study
Co
mm
un
ica
tio
n
StoreOperations
Stores Business Planning
Channel Strategy
Voice of the Customer
Store Technology
Operating Expense Control
Real Estate Lifecycle Management
Ch
an
ge M
an
ag
em
en
t
Field Leadership Merchandising/ Supply Chain
Interfaces

A.T. Kearney 82/29951/5ert4rQlkR01QQI0R1 37
Merchandising compliance: Variable focus
Store Team
Corp Staff 18%
3rd Party 18%
Field Merchandisers
36%
57%
Above Store Manager
93%
31%
17% 10 hrs
to 22.5 hrs
5 hrs to 9.5 hrs
0 to 4.5 hrs
Approach to Assessing Merchandise Compliance (% responses)
Weekly District Management Time Spent Auditing Stores (average hours, Level One)
Co
mm
un
ica
tio
n
StoreOperations
Stores Business Planning
Channel Strategy
Voice of the Customer
Store Technology
Operating Expense Control
Real Estate Lifecycle Management
Ch
an
ge M
an
ag
em
en
t
Field Leadership Merchandising/ Supply Chain
Interfaces
Source: A.T. Kearney 2013 AEROTM Study
52%

A.T. Kearney 82/29951/5ert4rQlkR01QQI0R1 38
Store Operations
•Dedicated resources to process improvement
•Measure in-store operations
•Plan, communicate and measure for peak performance C
om
mu
nic
ati
on
Stores Business Planning
Channel Strategy
Voice of the Customer
Store Technology
Operating Expense Control
Real Estate Lifecycle Management
Ch
an
ge
Man
ag
em
en
t
Field Leadership Merchandising/ Supply Chain
Interfaces
Store Operations
A.T. Kearney 82/29951/5ert4rQlkR01QQI0R1 39
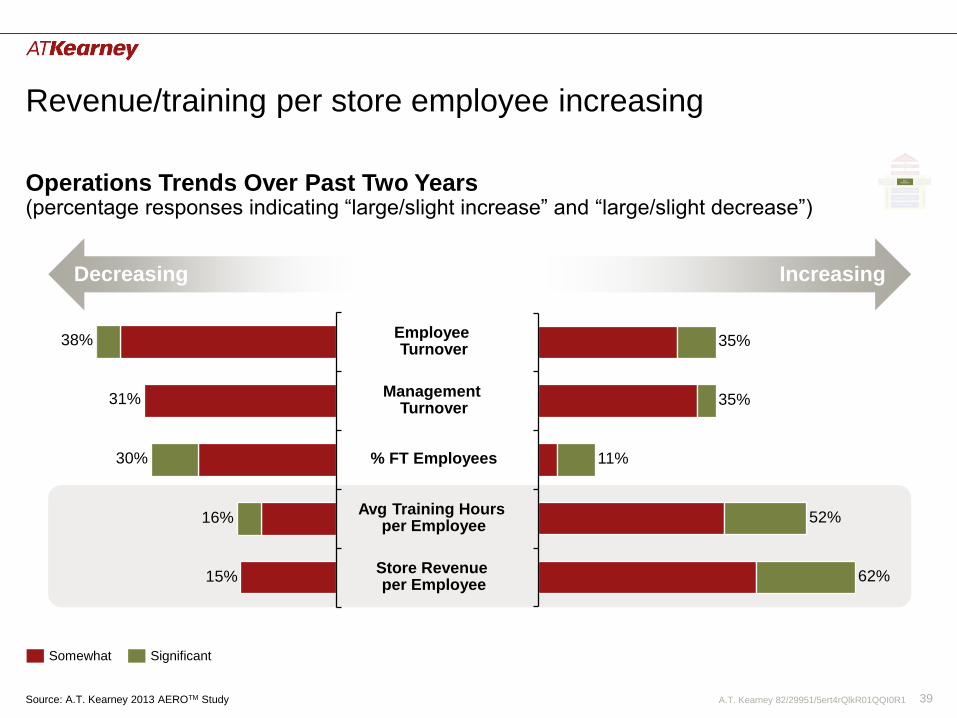
Revenue/training per store employee increasing
Store Revenue per Employee
62%
Avg Training Hours per Employee
52%
% FT Employees 11%
Management Turnover
35%
Employee Turnover
35%
15%
16%
30%
31%
38%
Increasing
Operations Trends Over Past Two Years (percentage responses indicating “large/slight increase” and “large/slight decrease”)
Decreasing
Co
mm
un
ica
tio
n
Stores Business Planning
Channel Strategy
Voice of the Customer
Store Technology
Operating Expense Control
Real Estate Lifecycle Management
Ch
an
ge M
an
ag
em
en
t
Field Leadership Merchandising/ Supply Chain
Interfaces
StoreOperations
Source: A.T. Kearney 2013 AEROTM Study
Significant Somewhat
A.T. Kearney 82/29951/5ert4rQlkR01QQI0R1 40
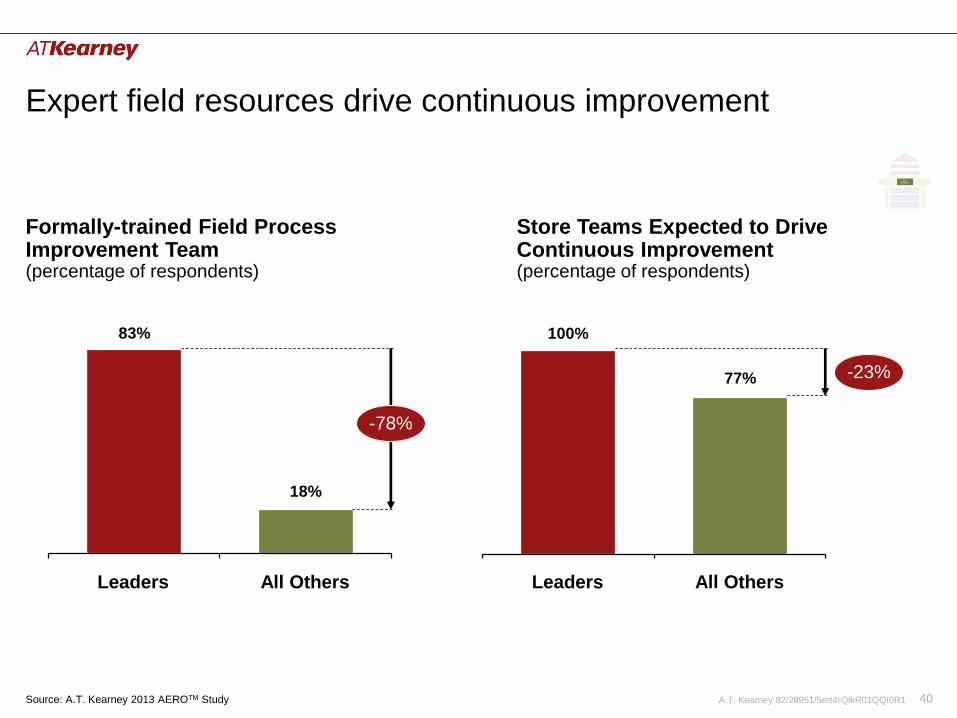
Expert field resources drive continuous improvement
83%
18%
-78%
All Others Leaders
100%
77% -23%
All Others Leaders
Formally-trained Field Process Improvement Team (percentage of respondents)
Store Teams Expected to Drive Continuous Improvement (percentage of respondents)
Co
mm
un
ica
tio
n
Stores Business Planning
Channel Strategy
Voice of the Customer
Store Technology
Operating Expense Control
Real Estate Lifecycle Management
Ch
an
ge M
an
ag
em
en
t
Field Leadership Merchandising/ Supply Chain
Interfaces
StoreOperations
Source: A.T. Kearney 2013 AEROTM Study

A.T. Kearney 82/29951/5ert4rQlkR01QQI0R1 41
Many key metrics not measured
Merchandising Compliance
65%
Planogram Compliance
31%
Non-Customer- Facing Processes
35%
Customer Wait at Service
24%
Customer Wait at Checkout
15%
Frequency of store performance measurement (percentage of respondents) C
om
mu
nic
ati
on
Stores Business Planning
Channel Strategy
Voice of the Customer
Store Technology
Operating Expense Control
Real Estate Lifecycle Management
Ch
an
ge M
an
ag
em
en
t
Field Leadership Merchandising/ Supply Chain
Interfaces
StoreOperations
Daily/Hourly Semi-Weekly/Weekly
Source: A.T. Kearney 2013 AEROTM Study

A.T. Kearney 82/29951/5ert4rQlkR01QQI0R1 42
Variable recruiting practices
Tests for Store Hiring (percentage responses)
89%
82%
57%
46%
14% Drug Testing
Standardized Written/ On-line Test
Structured Q&A Interviews
Customer Experience Skills Testing
Background Check
Two-thirds of leaders test for customer experience skills
Co
mm
un
ica
tio
n
Stores Business Planning
Channel Strategy
Voice of the Customer
Store Technology
Operating Expense Control
Real Estate Lifecycle Management
Ch
an
ge M
an
ag
em
en
t
Field Leadership Merchandising/ Supply Chain
Interfaces
StoreOperations
Source: A.T. Kearney 2013 AEROTM Study
A.T. Kearney 82/29951/5ert4rQlkR01QQI0R1 43
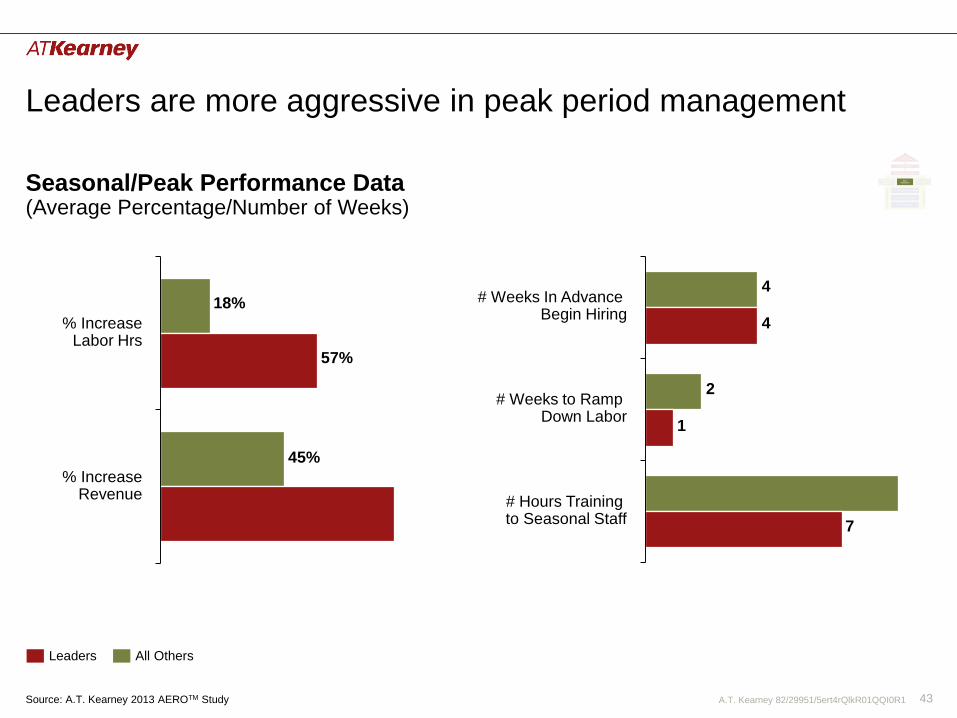
Leaders are more aggressive in peak period management
18%
45%
57%
% Increase Revenue
% Increase Labor Hrs
4
2
4
1
7
# Weeks to Ramp Down Labor
# Hours Training to Seasonal Staff
# Weeks In Advance Begin Hiring
Seasonal/Peak Performance Data (Average Percentage/Number of Weeks) C
om
mu
nic
ati
on
Stores Business Planning
Channel Strategy
Voice of the Customer
Store Technology
Operating Expense Control
Real Estate Lifecycle Management
Ch
an
ge M
an
ag
em
en
t
Field Leadership Merchandising/ Supply Chain
Interfaces
StoreOperations
All Others Leaders
Source: A.T. Kearney 2013 AEROTM Study
A.T. Kearney 82/29951/5ert4rQlkR01QQI0R1 44
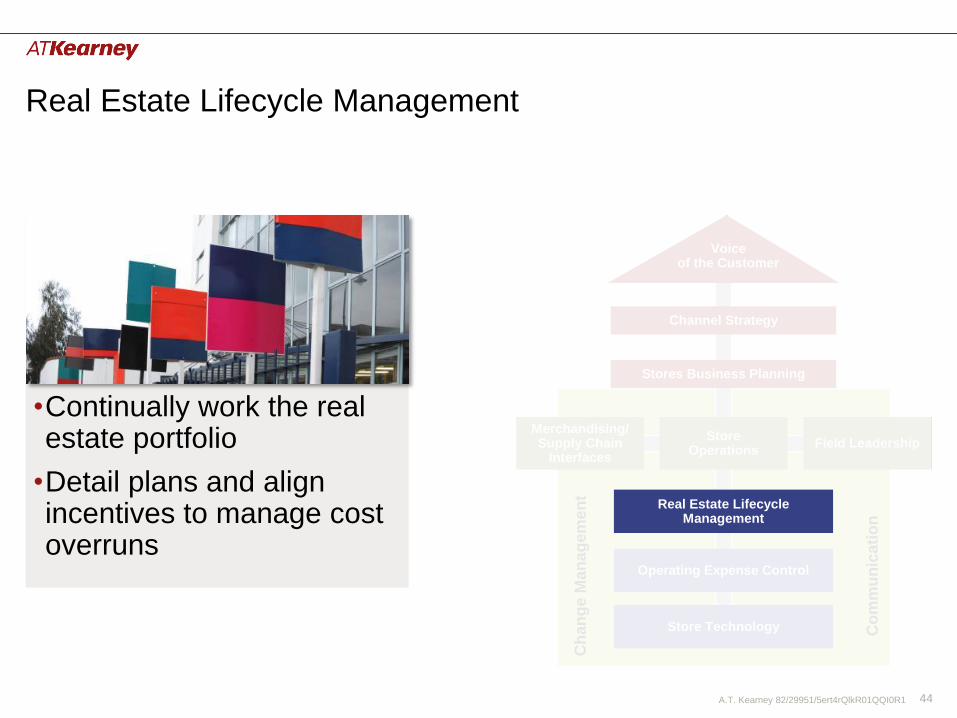
Real Estate Lifecycle Management
•Continually work the real estate portfolio
•Detail plans and align incentives to manage cost overruns
Co
mm
un
ica
tio
n
Stores Business Planning
Channel Strategy
Voice of the Customer
Store Technology
Operating Expense Control C
han
ge
Man
ag
em
en
t
Field Leadership Merchandising/ Supply Chain
Interfaces
Store Operations
Real Estate Lifecycle Management

A.T. Kearney 82/29951/5ert4rQlkR01QQI0R1 45
Store Footprint Growth
Operations and
Maintenance
Fit-out
Construction
Location Identification
Design and
Specification
Store Footprint Evaluation
4-Wall Cash Flow
An
nu
al
Re
ve
nu
e
Fix or Close
• Lease Negotiations
• Downsize
• Sub-let
• Close
Protect & Grow
• Maintain cost
structure
• Monitor and adjust
to local market
conditions
Improve
• Control operating costs
• Improve customer service
• Battle local competition
Real Estate portfolio represents opportunities
Co
mm
un
ica
tio
n
Stores Business Planning
Channel Strategy
Voice of the Customer
Store Technology
Operating Expense Control
Ch
an
ge M
an
ag
em
en
t
Field Leadership Merchandising/ Supply Chain
Interfaces
StoreOperations
Real Estate Lifecycle Management
• Consider future demographics
• Lock in low occupancy costs – retain flexibility
• Use advanced sourcing techniques to lower cost of supply for building services, fixtures, on-going maintenance
A.T. Kearney 82/29951/5ert4rQlkR01QQI0R1 46
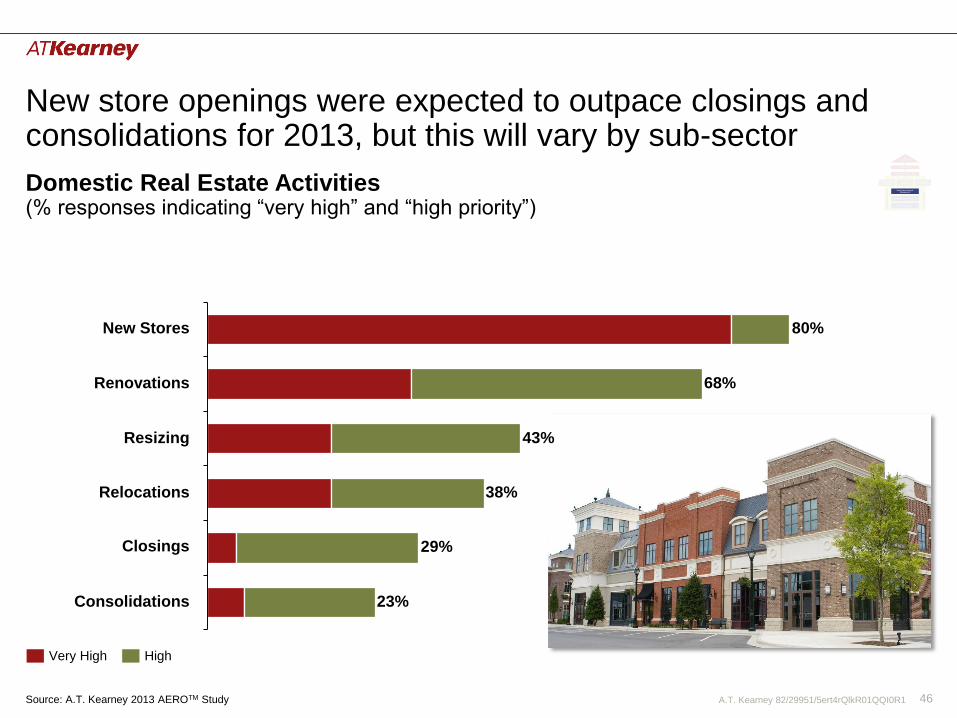
New store openings were expected to outpace closings and consolidations for 2013, but this will vary by sub-sector
Domestic Real Estate Activities (% responses indicating “very high” and “high priority”)
Resizing 43%
Renovations 68%
New Stores 80%
Consolidations 23%
Closings 29%
Relocations 38%
Co
mm
un
ica
tio
n
Stores Business Planning
Channel Strategy
Voice of the Customer
Store Technology
Operating Expense Control
Ch
an
ge M
an
ag
em
en
t
Field Leadership Merchandising/ Supply Chain
Interfaces
StoreOperations
Real Estate Lifecycle Management
Source: A.T. Kearney 2013 AEROTM Study
High Very High

A.T. Kearney 82/29951/5ert4rQlkR01QQI0R1 47
Sustainability considered, when coupled with financial benefit
Importance of Green and Sustainable Construction (percentage of responses)
Source: A.T. Kearney 2013 AEROTM Study
Only 17% have LEED certification
Co
mm
un
ica
tio
n
Stores Business Planning
Channel Strategy
Voice of the Customer
Store Technology
Operating Expense Control
Ch
an
ge M
an
ag
em
en
t
Field Leadership Merchandising/ Supply Chain
Interfaces
StoreOperations
Real Estate Lifecycle Management
4%4%
38% 54%
Not Important
Number One Priority
Important Consideration
Incorporated Into Design When Financial Benefit

A.T. Kearney 82/29951/5ert4rQlkR01QQI0R1 48
A rigorous “bottoms-up” process tied to metrics reduces cost overruns
45%
32%
33%
17%
0%
Exterior Construction
Interior Décor
Fixturing
Lighting
Cost Overruns Experienced By Category (percentage of responses) C
om
mu
nic
ati
on
Stores Business Planning
Channel Strategy
Voice of the Customer
Store Technology
Operating Expense Control
Ch
an
ge M
an
ag
em
en
t
Field Leadership Merchandising/ Supply Chain
Interfaces
StoreOperations
Real Estate Lifecycle Management
Source: A.T. Kearney 2013 AEROTM Study
All Others Bottoms-up & Construction Team Metrics
A.T. Kearney 82/29951/5ert4rQlkR01QQI0R1 49
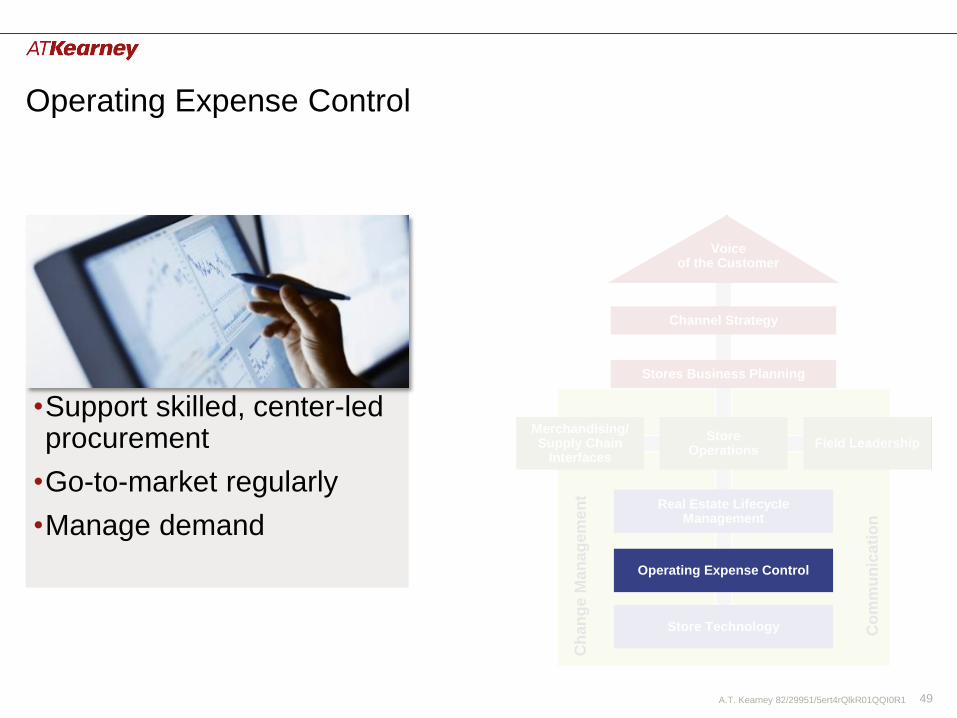
Operating Expense Control
•Support skilled, center-led procurement
•Go-to-market regularly
•Manage demand
Co
mm
un
ica
tio
n
Stores Business Planning
Channel Strategy
Voice of the Customer
Store Technology
Ch
an
ge
Man
ag
em
en
t
Field Leadership Merchandising/ Supply Chain
Interfaces
Store Operations
Real Estate Lifecycle Management
Operating Expense Control

A.T. Kearney 82/29951/5ert4rQlkR01QQI0R1 50
Store Signage
Light Bulbs
Store Supplies
Retail Bags
World-Class Processes
Tools & Techniques
Skills & Training
• Strategic Sourcing
• Center-led procurement organization
• E-RFX and auctions tools
• Should cost analysis and fact-based negotiations
• Analytics, research, supply market dynamics
• Negotiations training
Untapped opportunities
Operating Expense Control
Facilities Management
Co
mm
un
ica
tio
n
Stores Business Planning
Channel Strategy
Voice of the Customer
Store Technology
Ch
an
ge M
an
ag
em
en
t
Field Leadership Merchandising/ Supply Chain
Interfaces
StoreOperations
Real Estate Lifecycle Management
Operating Expense Control
A.T. Kearney 82/29951/5ert4rQlkR01QQI0R1 51
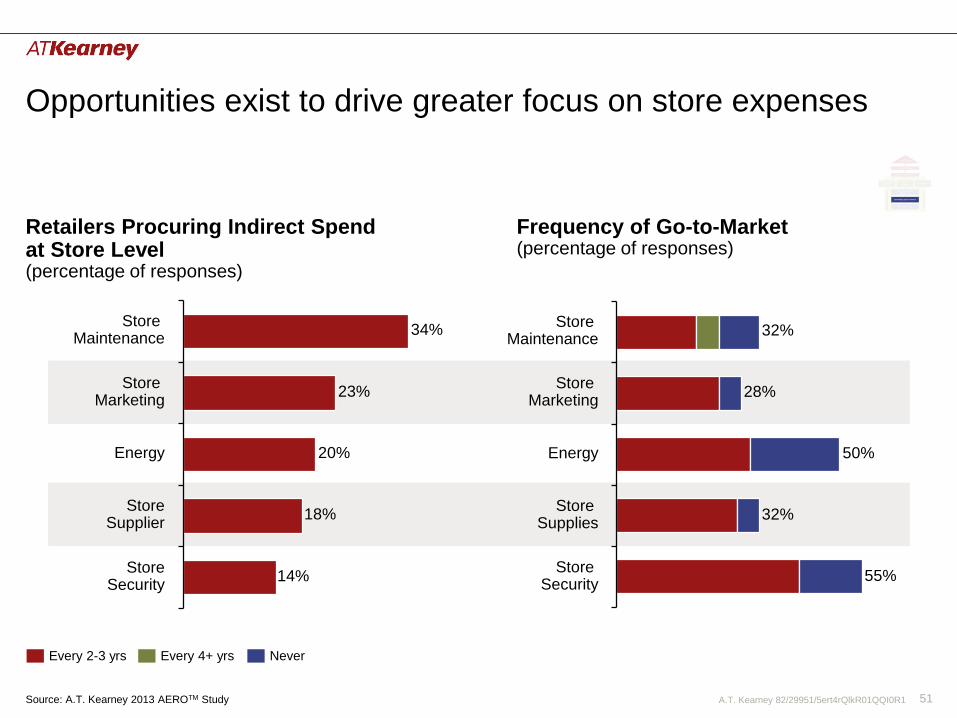
Opportunities exist to drive greater focus on store expenses
Store Security
14%
Store Supplier
18%
Energy 20%
Store Marketing
23%
Store Maintenance
34% 32% Store
Maintenance
28%
Store Security
55%
Store Supplies
32%
Energy 50%
Store Marketing
Retailers Procuring Indirect Spend at Store Level (percentage of responses)
Frequency of Go-to-Market (percentage of responses)
Source: A.T. Kearney 2013 AEROTM Study
Co
mm
un
ica
tio
n
Stores Business Planning
Channel Strategy
Voice of the Customer
Store Technology
Ch
an
ge M
an
ag
em
en
t
Field Leadership Merchandising/ Supply Chain
Interfaces
StoreOperations
Real Estate Lifecycle Management
Operating Expense Control
Every 2-3 yrs Every 4+ yrs Never

A.T. Kearney 82/29951/5ert4rQlkR01QQI0R1 52
Rigorous demand management can contribute to cost containment
Demand Management Practices for Store Supplies (percentage of responses)
44%
36% 36%
Usage Policies
Pack/Package Optimization Ordering Policies & Restrictions
Only 10% of retailers employ all 3 demand management practices
Source: A.T. Kearney 2013 AEROTM Study
Co
mm
un
ica
tio
n
Stores Business Planning
Channel Strategy
Voice of the Customer
Store Technology
Ch
an
ge M
an
ag
em
en
t
Field Leadership Merchandising/ Supply Chain
Interfaces
StoreOperations
Real Estate Lifecycle Management
Operating Expense Control

A.T. Kearney 82/29951/5ert4rQlkR01QQI0R1 53
Store Technology
•Assess customer-facing technologies
•Prioritize operational-efficiency technology
Co
mm
un
ica
tio
n
Stores Business Planning
Channel Strategy
Voice of the Customer
Ch
an
ge
Man
ag
em
en
t
Field Leadership Merchandising/ Supply Chain
Interfaces
Store Operations
Real Estate Lifecycle Management
Operating Expense Control
Store Technology

A.T. Kearney 82/29951/5ert4rQlkR01QQI0R1 54
Digital levers for better targeting consumers and increasing sales
Build rapport and brand loyalty
Engage through self-service
Offer recommendations; track customer contacts
Improve convenience, access to information and product choices
Maximize brand; “Segment of one”
Technology influences purchasing decisions
Social Media
Kiosk Mobile Digital Levers
Source: A.T. Kearney
Co
mm
un
ica
tio
n
Stores Business Planning
Channel Strategy
Voice of the Customer
Ch
an
ge M
an
ag
em
en
t
Field Leadership Merchandising/ Supply Chain
Interfaces
StoreOperations
Real Estate Lifecycle Management
Operating Expense Control
Store Technology

A.T. Kearney 82/29951/5ert4rQlkR01QQI0R1 55
Two-thirds of respondents feel they have as good or better access to mobile capability and information as store staff
21%
45%
34%
Staff has better information & capability
66%
I have similar or better capability than staff
Respondent’s Mobile & Information capabilities
We have about the same
I feel the staff has better tools / information than me
I have better tools / information than the staff helping
Perceived capability compared to staff Implications
• Consumer Experience: Today’s consumers need to feel that the store is a destination, to give the consumer an experience above and beyond the digital experience – up-scaling
• Re-think Product Info: Physical store does not need to monopolize all stages in the process to be effective in generating sales
• Staff Capabilities: Staff needs to be digitally minded, in a compelling way to help shoppers navigate product catalog and buy online any items not stocked in store
• Supply Chain Integration: With potentially endless aisles, new supply chain processes will become necessary
Source: A.T. Kearney 2013 integrated Channel Engagement Survey, A.T. Kearney Future of Stores Document Summary, 2013
A.T. Kearney 82/29951/5ert4rQlkR01QQI0R1 56
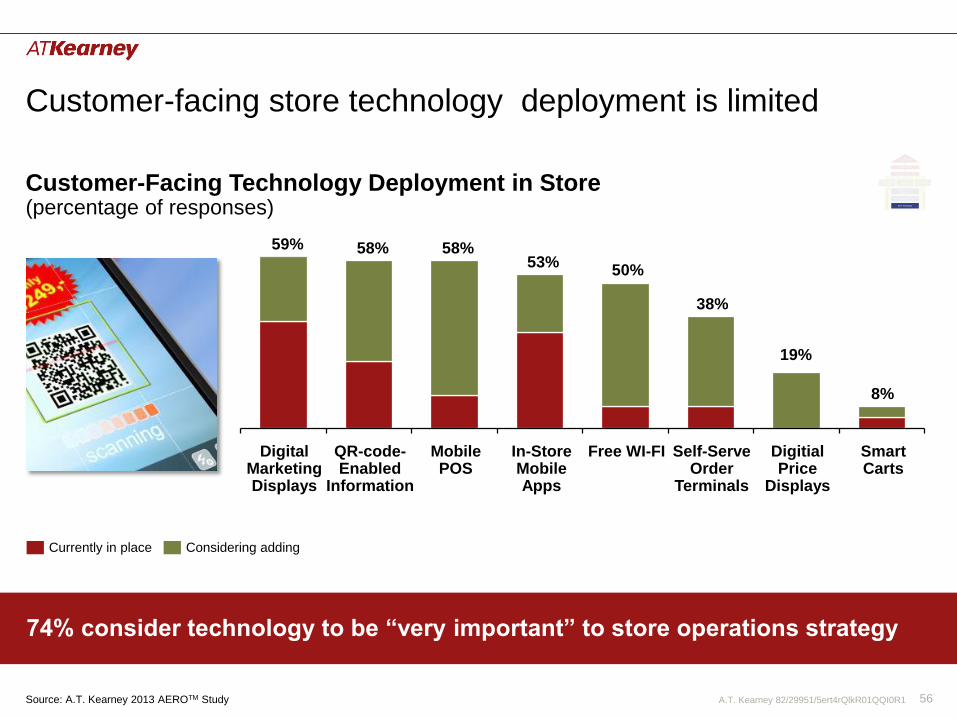
Customer-facing store technology deployment is limited
19%
Mobile POS
QR-code-Enabled
Information
In-Store Mobile Apps
Free WI-FI Digital Marketing Displays
Smart Carts
Digitial Price
Displays
Self-Serve Order
Terminals
58% 53%
58%
38%
50%
8%
59%
Customer-Facing Technology Deployment in Store (percentage of responses)
74% consider technology to be “very important” to store operations strategy
Source: A.T. Kearney 2013 AEROTM Study
Co
mm
un
ica
tio
n
Stores Business Planning
Channel Strategy
Voice of the Customer
Ch
an
ge M
an
ag
em
en
t
Field Leadership Merchandising/ Supply Chain
Interfaces
StoreOperations
Real Estate Lifecycle Management
Operating Expense Control
Store Technology
Currently in place Considering adding
A.T. Kearney 82/29951/5ert4rQlkR01QQI0R1 57
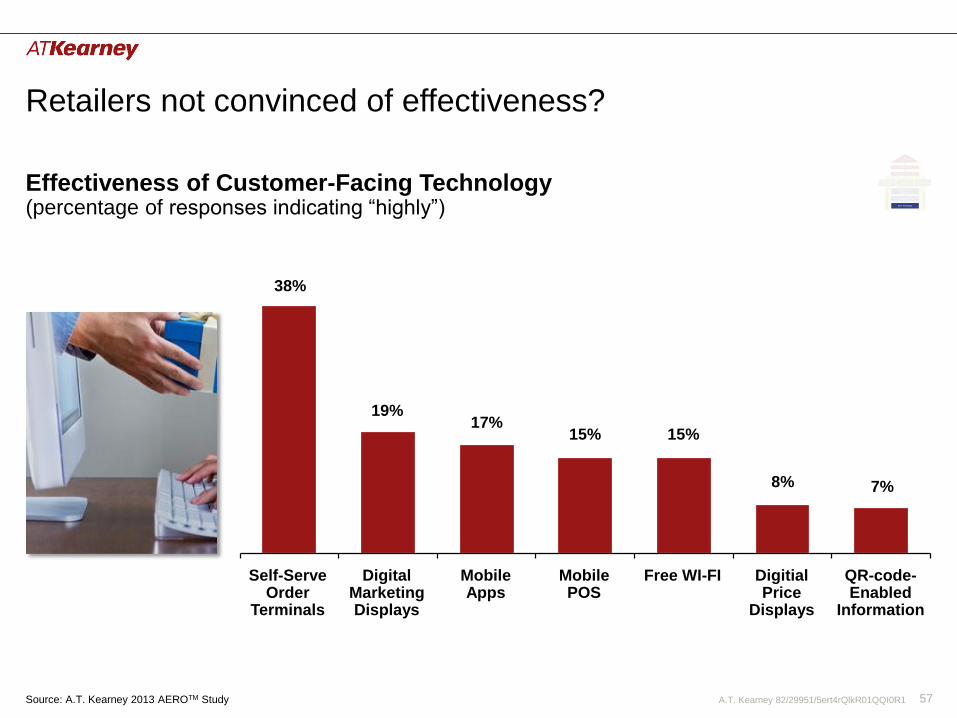
Retailers not convinced of effectiveness?
38%
19% 17%
15% 15%
8% 7%
QR-code-Enabled
Information
Digitial Price
Displays
Free WI-FI Mobile POS
Mobile Apps
Digital Marketing Displays
Self-Serve Order
Terminals
Effectiveness of Customer-Facing Technology (percentage of responses indicating “highly”) C
om
mu
nic
ati
on
Stores Business Planning
Channel Strategy
Voice of the Customer
Ch
an
ge M
an
ag
em
en
t
Field Leadership Merchandising/ Supply Chain
Interfaces
StoreOperations
Real Estate Lifecycle Management
Operating Expense Control
Store Technology
Source: A.T. Kearney 2013 AEROTM Study

A.T. Kearney 82/29951/5ert4rQlkR01QQI0R1 58
Increased adoption of operational-efficiency technologies
Deployment of Operational-Efficiency Technology in Store (percentage of responses)
46% 50%
62% 62%
73% 77%
Hand-held Scanner
for Inventory Management
Tablets/ Devices
Labor Scheduling Application
Time & Attendance Application
Free WI-FI Customer Traffic Flow
Technology
Source: A.T. Kearney 2013 AEROTM Study
Co
mm
un
ica
tio
n
Stores Business Planning
Channel Strategy
Voice of the Customer
Ch
an
ge M
an
ag
em
en
t
Field Leadership Merchandising/ Supply Chain
Interfaces
StoreOperations
Real Estate Lifecycle Management
Operating Expense Control
Store Technology
Considering adding Currently in place
A.T. Kearney 82/29951/5ert4rQlkR01QQI0R1 59
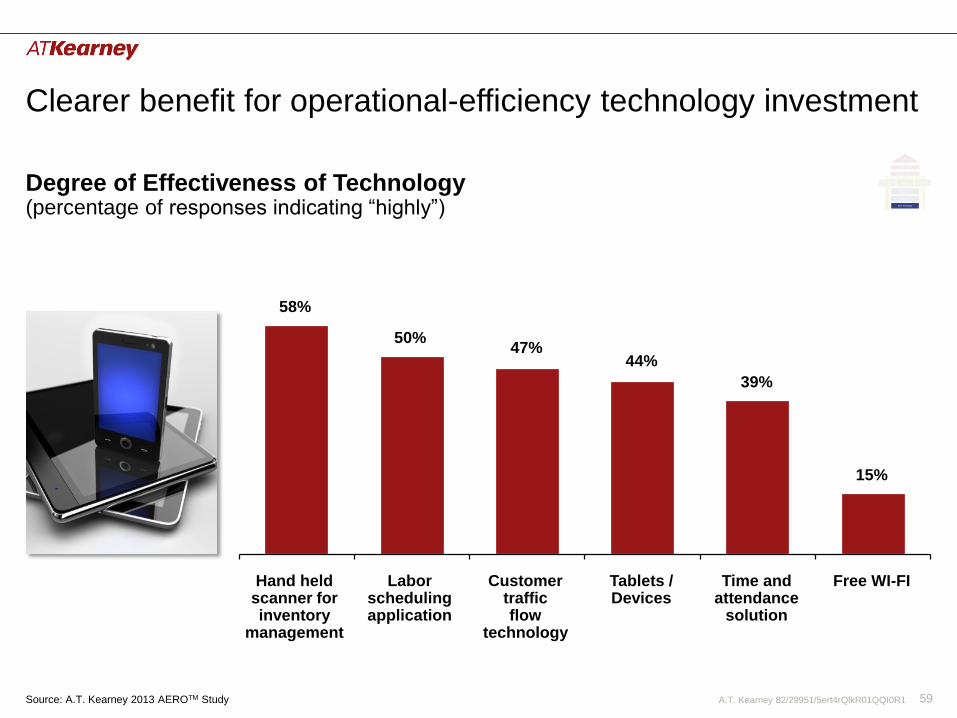
Clearer benefit for operational-efficiency technology investment
Degree of Effectiveness of Technology (percentage of responses indicating “highly”)
58%
50% 47%
44%
39%
15%
Labor scheduling application
Free WI-FI Time and attendance
solution
Tablets / Devices
Customer traffic flow
technology
Hand held scanner for inventory
management
Co
mm
un
ica
tio
n
Stores Business Planning
Channel Strategy
Voice of the Customer
Ch
an
ge M
an
ag
em
en
t
Field Leadership Merchandising/ Supply Chain
Interfaces
StoreOperations
Real Estate Lifecycle Management
Operating Expense Control
Store Technology
Source: A.T. Kearney 2013 AEROTM Study
A.T. Kearney 82/29951/5ert4rQlkR01QQI0R1 60
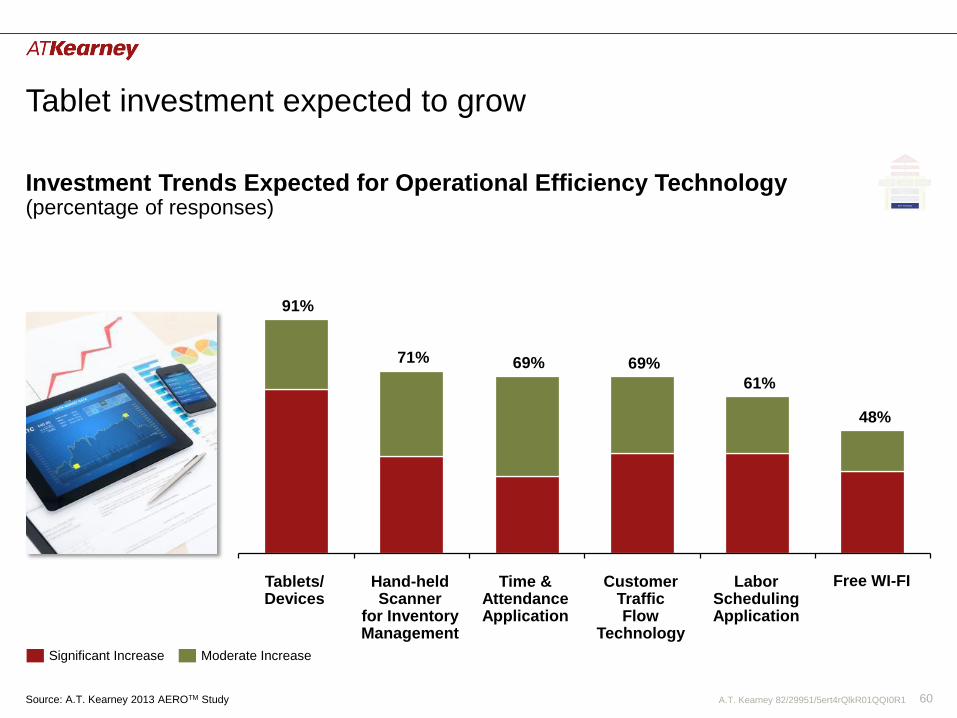
Tablet investment expected to grow
48%
Time & Attendance Application
61%
Tablets/ Devices
69%
Labor Scheduling Application
71%
Customer Traffic Flow
Technology
91%
Hand-held Scanner
for Inventory Management
69%
Investment Trends Expected for Operational Efficiency Technology (percentage of responses) C
om
mu
nic
ati
on
Stores Business Planning
Channel Strategy
Voice of the Customer
Ch
an
ge M
an
ag
em
en
t
Field Leadership Merchandising/ Supply Chain
Interfaces
StoreOperations
Real Estate Lifecycle Management
Operating Expense Control
Store Technology
Source: A.T. Kearney 2013 AEROTM Study
Significant Increase Moderate Increase
Free WI-FI
A.T. Kearney 82/29951/5ert4rQlkR01QQI0R1 61
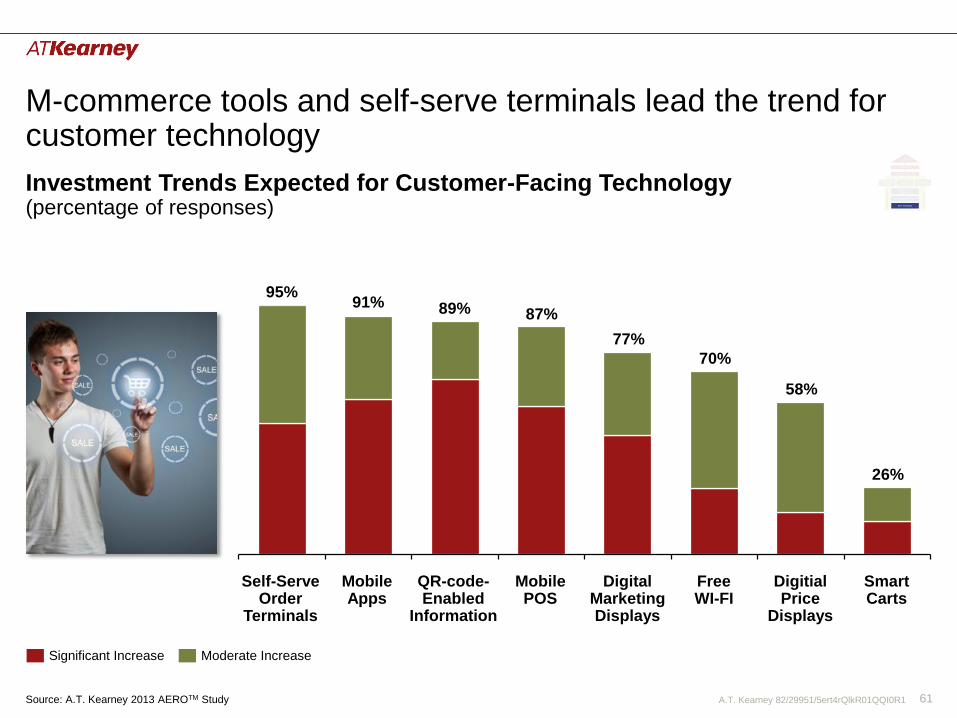
M-commerce tools and self-serve terminals lead the trend for customer technology
Smart Carts
26%
Digitial Price
Displays
58%
Free WI-FI
70%
Digital Marketing Displays
77%
91%
Mobile POS
87%
QR-code-Enabled
Information
89%
Self-Serve Order
Terminals
Mobile Apps
95%
Investment Trends Expected for Customer-Facing Technology (percentage of responses) C
om
mu
nic
ati
on
Stores Business Planning
Channel Strategy
Voice of the Customer
Ch
an
ge M
an
ag
em
en
t
Field Leadership Merchandising/ Supply Chain
Interfaces
StoreOperations
Real Estate Lifecycle Management
Operating Expense Control
Store Technology
Source: A.T. Kearney 2013 AEROTM Study
Significant Increase Moderate Increase
A.T. Kearney 82/29951/5ert4rQlkR01QQI0R1 62
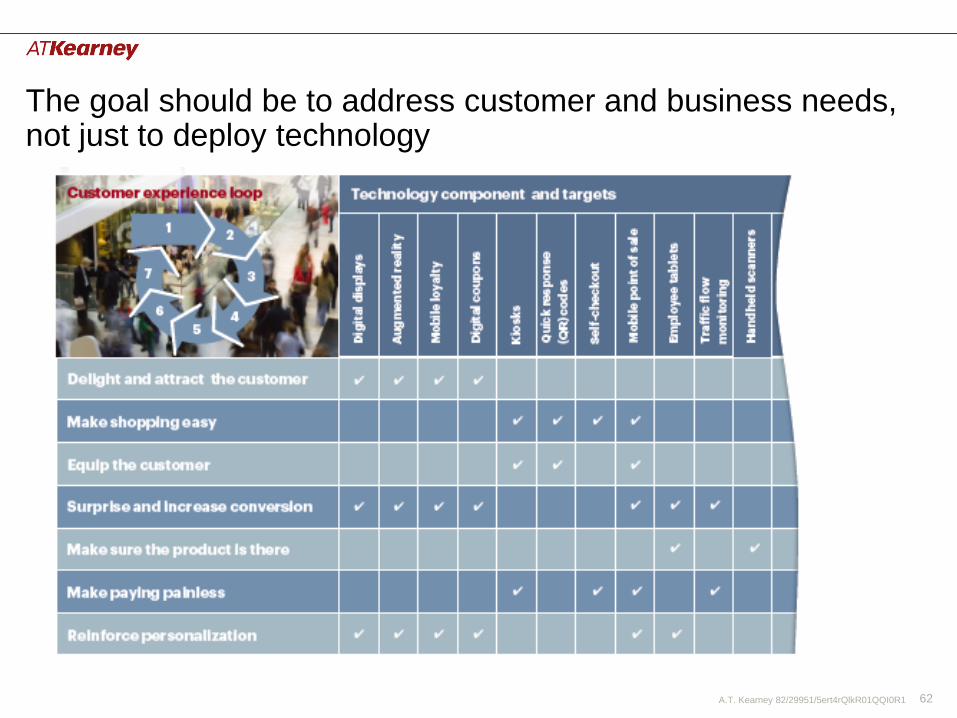
The goal should be to address customer and business needs, not just to deploy technology

A.T. Kearney 82/29951/5ert4rQlkR01QQI0R1 63
Change Management and Communications
• Listen to your employees
• Pilot most, roll-out fewer
• Build in change management
Co
mm
un
ica
tio
n
Stores Business Planning
Channel Strategy
Voice of the Customer
Ch
an
ge
Man
ag
em
en
t
Field Leadership Merchandising/ Supply Chain
Interfaces
Store Operations
Real Estate Lifecycle Management
Operating Expense Control
Store Technology

A.T. Kearney 82/29951/5ert4rQlkR01QQI0R1 64
Merchandising Supervisor
Conflicting messages strain in-store merchandising decisions
Store Manager
Weekly Ads Vendor Deals
Weekly Merch. Kit District Manager
Central Merch Team
Co
mm
un
ica
tio
n
Stores Business Planning
Channel Strategy
Voice of the Customer
Ch
an
ge M
an
ag
em
en
t
Field Leadership Merchandising/ Supply Chain
Interfaces
StoreOperations
Real Estate Lifecycle Management
Operating Expense Control
Store Technology
Standard Operating
Procedures

A.T. Kearney 82/29951/5ert4rQlkR01QQI0R1 65
Emerging communications channels yet to be leveraged
Twittter
8%
Voicemail
8%
Facebook Pages
19%
Mobile Device
25%
Intranet/ Employee
Portal
77%
92%
Through Supervisor
96%
Frequency of Employee Communications via Channel (percentage of responses)
Only 35% of retailers assess store employee communications and work to evolve their approach
Source: A.T. Kearney 2013 AEROTM Study
Co
mm
un
ica
tio
n
Stores Business Planning
Channel Strategy
Voice of the Customer
Ch
an
ge M
an
ag
em
en
t
Field Leadership Merchandising/ Supply Chain
Interfaces
StoreOperations
Real Estate Lifecycle Management
Operating Expense Control
Store Technology
Daily Weekly Monthly & Less Frequent
A.T. Kearney 82/29951/5ert4rQlkR01QQI0R1 66
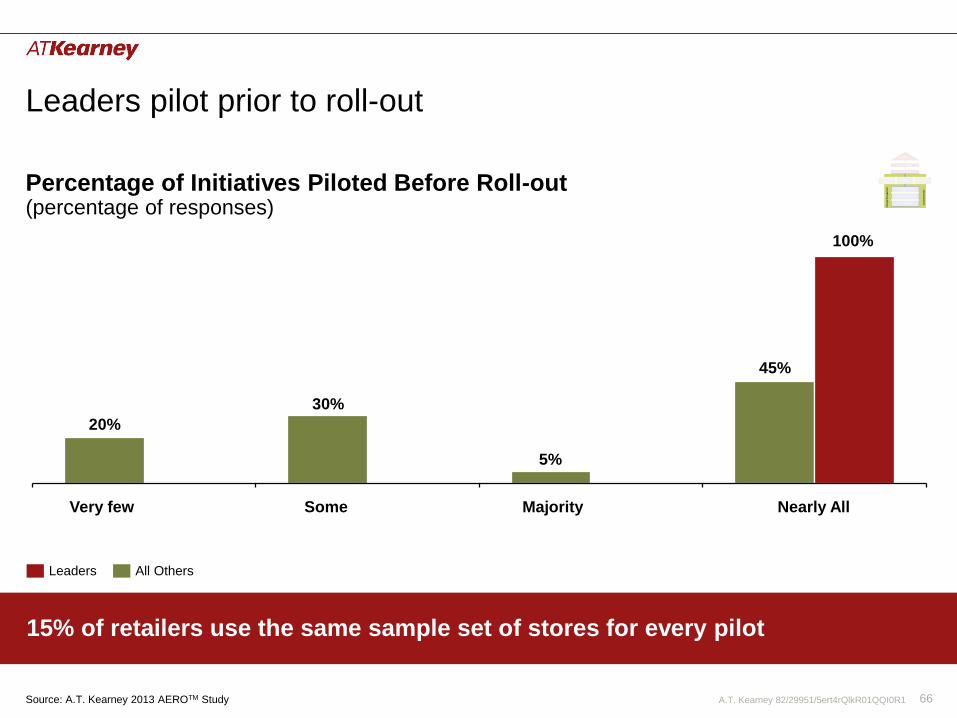
Leaders pilot prior to roll-out
15% of retailers use the same sample set of stores for every pilot
Percentage of Initiatives Piloted Before Roll-out (percentage of responses) C
om
mu
nic
ati
on
Stores Business Planning
Channel Strategy
Voice of the Customer
Ch
an
ge M
an
ag
em
en
t
Field Leadership Merchandising/ Supply Chain
Interfaces
StoreOperations
Real Estate Lifecycle Management
Operating Expense Control
Store Technology
Source: A.T. Kearney 2013 AEROTM Study
Leaders All Others
20%
30%
5%
45%
Nearly All Majority Some Very few
100%
A.T. Kearney 82/29951/5ert4rQlkR01QQI0R1 67
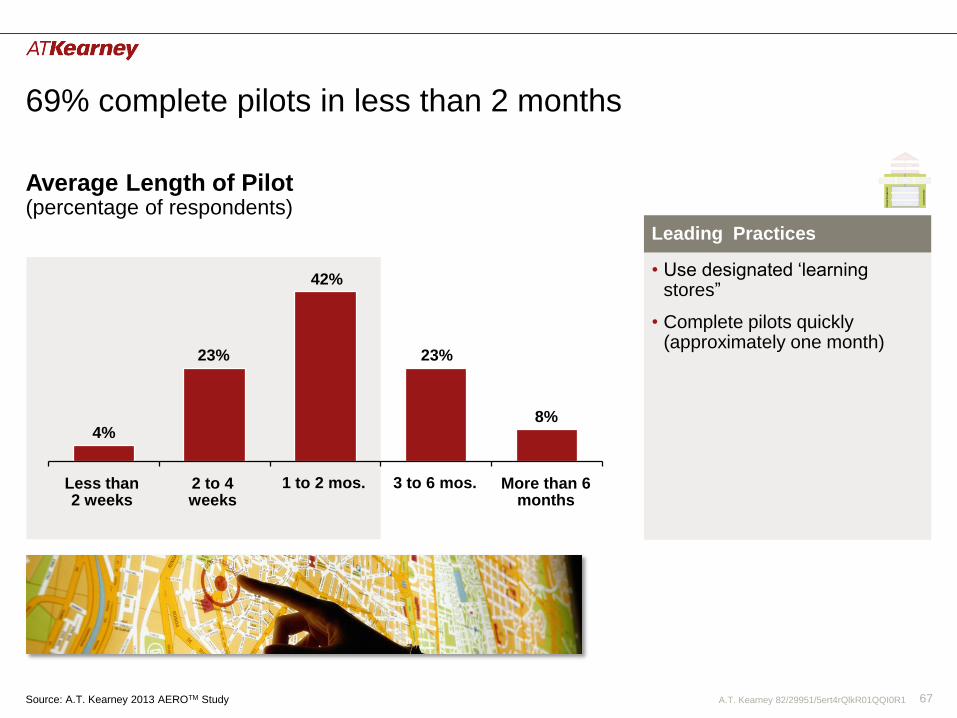
• Use designated ‘learning stores”
• Complete pilots quickly (approximately one month)
Leading Practices
69% complete pilots in less than 2 months
Average Length of Pilot (percentage of respondents) C
om
mu
nic
ati
on
Stores Business Planning
Channel Strategy
Voice of the Customer
Ch
an
ge M
an
ag
em
en
t
Field Leadership Merchandising/ Supply Chain
Interfaces
StoreOperations
Real Estate Lifecycle Management
Operating Expense Control
Store Technology
Source: A.T. Kearney 2013 AEROTM Study
4%
23% 23%
8%
More than 6 months
3 to 6 mos. 1 to 2 mos. 2 to 4 weeks
Less than 2 weeks
42%
A.T. Kearney 82/29951/5ert4rQlkR01QQI0R1 68
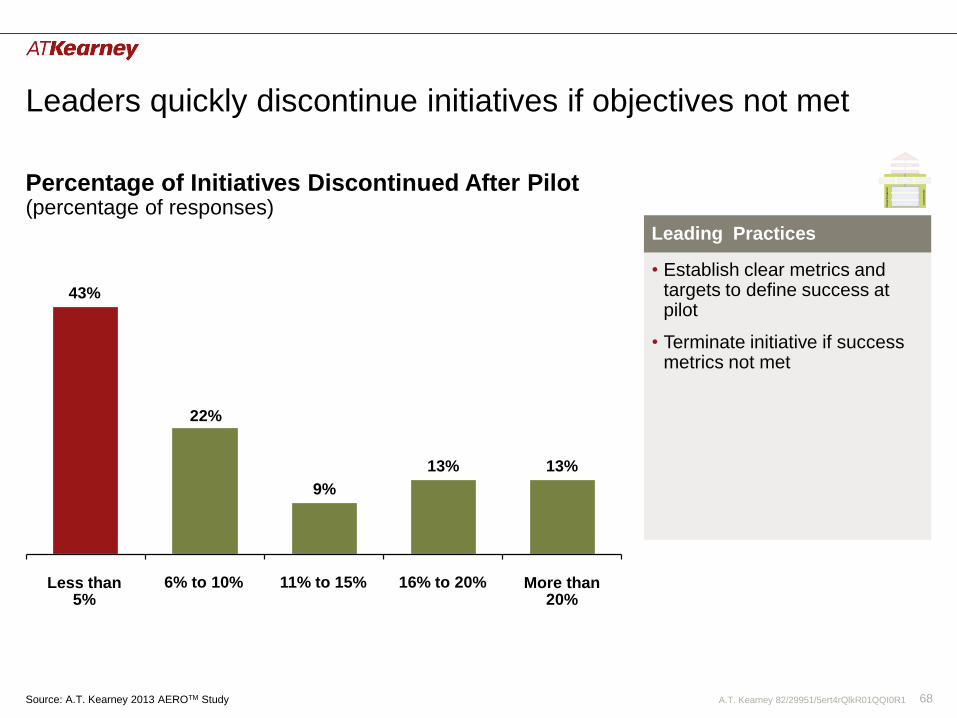
Leaders quickly discontinue initiatives if objectives not met
Percentage of Initiatives Discontinued After Pilot (percentage of responses) C
om
mu
nic
ati
on
Stores Business Planning
Channel Strategy
Voice of the Customer
Ch
an
ge M
an
ag
em
en
t
Field Leadership Merchandising/ Supply Chain
Interfaces
StoreOperations
Real Estate Lifecycle Management
Operating Expense Control
Store Technology
Source: A.T. Kearney 2013 AEROTM Study
• Establish clear metrics and targets to define success at pilot
• Terminate initiative if success metrics not met
Leading Practices
22%
9%
13% 13%
16% to 20% 11% to 15% 6% to 10% Less than 5%
More than 20%
43%

A.T. Kearney 82/29951/5ert4rQlkR01QQI0R1 69
Less than half assess 6 months after roll-out
Compliance Monitoring (percentage of responses)
35% of retailers believe they achieve 100% compliance
Source: A.T. Kearney 2013 AEROTM Study
74% 67%
48% 48%
37%
For 6 months post-
implementation
On-going annual basis
For 12 months post-
implementation
At completion
During implementation
Co
mm
un
ica
tio
n
Stores Business Planning
Channel Strategy
Voice of the Customer
Ch
an
ge M
an
ag
em
en
t
Field Leadership Merchandising/ Supply Chain
Interfaces
StoreOperations
Real Estate Lifecycle Management
Operating Expense Control
Store Technology

A.T. Kearney 82/29951/5ert4rQlkR01QQI0R1 70
Attention to change management is lacking
96%
85% 81%
73%
27% 19%
Follow up success
measurement
Clearly defined metrics
Employee certification
Dedicated change management
program
Dedicated team
Employee training
Approaches to Initiative Rollout (percentage of responses)
“Lack of dedicated project resources” and “too many initiatives at one time” most often cited as barriers to successful change
Source: A.T. Kearney 2013 AEROTM Study
Co
mm
un
ica
tio
n
Stores Business Planning
Channel Strategy
Voice of the Customer
Ch
an
ge M
an
ag
em
en
t
Field Leadership Merchandising/ Supply Chain
Interfaces
StoreOperations
Real Estate Lifecycle Management
Operating Expense Control
Store Technology

A.T. Kearney 82/29951/5ert4rQlkR01QQI0R1 71
Four elements to robust change management
A.T. Kearney Change Management Framework
Lead top-down; Set the mandate
and organizational need for change
Establish ecosystem and controls needed to sustain the change
Align underlying cultural principals and change behavioral norms
Drive adoption bottoms-up; Shifting
individual ownership of the change
Cultural & Behavioral Norms Awareness & Inclusion
Ownership & Adoption Permanence
ALIGN
SHIFT
LEAD
SUSTAIN
Source: A.T. Kearney FIT TransformationTM
Co
mm
un
ica
tio
n
Stores Business Planning
Channel Strategy
Voice of the Customer
Ch
an
ge M
an
ag
em
en
t
Field Leadership Merchandising/ Supply Chain
Interfaces
StoreOperations
Real Estate Lifecycle Management
Operating Expense Control
Store Technology

A.T. Kearney 82/29951/5ert4rQlkR01QQI0R1 72
Change management practices lead to more successful implementations
Success Achieving Change (percentage of respondents)
Limited Successful
Somewhat Successful
Very Successful
All Others Leading Practice
Source: A.T. Kearney 2013 AEROTM Study
Leading Practice Approach
• Success metrics defined
• Dedicated initiative team
• Store shares accountability
• Compliance measured at 12 months+
50%
35% 33%
55%
17%
11%
Co
mm
un
ica
tio
n
Stores Business Planning
Channel Strategy
Voice of the Customer
Ch
an
ge M
an
ag
em
en
t
Field Leadership Merchandising/ Supply Chain
Interfaces
StoreOperations
Real Estate Lifecycle Management
Operating Expense Control
Store Technology
A.T. Kearney 82/29951/5ert4rQlkR01QQI0R1 73
• Overview of AEROTM survey
• Overview of survey findings and our insights
• Next steps for retailers
A.T. Kearney 82/29951/5ert4rQlkR01QQI0R1 74
Final thoughts from AEROTM…
Source: A.T. Kearney 2013 AEROTM Study
• Holistic continuous improvement
• Turn over every rock
• Never be satisfied with status quo
• Trial and focus…and enable adoption

A.T. Kearney 82/29951/5ert4rQlkR01QQI0R1 75
For more information www.atkearney.com
Please contact me with any questions
Adam Pressman Partner [email protected] Mobile – 773.251.1667