drinking water sources and storage envr 890-2 mark d. sobsey spring, 2009
Post on 21-Dec-2015
215 views
TRANSCRIPT
Drinking Water Sources and Storage
ENVR 890-2
Mark D. Sobsey
Spring, 2009
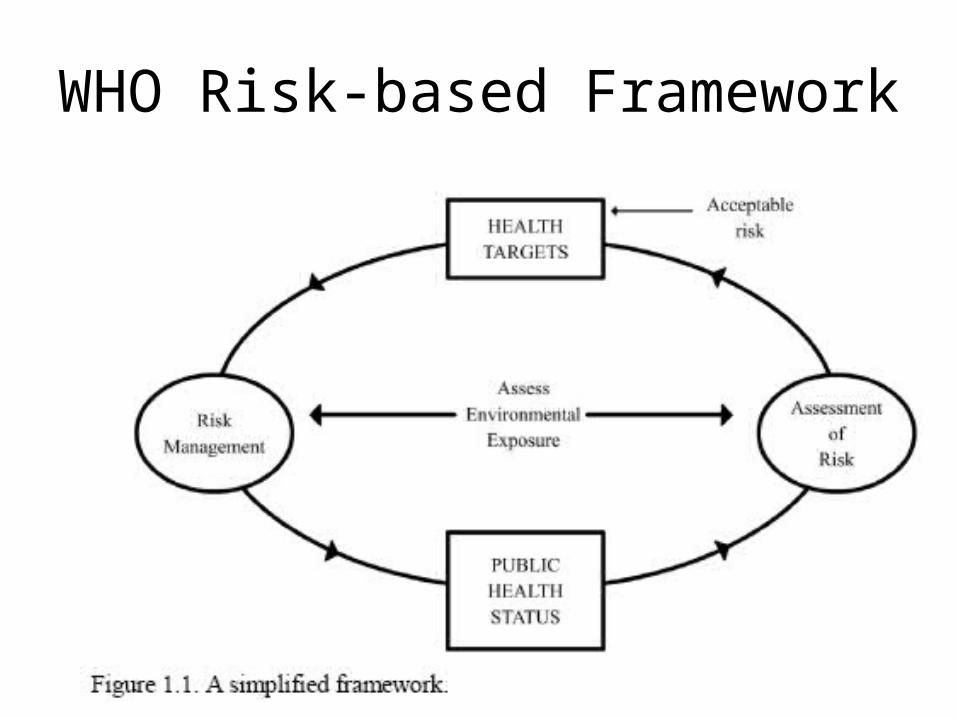
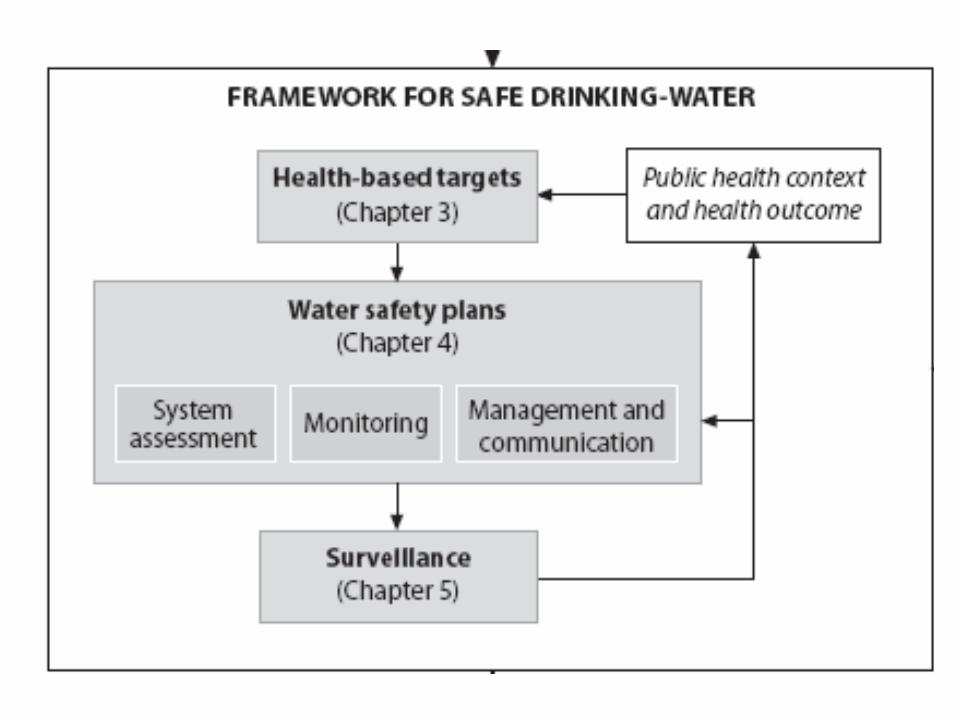
WHO Risk-based Framework
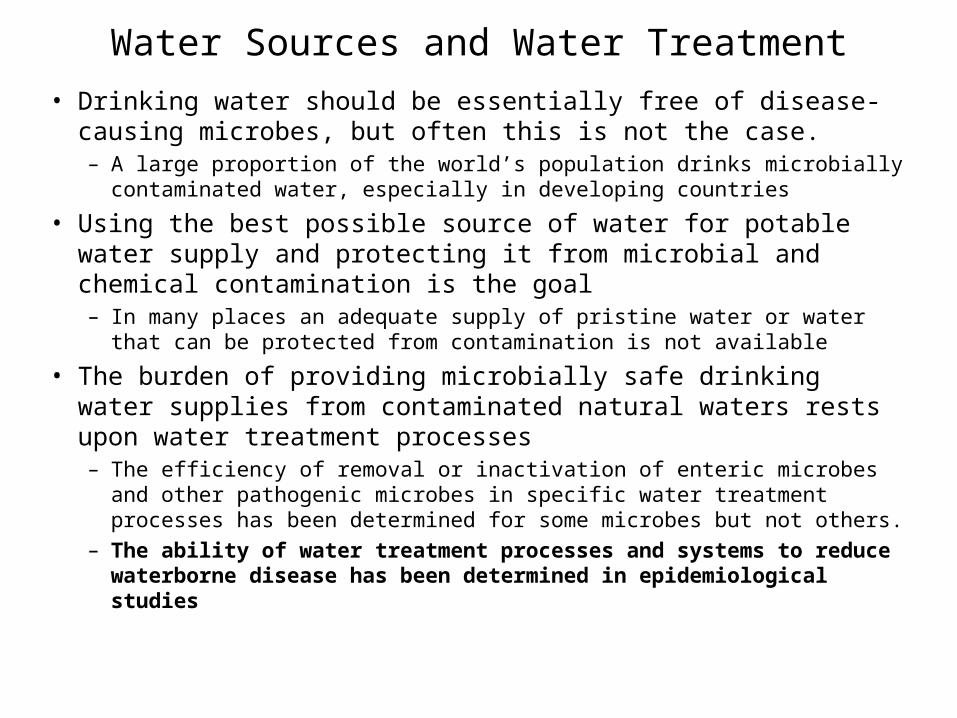
Water Sources and Water Treatment• Drinking water should be essentially free of disease-causing microbes,
but often this is not the case.– A large proportion of the world’s population drinks microbially contaminated
water, especially in developing countries
• Using the best possible source of water for potable water supply and protecting it from microbial and chemical contamination is the goal– In many places an adequate supply of pristine water or water that can be
protected from contamination is not available
• The burden of providing microbially safe drinking water supplies from contaminated natural waters rests upon water treatment processes– The efficiency of removal or inactivation of enteric microbes and other
pathogenic microbes in specific water treatment processes has been determined for some microbes but not others.
– The ability of water treatment processes and systems to reduce waterborne disease has been determined in epidemiological studies
Source Water Protection: Water Resources Management
• Integral to the preventive management of drinking-water quality.
• Preventing microbial and chemical contamination of source water is the first barrier against drinking-water contamination of public health concern.
• Water resource management and potentially polluting human activity in catchments and aquifers influence water quality.
• This impacts treatment steps required to ensure safe water
• Preventive action may be preferable to upgrading treatment.
Influence of Land Use on Water Quality• Assess land use influence on water quality• Not normally undertaken by health authorities or drinking-
water supply agencies alone• Establish close collaboration between public health authority,
water supplier and resource management agency– may include other sectors, .e.g., agriculture, traffic, tourism
or urban development.• National authorities must interact with other sectors to
formulate national policy for integrated water resource management
• Set up regional and local structures to implement policy– National authorities need to guide regional and local
authorities by providing tools
Land Uses to Consider that Influence Water Quality
• land cover modification• extraction activities• construction/modification of waterways• application of fertilizers, herbicides, pesticides and
other chemicals• livestock density and application of manure• road construction, maintenance and use• various forms of recreation• urban or rural residential development
– Pay particular attention to excreta disposal, sanitation, landfill and waste disposal
• other potentially polluting human activities, such as industry, military sites,
Drinking Water Sources
• Ground Water
• Surface water
• Rainwater
• Condensed water from the atmosphere
• Reclaimed wastewater
• Other?
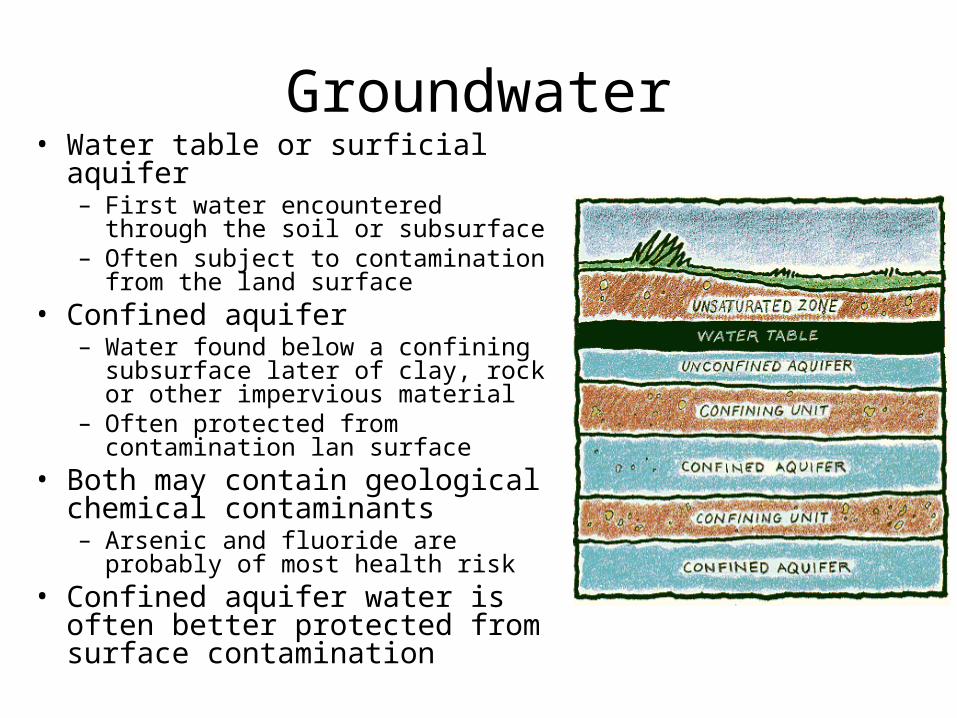
Groundwater• Water table or surficial aquifer
– First water encountered through the soil or subsurface
– Often subject to contamination from the land surface
• Confined aquifer– Water found below a confining
subsurface later of clay, rock or other impervious material
– Often protected from contamination lan surface
• Both may contain geological chemical contaminants– Arsenic and fluoride are probably of
most health risk• Confined aquifer water is often
better protected from surface contamination
Surface Waters
• Lakes, ponds and other and “confined” bodies of water
• Rivers, streams, creeks and other flowing bodies of water
• All are subject to direct contamination from wastewater and excreta discharges
• All are subject to contamination from land runoff• Surface water should be assumed to be
contaminated unless proven otherwise by direct and indirect evidence from observations and analysis
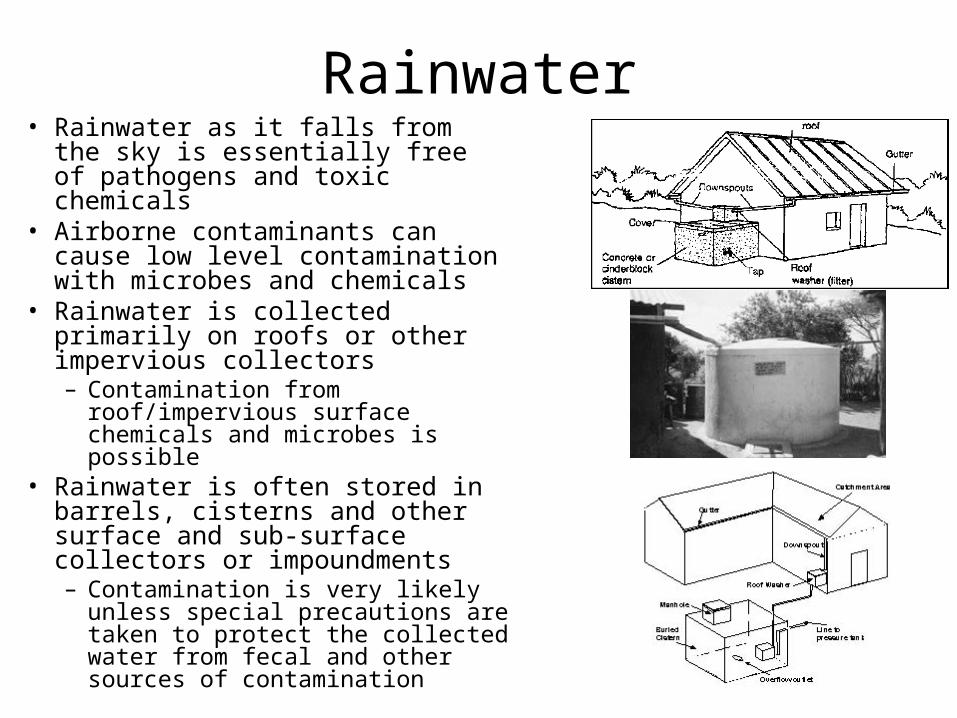
Rainwater• Rainwater as it falls from the sky is
essentially free of pathogens and toxic chemicals
• Airborne contaminants can cause low level contamination with microbes and chemicals
• Rainwater is collected primarily on roofs or other impervious collectors– Contamination from roof/impervious
surface chemicals and microbes is possible
• Rainwater is often stored in barrels, cisterns and other surface and sub-surface collectors or impoundments– Contamination is very likely unless
special precautions are taken to protect the collected water from fecal and other sources of contamination
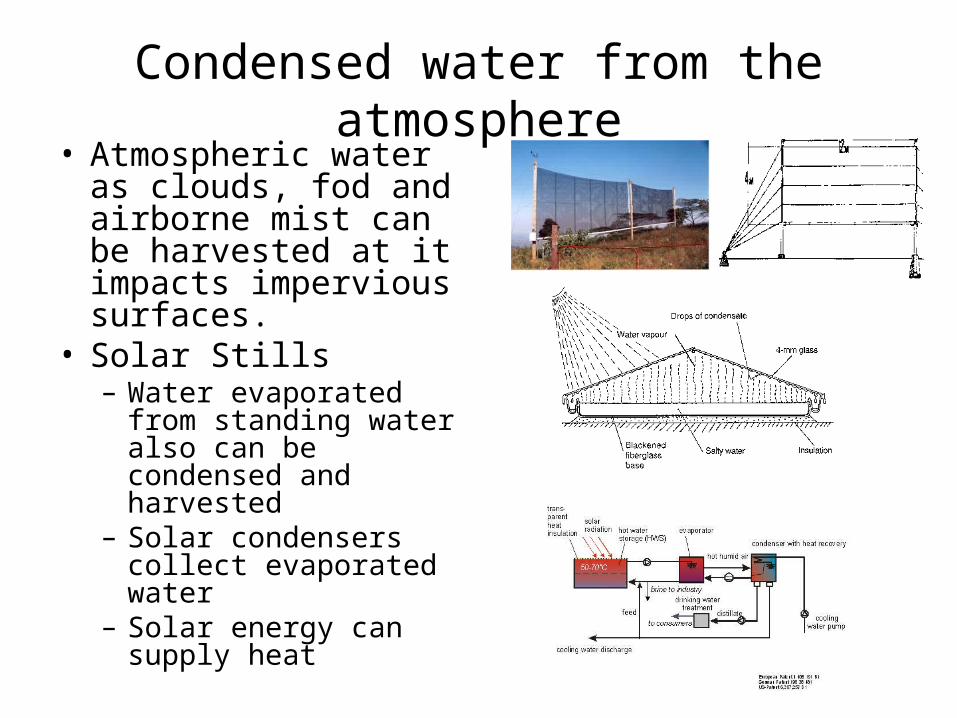
Condensed water from the atmosphere• Atmospheric water as
clouds, fod and airborne mist can be harvested at it impacts impervious surfaces.
• Solar Stills– Water evaporated from
standing water also can be condensed and harvested
– Solar condensers collect evaporated water
– Solar energy can supply heat
Reclaimed Water
• Water can be purified from sewage and other wastewater
• Reuse for non-potable purposes in encouraged• Reuse for potable purposes is discouraged
– Indirect reuse is considered feasible and of less risk by recharging aquifers or reservoirs and allowing addition die-off and further treatment
• WHO and countries have regulations for non-potable and potable reuse
Water Treatment Processes: StorageReservoirs, aquifers & other systems:
– store water– protect it from contamination
• Factors influencing microbe reductions (site-specific)– detention time– temperature– microbial activity– water quality: particulates, dissolved solids, salinity– sunlight– sedimentation– land use– precipitation– runoff or infiltration
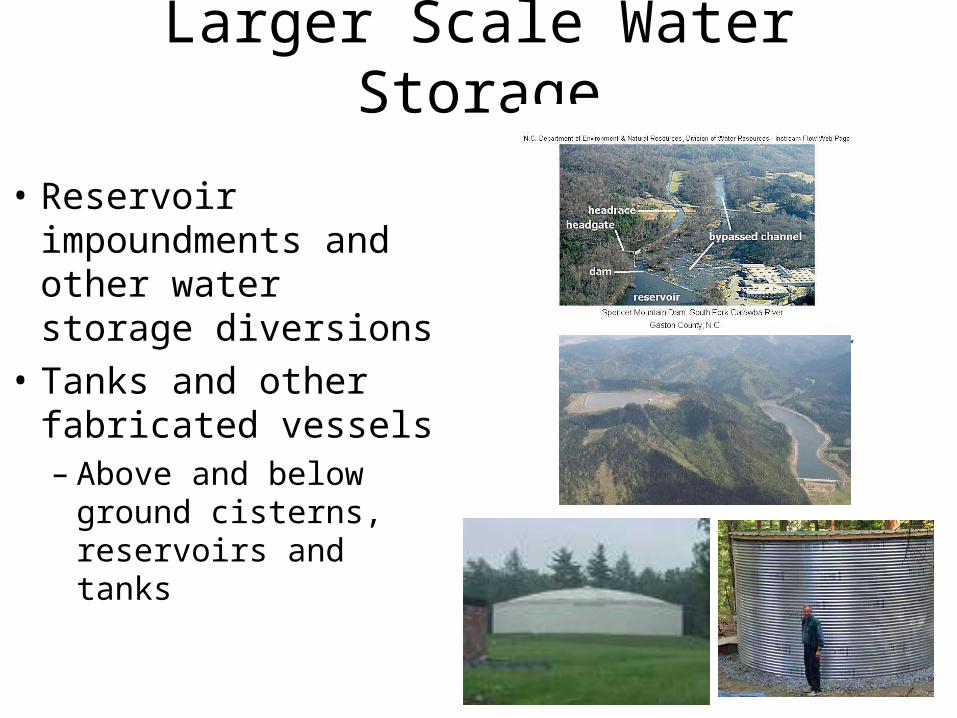
Larger Scale Water Storage
• Reservoir impoundments and other water storage diversions
• Tanks and other fabricated vessels– Above and below
ground cisterns, reservoirs and tanks
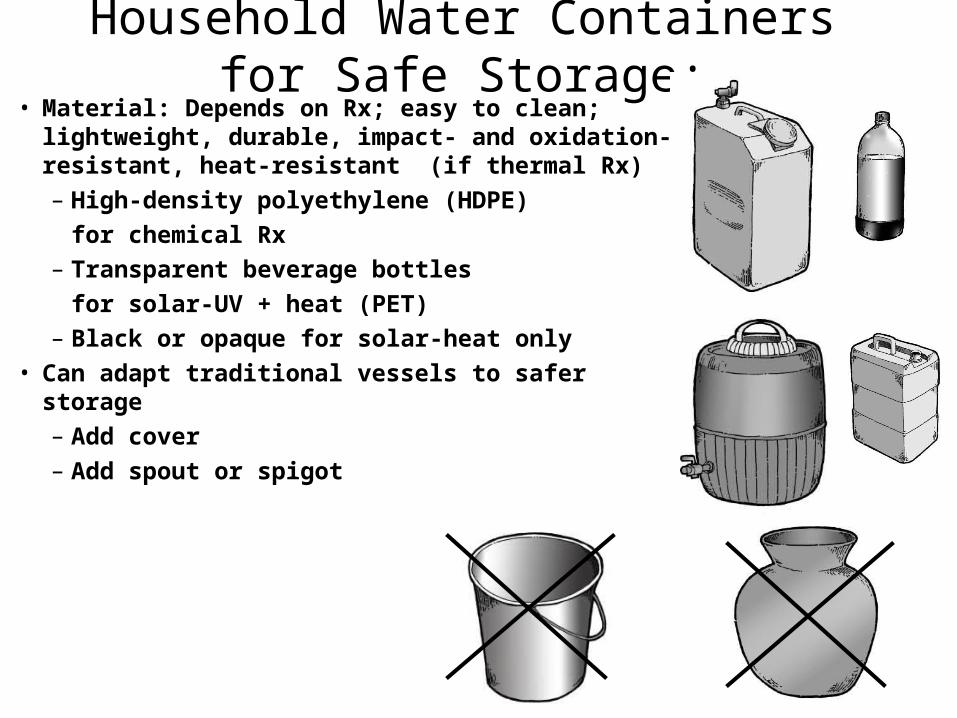
Household Water Containers for Safe Storage:• Material: Depends on Rx; easy to clean; lightweight,
durable, impact- and oxidation- resistant, heat-resistant (if thermal Rx)– High-density polyethylene (HDPE)
for chemical Rx– Transparent beverage bottles
for solar-UV + heat (PET)– Black or opaque for solar-heat only
• Can adapt traditional vessels to safer storage– Add cover– Add spout or spigot
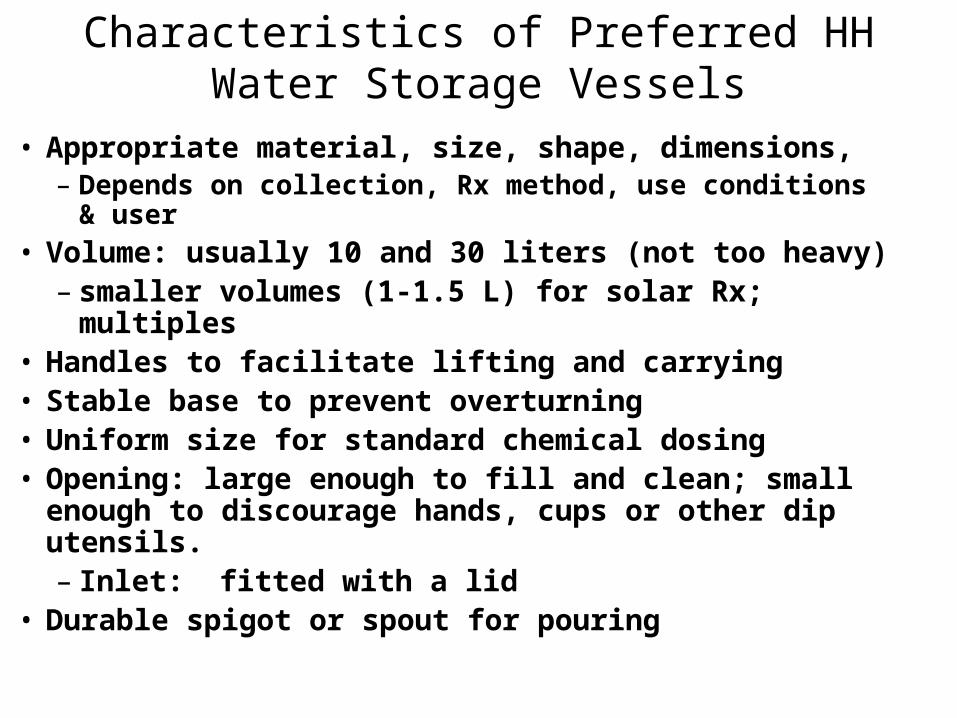
Characteristics of Preferred HH Water Storage Vessels
• Appropriate material, size, shape, dimensions, – Depends on collection, Rx method, use conditions & user
• Volume: usually 10 and 30 liters (not too heavy)– smaller volumes (1-1.5 L) for solar Rx; multiples
• Handles to facilitate lifting and carrying• Stable base to prevent overturning• Uniform size for standard chemical dosing• Opening: large enough to fill and clean; small enough to
discourage hands, cups or other dip utensils. – Inlet: fitted with a lid
• Durable spigot or spout for pouring
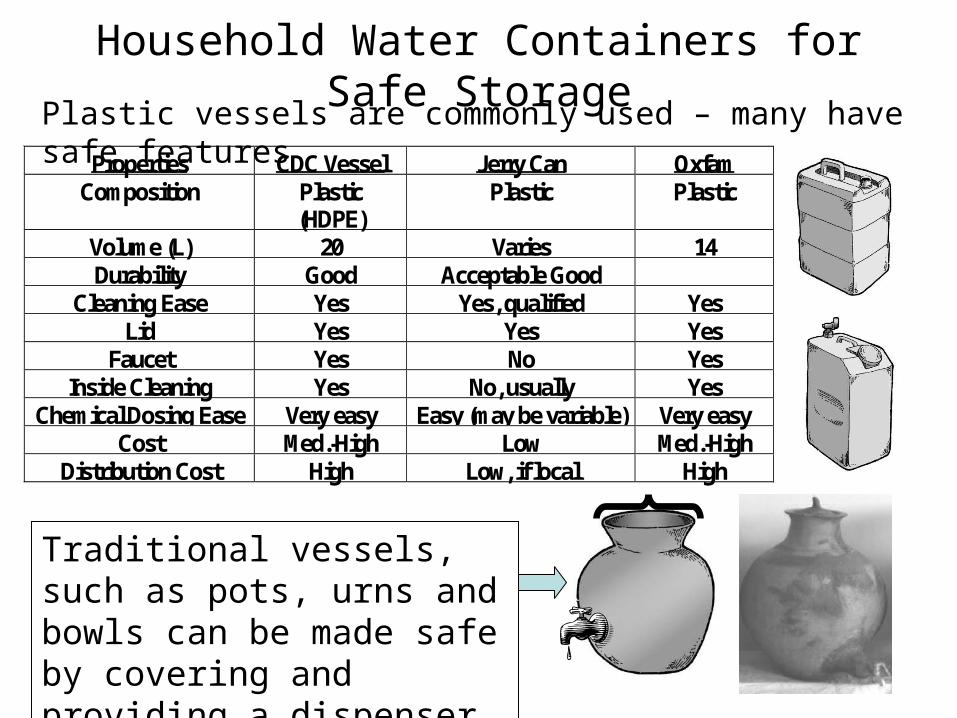
Household Water Containers for Safe Storage
Properties CDC Vessel Jerry Can OxfamComposition Plastic
(HDPE)Plastic Plastic
Volume (L) 20 Varies 14Durability Good Acceptable Good
Cleaning Ease Yes Yes, qualified YesLid Yes Yes Yes
Faucet Yes No YesInside Cleaning Yes No, usually Yes
Chemical Dosing Ease Very easy Easy (may be variable) Very easyCost Med.-High Low Med.-High
Distribution Cost High Low, if local High
Plastic vessels are commonly used – many have safe features
Traditional vessels, such as pots, urns and bowls can be made safe by covering and providing a dispenser (spigot or spout)
Household Water Storage: Disease Risks and Containers for Improved Protection
• Inadequate storage results in microbial contamination and waterborne disease
• Improved storage vessels reduce microbial contamination and disease risks
• Improved storage can be coupled with household treatment to further improve microbial quality and reduce disease risks
• Best implemented and sustained if supported with behavior modification, education, motivation and social marketing
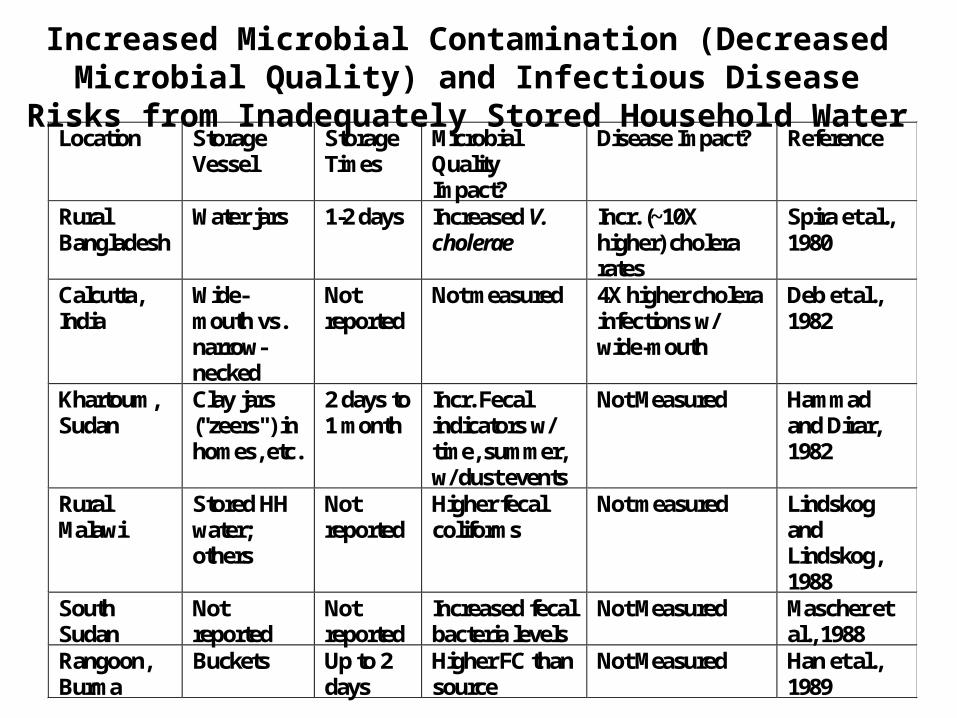
Increased Microbial Contamination (Decreased Microbial Quality) and Infectious Disease Risks from Inadequately Stored Household Water
Location StorageVessel
StorageTimes
MicrobialQualityImpact?
Disease Impact? Reference
RuralBangladesh
Water jars 1-2 days Increased V.cholerae
Incr. (~10Xhigher) cholerarates
Spira et al.,1980
Calcutta,India
Wide-mouth vs.narrow-necked
Notreported
Not measured 4X higher cholerainfections w/wide-mouth
Deb et al.,1982
Khartoum,Sudan
Clay jars("zeers") inhomes, etc.
2 days to1 month
Incr. Fecalindicators w/time, summer,w/ dust events
Not Measured Hammadand Dirar,1982
RuralMalawi
Stored HHwater;others
Notreported
Higher fecalcoliforms
Not measured LindskogandLindskog,1988
SouthSudan
Notreported
Notreported
Increased fecalbacteria levels
Not Measured Mascher etal., 1988
Rangoon,Burma
Buckets Up to 2days
Higher FC thansource
Not Measured Han et al.,1989
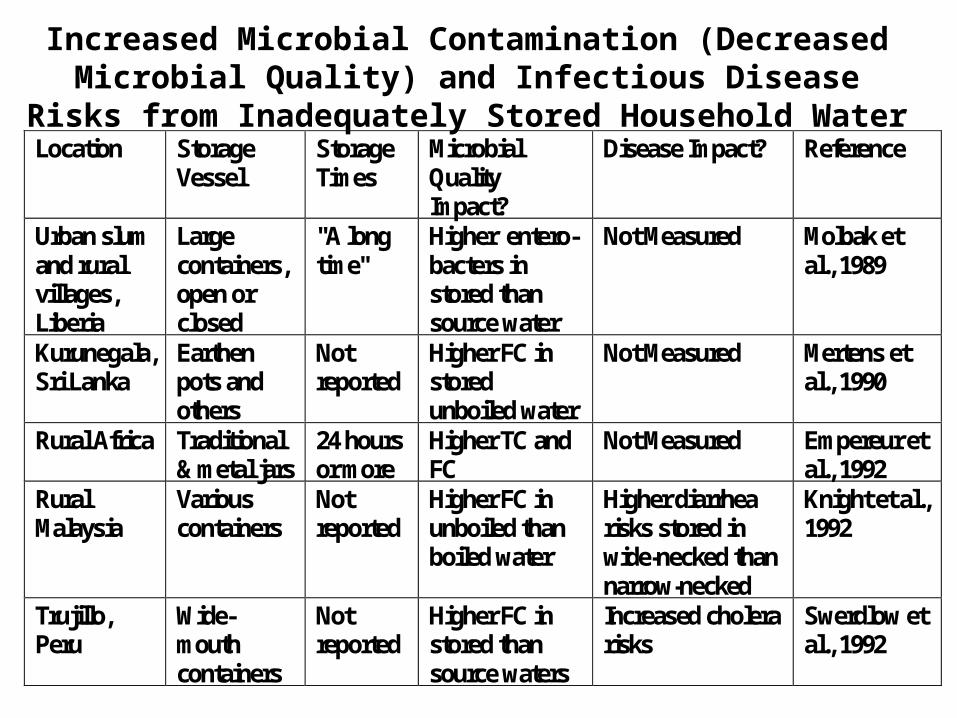
Increased Microbial Contamination (Decreased Microbial Quality) and Infectious Disease Risks from Inadequately Stored Household WaterLocation Storage
VesselStorageTimes
MicrobialQualityImpact?
Disease Impact? Reference
Urban slumand ruralvillages,Liberia
Largecontainers,open orclosed
"A longtime"
Higher entero-bacters instored thansource water
Not Measured Molbak etal., 1989
Kurunegala,Sri Lanka
Earthenpots andothers
Notreported
Higher FC instoredunboiled water
Not Measured Mertens etal., 1990
Rural Africa Traditional& metal jars
24 hoursor more
Higher TC andFC
Not Measured Empereur etal., 1992
RuralMalaysia
Variouscontainers
Notreported
Higher FC inunboiled thanboiled water
Higher diarrhearisks stored inwide-necked thannarrow-necked
Knight et al.,1992
Trujillo,Peru
Wide-mouthcontainers
Notreported
Higher FC instored thansource waters
Increased cholerarisks
Swerdlow etal., 1992
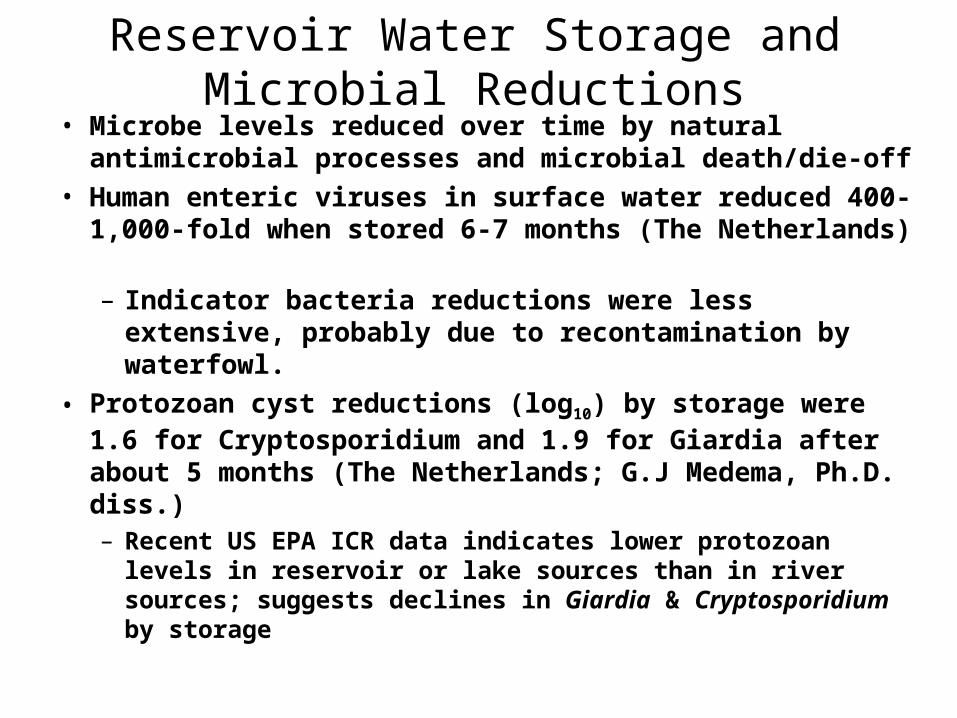
Reservoir Water Storage and Microbial Reductions• Microbe levels reduced over time by natural
antimicrobial processes and microbial death/die-off• Human enteric viruses in surface water reduced 400-
1,000-fold when stored 6‑7 months (The Netherlands) – Indicator bacteria reductions were less extensive,
probably due to recontamination by waterfowl.
• Protozoan cyst reductions (log10) by storage were 1.6 for Cryptosporidium and 1.9 for Giardia after about 5 months (The Netherlands; G.J Medema, Ph.D. diss.)– Recent US EPA ICR data indicates lower protozoan
levels in reservoir or lake sources than in river sources; suggests declines in Giardia & Cryptosporidium by storage