microbial risk assessment part 2: dynamic epidemiology models of microbial risk envr 133 mark d....
Post on 21-Dec-2015
225 views
TRANSCRIPT
Microbial Risk Assessment Part 2: Dynamic Epidemiology
Models of Microbial Risk
Envr 133
Mark D. Sobsey
Spring, 2006
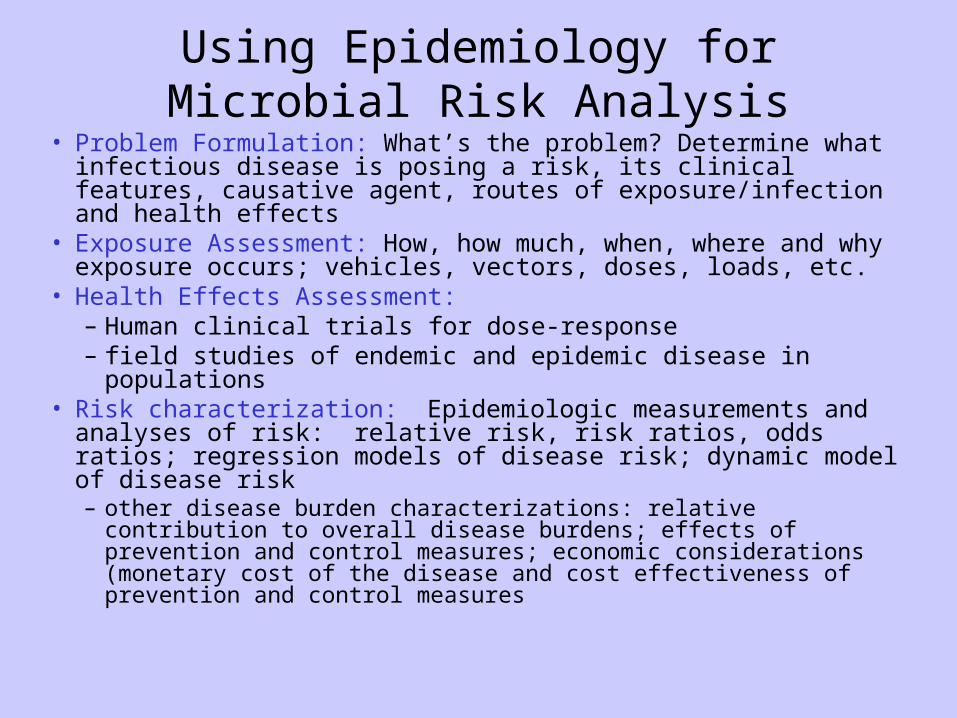
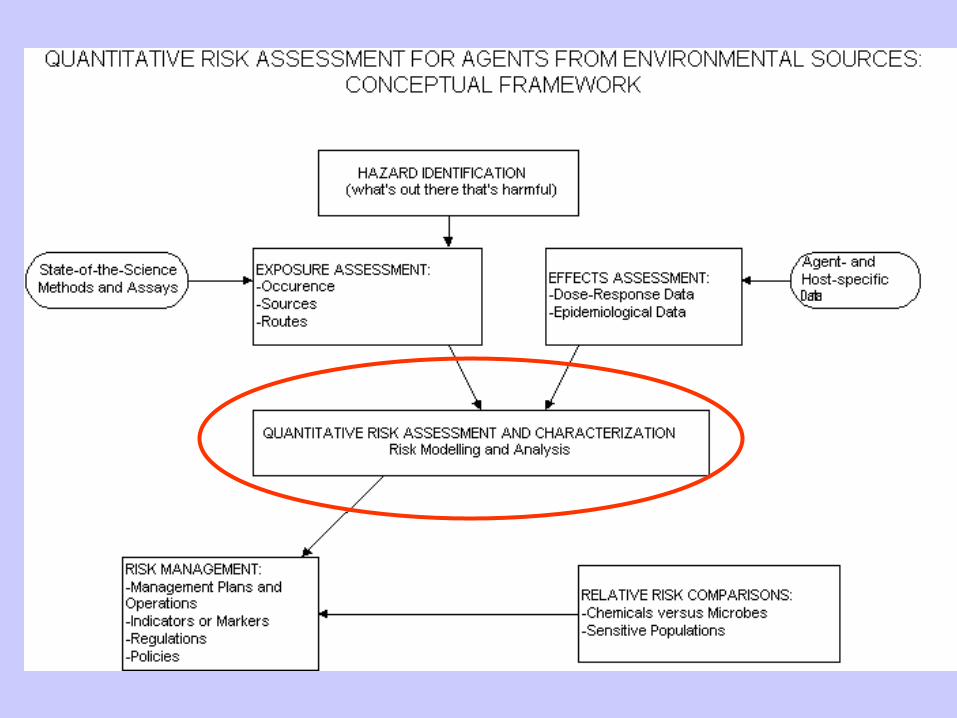
Using Epidemiology for Microbial Risk Analysis• Problem Formulation: What’s the problem? Determine what
infectious disease is posing a risk, its clinical features, causative agent, routes of exposure/infection and health effects
• Exposure Assessment: How, how much, when, where and why exposure occurs; vehicles, vectors, doses, loads, etc.
• Health Effects Assessment: – Human clinical trials for dose-response– field studies of endemic and epidemic disease in populations
• Risk characterization: Epidemiologic measurements and analyses of risk: relative risk, risk ratios, odds ratios; regression models of disease risk; dynamic model of disease risk– other disease burden characterizations: relative contribution to
overall disease burdens; effects of prevention and control measures; economic considerations (monetary cost of the disease and cost effectiveness of prevention and control measures
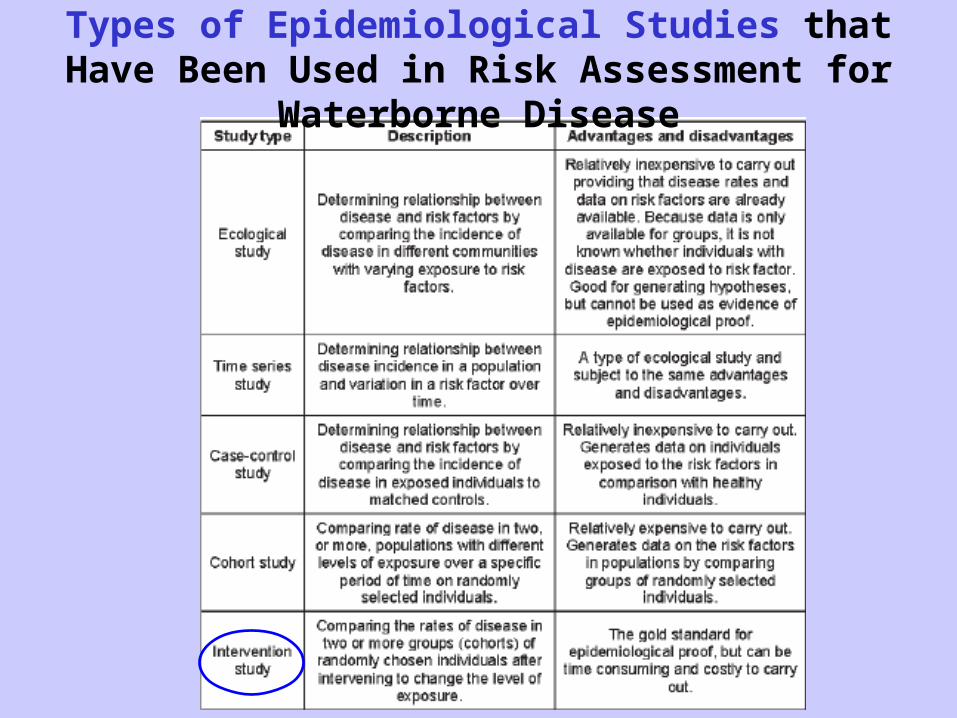
Types of Epidemiological Studies that Have Been Used in Risk Assessment for Waterborne Disease
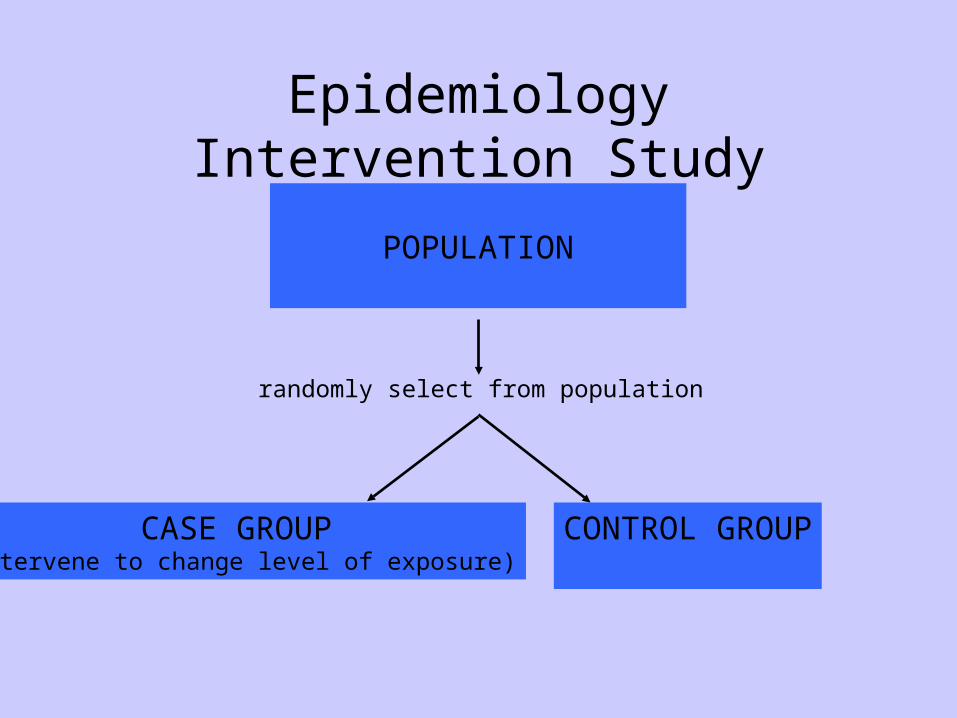
Epidemiology Intervention Study
POPULATION
CASE GROUP(intervene to change level of exposure)
CONTROL GROUP
randomly select from population
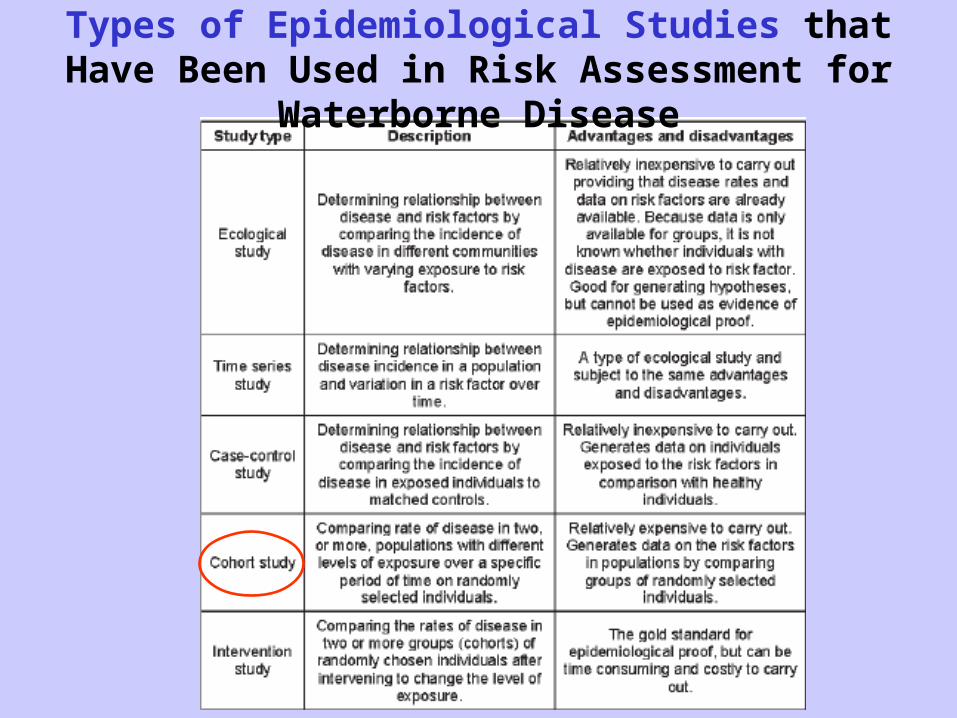
Types of Epidemiological Studies that Have Been Used in Risk Assessment for Waterborne Disease
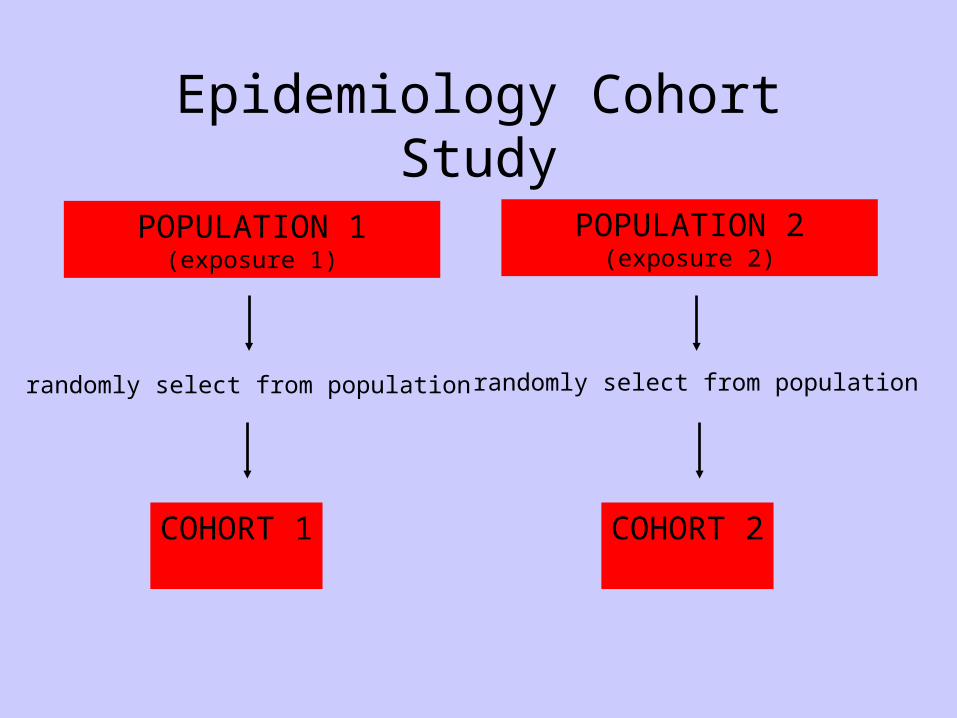
Epidemiology Cohort Study
POPULATION 1(exposure 1)
COHORT 1 COHORT 2
POPULATION 2(exposure 2)
randomly select from population randomly select from population
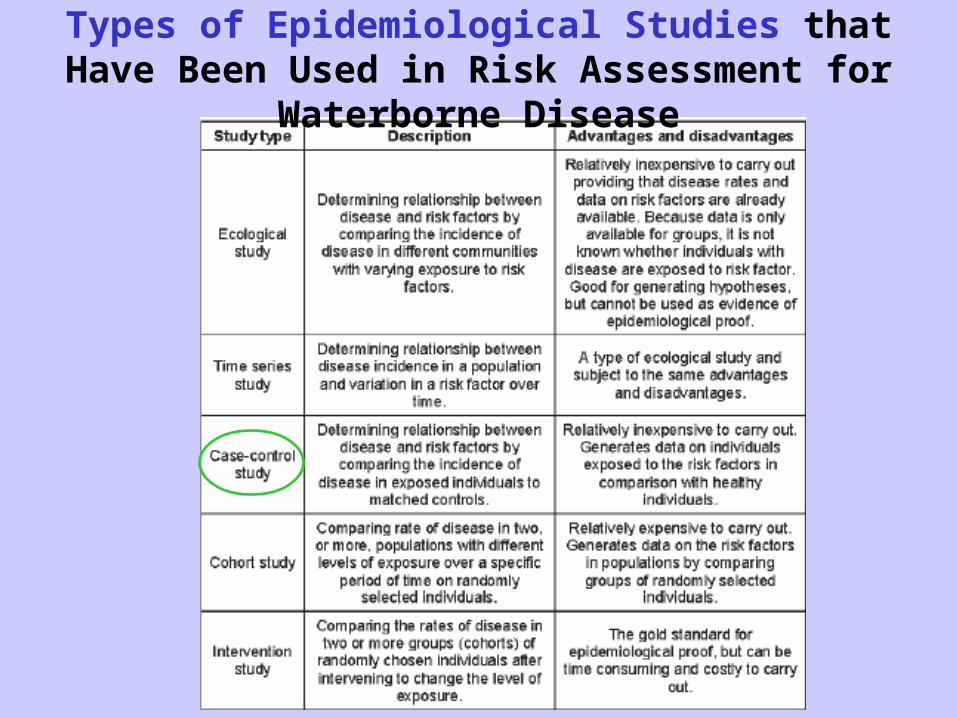
Types of Epidemiological Studies that Have Been Used in Risk Assessment for Waterborne Disease
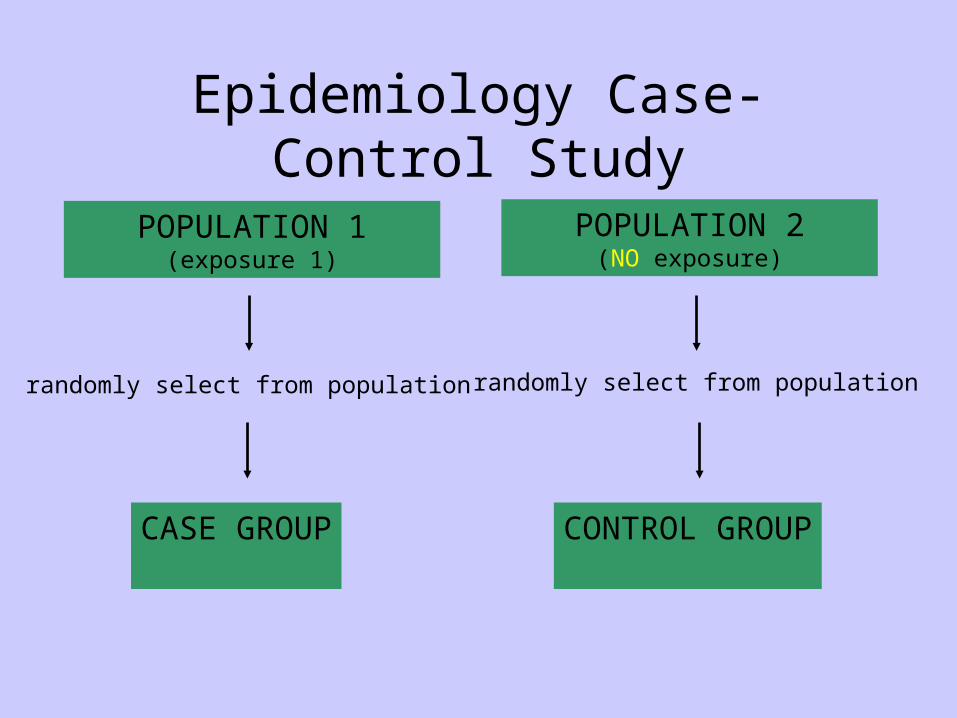
Epidemiology Case-Control Study
POPULATION 1(exposure 1)
CASE GROUP CONTROL GROUP
POPULATION 2(NO exposure)
randomly select from population randomly select from population
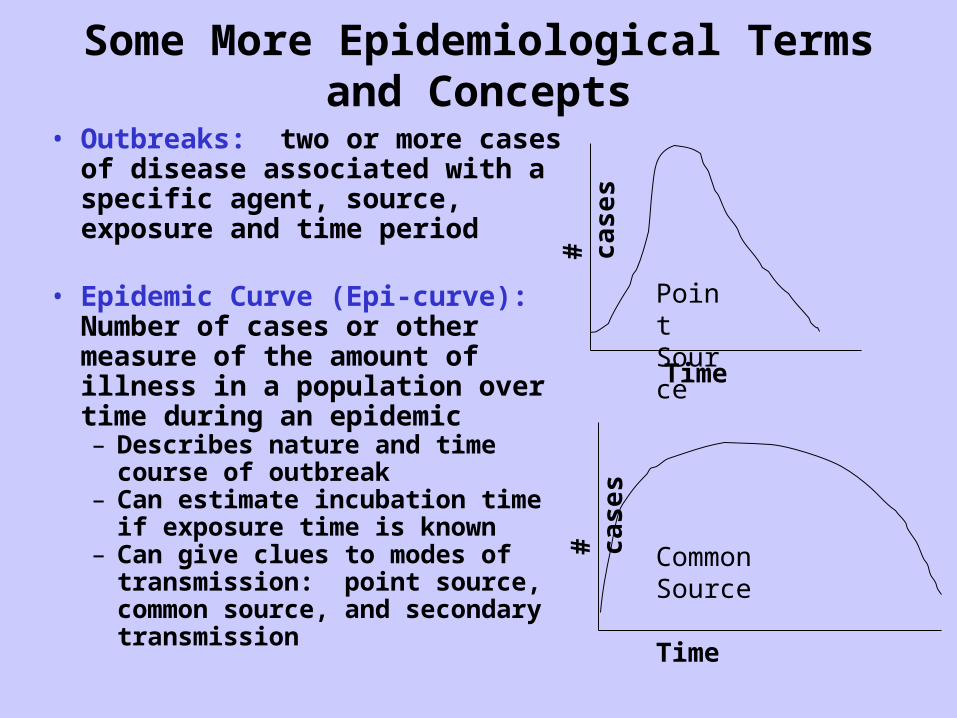
Some More Epidemiological Terms and Concepts
• Outbreaks: two or more cases of disease associated with a specific agent, source, exposure and time period
• Epidemic Curve (Epi-curve): Number of cases or other measure of the amount of illness in a population over time during an epidemic– Describes nature and time course of
outbreak– Can estimate incubation time if
exposure time is known– Can give clues to modes of
transmission: point source, common source, and secondary transmission
Point Source
Common Source#
case
s#
case
s
Time
Time
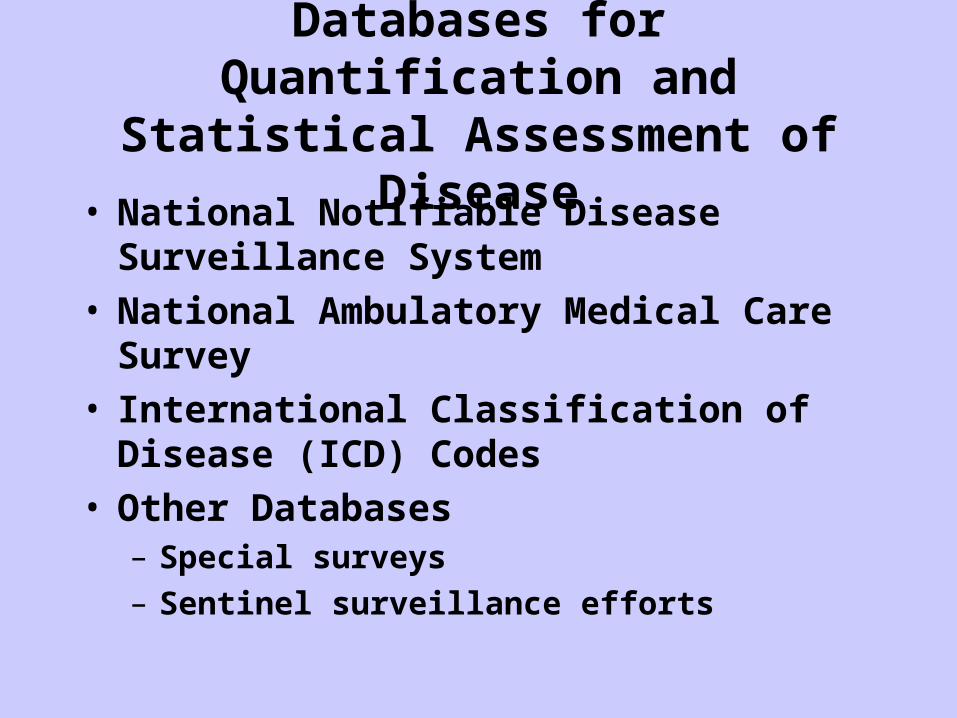
Databases for Quantification and Statistical Assessment of Disease
• National Notifiable Disease Surveillance System
• National Ambulatory Medical Care Survey• International Classification of Disease
(ICD) Codes• Other Databases
– Special surveys– Sentinel surveillance efforts
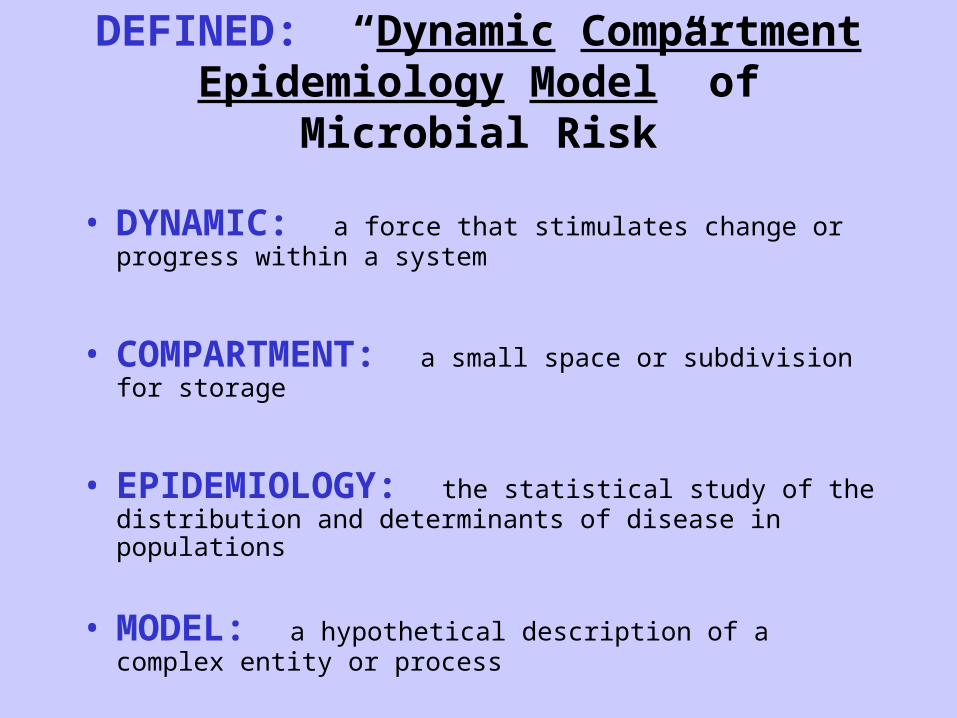
DEFINED: “Dynamic Compartment Epidemiology Model” of Microbial Risk
• DYNAMIC: a force that stimulates change or progress within a system
• COMPARTMENT: a small space or subdivision for storage
• EPIDEMIOLOGY: the statistical study of the distribution and determinants of disease in populations
• MODEL: a hypothetical description of a complex entity or process
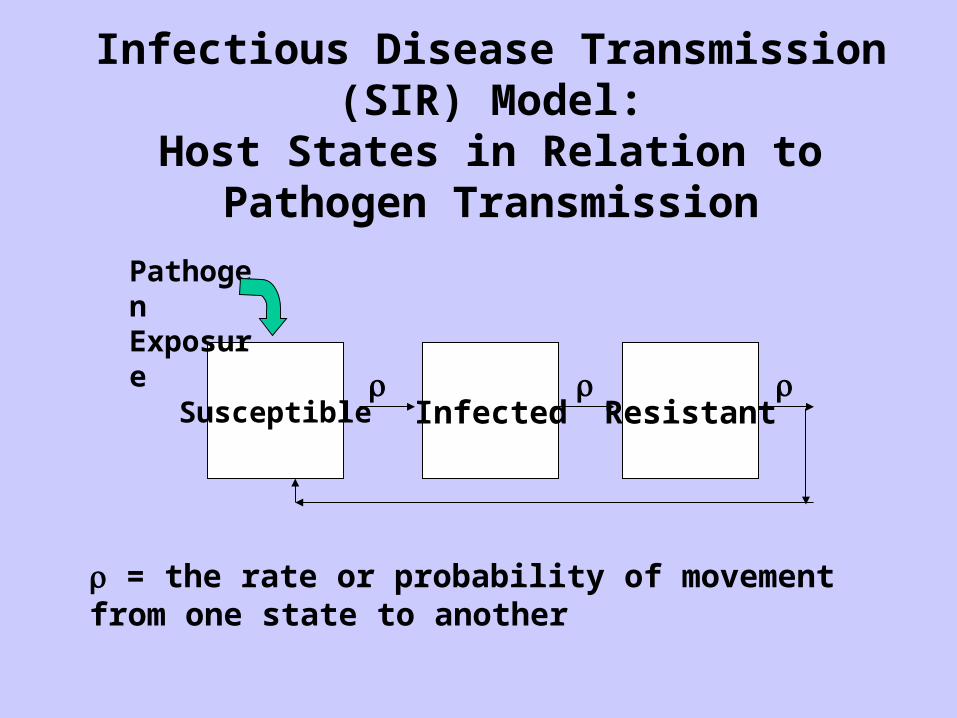
Infectious Disease Transmission (SIR) Model:Host States in Relation to Pathogen Transmission
Susceptible Infected Resistant
Pathogen Exposure
= the rate or probability of movement from one state to another
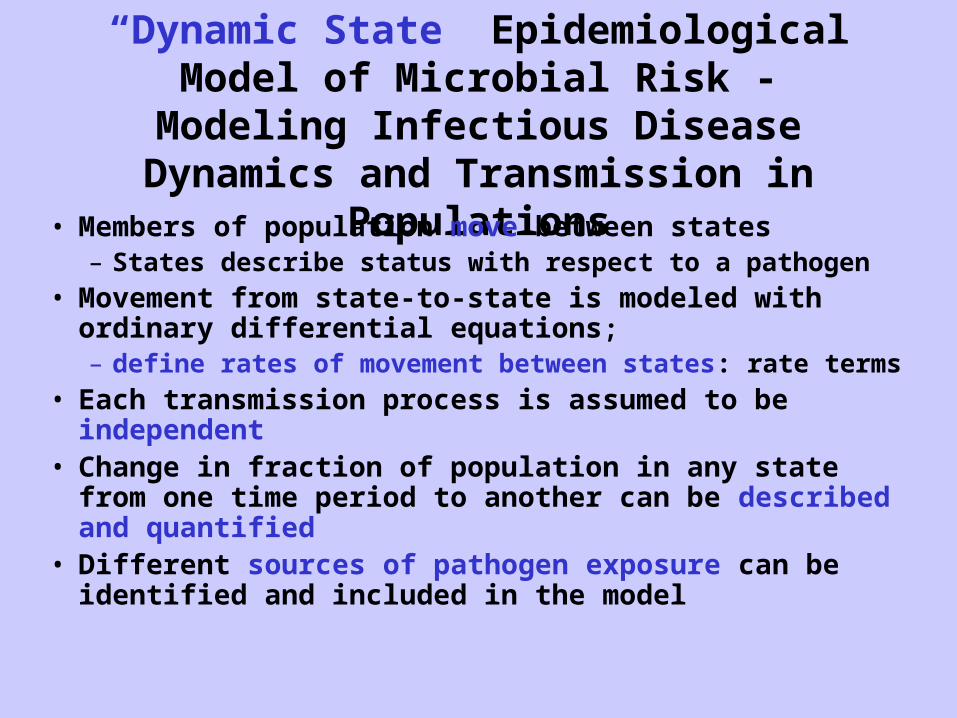
“Dynamic State” Epidemiological Model of Microbial Risk - Modeling Infectious Disease Dynamics and Transmission in Populations
• Members of population move between states– States describe status with respect to a pathogen
• Movement from state-to-state is modeled with ordinary differential equations; – define rates of movement between states: rate terms
• Each transmission process is assumed to be independent• Change in fraction of population in any state from one time
period to another can be described and quantified• Different sources of pathogen exposure can be identified
and included in the model
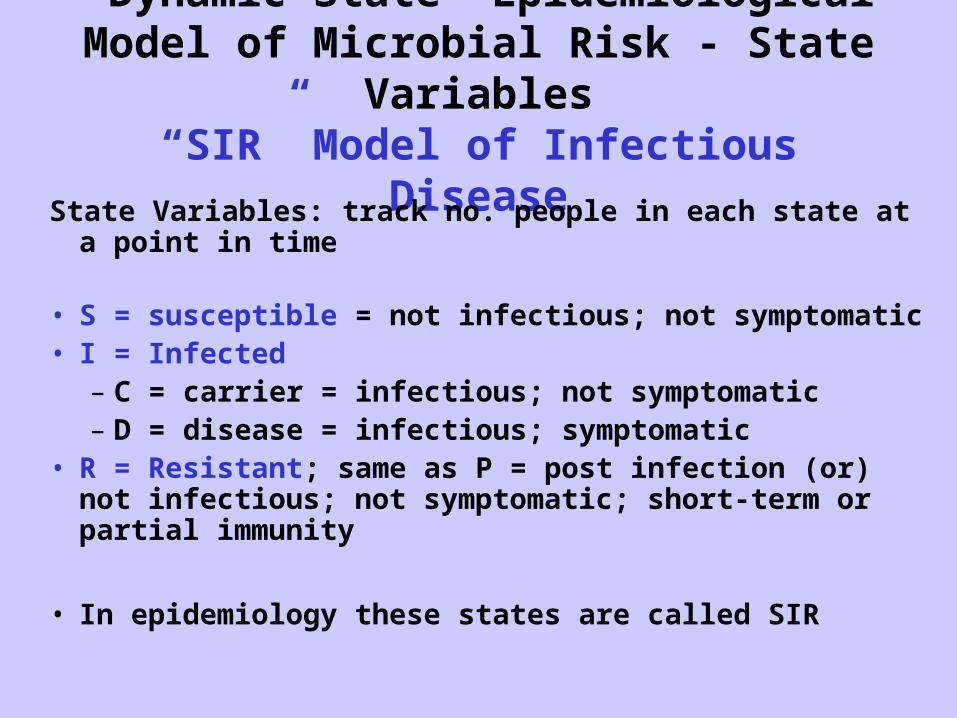
“Dynamic State” Epidemiological Model of Microbial Risk - State Variables
“SIR” Model of Infectious Disease
State Variables: track no. people in each state at a point in time
• S = susceptible = not infectious; not symptomatic• I = Infected
– C = carrier = infectious; not symptomatic– D = disease = infectious; symptomatic
• R = Resistant; same as P = post infection (or) not infectious; not symptomatic; short-term or partial immunity
• In epidemiology these states are called SIR
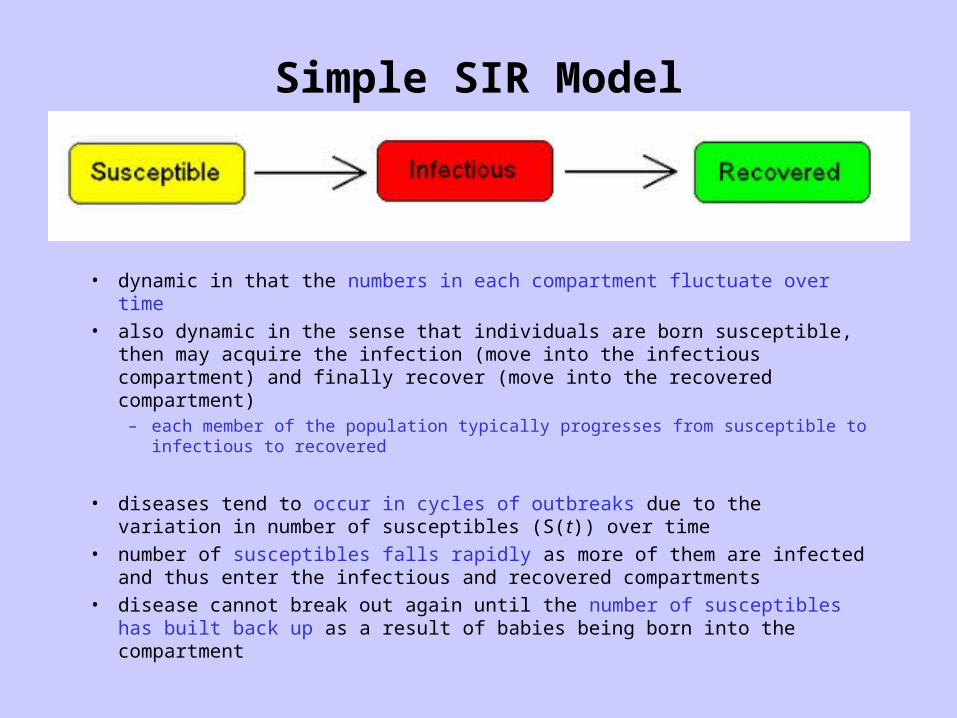
Simple SIR Model
• dynamic in that the numbers in each compartment fluctuate over time
• also dynamic in the sense that individuals are born susceptible, then may acquire the infection (move into the infectious compartment) and finally recover (move into the recovered compartment)
– each member of the population typically progresses from susceptible to infectious to recovered
• diseases tend to occur in cycles of outbreaks due to the variation in number of susceptibles (S(t)) over time
• number of susceptibles falls rapidly as more of them are infected and thus enter the infectious and recovered compartments
• disease cannot break out again until the number of susceptibles has built back up as a result of babies being born into the compartment
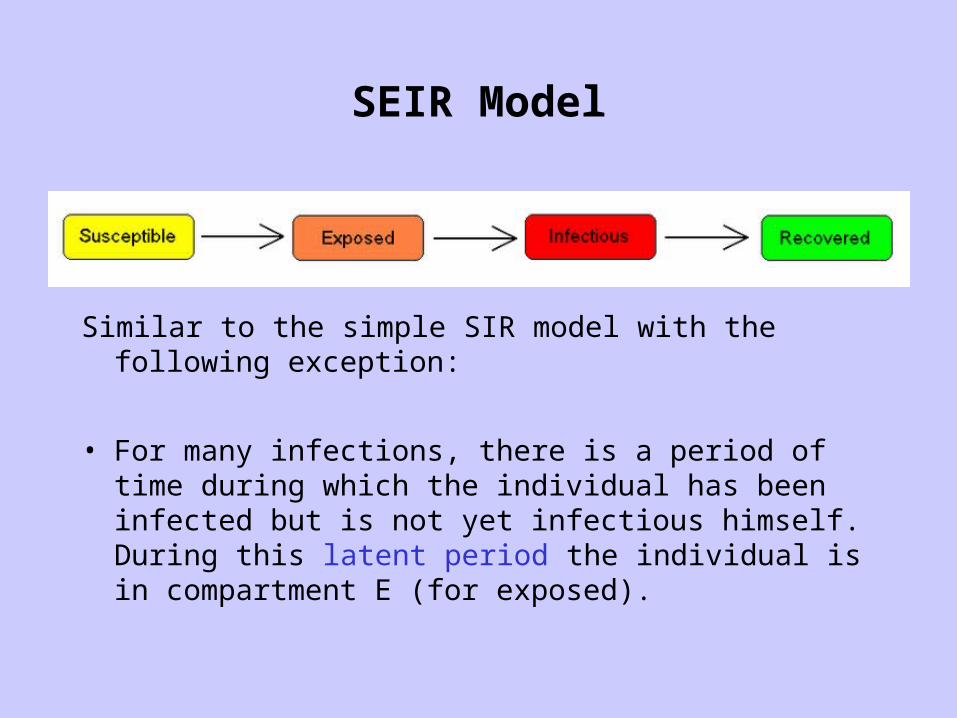
SEIR Model
Similar to the simple SIR model with the following exception:
• For many infections, there is a period of time during which the individual has been infected but is not yet infectious himself. During this latent period the individual is in compartment E (for exposed).

MSIR Model
Similar to the simple SIR model with the following exception:
• For many infections, babies are not born into the susceptible compartment but are immune to the disease for the first few months of life due to protection from maternal antibodies.
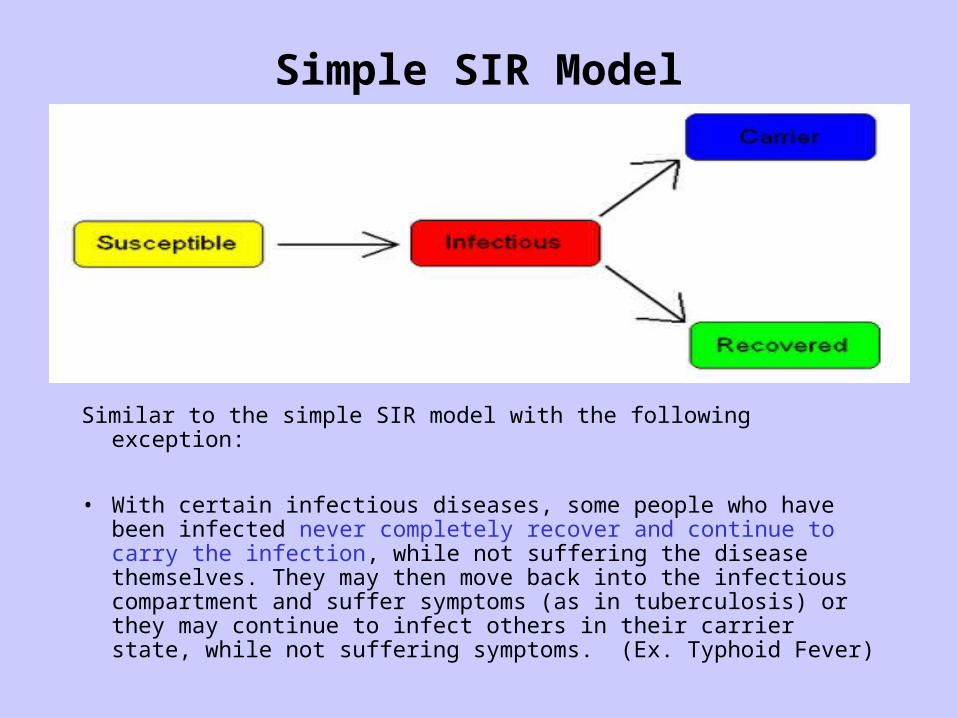
Simple SIR Model
Similar to the simple SIR model with the following exception:
• With certain infectious diseases, some people who have been infected never completely recover and continue to carry the infection, while not suffering the disease themselves. They may then move back into the infectious compartment and suffer symptoms (as in tuberculosis) or they may continue to infect others in their carrier state, while not suffering symptoms. (Ex. Typhoid Fever)
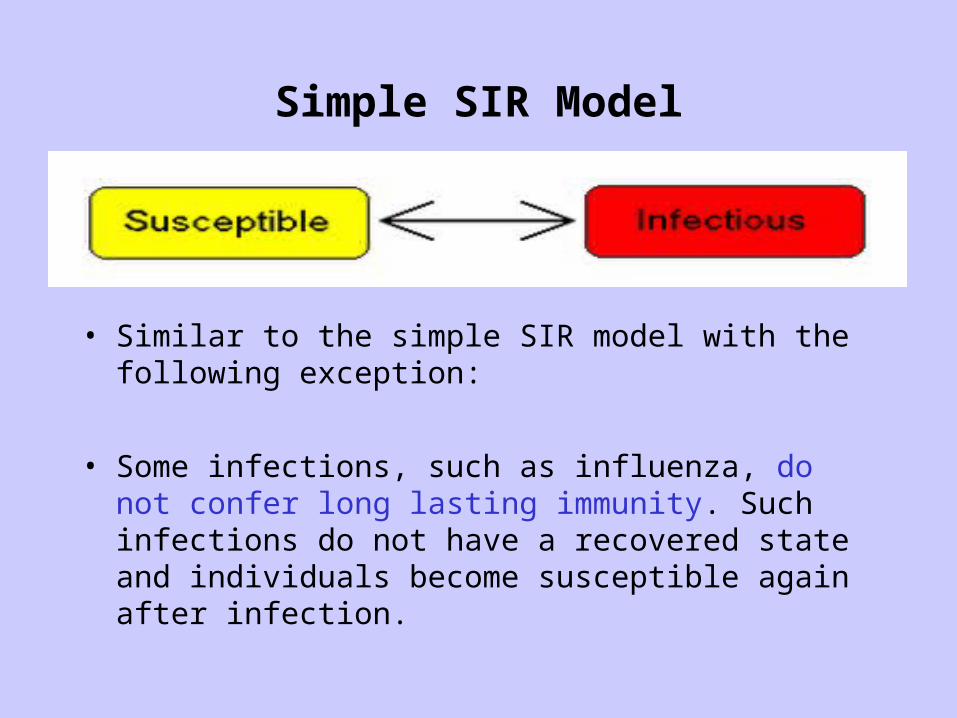
Simple SIR Model
• Similar to the simple SIR model with the following exception:
• Some infections, such as influenza, do not confer long lasting immunity. Such infections do not have a recovered state and individuals become susceptible again after infection.
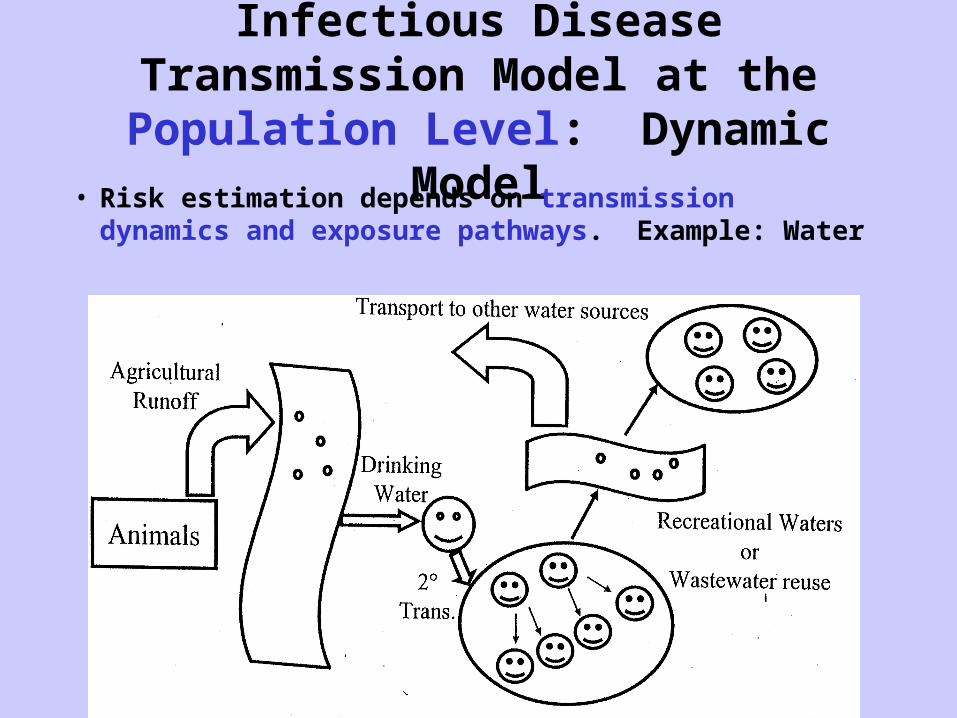
Infectious Disease Transmission Model at the Population Level: Dynamic Model
• Risk estimation depends on transmission dynamics and exposure pathways. Example: Water
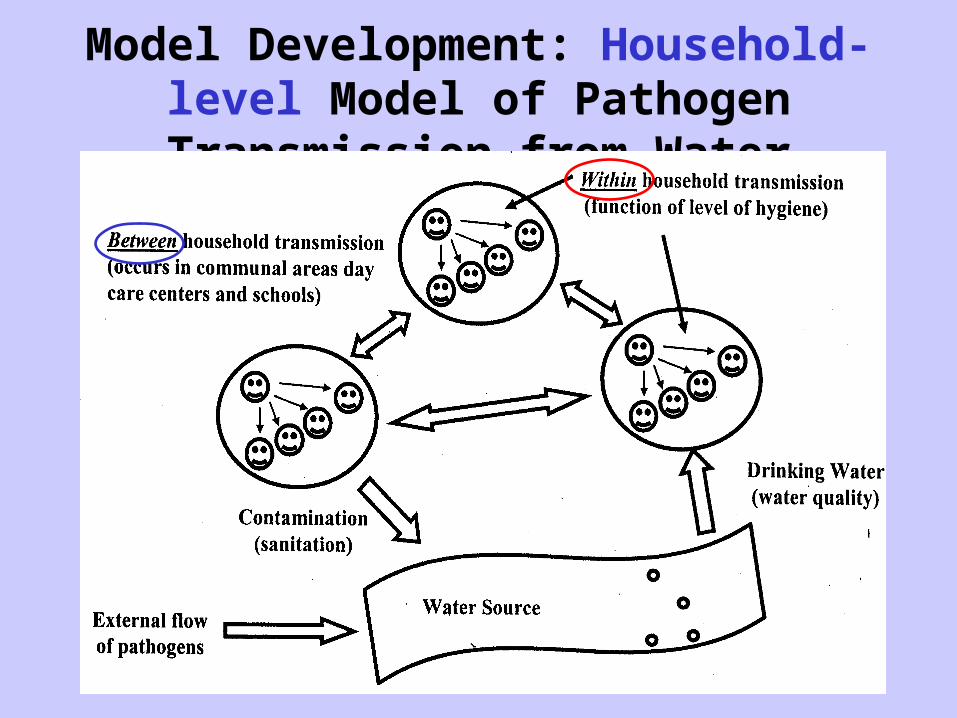
Model Development: Household-level Model of Pathogen Transmission from Water
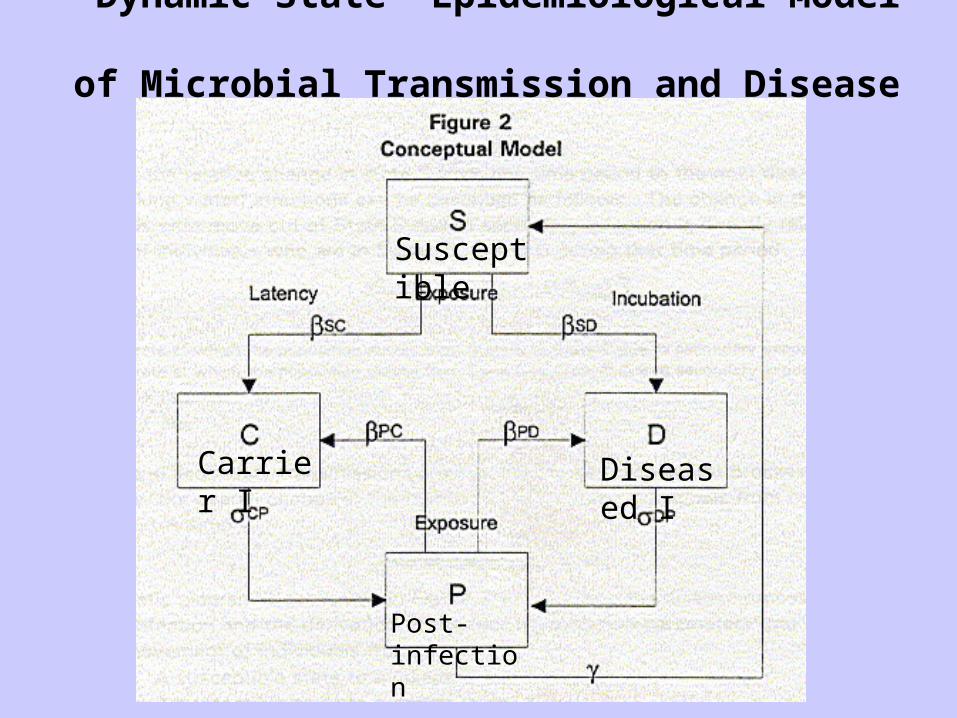
“Dynamic State” Epidemiological Model of Microbial Transmission and Disease Risk
Diseased ICarrier I
Susceptible
Post-infection
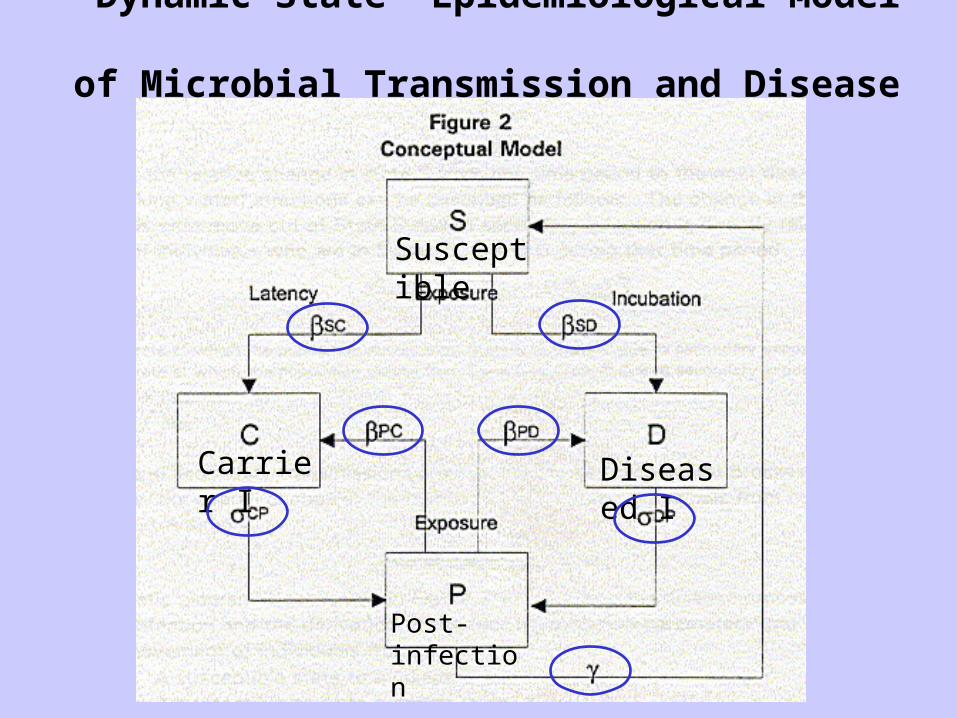
“Dynamic State” Epidemiological Model of Microbial Transmission and Disease Risk
Diseased ICarrier I
Susceptible
Post-infection
Additional Analyses of Health Effects:Health Effects Assessments
(previous lecture)
• Health Outcomes of Microbial Infection• Identification and diagnosis of disease caused by
the microbe– disease (symptom complex and signs)– Acute and chronic disease outcomes – mortality– diagnostic tests
• Sensitive populations and effects on them• Disease Databases and Epidemiological Data
Methods to Diagnose Infectious Disease(previous lecture)
• Symptoms (subjective: headache, pain) and Signs (objective: fever, rash, diarrhea)
• Clinical diagnosis: lab tests– Detect causative organism in clinical specimens– Detect other specific factors associated with
infection
• Immune response– Detect and assay antibodies– Detect and assay other specific immune
responses
Health Outcomes of Microbial Infection(previous lecture)
• Acute Outcomes– Diarrhea, vomiting, rash, fever, etc.
• Chronic Outcomes– Paralysis, hemorrhagic uremia, reactive
arthritis, etc.
• Hospitalizations
• Deaths
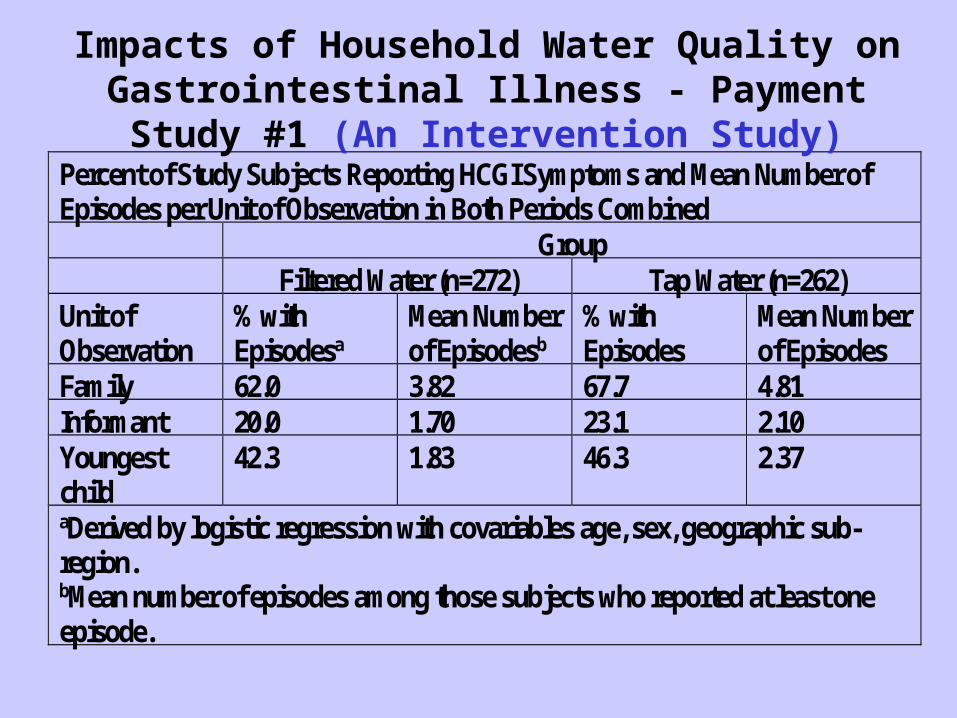
Percent of Study Subjects Reporting HCGI Symptoms and Mean Number ofEpisodes per Unit of Observation in Both Periods Combined
GroupFiltered Water (n=272) Tap Water (n=262)
Unit ofObservation
% withEpisodesa
Mean Numberof Episodesb
% withEpisodes
Mean Numberof Episodes
Family 62.0 3.82 67.7 4.81Informant 20.0 1.70 23.1 2.10Youngestchild
42.3 1.83 46.3 2.37
aDerived by logistic regression with covariables age, sex, geographic sub-region.bMean number of episodes among those subjects who reported at least oneepisode.
Impacts of Household Water Quality on Gastrointestinal Illness - Payment Study #1 (An Intervention Study)
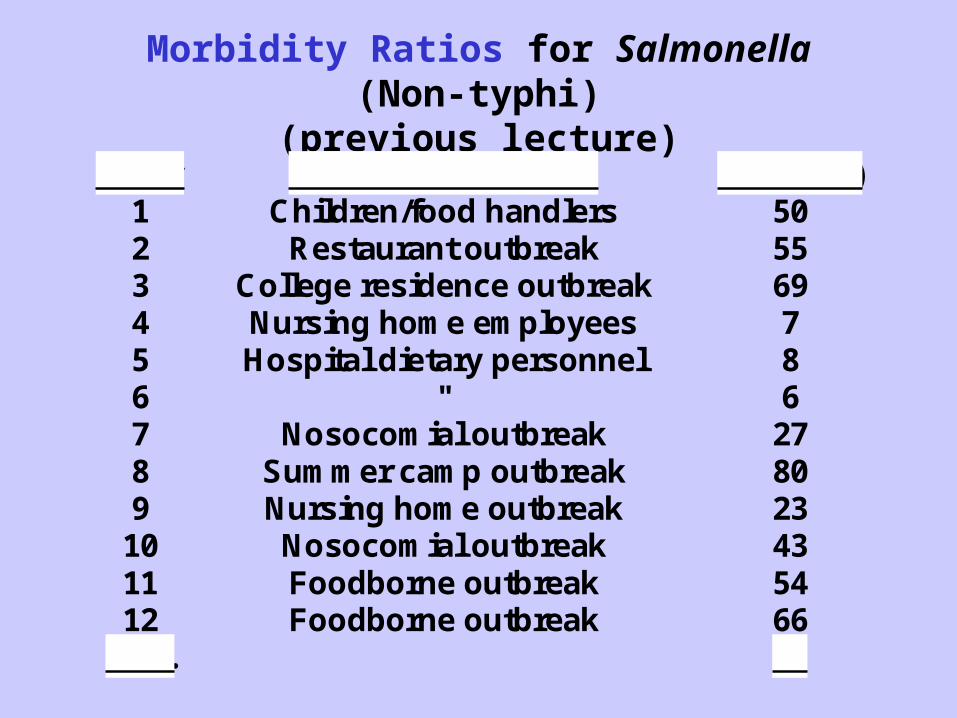
Morbidity Ratios for Salmonella (Non-typhi)(previous lecture)
Study Population/Situation Morb. (%) 1 Children/food handlers 502 Restaurant outbreak 553 College residence outbreak 694 Nursing home employees 75 Hospital dietary personnel 86 " 67 Nosocomial outbreak 278 Summer camp outbreak 809 Nursing home outbreak 23
10 Nosocomial outbreak 4311 Foodborne outbreak 5412 Foodborne outbreak 66
Avg. 41
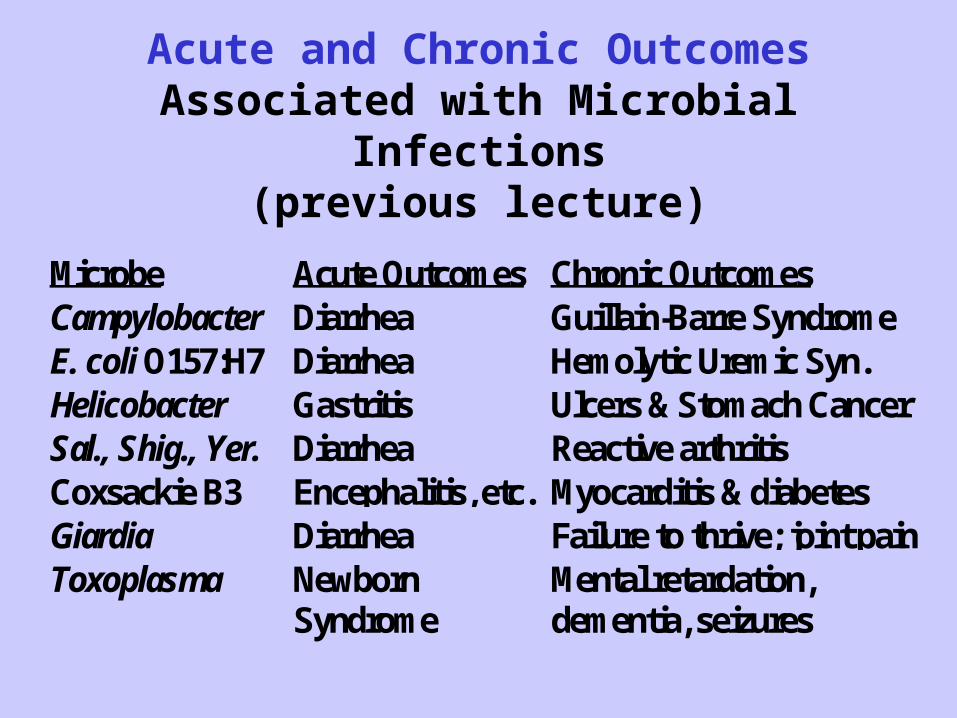
Acute and Chronic Outcomes Associated with Microbial Infections(previous lecture)
Microbe Acute Outcomes Chronic OutcomesCampylobacter Diarrhea Guillain-Barre SyndromeE. coli O157:H7 Diarrhea Hemolytic Uremic Syn.Helicobacter Gastritis Ulcers & Stomach CancerSal., Shig., Yer. Diarrhea Reactive arthritisCoxsackie B3 Encephalitis, etc. Myocarditis & diabetesGiardia Diarrhea Failure to thrive; joint painToxoplasma Newborn
SyndromeMental retardation,dementia, seizures
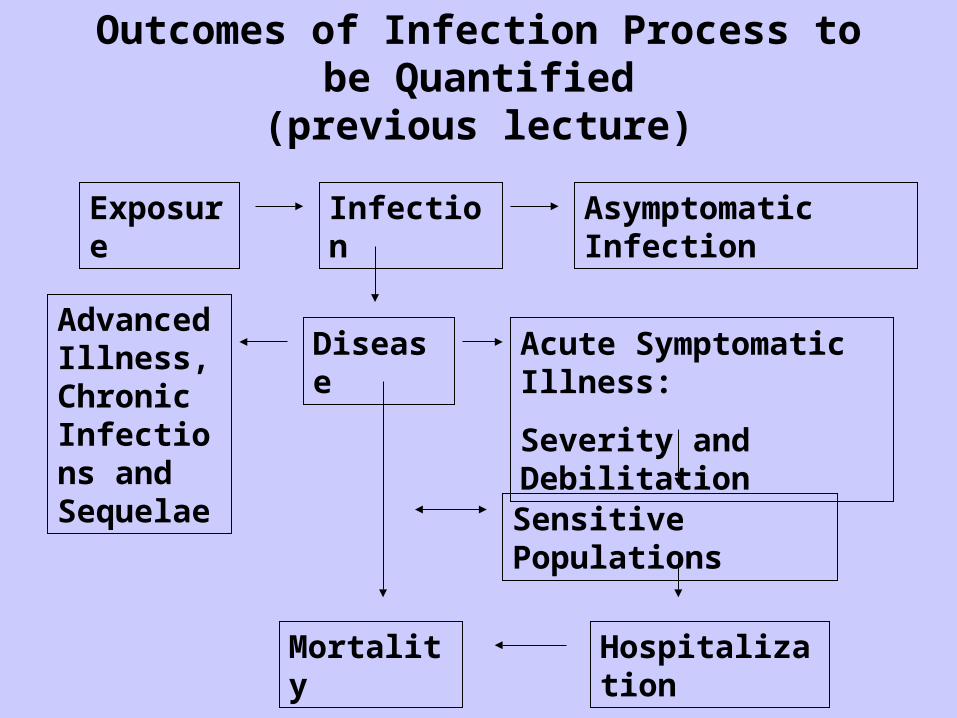
Outcomes of Infection Process to be Quantified(previous lecture)
Hospitalization
Infection Asymptomatic Infection
Mortality
DiseaseAdvanced Illness, Chronic Infections and Sequelae
Acute Symptomatic Illness:
Severity and Debilitation
Exposure
Sensitive Populations
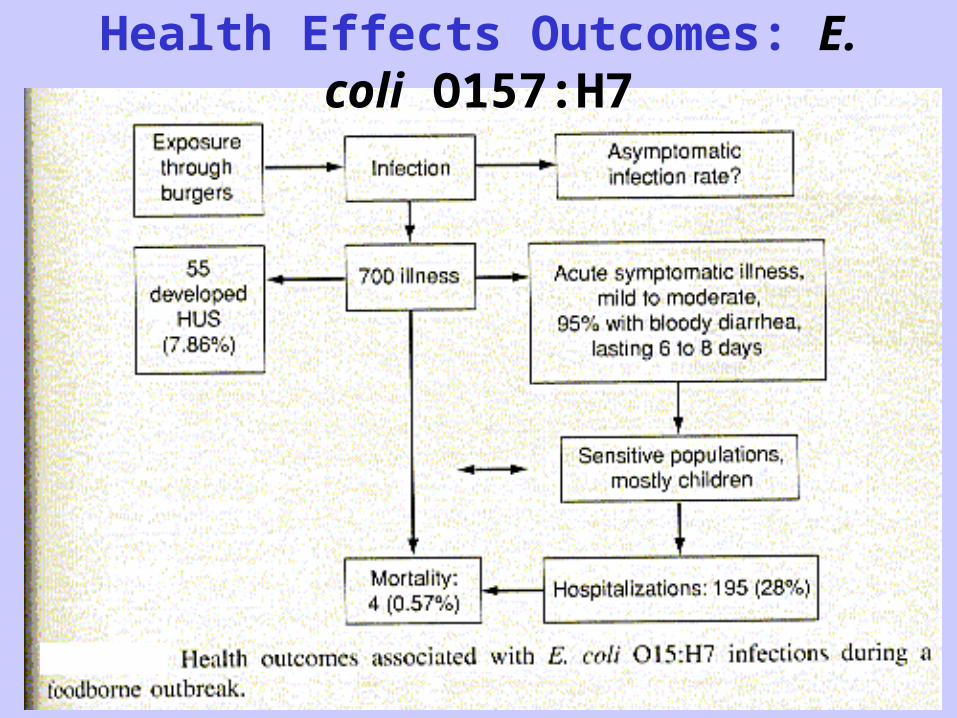
Health Effects Outcomes: E. coli O157:H7
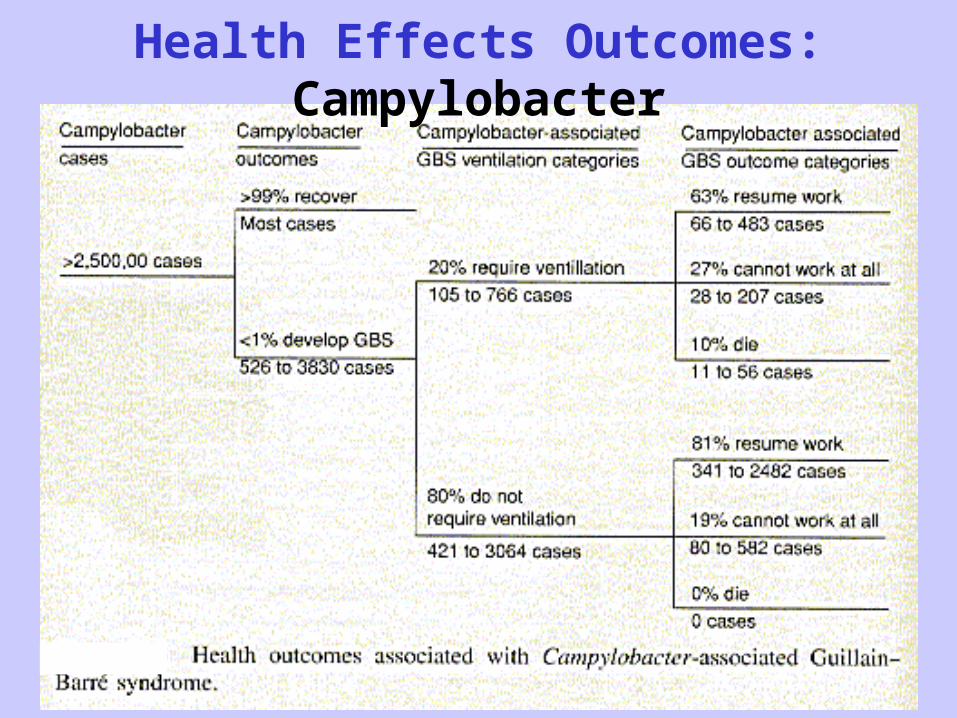
Health Effects Outcomes: Campylobacter
Sensitive Populations(previous lecture)
• Infants and young children• Elderly• Immunocompromized
– Persons with AIDs– Cancer patients– Transplant patients
• Pregnant• Malnourished
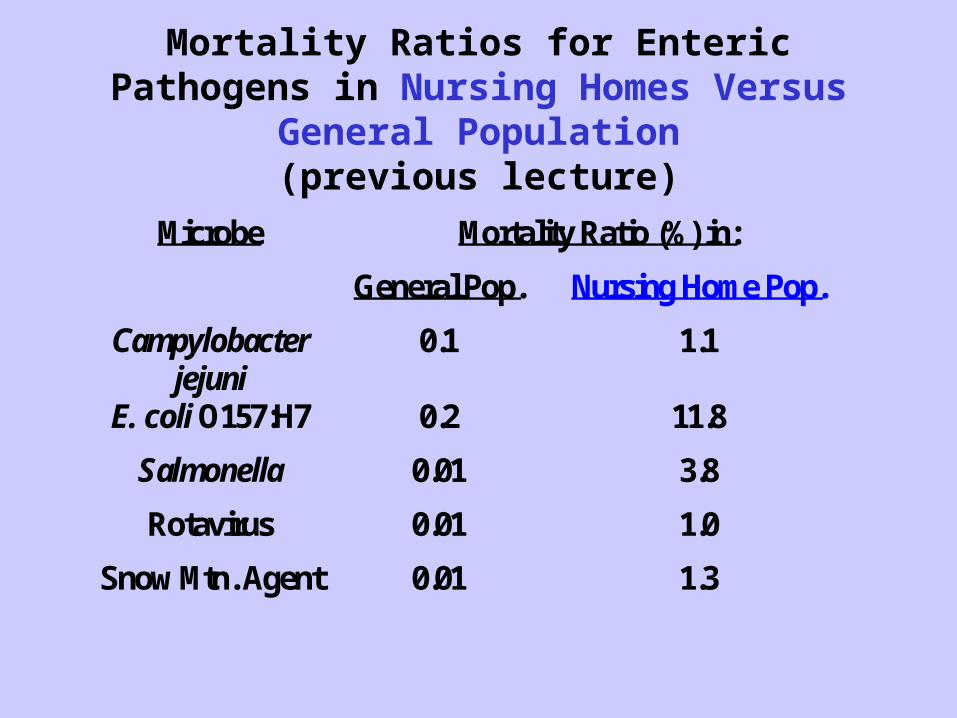
Mortality Ratios for Enteric Pathogens in Nursing Homes Versus General Population
(previous lecture)
Mortality Ratio (%) in: Microbe
General Pop. Nursing Home Pop.
Campylobacter jejuni
0.1 1.1
E. coli O157:H7 0.2 11.8
Salmonella 0.01 3.8
Rotavirus 0.01 1.0
Snow Mtn. Agent 0.01 1.3
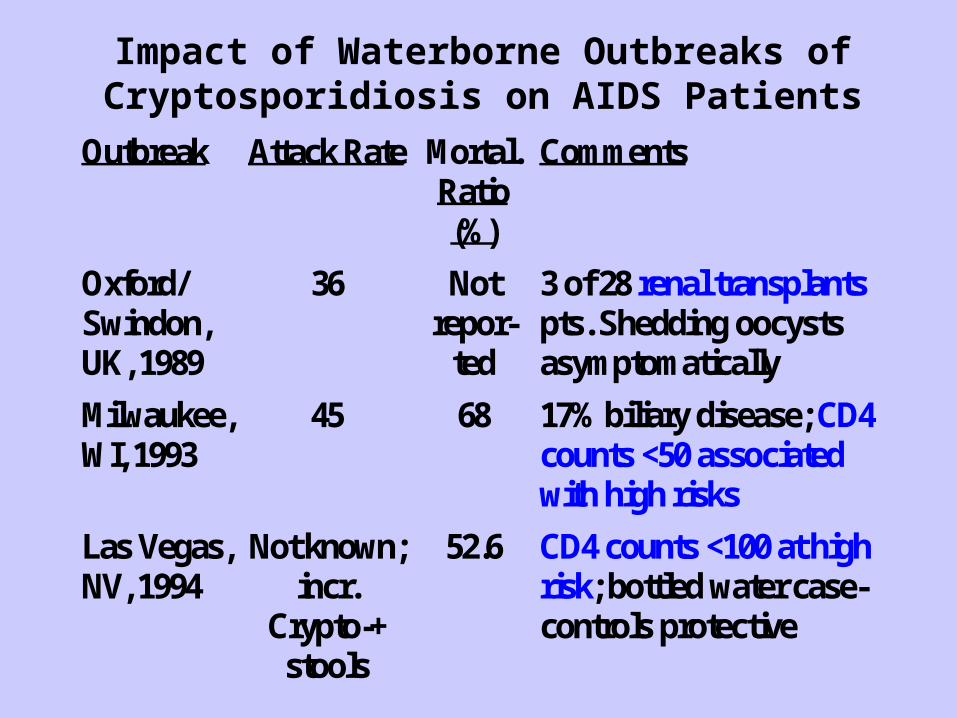
Impact of Waterborne Outbreaks of Cryptosporidiosis on AIDS Patients
Outbreak Attack Rate Mortal. Ratio (%)
Comments
Oxford/ Swindon, UK, 1989
36 Not repor-
ted
3 of 28 renal transplants pts. Shedding oocysts asymptomatically
Milwaukee, WI, 1993
45 68 17% biliary disease; CD4 counts <50 associated with high risks
Las Vegas, NV, 1994
Not known; incr.
Crypto-+ stools
52.6 CD4 counts <100 at high risk; bottled water case-controls protective
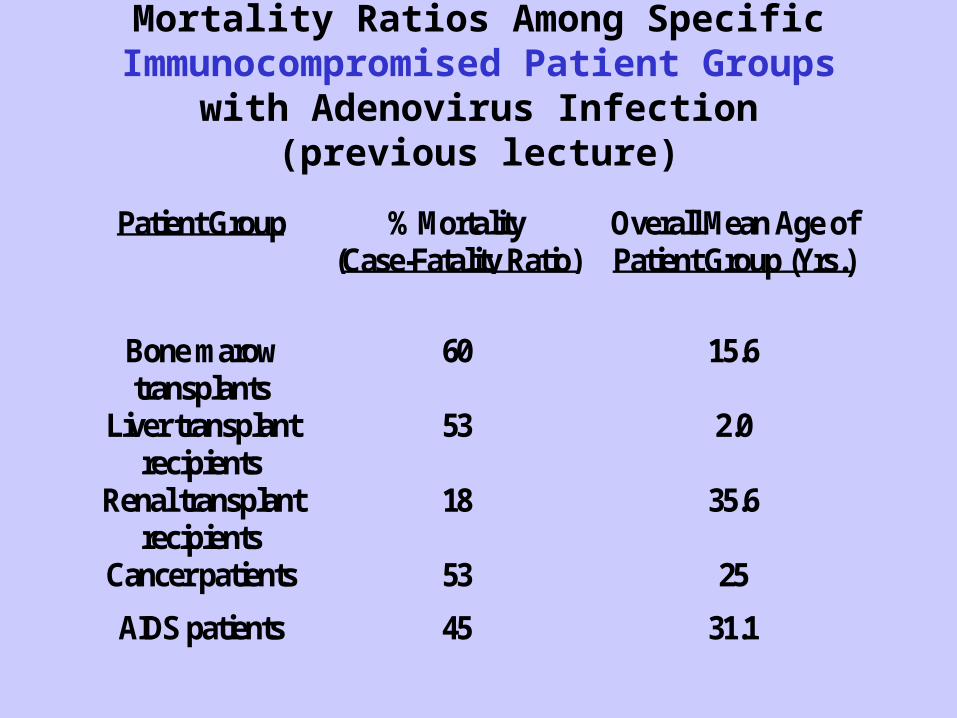
Mortality Ratios Among Specific Immunocompromised Patient Groups with Adenovirus Infection
(previous lecture)
Patient Group % Mortality(Case-Fatality Ratio)
Overall Mean Age ofPatient Group (Yrs.)
Bone marowtransplants
60 15.6
Liver transplantrecipients
53 2.0
Renal transplantrecipients
18 35.6
Cancer patients 53 25
AIDS patients 45 31.1
Databases for Quantification and Statistical Assessment of Disease
• National Notifiable Disease Surveillance System
• National Ambulatory Medical Care Survey
• International Classification of Disease (ICD) Codes
• Other Databases– Special surveys– Sentinel surveillance efforts
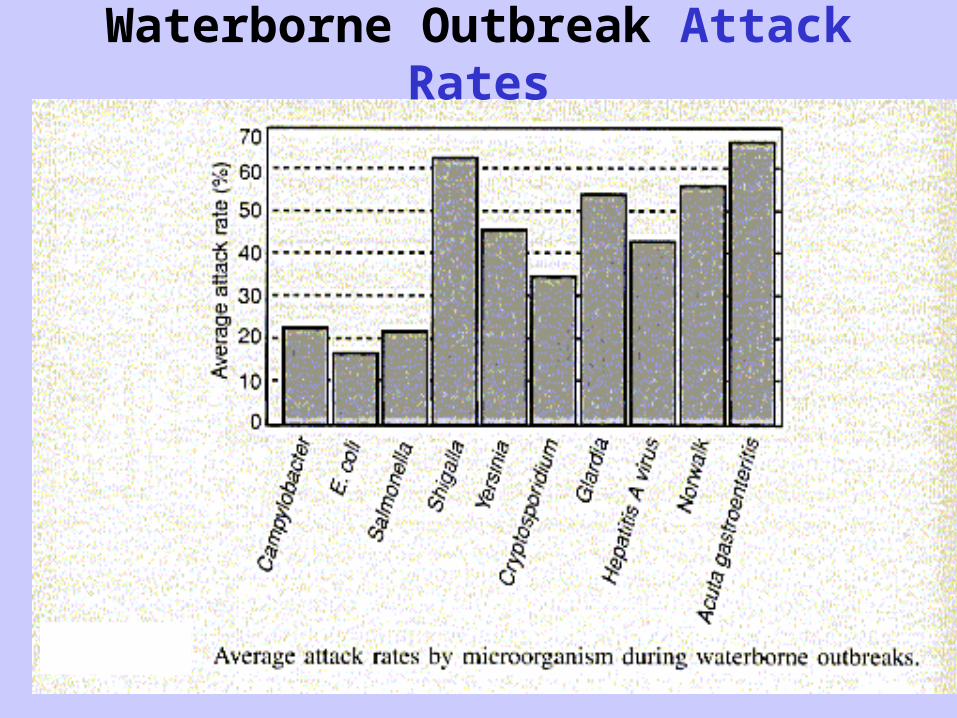
Waterborne Outbreak Attack Rates
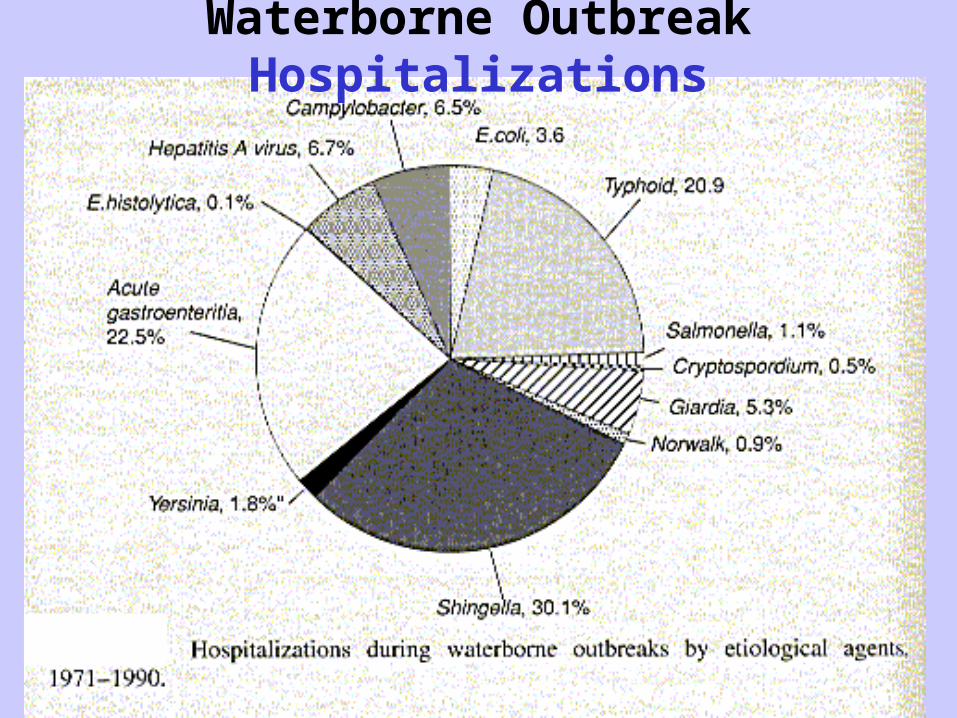
Waterborne Outbreak Hospitalizations
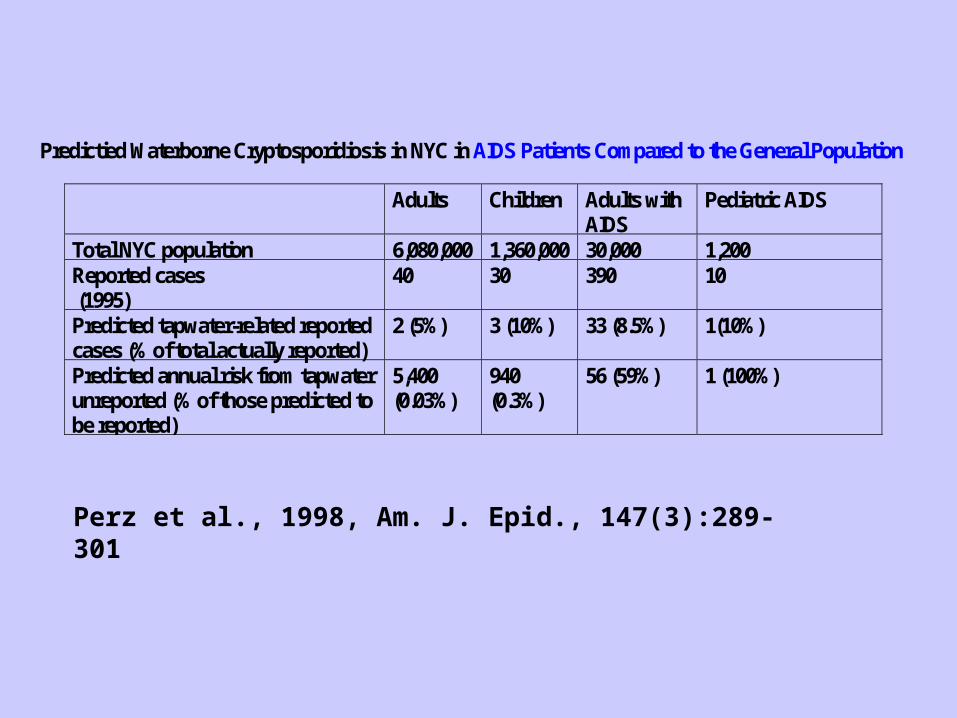
Predictied Waterborne Cryptosporidiosis in NYC in AIDS Patients Compared to the General Population
Adults Children Adults with AIDS
Pediatric AIDS
Total NYC population 6,080,000 1,360,000 30,000 1,200 Reported cases (1995)
40 30 390 10
Predicted tapwater-related reported cases (% of total actually reported)
2 (5%) 3 (10%) 33 (8.5%) 1(10%)
Predicted annual risk from tapwater unreported (% of those predicted to be reported)
5,400 (0.03%)
940 (0.3%)
56 (59%) 1 (100%)
Perz et al., 1998, Am. J. Epid., 147(3):289-301
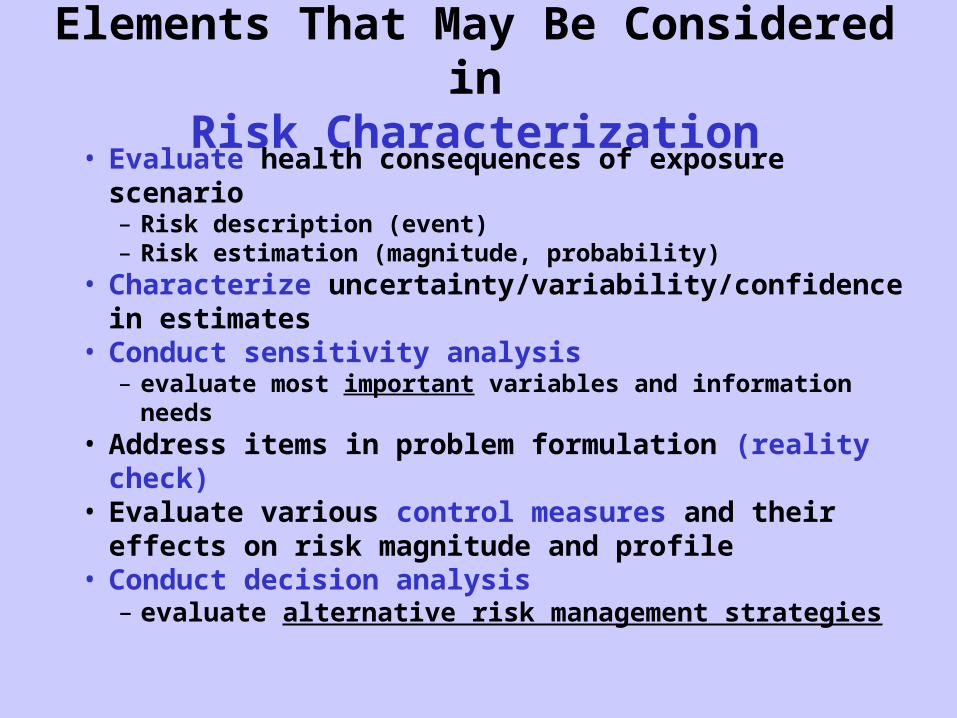
Elements That May Be Considered inRisk Characterization
• Evaluate health consequences of exposure scenario– Risk description (event)– Risk estimation (magnitude, probability)
• Characterize uncertainty/variability/confidence in estimates
• Conduct sensitivity analysis– evaluate most important variables and information needs
• Address items in problem formulation (reality check)• Evaluate various control measures and their effects
on risk magnitude and profile• Conduct decision analysis
– evaluate alternative risk management strategies