drinc: a software for drought analysis based on drought...
TRANSCRIPT

DrinC: a software for drought analysis based on drought indices
Dimitris Tigkas, Harris Vangelis and George Tsakiris Laboratory of Reclamation Works and Water Resources Management & Centre for the Assessment of Natural Hazards and Proactive Planning, School of Rural and Surveying Engineering, National Technical University of Athens, Greece e-mail: [email protected], [email protected]
Abstract: Drought is a complex phenomenon which can be characterised mainly by its severity, duration and areal extent. Among these three dimensions, drought severity is the key factor which can be used for drought analysis. Drought indices are typically used to assess drought severity in a meaningful way. DrinC (Drought Indices Calculator) is a software package which was developed for providing a simple, though adaptable interface for the calculation of drought indices. The paper aims at presenting the overall design and the implementation of the software along with the utilisation of various approaches for drought analysis. DrinC can be used for the calculation of two recently developed indices, the Reconnaissance Drought Index (RDI) and the Streamflow Drought Index (SDI), as well as two widely known indices, the Standardised Precipitation Index (SPI) and the Precipitation Deciles (PD). Moreover, the software includes a module for the estimation of potential evapotranspiration (PET) through temperature based methods, useful for the calculation of RDI. The software may be used in a variety of applications, such as drought monitoring, assessment of the spatial distribution of drought, investigation of climatic and drought scenarios, etc. The applications of DrinC in several locations, especially in arid and semi-arid regions, show that it is gaining ground as a useful research and operational tool for drought analysis.
Key words: Drought analysis software, Drought indices, Reconnaissance drought index (RDI), Streamflow drought index (SDI), Standardized precipitation index (SPI), Potential evapotranspiration (PET)
1. INTRODUCTION
Drought is considered as a major natural hazard, affecting several sectors of the economy and the environment worldwide. It affects almost all the determinants of the hydrological cycle starting from precipitation and ending with streamflow in the surface water systems or the recharge and storage in the groundwater aquifers. Therefore, the determinant to be chosen depends upon which part of the hydrological cycle we are interested to focus our analysis (Tsakiris et al. 2013).
Conventionally, droughts are characterised by the determinant studied and are categorised as meteorological (precipitation, potential evapotranspiration), hydrological (streamflow or groundwater recharge), agricultural (soil moisture). Drought indices are essential tools for the characterisation and the monitoring of drought, since they simplify the complex climatic functions and can quantify climatic anomalies as for their severity, duration and frequency. They are also very useful as they can communicate to the wider audience easily comprehensible information regarding the severity of drought episodes (Tsakiris et al. 2007c). Drought indices can be used in the academic field (education, research, studies etc.), but also at strategic and operational levels (decision making, proactive management and drought mitigation etc.), having a wide range of potential users. Of course, no single index is universally suitable, so in most cases it is necessary to consider more than one index (Morid et al. 2006).
Drought indices are usually calculated, either by applying manually the corresponding equations and procedures, or by using tools designed for this purpose. Such tools may work within the framework of other software packages (e.g. MATLAB, R-project, ArcGIS, etc.), or as stand-alone software, including one or more indices. Indicatively, some of the available tools for drought indices calculation are: The SPI_SL_6 (NDMC 2014), a simple application for calculating the Standardized
Precipitation Index for various monthly intervals. The SPATSIM, mainly a water resources information management software package, which
can also be used for the calculation of precipitation based indices, such as the Standardized
This is the accepted version of the manuscript: Tigkas D., Vangelis H., Tsakiris G., 2015. DrinC: a software for drought analysis based on drought indices. Earth Science Informatics, 8(3):697-709, doi: 10.1007/s12145-014-0178-y The final publication is available at Springer via http://dx.doi.org/10.1007/s12145-014-0178-y

2
Precipitation Index (SPI), the Deciles, the Effective Drought Index (EDI) and the departures from the long-term mean and median precipitation. It contains an integrated database management system that uses GIS shape files as the main form of data access values (Smakhtin and Hughes 2007).
The SPEI package (Beguería and Vicente-Serrano 2013), which is a set of functions for R-project that can be used for computing the Standardized Precipitation-Evapotranspiration Index (SPEI) and the SPI.
The CDI, a MS Excel-based software, developed by FAO SWALIM (Balint et al. 2011), which computes four indices: the Precipitation Drought Index (PDI), the Temperature Drought Index (TDI), the Vegetation Drought Index (VDI) and the Combined Drought Index (CDI).
Many of the existing tools often require advanced computer skills by the user or familiarity with
the specific software packages, restricting the task of calculation of drought indices to experts. The development of specialised, stand-alone software for the calculation of drought indices, that provides a simple interface and produces clear and comparable outputs, can be very helpful for both academic and operational use. Further, the consideration of the results of several drought indices may lead to a comprehensive assessment of drought severity and give a better perspective to specific research or management objectives.
On the basis of the above considerations, the software package named DrinC was developed at the Centre for the Assessment of Natural Hazards and Proactive Planning and the Laboratory of Reclamation Works and Water Resources Management of the National Technical University of Athens. It can be used for the calculation of drought indices - and especially of two that were recently developed - suitable for drought characterisation, drought monitoring, spatial analysis of drought and investigation of climatic scenarios. The user can select, through a windows-based interface, among several options that may fit better to the specific requirements of each task or case study. Further, DrinC includes two modules for the calculation of potential evapotranspiration through temperature-based methods and for drought monitoring, respectively.
In this paper, the objectives, the overall design and the implementation of DrinC software are presented. Moreover, various approaches for drought analysis and their utilisation by the software are described, along with some real-world applications.
2. DROUGHT INDICES OVERVIEW
DrinC (Drought Indices Calculator) aims at providing a user-friendly tool for the calculation of several drought indices. Key objective in its design was the widest possible applicability for several types of drought (meteorological, hydrological, agricultural) and different locations. It was also taken into account that drought studies are particularly essential in arid and semi-arid regions, where data availability is usually limited. Therefore, the main criteria for the selection of indices were: a) to have relatively low data requirements, allowing the application of the software in many regions and b) their results to be clearly interpreted for direct and efficient operational use.
Based on these criteria, two recently developed and two more widely known indices were included in DrinC: the Reconnaissance Drought Index (RDI), the Streamflow Drought Index (SDI), the Standardised Precipitation Index (SPI) and the Precipitation Deciles (PD).
As can be easily understood, RDI, SPI and PD refer to the meteorological drought and use as main determinant the precipitation (and additionally the potential evapotranspiration for RDI only). Further, RDI can also be used for the agricultural drought analysis, as it can adequately describe the water balance, and it is particularly useful when reference periods related to development stages of the crop are selected (Tsakiris et al. 2010). On the other hand, SDI applies to hydrological drought and uses the streamflow as the key determinant.
Apart from the originally proposed methods of calculation for each index, DrinC incorporates alternative methods that allow the comparison of the results among the indices. Further, this gives a

3
key advantage to the user, since it provides the flexibility to select among various options for adjusting the outputs to his particular needs.
Following, there is a short presentation and the key characteristics of the drought indices calculated by DrinC.
2.1 Precipitation Deciles
One of the simplest meteorological drought indices is the method of Deciles which was introduced by Gibbs and Maher (1967). The precipitation totals for the preceding three months are ranked against climatologic records and if the sum falls within the lowest decile of the historical distribution of 3-month totals, then the region is considered to be under drought conditions (Kininmonth et al. 2000). The drought ends when: (i) the precipitation measured during the past month already places the 3-month total in or above the fourth decile, or (ii) the precipitation total for the past three months is in or above the eighth decile. The advantage of the method of deciles is its computational ease, but its simplicity can lead to conceptual difficulties. The deciles are grouped into five classes as presented in Table 1.
Table 1. Classification of drought conditions according to deciles.
Decile Class Description deciles 1-2: lowest 20% much below normal deciles 3-4: next lowest 20% below normal deciles 5-6: middle 20% near normal deciles 7-8: next highest 20% above normal deciles 9-10: highest 20% much above normal
2.2 Reconnaissance Drought Index (RDI)
The Reconnaissance Drought Index (RDI) was developed to approach the water deficit in a more accurate way, as a sort of balance between input and output in a water system (Tsakiris and Vangelis 2005; Tsakiris et al. 2007c). It is based both on cumulative precipitation (P) and potential evapotranspiration (PET), which are one measured (P) and one calculated (PET) determinant. The initial value (αk) of RDI is calculated for the i-th year in a time basis of k (months) as follows:
1( )
1
1(1) and 1(1)
k
ijji
k k
ijj
P
, i = N j = kPET
(1)
in which Pij and PETij are the precipitation and potential evapotranspiration of the j-th month of the i-th year and N is the total number of years of the available data.
The values of αk follow satisfactorily both the lognormal and the gamma distributions in a wide range of locations and different time scales, in which they were tested (Tigkas 2008; Tsakiris et al. 2008). By assuming that the lognormal distribution is applied, the following equation can be used for the calculation of RDIst:
( )( )
ˆ
ii
sty
y yRDI
(2)
in which y(i) is the ln( ( )ika ), y is its arithmetic mean and ̂ y is its standard deviation.
In case the gamma distribution is applied, the RDIst can be calculated by fitting the gamma

4
probability density function (pdf) to the given frequency distribution of αk (Tsakiris et al. 2008; Tigkas 2008). For short reference periods (e.g. monthly or 3-months) which may include zero values for the cumulative precipitation of the period, the RDIst can be calculated based on a composite cumulative distribution function including the probability of zero precipitation and the gamma cumulative probability.
Positive values of RDIst indicate wet periods, while negative values indicate dry periods compared with the normal conditions of the area. Drought severity can be categorised in mild, moderate, severe and extreme classes, with corresponding boundary values of RDIst (-0.5 to -1.0), (-1.0 to -1.5), (-1.5 to -2.0) and (< -2.0), respectively.
2.3 Streamflow Drought Index (SDI)
According to Nalbantis (2008), if a time series of monthly streamflow volumes Qi,j is available, in which i denotes the hydrological year and j the month within that hydrological year (j = 1 for October and j = 12 for September), Vi,k can be obtained based on the equation:
3
, ,1
k
i k i jj
V Q i = 1, 2, j = 1, 2, , 12 k = 1, 2, 3, 4 (3)
in which Vi,k is the cumulative streamflow volume for the i-th hydrological year and the k-th reference period, k = 1 for October-December, k = 2 for October-March, k = 3 for October-June, and k = 4 for October-September.
Based on the cumulative streamflow volumes Vi,k, the Streamflow Drought Index (SDI) is defined for each reference period k of the i-th hydrological year as follows:
,,SDI i k ki k
k
V V
s
i = 1, 2, , k = 1, 2, 3, 4 (4)
in which kV and ks are respectively the mean and the standard deviation of cumulative streamflow
volumes of the reference period k as these are estimated over a long period of time. In this definition the truncation level is set to kV although other values based on rational criteria could be
also used. According to Nalbantis and Tsakiris (2009), states (classes) of hydrological drought are defined
for SDI in an identical way to those used in the meteorological drought indices SPI and RDI. Five states are considered, which are denoted by an integer number ranging from 0 (non-drought) to 4 (extreme drought) and are defined through the criteria of Table 2.
Table 2. Definition of states of hydrological drought with the aid of SDI.
State Description Criterion 0 Non-drought SDI 0.0 1 Mild drought - 1.0 SDI < 0.0 2 Moderate drought - 1.5 SDI < - 1.0 3 Severe drought - 2.0 SDI < - 1.5 4 Extreme drought SDI < - 2.0
2.4 Standardized Precipitation Index (SPI)
For the SPI calculation, the long-term precipitation record for a desired period is fitted to a probability distribution, which is then transformed into a normal distribution so that the mean SPI for the location and desired period is zero (McKee et al. 1993; Edwards and McKee 1997). Positive

5
SPI values indicate greater than median precipitation, and negative values indicate less than median precipitation. Since SPI is normalised, wetter and drier climates can be represented in the same way.
Thom (1958) found the gamma distribution to fit well to the climatological precipitation time series. The gamma distribution is defined by its frequency or probability density function:
a 1 x / β
a
1g( x ) x e
β Γ a , for x > 0 (7)
in which α and are the shape and scale parameters respectively, x is the precipitation amount and (α) is the gamma function. Parameters α and of the gamma pdf are estimated for each station and for each time scale of interest (1, 3, 6, 9, 12 months, etc.). Maximum likelihood estimations of α and are:
1 4Αa 1 1
4Α 3
,
xβ
a , where ln x
A ln xn
(8)
and n is the number of observations. The resulting parameters are then used to find the cumulative probability of an observed
precipitation event for the given month and time scale for the location in question. Since the gamma function is undefined for x = 0 and a precipitation distribution may contain zeros, the cumulative probability becomes:
H x q 1 q G x (9)
in which q is the probability of zero precipitation and G(x) is the cumulative probability of the incomplete gamma function. If m is the number of zeros in a precipitation time series, then q can be estimated by m/n. The cumulative probability H(x), is then transformed to the standard normal random variable z with mean zero and variance of one (Abramowitz and Stegun 1965), which is the value of the SPI.
According to the SPI, a drought event occurs when the index continuously reaches an intensity of -1.0 or less. The event ends when the SPI becomes positive. Each drought event, therefore, has a duration defined by its beginning and end, and intensity for each month that the event continues. Drought magnitude is the positive sum of the SPI for each month during the drought event (Hayes et al. 2007).
Generally, monthly precipitation is not normally distributed so a transformation is performed such that the derived SPI values follow a normal distribution. The SPI is the number of standard deviations that the observed value would deviate from the long-term mean, for a normally distributed random variable. One interpretation of the resultant values is presented in Table 3 (Tsakiris and Vangelis 2004).
Table 3. Classification of drought conditions according to the SPI.
SPI values Classification 2.0 or more Extremely Wet 1.5 to 1.99 Very Wet 1.0 to 1.49 Moderately Wet -.99 to .99 Near Normal
-1.0 to -1.49 Moderately Dry -1.5 to -1.99 Severely Dry
-2 or less Extremely Dry
6
3. SOFTWARE DESIGN AND IMPLEMENTATION
3.1 Software structure, interface and data management
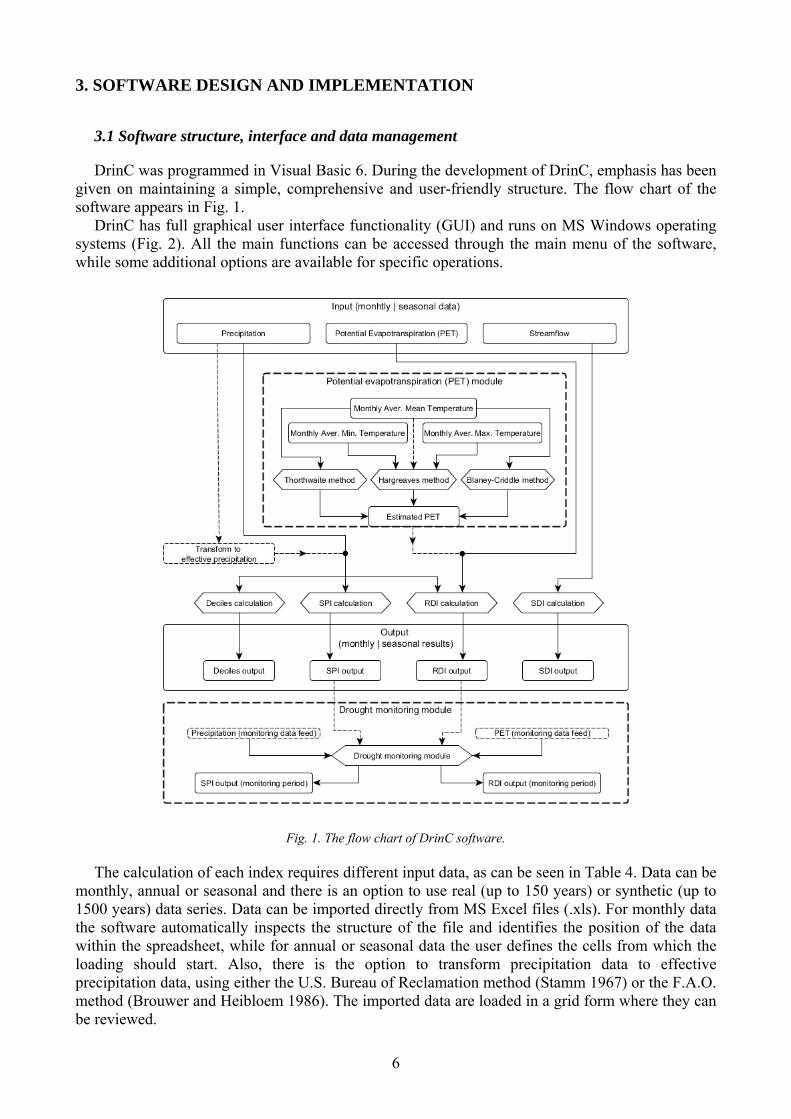
DrinC was programmed in Visual Basic 6. During the development of DrinC, emphasis has been given on maintaining a simple, comprehensive and user-friendly structure. The flow chart of the software appears in Fig. 1.
DrinC has full graphical user interface functionality (GUI) and runs on MS Windows operating systems (Fig. 2). All the main functions can be accessed through the main menu of the software, while some additional options are available for specific operations.
Fig. 1. The flow chart of DrinC software.
The calculation of each index requires different input data, as can be seen in Table 4. Data can be monthly, annual or seasonal and there is an option to use real (up to 150 years) or synthetic (up to 1500 years) data series. Data can be imported directly from MS Excel files (.xls). For monthly data the software automatically inspects the structure of the file and identifies the position of the data within the spreadsheet, while for annual or seasonal data the user defines the cells from which the loading should start. Also, there is the option to transform precipitation data to effective precipitation data, using either the U.S. Bureau of Reclamation method (Stamm 1967) or the F.A.O. method (Brouwer and Heibloem 1986). The imported data are loaded in a grid form where they can be reviewed.

7
Fig. 2. The graphical user interface (GUI) of DrinC.
Table 4. Required input data for each index.
Index Required input data Deciles Precipitation RDI Precipitation, PET (or temperature) SPI Precipitation SDI Streamflow
3.2 Drought indices calculation
The initial theoretical concepts of the SPI and the RDI are different, regarding their calculation procedure. The SPI is calculated as a “rolling” index in a monthly sequential order (McKee et al. 1993), usually with five running time intervals (i.e. 1-, 3-, 6-, 9- and 12-months). The RDI is computed for discrete reference periods (e.g. 3, 6, 9 and 12 months) on hydrological year basis (Tsakiris et al. 2007c). If these different approaches are used, the ability to compare the results of the indices is limited. Further, there is narrow flexibility to use them in several specific case studies, for example, if there is a need to focus on certain periods of the year.
In DrinC, there is the option to use both of the above approaches, giving the ability to formulate a drought analysis that suits better the needs or the purpose of a study or application. The results for each drought index may be presented per month or per period that allows a direct comparison of drought severity for specific periods of the year.
The primary reference base in DrinC is the hydrological year (October – September), therefore the default calculation period starts from October and the main calculation steps are 1-month, 3-months, 6-months and annual. However, it is possible to define other calculation steps (e.g. 4-months) or different starting months (e.g. January) through drop down lists and radio buttons. This flexibility may be useful for several real-world applications; for instance, the study of drought effects on specific crops should coincide to the crop growth period.
The results can be saved in MS Excel files (in one file or in separate files for each index) and the user may select to draw automatically the graph in the output file (Fig. 3).
Another useful feature is the ‘multi-points mode’ function, with which a set of annual or seasonal input data for several spatial points can be loaded and each drought index can be calculated

8
for each point through an iterative routine. This automated procedure for the assessment of spatial distribution of drought indices is particularly useful for the production of drought maps.
Figure 3. Example of an output file of DrinC.
3.3 Modules for PET calculation and drought monitoring
There are several methods to estimate PET, though some of those can be data demanding. However, according to Vangelis et al. (2013), temperature based methods to estimate PET would give sufficient results for the RDI calculation.
DrinC provides a module (Fig. 4) for the calculation of PET with three temperature based methods: Hargreaves (Hargreaves and Samani 1985), Thornthwaite (1948) and Blaney-Criddle (Doorenbos & Pruitt 1977). From these methods, the first requires minimum and maximum temperature data (mean temperature is optional), whereas the other two require only mean temperature data. The basic inputs that should be defined are the number of years, the starting year (leap years are taken into account) and the latitude.
Fig. 4. The PET calculation module.

9
The drought monitoring module of DrinC can be used to directly estimate the drought indices for a present period, provided that there are sufficient available historical data in order to depict the climatic behaviour for the area of study. There is the assumption that the climatic characteristics of the study area remain the same for both the monitoring period and the available historical period.
The procedure is based on the linear function, which in case of RDI is:
bcRDI nst )ln( (10)
in which αn is the initial value of RDI for n-months period, c and b are constants calculated from the available historical data for the corresponding n-months period.
4. DROUGHT ANALYSIS
4.1 Drought characterisation
Drought characterisation mainly focuses on the analysis of the historical drought conditions of an area. From a stochastic point of view, it provides information required for the subsequent risk analysis. Also, it provides spatial and temporal representations of historical droughts and therefore places current conditions in historical perspective. Drought characterisation can be valuable for the evaluation of the risk of future droughts, for the determination of the impacts of drought on various sectors (economy, environment, society etc.) and for the design of the preparedness plans for the management of the anticipated drought impacts (Rossi et al. 1992).
Drought indices are widely accepted as useful elements to characterise drought and its statistical properties. Some basic steps for drought characterisation can be described as follows (Tsakiris et al. 2007a):
i. Collect all the necessary monthly data of each reliable meteorological station of the selected area
ii. Transfer meteorological data at a basin or sub-basin level iii. Calculate selected indices on an appropriate time scale (e.g. trimester, semester or annual
scale) iv. Display the results graphically using colours for the various levels of drought intensity v. Analyse the frequency of occurrence of 1-year drought using historical data. Other time steps
could be also used. Some of the above parameters (area, time scale etc.) should be carefully selected, based on the
system under study and the purpose of the characterisation. For instance, an annual time scale is appropriate for assessing the impact of drought on a water body or a reservoir, while shorter time scales (e.g. 1-month or 3-months) could be used for the effects of drought on agricultural production.
DrinC provide all the above options for drought indices calculation. For example, the drought conditions of an area for 45 hydrological years are shown in Fig. 5. Each drought class is represented by a different colour for a better visualisation of drought intensity; e.g. the severe (1958-59 and 1992-93) and the extreme (1989-90 and 1999-2000) events are illustrated with orange and red colours, respectively. Also, Figs. 6 and 7 present a comparative analysis of the frequency of drought occurrences and the number of drought events along with their duration, respectively, for four areas of Greece (period 1955-2002).

10
-3.00
-2.00
-1.00
0.00
1.00
2.00
3.00
1955
- 1
956
1956
- 1
957
1957
- 1
958
1958
- 1
959
1959
- 1
960
1960
- 1
961
1961
- 1
962
1962
- 1
963
1963
- 1
964
1964
- 1
965
1965
- 1
966
1966
- 1
967
1967
- 1
968
1968
- 1
969
1969
- 1
970
1970
- 1
971
1971
- 1
972
1972
- 1
973
1973
- 1
974
1974
- 1
975
1975
- 1
976
1976
- 1
977
1977
- 1
978
1978
- 1
979
1979
- 1
980
1980
- 1
981
1981
- 1
982
1982
- 1
983
1983
- 1
984
1984
- 1
985
1985
- 1
986
1986
- 1
987
1987
- 1
988
1988
- 1
989
1989
- 1
990
1990
- 1
991
1991
- 1
992
1992
- 1
993
1993
- 1
994
1994
- 1
995
1995
- 1
996
1996
- 1
997
1997
- 1
998
1998
- 1
999
1999
- 2
000
Hydrological Year
RD
I st (
an
nu
al) Extremely wet
Very wet
Moderately wet
Near normal
Moderately dry
Severely dry
Extremely dry
Fig. 5. Drought conditions of a region (Naxos, Greece) expressed by the annual RDIst for 45 hydrological years (different colours represent each drought class).
Fig. 6. Frequency of droughts for four areas of Greece (period 1955-2002) (Tigkas 2008).
Drought Severity ClassificationE. Crete (1955-2002)
59%26%
9% 6%
Normal Conditions
Light to moderate Drought
Severe Drought
Extreme Drought
Drought Severity ClassificationAthens (1955-2002)
55%30%
9% 6%
Drought Severity ClassificationCyclades (1955-2002)
55%28%
13% 4%
Drought Severity ClassificationThessaly (1955-2002)
51%
28%
17%4%

11
Drought Years (1955 - 2002)
3 2 1 02
0 1 2
6
0 1 0
19
5
0 0 0
2321 21
0
5
10
15
20
25
Number of Years
Nu
mb
er o
f D
rou
gh
t E
ven
ts
Thessaly
Cyclades
Athens
E. Crete
Thessaly 23 3 2 1 0
Cyclades 21 2 0 1 2
Athens 21 6 0 1 0
E. Crete 19 5 0 0 0
1 2 3 4 5
Fig. 7. Duration of consecutive drought years for four areas of Greece (period 1955-2002) (Tigkas 2008).
4.2 Drought Monitoring
Drought monitoring is essential for establishing an early warning system and for adopting the appropriate measures for the mitigation of the anticipated damages (Wilhite et al. 2005; Wilhite 2009; Bordi and Sutera 2007).
The main variable involved in drought analysis is precipitation, while potential evapotranspiration (PET) may also be used (e.g. in RDI). Therefore, the design of a meteorological drought monitoring network could be based on precipitation and air temperature (which is needed for PET estimation). However, since the spatial variability of precipitation generally exceeds that of temperature, the crucial variable for network design can be the precipitation only (Tsakiris et al. 2008). For establishing the drought monitoring system it is necessary to have available the historical data series that provides the climatic context of the area, while the new data should be regularly provided, usually on monthly basis (Tsakiris and Pangalou 2009).
DrinC can be used to monitor drought either for a predefined reference period (e.g. a “rolling” 3-month period) or for various reference periods starting from the same month (e.g. ‘Oct-Dec’, ‘Oct-Jan’, ‘Oct-Feb’, etc.), according to what fits better to the monitoring purpose.
4.3 Assessment of the spatial distribution of drought
Although there are a lot of studies which propose simplifications in drought analysis mainly regarding the drought dimension of areal extent (Tsakiris et al. 2007b), this drought dimension remains an important aspect in many drought studies. A significant simplification towards this direction is the use of the base hydrological area, which is the catchment area or river basin, instead of a discretised mesh covering the area of interest.
However, in many cases the areal extent of drought should be approached by a discretised model as the one presented in Fig. 8. This kind of models can be particularly useful, especially when remote sensing methods are employed for the calculation of drought indices for spatio-temporal drought analyses (e.g. Dalezios et al. 2012; Kanellou et al. 2012). For such cases, DrinC provides a feature which helps the user compute the required drought indices for the entire set of cells of the grid (mesh) simultaneously, avoiding the repetition of the procedure for thousands of times for each grid cell. The final results can be illustrated in thematic maps of the area, providing a clear picture of the different drought severity zones of the area.

12
Fig. 8. Annual drought maps (Eastern Crete island – Greece) presenting the spatial distribution of drought with the use of a) RDI, b) SPI and c) Deciles.
4.4 Drought and climatic trends and scenarios
The RDI, apart from its use as a drought index, can also be used as a climatic index, suitable to identify possible climatic trends in annual or seasonal basis. For example, Fig. 9 presents the initial value of RDI (α12) for two geographical areas in different climatic zones: the first for an area with humid climate, the second for an area with semi-arid climate. It can be observed that α12 is significantly higher for the humid area for the entire timeseries associated with higher variability in comparison with the semi-arid area. In order to detect the trend in the timeseries of annual RDI (α12) one can use all appropriate methods for trend detection (e.g. Spearman test, Mann-Kendall test, Runs test, Durbin-Watson test, etc.). If the trend is statistically significant, then it can be assumed that there are strong indications of climatic change at annual basis (Tigkas et al. 2013).
Also, the RDI can serve for the investigation of the drought conditions for climate change scenarios. In this context, DrinC can produce series of results based on real or synthetic data in
(a)
(b)
(c)

13
order to evaluate the possible future climatic and drought conditions of a region. Further, this can be used for the assessment of the drought impacts on the economy, the society and the environment (e.g. crop production, drinking water availability, streamflow changes).
0.00
0.20
0.40
0.60
0.80
1.00
1.20
1.40
1.60
1.80
1 2 3 4 5 6 7 8 9 10 11 12 13 14 15 16 17 18 19 20 21 22 23 24 25 26 27 28 29 30
Time (years)
RD
I (α
12)
humid area
semi-arid area
humid area average
semi-arid area average
Fig. 9. The initial value (α12) of RDI for a time series of 30 years for a humid (Aspropotamos, Greece) and a semi-arid area (Heraklion, Greece) (dashed line represents the average of α12 for each area).
4.5 Real-world applications
Several institutions and research groups have used DrinC in various applications and drought studies, mainly in arid and semi-arid regions. A few examples, that illustrate the range of applications that DrinC can be used, are presented below: Greece – Crete: The Centre for the Assessment of Natural Hazards and Proactive Planning of
the National Technical University of Athens (NTUA) studied drought episodes on a regional level at the island of Crete. A series of annual drought maps were produced with the use of DrinC along with a spatial distribution model (Tsakiris et al. 2007d).
Italy: The Water Observatory of the Region of Sicily and the University of Palermo analysed time series of climatic data (rainfall, temperature) using drought indices (SPI, RDI, NDVI) and vegetation data at the Oreto watershed in Sicily. Both satellite and conventional measurements were used in order to assess climatic effects on vegetation at the study area (Capodici et al. 2008).
Cyprus: The Meteorological Service of Cyprus has used DrinC in two studies for the assessment and the monitoring of drought in Cyprus, using an extensive network of meteorological stations and GIS techniques (Pashiardis and Michaelides 2008; Michaelides and Pashiardis 2008).
Greece – Thessaly: The University of Thessaly used DrinC to assess meteorological drought for a period of 45 years, using three drought indices (Deciles, Palmer Z and RDI) (Kanellou et al. 2008).
Malta: The Water Directorate of the Malta Resources Authority used DrinC to analyse drought events in the country through RDI and SPI. Also, there was an attempt to assess the problems that could be caused by water shortage due to severe drought events (Borg 2009).
Iran: The University of Isfahan and the Meteorological Organisation of Iran used DrinC in a study for the operational drought monitoring in the region of Isfahan. Meteorological data

14
from 10 stations were used for the calculation of RDI and SPI (Mostafavi Darani et al. 2011). Greece – Peloponnese: The Lab. of Reclamation Works and Water Resources Management
of the NTUA used DrinC along with Medbasin rainfall-runoff model (Tigkas and Tsakiris 2004) in order to assess the drought and climatic change impact on streamflow in small watersheds. The case study was performed in 6 small watersheds in N. Peloponnese. RDI was calculated for several reference periods (3, 6, 9 and 12 months) and SDI was used to represent hydrological drought. Regression equations were derived between RDI and SDI, forecasting the level of hydrological drought for the entire year. Further, DrinC was used for the formulation of a wide range of scenarios representing possible climatic changes and drought events of varying severity in the area of N. Peloponnese. Nomograms were devised for estimating the annual streamflow change caused by each climate change scenario (Tigkas et al. 2012).
Romania: The Hydrotechnical Engineering Department of the Polytechnics University of Timisoara performed a drought analysis for the western part of Romania, using SPI and RDI, computed with DrinC for several reference periods (Rares 2013).
5. CONCLUDING REMARKS
In this paper the theoretical background, the design and the main features of the Drought Indices Calculator (DrinC) software are presented. The software facilitates the calculation of two recently developed (RDI, SDI) and two widely used drought indices (SPI, PD) and may assist researchers, institutions and stakeholders to derive reliable results for drought analysis.
DrinC can be used in a variety of applications, including drought characterisation, drought monitoring, delineation of the spatial extent of drought, investigation of climatic trends and evaluation of the drought severity for a number of possible drought or future climatic scenarios.
From the applications of DrinC in various regions of the world, it seems that it gradually gains ground for becoming a popular software for drought analysis. Especially, DrinC can be a useful tool in the framework of operational management, assisting for the early estimation of drought consequences and the mitigation of the anticipated impacts.
6. AVAILABILITY AND REQUIREMENTS
The DrinC software can be downloaded from the website http://drinc.ewra.net. All the files required for the installation and use of the software (setup file, getting started guide, data input templates etc.) are freely distributed through this site. The software runs on Windows operating systems and it has been successfully tested in all versions (from 98SE to 8.1).
REFERENCES
Abramovitz M. and Stegun I. (1965) Handbook of Mathematical Functions. National Bureau of Standards, Applied Mathematics Series – 55, Washington, D.C.
Balint Z., Mutua F.M., Muchiri P. (2011) Drought Monitoring with the Combined Drought Index, FAO-SWALIM Nairobi, Kenya
Beguería S., Vicente-Serrano S.M. (2013) Calculation of the Standardised Precipitation-Evapotranspiration Index. http://cran.r-project.org/web/packages/SPEI/SPEI.pdf (accessed July 2, 2014)
Bordi I. and Sutera A. (2007) Drought monitoring and forecasting at large scale. In: Rossi G. et al. (eds.) Methods and tools for drought analysis and management. Springer, pp 3-27.
Borg D.S. (2009) An Application of Drought Indices in Malta, Case Study. European Water, 25/26: 25-38. Brouwer C. and Heibloem M. (1986) Irrigation Water Management: Irrigation water needs. Training manual no. 3.
FAO, Rome. Capodici F., Ciraolo G., La Loggia G., Liuzzo L., Noto L.V., Noto M.T. (2008) Time Series Analysis of Climate and
Vegetation Variables in the Oreto Watershed (Sicily, Italy). European Water, 23/24: 133-145. Edwards D.C. and McKee T.B. (1997) Characteristics of 20th century drought in the United States at multiple time

15
scales. Climatology Report Number 97-2, Colorado State University, Fort Collins, Colorado. Dalezios N. R., Blanta A., Spyropoulos N.V. (2012) Assessment of remotely sensed drought features in vulnerable
agriculture. Nat. Hazards Earth Syst. Sci., 12: 3139–3150. Doorenbos J. and Pruitt W. O. (1977) Guidelines for predicting crop water requirements. Irrigation and Drainage Paper
24, 2nd edition, FAO, Rome. Gibbs W.J. and Maher J.V. (1967) Rainfall deciles as drought indicators. Bureau of Meteorology Bulletin no. 48.
Commonwealth of Australia, Melbourne. Hargreaves G.H. and Z.A. Samani (1985) Reference crop evapotranspiration from temperature. Transaction of ASAE
1(2): 96-99. Hayes M.J., Alvord C. and Lowrey J. (2007) Drought Indices. Feature Article, Intermountain West Climate Summary,
3(6): 2-6. Kanellou E., Domenikiotis C., Blanta A., Hondronikou E. and Dalezios N.R. (2008) Index-based Drought Assessment
in Semi-Arid Areas of Greece based on Conventional Data. European Water 23/24: 87-98. Kanellou E., Spyropoulos N., Dalezios N.R. (2012) Geoinformatic Intelligence Methodologies for Drought
Spatiotemporal Variability in Greece. Water Resources Management 26: 1089–1106 Kininmonth W.R., Voice M.E., Beard G.S., de Hoedt G.C. and Mullen C.E. (2000) Australian climate services for
drought management. In: D.A. Wilhite (ed.) Drought, a global assessment., Routledge, pp. 210-222. McKee T.B., Doesken N.J. and Kleist J. (1993) The relationship of drought frequency and duration to time scale. In:
Proceedings of the Eighth Conference on Applied Climatology, American Meteorological Society. Anaheim (CA), 17-22 January 1993, AMS, pp. 179-184.
Michaelides S. and S. Pashiardis (2008) Monitoring Drought in Cyprus during the 2007-2008 hydrometeorological year by using the Standardized Precipitation Index (SPI). European Water 23/24: 123-131.
Morid S., Smakhtin V.U., Moghaddasi M. (2006) Comparison of seven meteorological indices for drought monitoring in Iran. International Journal of Climatology 26, 971-985.
Mostafavi Darani S.M., Khoshhal Dastjerdi J., Parandeh A., Ghatrehsamani M. (2011) Drought monitoring in Isfahan province (Iran) by comparison of SPI and RDI. ‘European Conference on Applications of Meteorology’ EMS Annual Meeting Abstracts Vol. 8, EMS2011-229, 11th EMS/10th ECAM. 12-16 Sept. 2011, Berlin, Germany.
Nalbantis Ι. and Tsakiris G. (2009) Assessment of Hydrological Drought Revisited. Water Resources Management 23(5): 881-897.
Nalbantis Ι. (2008) Drought and Streamflow. European Water 23/24: 65-76. NDMC - National Drought Mitigation Center (2014) Program to Calculate Standardized Precipitation Index.
http://drought.unl.edu/MonitoringTools/DownloadableSPIProgram.aspx (accessed June 30, 2014) Pashiardis S. and S. Michaelides (2008) Implementation of the Standardized Precipitation Index (SPI) and the
Reconnaissance Drought Index (RDI) for Regional Drought Assessment: A case study for Cyprus. European Water 23/24: 57-65.
Rares H.C.Z. (2013) Drought Analysis in Western Romania using DrinC program. In: A. Zaharim et al. (eds.) Recent Advances in Energy, Environment and Geology,. WSEAS Press, Energy, Environmental and Structural Engineering Series 18. pp. 82-87.
Rossi G., Benedini M., Tsakiris G. and Giakoumakis S. (1992) On regional drought estimation and analysis. Water Resources Management 6: 249–277.
Smakhtin V.U., Hughes D.A. (2007) Automated estimation and analyses of meteorological drought characteristics from monthly rainfall data. Environmental Modelling and Software 22: 880-890
Stamm G.G. (1967) Problems and procedures in determining water supply requirements for irrigation projects. In: Hagan et al.. (eds.) Irrigation of agricultural lands, Wisconsin, Amer. Soc. Agron. Agronomy II. pp. 771-784
Thom H.C.S. (1958) A note on the gamma distribution. Monthly Weather Review, 86: 117-122. Thornthwaite C.W. (1948) An approach towards a rational classification of climates. Geog. Rev. 38; 55-94. Tigkas D. (2008) Drought Characterisation and Monitoring in Regions of Greece. European Water 23/24: 29-39. Tigkas D. and Tsakiris G. (2004) Medbasin: A Mediterranean rainfall-runoff software package. European Water 5/6: 3-
11. Tigkas D., Vangelis H., Tsakiris G. (2012) Drought and climatic change impact on streamflow in small watersheds.
Science of the Total Environment 440: 33–41. Tigkas D., Vangelis H., Tsakiris G. (2013) The RDI as a composite climatic index. European Water 41: 17-22. Tsakiris G., Loukas A., Pangalou D., Vangelis H., Tigkas D., Rossi G., Cancelliere A. (2007a) Drought
characterization. In Drought Management Guidelines Technical Annex, A. Iglesias et al. (Eds.). CIHEAM / EC MEDAWater. Zaragoza, 85-102.
Tsakiris G, Pangalou D, Tigkas D, Vangelis H (2007b) Assessing the areal extent of drought. In: Karatzas G. et al. (Eds.) Proceedings of EWRA Symposium “Water resources management: New approaches and technologies”, Chania, Greece. pp. 59-66.
Tsakiris G, Nalbantis I, Pangalou D, Tigkas D, Vangelis H. (2008) Drought meteorological monitoring network design for the reconnaissance drought index (RDI). In: Franco Lopez A. (ed.), Proceedings of the 1st International Conference “Drought Management: scientific and technological innovations”. Zaragoza, Spain: Option Méditerranéennes, Series A, No. 80, 12 - 14 June 2008; 2008. pp. 57-62.
Tsakiris G., Nalbantis I., Vangelis H., Verbeiren B., Huysmans M., Tychon B., Jacquemin I., Canters F., Vanderhaegen S., Engelen G., Poelmans L., De Becker P. and Batelaan O. (2013) A system-based paradigm of drought analysis for operational management. Water Resources Management 27: 5281-5297.
Tsakiris G. and Pangalou D. (2009) Drought Characterisation in the Mediterranean. In: A. Iglesias et al. (eds.), Coping

16
with drought risk in agriculture and water supply systems. Spinger Science & Business Media B.V. pp. 69-80 Tsakiris G., Pangalou D. and Vangelis H. (2007c) Regional Drought Assessment Based on the Reconnaissance Drought
Index (RDI). Water Resources Management, 21(5): 821-833. Tsakiris G., Tigkas D., Vangelis H., Pangalou D. (2007d) Regional Drought Identification and Assessment – Case
Study in Crete. In: Rossi et al. (eds.) Methods and Tools for Drought Analysis and Management, Springer, The Netherlands. pp. 169-191.
Tsakiris G., Vangelis H. (2004) Towards a Drought Watch System based on spatial SPI. Water Resources Management 18(1): 1-12.
Tsakiris G., Vangelis H. (2005) Establishing a Drought Index Incorporating Evapotranspiration. European Water, 9/10: 3-11.
Tsakiris G., Vangelis H., Tigkas D. (2010) Drought impacts on yield potential in rainfed agriculture. In: Proceedings of 2nd International Conference on Drought Management ‘Economics of Drought and Drought Preparedness in a Climate Change Context’, 4-6 March 2010, Istanbul, Turkey, pp. 191-197.
Vangelis H., Tigkas D. and Tsakiris G. (2013) The effect of PET method on Reconnaissance Drought Index (RDI) calculation. Journal of Arid Environments, 88: 130-140.
Wilhite D.A. (2009) Drought monitoring as a component of drought preparedness planning. In: A. Iglesias et al. (eds.), Coping with drought risk in agriculture and water supply systems. Spinger Science & Business Media B.V. pp. 3-19
Wilhite D.A., Svoboda M.D. and Hayes M.J., 2005. Monitoring Drought in the United Sates. Status and Trends. In: Boken V.K. et al. (eds.) Monitoring and Predicting Agricultural Drought: A Global Study. Oxford University Press. New York. pp. 121-131.