dredging sound measurements · dredging sound measurements stephen p. robinson, npl woda workshop,...
TRANSCRIPT

Dredging sound measurements
Stephen P. Robinson, NPL
WODA Workshop, Paris, 26th March 2015

Contents
Types of dredger and dredging operation
Sources of underwater sound during dredging
- Noise generation mechanisms
Examples of recent studies
- UK MALSF study
- Dutch MAASVLAKTE 2 (MV2)
- Other studies
Conclusions

Common dredging activities
Dredging excavation
Dredging vessels during transport
Dredged material placement.
Common types of dredger
For the majority of projects, one or more of four basic
types of vessel are used:
Cutter Suction Dredgers (CSD),
Trailing Suction Hopper Dredgers (TSHD),
Grab Dredgers (GD)
Backhoe Dredgers (BHD)
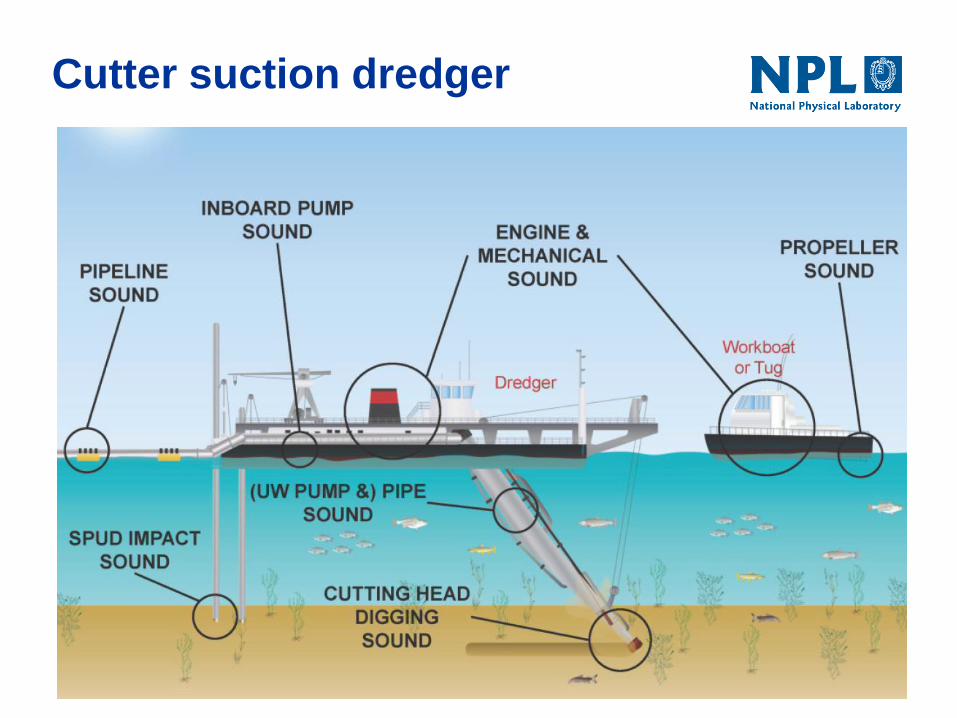
Cutter suction dredger

Trailing Suction Hopper Dredger
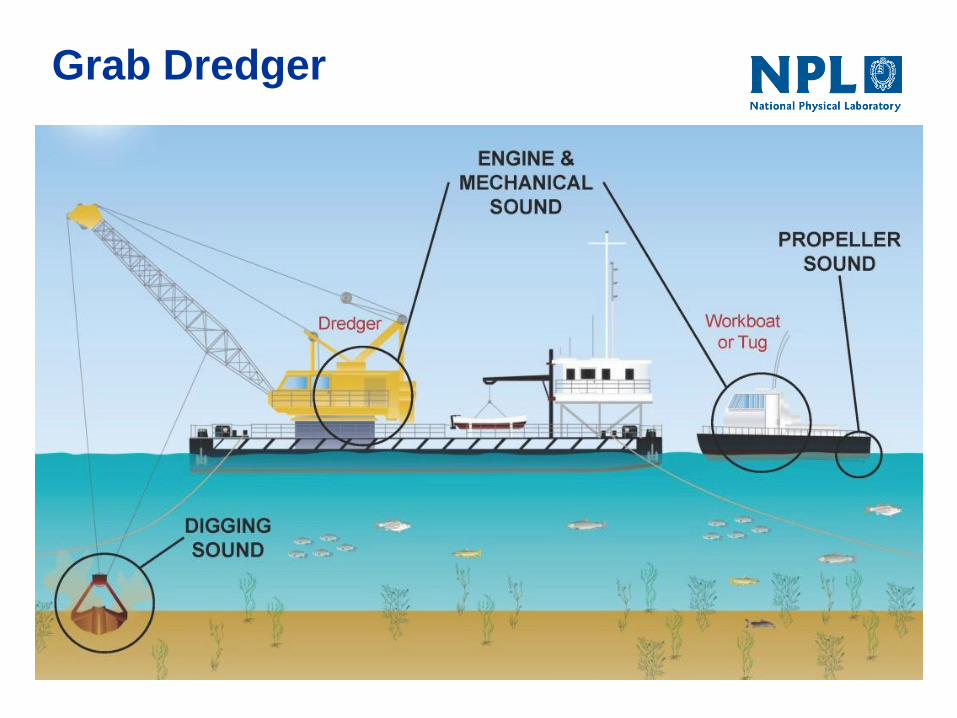
Grab Dredger
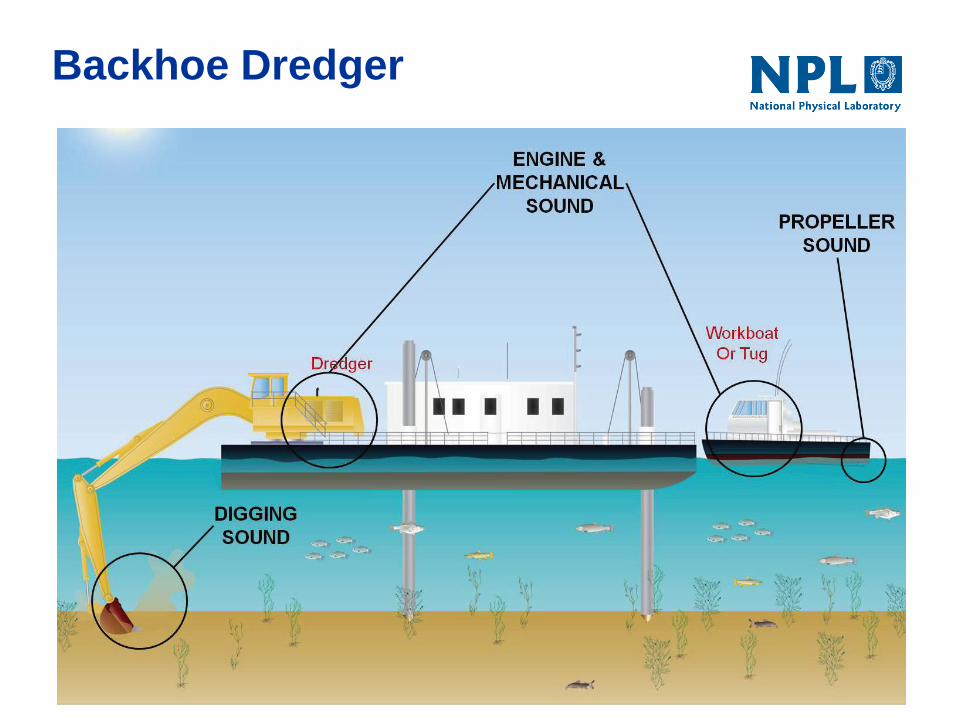
Backhoe Dredger

Examples of recent studies
UK MALSF study
Dutch MAASVLAKTE 2 (MV2)
Reine, Clarke and Dickerson
Other studies

MALSF project P108 details
Funded by the UK Marine Aggregate Levy Sustainability Fund (MALSF)
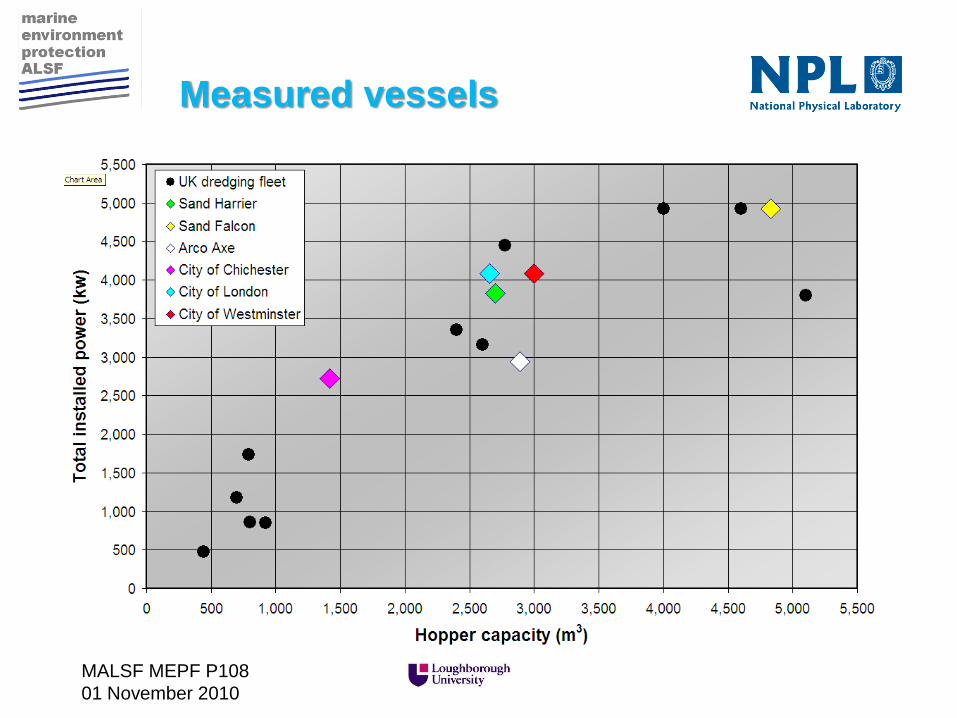
• Seven TSHD dredgers measured in
three locations around UK
• variety of operational modes
• Water depths: 27 m to 45 m
• Aggregate types: sand, gravel
• Vessel speeds: ~1.5 kts
Partners:
NPL
Loughborough University,
ISVR (University of Southampton)
Gardline Environmental Ltd
Further Collaborations • dstl
– quality check on measured data
– analysis of LF tonal signals
• TNO (Netherlands)
– collaborated on methodology
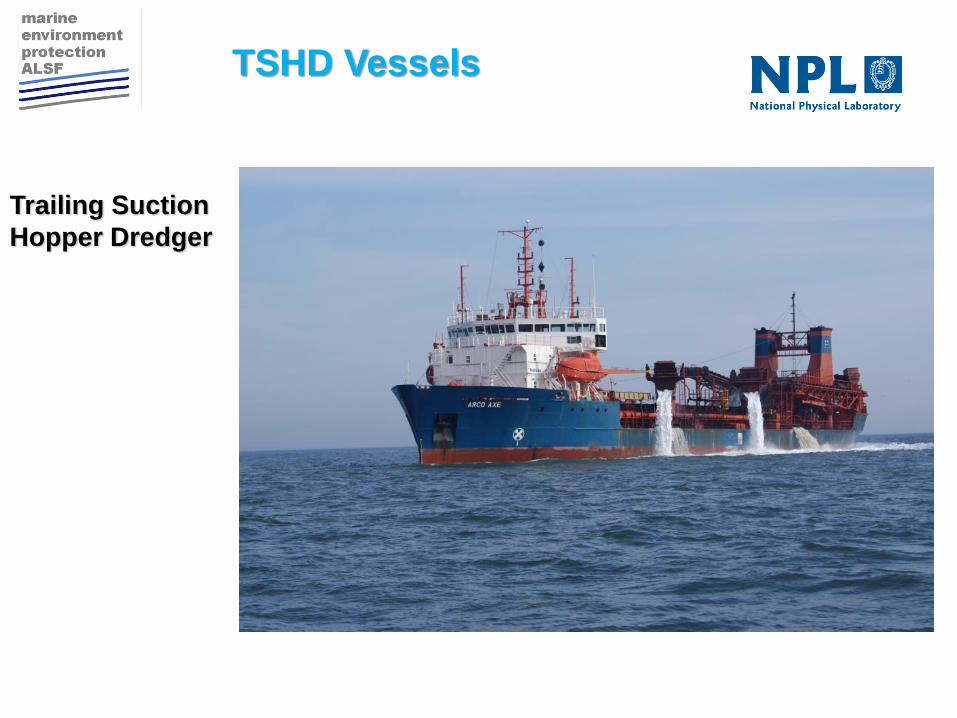
Trailing Suction
Hopper Dredger
TSHD Vessels

East region
Sand Falcon Arco Axe
Sand Harrier
City of Chichester
Sand Falcon City of London
City of Westminster
Measurement locations
MALSF MEPF P108
01 November 2010
13
Measured vessels
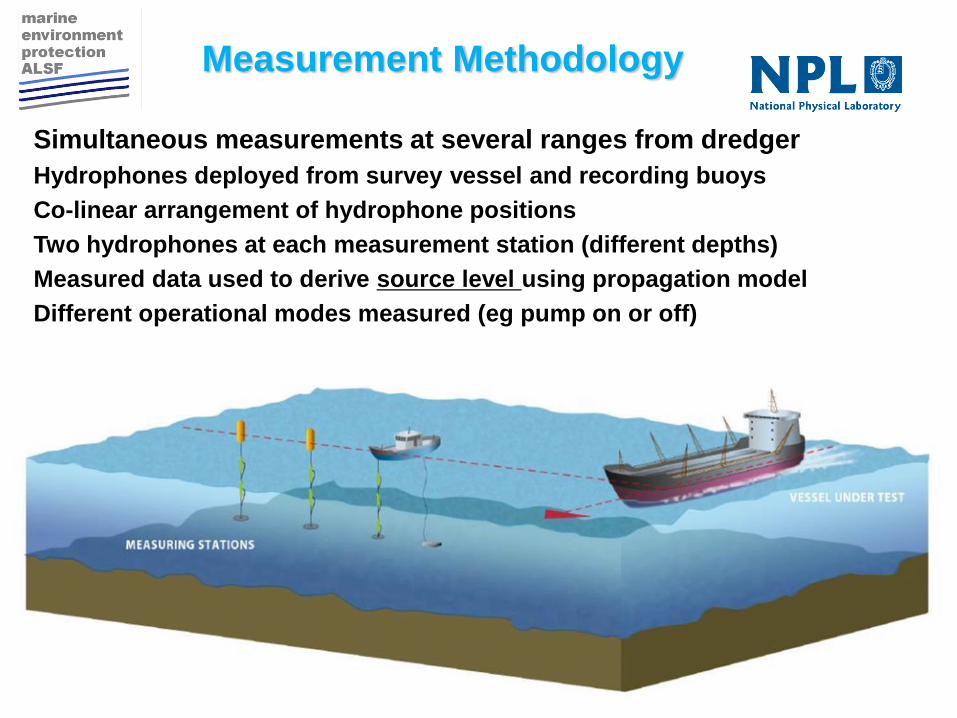
Simultaneous measurements at several ranges from dredger
Hydrophones deployed from survey vessel and recording buoys
Co-linear arrangement of hydrophone positions
Two hydrophones at each measurement station (different depths)
Measured data used to derive source level using propagation model
Different operational modes measured (eg pump on or off)
Measurement Methodology

MALSF MEPF P108
15
f(Hz)
Tim
e (
min
)
Full dredging at the nearest point: buoy50
0 1 2 3 4
x 104
773
774
775
776
777
778
40
50
60
70
80
90
100
110
120
130
140
Full dredging (Sand Falcon)
Example spectrogram

MALSF MEPF P108
16
f(Hz)
Tim
e (
min
)
Drag head lifted: NPL
0 2 4 6 8 10 12
x 104
796.6
796.8
797
797.2
797.4
797.6
797.8
798
798.2
798.4 40
50
60
70
80
90
100
110
120
130
140
f(Hz)
Tim
e (
min
)
Dgar head lowered: NPL
0 2 4 6 8 10 12
x 104
802.2
802.4
802.6
802.8
803
803.2
803.4
803.6
803.8
804 40
50
60
70
80
90
100
110
120
130
140
Power spectral
density spectrogram
showing difference:
(i) draghead raised
(pumping water only)
(ii) draghead lowered
(on sea-bed pumping
sand and gravel)
Drag head raised and lowered

f (Hz)
Tim
e (
min
)
Pump restarted at buoy50
0 1 2 3 4
x 104
830.2
830.4
830.6
830.8
831
831.2
831.4
831.6
831.8
832 40
50
60
70
80
90
100
110
120
130
140
Power spectral
density spectrogram
showing pump being
restarted
(from measurement
buoy at 50 m)
Drag head raised and lowered

Results for different configurations
Received levels at 100 m range for different configurations
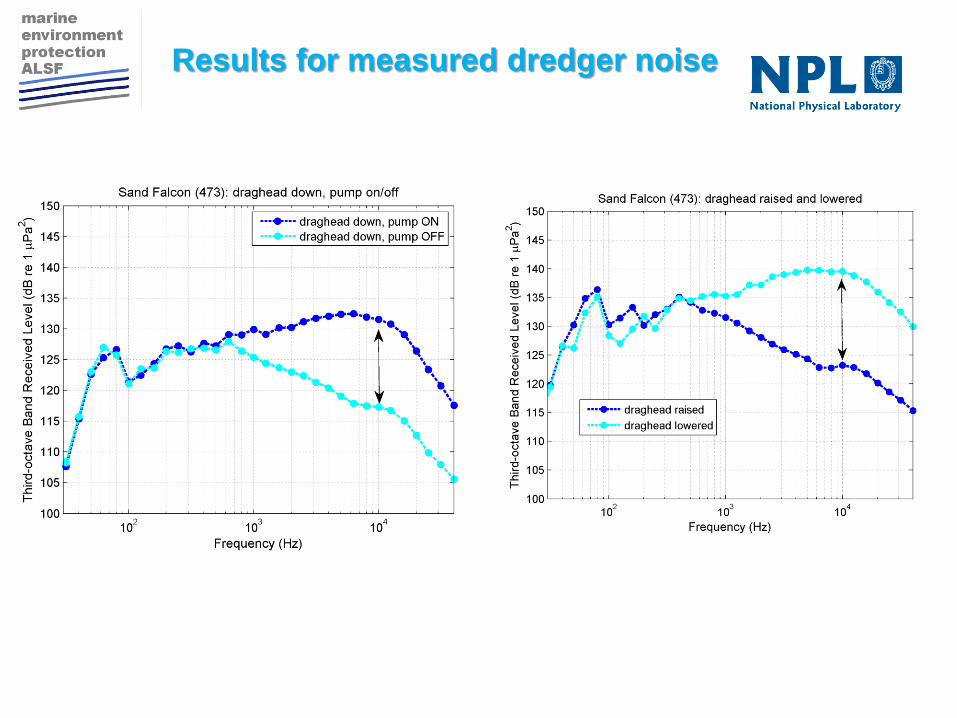
Results for measured dredger noise
MALSF MEPF P108
01 November 2010
20
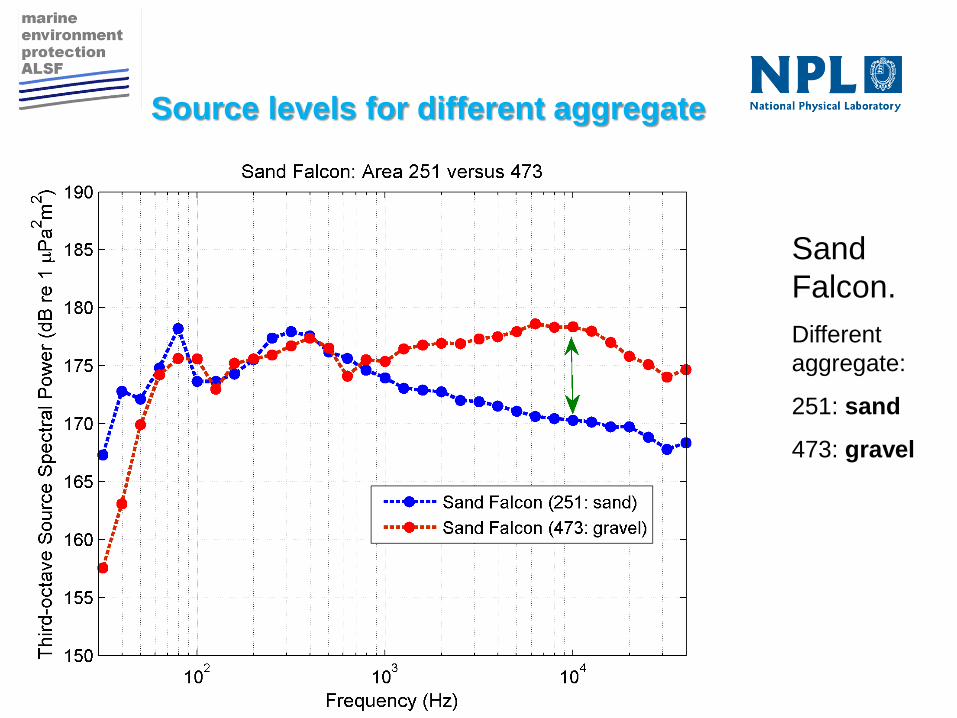
Sand
Falcon.
Different
aggregate:
251: sand
473: gravel
Source levels for different aggregate

MALSF MEPF P108
01 November 2010
21
Geophone Recording
Results for seabed vibration

MALSF MEPF P108
01 November 2010
22
Sand Harrier
Mean SL with
standard
deviation.
Three passes, 2
hydrophones at
each of three
ranges, data
window 2 secs.
Source level repeatability

September 26, 2013 23
Maasvlakte 2 construction
Measurement campaign 2008*:
September 2008
Underwater ambient sound measurements prior to MV2 construction activities
Fixed location ‘Z’
Measurement campaign 2009**:
25 Sep to 5 Oct 2009
Monitor sound during dredging
activities for MV2 construction
Fixed location moved 2 km east due to fishing activity
Source Level measurements of Trailing Suction Hopper Dredgers
*J. Dreschler et al, Measurements of underwater background noise Maasvlakte 2. TNO-DV 2009 C212, May 2009
** C. A. F. de Jong et al, Underwater noise of Trailing Suction Hopper Dredgers at Maasvlakte 2: Analysis of source levels
and background noise, TNO report, 2010.
A – dredging area
B – transit area
C - Maasvlakte 2
Z – ambient sound measurement

24
Dredgers pass close by autonomous platform
Altered shipping lanes
Measurement platform
dredgers
Dredging
related
fishing
2008 2009
Shipping pattern (AIS)
Measurement platform

25
TSHD ‘source level’ measurements
22 September – 1 October 2009 (noise measurements)
7 different dredgers (trailing suction hopper dredgers)
transiting (31 runs), dredging (23 runs), sand laying (2 runs), rainbowing (10
runs) and pumping ashore (2 runs).
Hopper Volume [m3]
Inst
alle
d p
ow
er [
kW]
September 26, 2013
de Jong et al.
Offshore Dredger Sounds:
October 2009

26
Dredger source levels
7 different trailing suction
hopper dredgers (hopper
volume 300 – 20000 m3)
transiting (31 runs)
dredging (23 runs)
sand laying (2 runs)
rainbowing (10 runs)
pumping ashore (2
runs)
Maximum levels
(envelope)
Mainly cavitation
(propellers & thrusters)
September 26, 2013
de Jong et al.
Offshore Dredger Sounds:
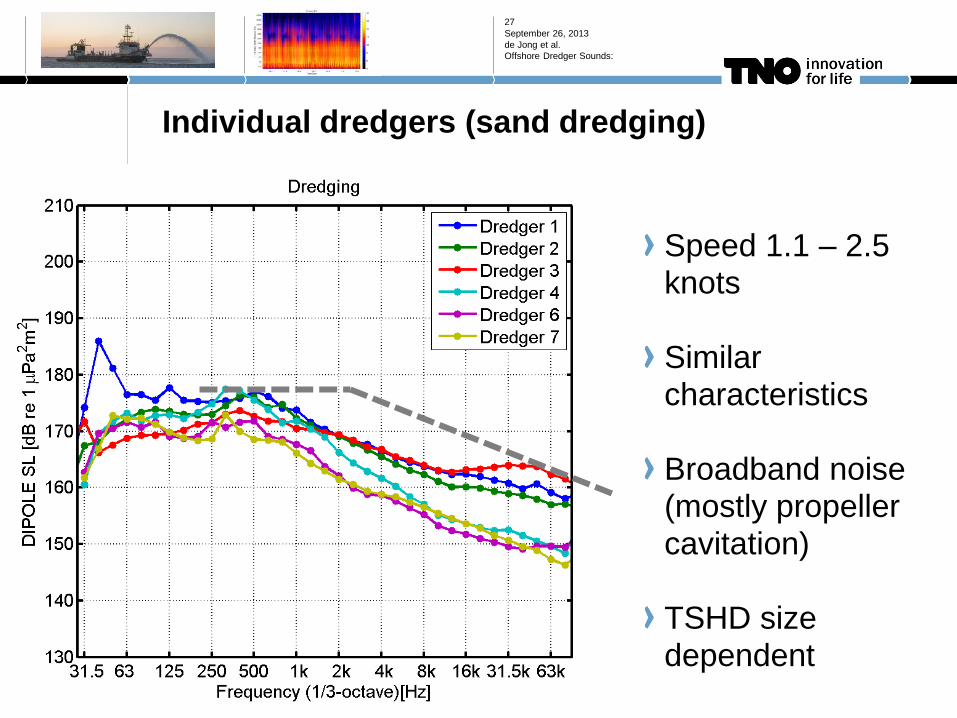
Individual dredgers (sand dredging)
September 26, 2013
de Jong et al.
Offshore Dredger Sounds:
27
Speed 1.1 – 2.5 knots Similar characteristics Broadband noise (mostly propeller cavitation) TSHD size dependent

28
MV2 dredgers in transit
Speed 10 – 16.7 knots
Compared with Overseas
Harriette (10-16 kn) at keel
aspect
M/V OVERSEAS HARRIETTE
Arveson & Vendittis, JASA 107(1), 2000
M/V OVERSEAS HARRIETTE
September 26, 2013
de Jong et al.
Offshore Dredger Sounds:
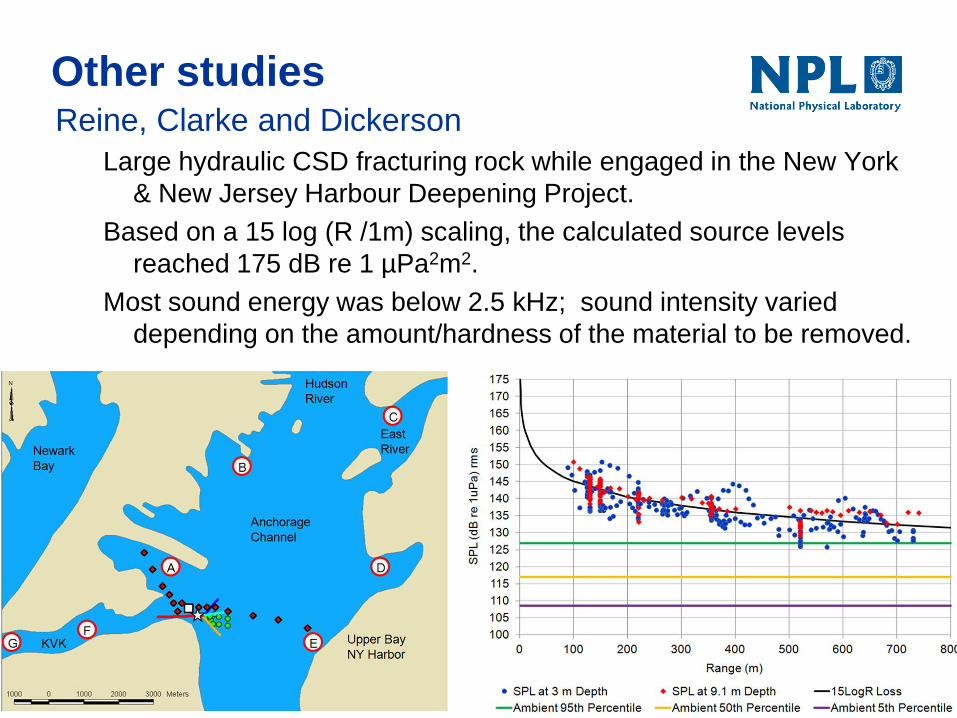
Other studies Reine, Clarke and Dickerson
Large hydraulic CSD fracturing rock while engaged in the New York
& New Jersey Harbour Deepening Project.
Based on a 15 log (R /1m) scaling, the calculated source levels
reached 175 dB re 1 µPa2m2.
Most sound energy was below 2.5 kHz; sound intensity varied
depending on the amount/hardness of the material to be removed.

Other studies Reine, Clarke and Dickerson
BHD removing the fractured rock created by the CSD
Using a 15 log (R/1m) scaling the most intense bottom grab sound was
estimated by back calculation to be 179.4 dB re 1 µPa2m2
Frequency range 3 Hz – 20 kHz, peak frequency = 315 Hz).
Hydraulic ram sounds were approximately 15 dB lower than the grab
sounds.
Information on sound levels from a number of additional components of
the dredging process as well.

Other studies
Nedwell et al. (2008)
Large BHD measured at Lerwick, Shetland (UK).
Based on a ‘conservative’ 10 log (R/1 m) scaling, the estimated
“affected or equivalent” source level during excavation was 163 dB
re 1 µPa2m2.
Underwater sound measured at frequencies from 20 Hz to
approximately 20 kHz; consistent sound was recorded over the
low frequency range from 20 to 80 Hz; peak spectral levels of
sound occurring between 35 and 45 Hz.
Itap (2007)
Measured sounds from a TSHD performing sand extraction off Sylt,
Germany. Based on a 14 log (R / 1m) scaling, estimated “affected
or equivalent” source level of 184 – 188 dB re 1 µPa2m2
Most energy between 100 and 500Hz

Summary and conclusions
Sources of sound from dredging include machinery noise,
propulsion noise, pumping noise, aggregate noise
Noise radiation depends on operational mode: extraction,
transiting, depositing, rainbowing, pumping ashore
Several studies have reported the typical noise levels,
including several which report source levels
Radiated noise is typical of a cargo vessel at modest speed
Dredger noise seems to be highest during transit at speed
Aggregate type can affect radiated levels in kilohertz range
During aggregate extraction, vessel stay on station for
extended period – unusual for commercial vessel

33