sedimentation rates in puget sound from 210pb measurements · sedimentation rates in puget sound...
TRANSCRIPT
NOAA Technical Memorandum ERL PMEL-61
SEDIMENTATION RATES IN PUGET SOUND FROM 210pB MEASUREMENTS
J. W. LavelleG. J. Massoth
E. A. CreceliusBattelle Marine Research LaboratorySequim, Washington
Pacific Marine Environmental LaboratorySeattle, WashingtonJanuary 1985
UNITED STATESDEPARTMENT OF COMMERCE
Malcolm Baldrige,Secretary
NATIONAL OCEANIC ANDATMOSPHERIC ADMINISTRATION
Environmental ResearchLaboratories
Vernon E. Derr.Director
NOTICE
Mention of a commercial company or product does not constitutean endorsement by NOAA/ERL. Use of information from thispublication concerning proprietary products or the tests ofsuch products for publicity or advertising purposes is notauthorized.
Contribution No. 732 from NOAA/Pacific Marine Environmental Laboratory
ii

CONTENTS
ABSTRACT ••••••••••••••••••••••••••••••••••••••••••••••••••••••••••••••••••• 1
1 • I NTRODUCTI ON ••••••••••••••••••••••••••••••••••••••••••••••••••••••••••• 1
2. DATA ACQUISITION AND ANALYSIS •••••••••••••••••••••••••••••••••••••••••• 3
3. RESULTS AND DISCUSSION••••••••••••••••••••••••••••••••••••••••••••••••• 6
4. CONCLUSIONS ••••••••••••••••••••••••••••••••••••••••••••••••••••••••••• 19
5. ACKNOWLEDGMENTS .••..••••.••..•••••••••••••••••.•••...•..•••••••••••.•• 20
6. REFERENCES •••••••••••••••••••••••••••••••••••••••••••••••••••••••••••• 21
Appendix I:
Appendix II:
Salt Correction Calculations •••••••••••••••••••••••••••••••• 24
Data Tables ••••••••••••••••••••••••••••••••••••••••••••••••• 26
iii


Sedimentation Rates in Puget Sound from 210Pb Measurements
J. W. LavelleG. J. Massoth
E. A. Crecelius*
ABSTRACT. Sixteen 210Pb profiles from sites along the axis of theMain Basin of Puget Sound show that bottom sediments areaccumulating at rates of 0.26 to 1.20 g/cm2/yr; these along withseven rates earlier published suggest highest accumulation nearlymidway along the length of this tidal current-dominated basin.Bioturbated surface layers of cores have also been found to be asdeep as 40 cm, but biologic mixing rates are poorly determined.Individual 210Pb accumulation rates have a range of fromapproximately one to five times areal average accumulation ratesbased on estimates of recent sediment input from riverine andshoreline sources.
1. INTRODUCTION
Puget Sound, sculpted by glacial advance and retreat, is the deepestestuarine system in the contiguous United States. Its Main Basin, withrelatively steep side walls, is presently more than 200 m deep, though at thetime of the last glaciation that depth extended to more than 600 m. Thesedimentation that has occurred since the last glacial retreat continues withsediments provided by rivers, shoreline erosion, and possibly submarinesources. It is of particular interest today because it is one important wayby which anthropogenic particulate-borne contaminants are eventually isolatedfrom the marine biosphere. This report focuses on the rate of recentsedimentation and its pattern along the axis of the Main Basin of Puget Sound.
210Pb has seen considerable geophysical use in determining sedimentationrates (e.g. Robbins, 1978). 210Pb is a useful isotope because it is naturallyand constantly produced, attaches readily and nearly irreversibly toparticles, and has a half-life of 22.3 years that allows study ofsedimentation over approximately the last 70 years. Estimates ofsedimentation rates come from analysis of profiles of the concentration of theisotope in sediment cores.
Puget Sound can be divided into several regions: North Sound, WhidbeyBasin, Central Sound (Main Basin), South Sound, and Hood Canal (e.g. Downing,1983). The Main Basin is defined as the area south of the sill at AdmiraltyInlet and north of the sill at Tacoma Narrows (Fig. 1). Our data anddiscussions concern Main Basin sedimentation. Others have also reported on210Pb determinations of sedimentation rates in the Puget Sound region (Blank,1950; Shell, 1974; Shell and Nevissi, 1977; Shell et a1. 1977; Link, 1982) butnearly all of the cores except those reported by Carpenter et a1. (1985) were
*Batte11e Marine Research Laboratory, Sequim, WA 98382
1

IS'
45'
IS'
30'
30'
30I
~..' ...
~. :.':
" ,"
15'
15'
10 20I t
SrlLLAGUAMISH R.~~~
o,
30'
30'
45'
45'
15'
IS'
,.......•..,. ;
"~. ·f,.~ .:~.
:1>
30'
30'
IS'
IS'
45'
30'
Fig. 1.--Stations locations and inferred sediment accumulation rates(g/cm 2 /yr). Closed circles are from our analyses and the open circlesfrom Carpenter et ale (1985).
2

taken with coring devices which are known to shorten or compress cores. Ourcores were taken with a corer that minimizes distortion and provides data togreater depth that most cores previously taken. These results, when added tothose of Carpenter et a1. (1985), also more than double the number of stationsalong the axis of the Main Basin. As a consequence, a better definition ofsedimentation patterns is possible leading to a somewhat different conclusionthan that previously drawn.
2. DATA ACQUISITION AND ANALYSIS
Cores along the axis of the Main Basin were taken at seven stations(Cores 11-17, Table 1) in August, 1982, and at 9 stations (Cores 1-9, Table 1)in March, 1984 (Fig. 1). A single additional core was taken in Whidbey Basin(Core 110). The samples were taken with a Kasten corer (3.0 x 0.15 x 0.15 m),a device that minimizes the core shortening effects of conventional gravitycorers (Lebel et al., 1982) and also provides much longer cores than normallycollected by box corer. Core length varied from 230 to 300 m, considerablylonger than most cores previously reported for Puget Sound.
Sections 2 cm (1984 cores) or 5 cm (1982 cores) thick were removed at anumber (11 ~ n ~ 20) of depths in the core and homogenized. Homogenizationprecludes observations of high wave-number variations in 210Pb activity asobserved by Carpenter et ale (1985), but a consequent effect on accumulationrate estimates should not~e expected. 210Pb analysis on sections wasconducted using ~ (210PO granddaughter) spectrometry. Each section was alsoanalyzed for water content, and a salt corrected porosity, ., and a 210Pbactivity per unit mass of salt-free sediment was determined. Appendix Idetails the salt correction calculation.
Unsupported 210Pb activity was calculated from total 210Pb activity bysubtracting the background activity calculated from the samples deep in thecore which indicated a constant activity had been reached. In a few cores(Cores 16, 13, 14, 15) this was not possible and a nominal value of 1 dpm/gfor background was used, and the sensitivity of results to that choice wasexamined.
The resulting profiles of unsupported 210Pb activity (Figs. 2a-i) showedconsiderable differences in slope at depth (proportional to sedimentationvelocity) and in the thickness of the bioturbated surface layer. Except forthe upper one or two samples in each core, the associated porosity data wasrelatively constant with depth. A mean porosity below the bioturbated layerfor each core (Table 1) was calculated and used in the subsequent analyses.
The profiles were evaluated with a steady two-layer advection-diffusionmodel (e.g. Goldberg and Koide, 1962; Robbins, 1978):
3C 3 acw - - - (A -) = -).Cs 3z az az (1)
where C is the unsupported 210Pb activity, z the vertical coordinate (positivedownward), w, a constant sedimentation velocity, A the mixing coefficient dueto bioturbatlon (or biodiffusivity) and). (= 0.03114 yr- 1) the radioisotopedecay constant. The generalization of (1) for non-constant porosity is given
3

Table l:--Station data and best-fit model results. Accumulation rates are calculated using Eq. 2 with p = 2.6 gm/cm 3 ,
a value measured on representative samples; mean porosity is based on samples below the bioturbation depth.A supported 210Pb activity of 1.0 dmp/g is a nominal value. Confidence limits are at the 95% level.
Core Latitude (N)/ Water Supported Number Bioturba- Mixing 210Pb Sediment- Hean AccumulationNo. Latitude (W) Depth 210Pb of tion Coeffi- Surface ation Porosity Rate
(m) Activity Samples'" Depth dent Concen- Velocity (gm/cm2 /yr)(dpm/g) (cm) (cm2/yr) tration (cm/yr)
(dpm/g)
1 47°21.9 1 /122°22.0 1 178 0.72 11 15 30 8.0 0.73±0.05 0.832±0.008 0.32±0.042 47°23.8 1 /122°21.2 1 207 0.72 12 30 30 9.6 0.53±0.04 o.809±0 .0lD 0.26±0.033 47°25.6 1 /122°23.5 1 193 0.94 17 35 300 9.1 l.43±0.07 0.822±0.008 0.66±0.064 47°25.6 1 /122°23.5 1 193 0.97 17 20 30 10.3 l.90±0.12 0.825±0.006 0.86±0.085 47°25.6 1 /122°23.5 1 193 0.82 18 40 30 9.7 1.43±0.08 0.825±0.007 0.65±0.066 47°31.6 1 /122°25.4 1 201 1.0 19 35 300 10.7 2.48±0.23 0.814±0.007 1.20±0.166a - - 0.5 19 35 300 10.6 3.12±0.18 0.814±0.007 1.51'±0.147 47°36.9 1 /122°26.75 1 205 1.1 17 15 30 11.7 l.52±0.07 0.803±0.008 0.78±0.07
~ 8 47°39.75 1 /122°27.9 1 229 0.87 16 30 30 11.9 1.20±0.08 O. 779.±0 .008 0.69±0.079 47°26.7 1 /122°23.55 1 238 0.54 11 10 30 5.2 0.66±0.09 0.672±0.037 0.56±0.14
10 47°58.8'/122°19.5 1 159 0.60 13 5 30 8.4 0.86±0.09 0.80S±0.006 0.44±0.0611 47°49.4 1 /122°25.8 1 173 1.01 8 10 30 11.1 0.64±0.06 o.665±0 .017 0.56±0.0812 47°43.0 1 /122°24.3 1 188 0.81 13 35 270 10.6 0.98±0.04 O. 777±0 .008 0.57±0.0412a - - 0.81 13 35 1000 10.2 0.97±0.05 0.777±0.008 0.56±0.OS12b - - 0.81 13 35 30 13.5 1.03±0.07 O. 777±0 .008 0.60±0.0613 47°42.3 1 /122°26.4' 199 1.0 14 35 30 12.5 l.92±0.09 0.76S±0.006 l.17±0.0813a - - 1.0 14 35 70 11.S l.88±0.09 0.76S±0.006 1.15±0.0813b - - 0.5 14 35 30 11.4 2.37±0.14 0.76S±0.006 l.4S±0.1114 47°36.9 1 /122°26.8 1 205 l.0 9 35 30 13.8 2.14±0.09 0.794±0.009 l.lS±0.1014a - - 0.5 9 35 30 13.4 2.66±0.14 0.794±0.009 1.42±0.1415 47°28.8 1 /122°24.4' 197 1.0 10 35 30 12.3 2.21±0.08 o.822±0 .011 l.02±0.1015a - - 1.0 10 35 70 1l.3 2.17±0.09 o.822±0 .011 l.00±0.1015b - - 0.5 10 35 30 12.3 2.68±0.14 o.822±0 .011 l.24±0.1416 47°21.0 1 /122°24.4' 185 1.34 8 10 30 9.5 l.21±0.14 o.81S±0.012 0.58±0.1017 47°18.7'/122°27.7' 183 0.62 8 10 30 3.7 l.8l±0.17 0.66S±0.026 1.58±0.27
*Supported 210Pb activity

(2)
Here Bi = (Ws /2Ai ) andsurface is wsCo '
by Aller et ale (1979) and Berner (1980). The mass accumulation rate r, an4sedimentation-velocity are related:
r = p (l-~) ws s
where Ps is the dry sediment density and ~ is the porosity. Mixing byresuspension has not been considered because the resuspension thickness in theMain Basin is only on the order of 1 mm (Lavelle et ale 1984). Boundaryconditions imposed on the solution of (1) are tha~the activity flux of thesurface equals Ws Co and activity at depth is zero. .
The diffusion coefficient, A, was taken to be discontinuous having aconstant value (AI) in an upper bioturbated layer (thickness h) and anegligible value below (A 2 = 0; e.g. Robbins, 1978). This recognizes the factthat a sediment column can have a rapidly mixed surface layer (or layers)where biota are active that overlies a region where mixing is slow or nil(e.g. Robbins and Edgington, 1975). Other diffusivity profiles to simulatethe role and distribution of infauna mixing the sediment have been recentlysuggested (e.g. Peng et al., 1979; Christensen, 1982), but it can be shown (byinserting an exponential-rorm for C in (1) and requiring the solution to theresulting equation for diffusivity (A 2 ) not increase with depth) that datahaving an exponential z-dependence in the second layer (as does this data) canonly support a constant biodiffusivity in that layer. Further that constantmust take a small value (A 2 - 0) because deep in the core little bioturbationcould be expected. Though the transition from the upper layer mixing rate(AI) to a negligible rate (A 2 - 0) must actually occur over a finite interval,our data cannot resolve the apparent rapid transition from one region toanother.
When A takes constant values Al and A2 in the upper and lower layersrespectively, the solution of (1) in steady state subject to a flux (=Ws Co)condition at the surface, zero concentration at depth, and matchingconcentration and flux at the layer interface depth, h, is:
C1 = a 1e(B l + Y1)z + a 2
e(B l - Y1)z O<z<h
e(B 2 - Y2)z(3)
C2 = a 3 z<hwhere:
a 1 = {-2B 1 Co (Y2 Bl - YIB2)e-Ylh}/D
a 2 = {2B 1 Co (y 2B1 + YIB2)e+Ylh}/D
a3
= {4B B Y C e-(B 2 - B1- Y2)h}/D1 2 1 0
D = {(B 1 + Y1 ) (Y2Bl + YIB2)]eYlh - [(B 1 - Y1 ) (Y2 Bl - YIB2)]e-Ylh
~y. = (B~ + ~/A.) , and the flux to the sediment111
Eq. 3 shows that profiles are exponential in depth in the second layerbut the exponential decay length scale (i.e. (B 2- Y2)-I) depends on both w. andA2• Thus, neither can be uniquely determined by a single tracer profile gf
5

data in the second layer though both parameters have limited ranges of valuesbecause both must be positive numbers. When {B 2- Y2)-1 = k and k is large,this equation can be used to show that small changes in A2 away from zerostrongly affect the inferred Ws as Carpenter et al., (1982) numericallyfound. At smaller k values (as in our cases), a small non-zero A2 has muchless effect on the inferred w~. Consequently, for our analyses, A2 was set tozero (e.g., as in Guinasso and Shink, 1975; Carpenter et al., 1985).
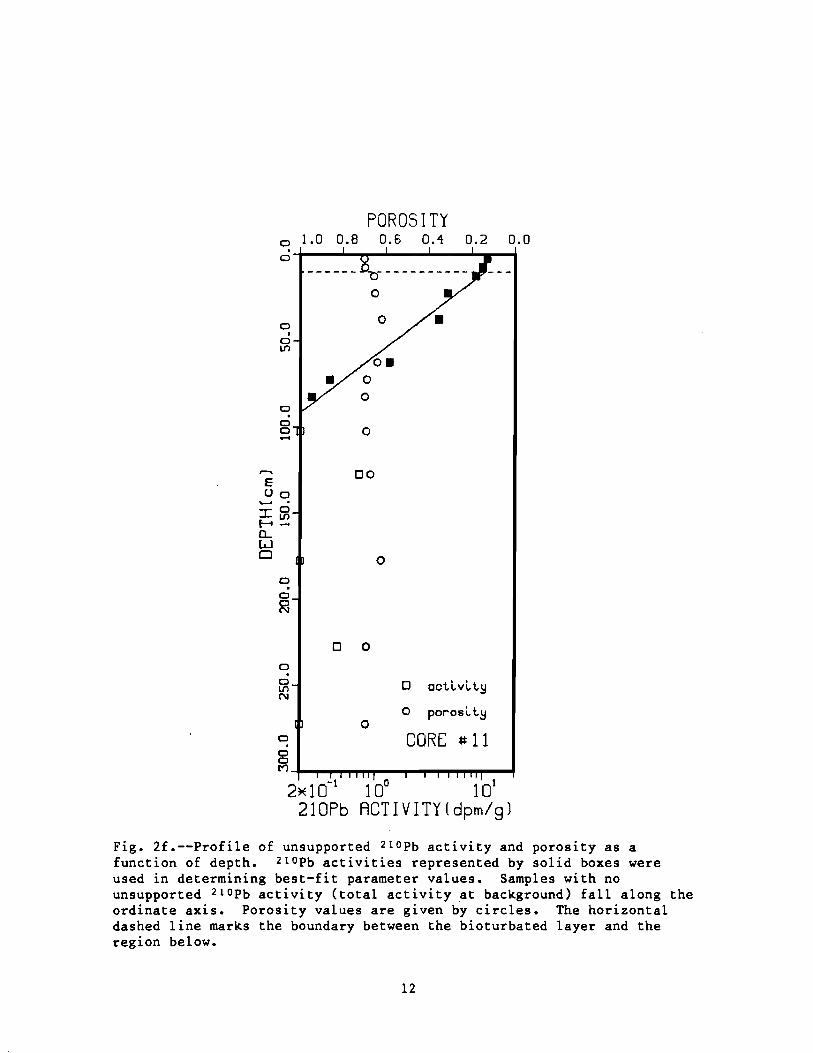
Values for the bioturbated layer depth, h, were determined by noting foreach profile the approximate depth at which the exponential depth dependenceof 2i0Pb activity began (Fig. 2). Values for h ranged from 5 to 40 cm, alarger range than that determined by Carpenter et ale (1985) (4 to 18 cm) forMain Basin cores.
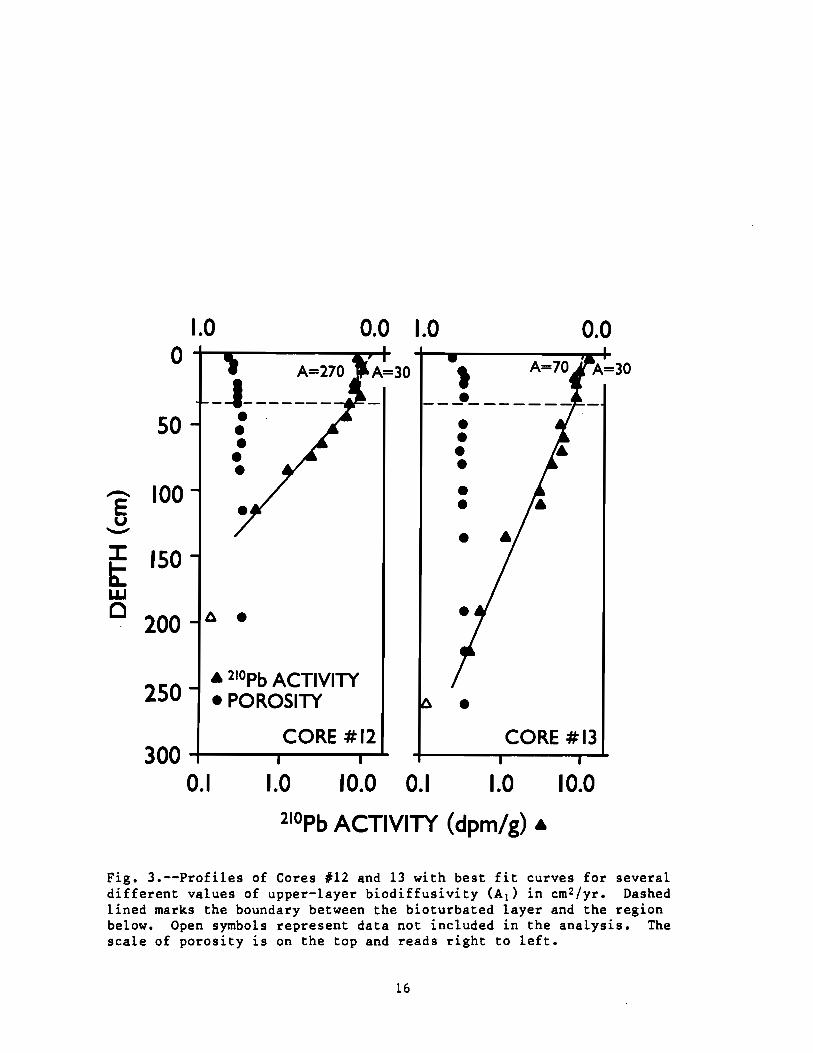
Least-squares fitting of several profiles for Ai' Co (surface activity),and Ws indicated that these profiles poorly determine the value of Ai(contrast Carpenter et al., 1985). This result is alternatively seen in acomparison of profiles for several Ai values in Fig. 3 (as in Robbins (1978)and Peng et ale (1979». For core 112, for example, differences in profilesfor Ai = 30 and 270 cm2/yr are slight; a profile for Ai = 1000 cm2/yr wasindistinguishable from the 270 cm2/yr profile. On the other hand, values muchsmaller that 30 cm2/yr are not warranted by the data. In light of this, formost profiles Ai was given a value of 30 cm2/yr, near the value (34.7 cm2/yr)determined by 23~Th analysis on Core 116 by J. Murray (personal communication,1984). In a few cases (e.g. Core 112, Fig. 3) a larger value of Ai gave aslightly better fit. Finally, the values of Ws are not very sensitive to thevalues given Al (compare results for samples: (12, l2a, l2b); (13, l3a); (15,l5a) in Table 1) so uncertainty in Ai does not impede the deposition rateanalysis. The values of Ws and Co were determined by fitting the two layersolution of (1) to the data and a value for r for each profile was thencalculated (2).
The sensitivity of the inferred sedimentation velocity to the value ofthe supported 2i0Pb activity was investigated for Cores 16, 13, 14, 15 whichhad been given a nominal background of 1 dpm/g. This was done by reassigninga value of 0.5 dpm/g to the background activity. A comparison of best-fitresults for both values of background (Table 1: (6, 6a); (13, l3b); (14,l4a), (15, l5b» show an increase of Ws of approximately 25% for each corewhen the smaller background activity is used.
Sedimentation velocities were converted to mass accumulation rates(Table 1) using mean porosity values as described earlier and a value measuredon representative samples of 2.6 g/cm3 for ps. Confidence limits in Table 1are at the 95% level and were calculated for these non-linear fits in themanner of Jenkins and Watts (1968).
3. RESULTS AND DISCUSSION
Accumulation rates determined in this way range from 0.26 to 1.20gm/cm2/yr (Fig. 1); the rates for axial stations of Carpenter et ale (1985)range from 0.18 to 1.20 gm/cm 2 /yr (Fig. 1). Rates for Cores I~and 17 aresuspect because of the erratic pattern seen in both porosity and 2i0Pb
6

POROSITY POROSITY0 1.0 0.8 0.6 0.4 0.2 0.0 0 1.0 0.8 0.6 0.4 0.2 0.0· ·0 0
---g--------------0
0
0 0 0· ·0 0 0Lf') lrl
0
0
•0 0 0· ·c 0 00 0... ...
0 0---E e
Uo 0 00 0- .I~:::cO
f-I~0
.........0a.... [L
w w0 0
0 00 0· ·.0 0 0 0~
0N
0 0
0 0· ·~ • octLvLt,y 0 • octLvLt,yN 0
~0
0 porosi.t~ 0 porosi.t~
0 CORE ** 1 0 CORE #2· ·0 00 0!"'l M
2~ 10-1 100 101 2*10-1 100 101
210Pb ACTIVITY(dpm/g) 210Pb ACTIVITY(dpm/g)
Fig. 2a.--Profiles of unsupported 210Pb activity and porosity as afunction of depth. 210Pb activities represented by solid boxes wereused in determining best-fit parameter values. Samples with nounsupported 210Pb activity (total activity at background) fall along theordinate axis. Porosity values are given by circles. The horizontaldashed line marks the boundary between the bioturbated layer and theregion below.
7

0.00.2
• octLvL toY
o porosi,t.,y
POROSITY0.6 0.4
o
o
o
o
o·o~
o·oLn
o 1.0 0.8o ...............,......-_..l...._....l.._......1...--l
§--~---------------
oooooooo
o•oo-
o·11lN
EUo
I O
E-t~0Wo
0.00.2
• actLvLt,y
o poros~t.Y
PClROSITY0.6 0."1
o
o
o
o
o
gOo
-------------------ooooooo
•
o·oIf)
o·oF3
o·~N
o·oo-
o 1.0 0.8o-t-~~_--l.._.....l.---tr----1
EUo-.... .
I OE-t~0-Wo
CORE ** 3 CORE #4ooon-4-.....~""""''''''''''_...,.....,....,...,..,.''I''''I''T,....~2~10-1 100 101
210Pb ACTIVITY(dpm/g)
ooon ......-P"..,..I""I""I~I"""""....,_,...,..,.,.,...l"'l""'"---1
2~10-1 100 101
210Pb ACTIVITY(dpm/g)
Fig. 2b.--Profiles of unsupported 210Pb activity and porosity as afunction of depth. 210Pb activities represented by solid boxes wereused in determining best-fit parameter values. Samples with nounsupported 210Pb activity (total activity at background) fall along theordinate axis. Porosity values are given by circles. The horizontaldashed line marks the boundary between the bioturbated layer and theregion below.
8

PDROSITY POROSITY0 1.0 0.8 0.6 0.'4 0.2 0.0 0 1.0 O.B 0.6 0.4 0.2 0.0· ·0 0
~0--------------------
0 0 0
· ·0 0It) Ln
00
00 0 0· ·0 8 00- -
0,..."
E EUo 00 0:Co '-J •
I O
E-t~ E-t~0 •CL CL
W W0 0
00 0· ·0 0 00 ~N
0
0 0· ·0 • octLvLi,Y 0 • aciLvLt,Yan LnN
0N '0 0
0 porosLt,Y 0 porosLt,Y
0 CORE #5 0 CORE #6· ·0 00 0I") t"'l
2~10-1 10° 1012~ 10-1 100 101
210Pb ACTIVITY(dpm/g) 210Pb ACTIVITY(dpm/g)
Fig. 2c.--Profiles of unsupported 210Pb activity and porosity as afunction of depth. 210Pb activities represented by solid boxes wereused in determining best-fit parameter values. Samples with nounsupported 210Pb activity (total activity at background) fall along theordinate axis. Porosity values are given by circles. The horizontaldashed line marks the boundary between the bioturbated layer and theregion below.
9

0.00.2POROSITY
0.6 0.4
o
o
o
o
8o-----0-------------.,----
ooo
oooo
o·oLJ"I
D 1.00.8D
o·ooN
o·oa....
E00
'--':cO~~0....Wo
0.00.2POROSITY
0.6 0.4
o
o
o
oooo
o·olJ")
o·ooN
D 1.0 0.8o-r---ro~'6"'--_..I..-_""""--""""""'''''''
---0----------------oooo
o·oo....
EUo
'-' .:CD£-t~0-Wo
o·olJ")N o
• octt.Vt.t,Y
o poros~t~
a·aLJ"IN o
• octLvt.t,Y
o porost.t,y
CORE ** 7 CORE #8o·oon +...,....,...,..,..,.,.,.I"""'".....,....,...,...,.,..,.,.~~2~10-1 100 101
210Pb ACTIVITYCdpm/g)
ooor"l ~...,....,...,..,..,.,.,.I"""'"__,....,...,...,.""""'~__I
2~10-1 100 101
210Pb ACTIVITY(dpm/g)
Fig. 2d.--Profiles of unsupported 210Pb activity and porosity as afunction of depth. 210Pb activities represented by solid boxes wereused in determining best-fit parameter values. Samples with nounsupported 210Pb activity (total activity at background) fall along theordinate axis. Porosity values are given by circles. The horizontaldashed line marks the boundary between the bioturbated layer and theregion below.
10

POROSITY POROSITY1.0 0.8 0.6 0.4 0.2 0.0 0 1.0 0.8 0.6 0.4 0.2 0.00· ·0
----~----------0
000
oe0 0 0· ·0 0If) If)
0
0
000 [X) 0· ·0 0 00 0..... .....
00
0,.....,0E E
Uo Uo 0...... ......:cO :cO~~ f-f~ 00.... CLLJ W0 0
80 0· ·0 00 0N N
0 0· ·0 • actLv~t.Y0 • octLvLt,yIf) L/'I
N N
0 por06~t..Y 0 poros~t..Y
0 CORE **9 0 CORE #10· ·0 00 0r'l M
2~10-1 100 101
210Pb ACTIVITY(dpm/g)2~10-1 10° 101
210Pb ACTIVITYldpm/g)
Fig. 2e.--Profiles of unsupported 210Pb activity and porosity as afunction of depth. 210Pb activities represented by solid boxes wereused in determining best-fit parameter values. Samples with nounsupported 210Pb activity (total activity at background) fall along theordinate axis. Porosity values are given by circles. The horizontaldashed line marks the boundary between the bioturbated layer and theregion below.
11
0.00.2POROSITY
0.6 0.4
o•o
Lf)
o 1.0 0.8o+-_.L..."""'".....l__....._-~_ ......
0 ·00 0.....
E00
Uo......:cOf---l~0....W0 0
0·0
~
0 0
0·0 0 actLvLt~Lf)N
0 porosa~0
0 CORE ** 11·00M
2~ 10-1 10° 101
210Pb ACTIVITY(dpm/g)
Fig. 2f.--Profile of unsupported 210Pb activity and porosity as afunction of depth. 210Pb activities represented by solid boxes wereused in determining best-fit parameter values. Samples with nounsupported 210Pb activity (total activity at background) fall along theordinate axis. Porosity values are given by circles. The horizontaldashed line marks the boundary between the bioturbated layer and theregion below.
12

0.00.2
o QctLvLt,y
o poro6Ll~
POROSITY0.6 0.'\
o
oo
oooo
8----_Q_------------
o 0 0
o·~N
o·o~
o 1.00.8c:i ............,~_....L..._....L..._....L... ....-i
o·oIf)
o·oo.....
,....E0 0.......
I OE---<~a....Wo
0.00.2POROSITY
0.6 O.i
o
o QctLvLt,y
o poro6Lt~
o
ooo
oo
o 0
----8-------------o·oIf)
o·~N
o·ooN
o 1.0 0.8ci ......_~__oIo-_....._--'...._-;
o·oo.....
EUo....., .
I OE---<~a...Wo
CORE **12 CORE ** 13o·oon 4-...,........"'P"I"'''''''''-...,......,........'''P''I'''''''''''--1
2~10-1 100 101
210Pb ACTIVITY(dpm/g)
o·ool"l-+-...,....,..,...,..,.'I""I"t"-..,.....,..~~"""-_4
2*10-1 10° 101
210Pb ACTIVITYldpm/g)
Fig. 2g.--Profi1es of unsupported 210Pb activity and porosity as afunction of depth. 210Pb activities represented by solid boxes wereused in determining best-fit parameter values. Samples with nounsupported 210Pb activity (total activity at background) fall along theordinate axis. Porosity values are given by circles. The horizontaldashed line marks the boundary between the bioturbated layer and theregion below.
13

2~10-1 100 101210Pb ACTIVITY(dpm/g)
0.0 0 octLvLt,yLI'lN
0 porosLt.!:j
0 00 CORE #1500t"l
2~10-1 100 101
210Pb ACTIVITY(dpm/g)
0.0 0 actLvLt.,yLI'lN
0 porosLt.!:j
0 0 CORE **1400~
Fig. 2h.--Profiles of unsupported 210Pb activity and porosity as afunction of depth. 210Pb activities represented by solid boxes wereused in determining best-fit parameter values. Samples with nounsupported 210Pb activity (total activity at background) fall along theordinate axis. Porosity values are given by circles. The horizontaldashed line marks the boundary between the bioturbated layer and theregion below.
14

POROSITY POROSITY0 1.0 0.8 0.6 O.i 0.2 0.0 0 1.0 0.8 0.6 0.4 0.2 0.0·0 0___0 _______________
0
0 0· 0 ·0 0Lf) Lf)
0
0
0 0· ·0 0 00 0..... .....
E E()o Uo:co ~
:cOr-<~ rt~CL c..W W0 0
0 0 0
· ·0 00 0N C\I 0
0 0
0 0· ·0 0 octLvLt,Y 0 0 octLvLt.YLf) Lf)N N
0 0 poro6i.t.~ 0 poro6Lt.~
0 CORE **16 0 CORE #17· ·0 00 0n n
2~ 10-1 100 101 2~ 10-1 100 101
210Pb ACTIVITY(dpm/g) 210Pb ACTIVITY(dpm/g)
Fig. 2i.--Profiles of unsupported 210Pb activity and porosity as afunction of depth. 210Pb activities represented by solid boxes wereused in determining best-fit parameter values. Samples with nounsupported 210Pb activity (total activity at background) fall along theordinate axis. Porosity values are given by circles. The horizontaldashed line marks the boundary between the bioturbated layer and theregion below.
15
0.0
CORE #13•
•
,--_._------
••••••
0.0 1.0
1.0 10.0 0.1 1.0 10.0
210Pb ACTIVITY (dpm/g) 6
6 210Pb ACTIVITY• POROSITY
CORE #12
A=270
--1-------•••••
250
300 -+-----~--~0.1
1.0o
J: 150two 200 6 •
50
.-. 100Eu
'-'"
Fig. 3.--Profiles of Cores #12 and 13 with best fit curves for severaldifferent values of upper-layer biodiffusivity (AI) in cm 2/yr. Dashedlined marks the boundary between the bioturbated layer and the regionbelow. Open symbols represent data not included in the analysis. Thescale of porosity is on the top and reads right to left.
16

activity down the length of the core. Variability of r over horizontaldistances of tens of meters can be judged from Cores #3, 4, 5 which were takenin succession at a common position relative to a bottom tethered stationmarker. Two of these rates are consistent though the third has a rate 30%larger; bioturbation depths of the two rate-similar stations are 35 and 40 cm,while the third had a bioturbation depth half that value (Table 1). Cores #7and 14, nominally taken at the same site but in different years, have valuesof 0.78 and 1.15 gm/cm 2 /yr.
Comparison of rates from our cores to those of nearby cores of Carpenteret al. (1985) generally show similarity in magnitude, though a distinctexception is found near Core #8 where nearby rates are 0.13 and 0.69gm/cm 2 /yr. The lower of the two rates (Carpenter et al. (1985» is at astation of greater depth (>246 m) than our station-r229 m), and the largedifference in rates probably reflects real lateral rate differences. Thisrate variability was also reflected in our attempt to sample the bottom withina topographic depression about 1 km south of Core 113 that resulted in partialpenetration of the bottom, indicating a zone of small deposition or evenerosion. Small-scale cross-axis changes in sedimentation are also argued fromstable Pb profiles (E. Crecelius, unpublished data) from several acrosschannel transects in the Main Basin. Those consistantly show more than a twofold decrease in the sedimentation rate away from the axis of the channel overdistances of slightly more than 1 km.
In light of this accumulation rate variability, one must be wary ofdrawing too firmly specific conclusions from these data though some generalconclusions seem possible. Accumulation rates en toto appear to be largest inthe central areas near Elliott Bay (Seattle), much lower to the north nearAdmiralty Inlet, and somewhat smaller to the south through East Passage. Thedeclining sedimentation rates to the north coincide with a coarsening of thebottom sediment, a result from the effect of strong bottom currents there(Baker, 1984). The relatively high deposition region off Elliott Bay andslightly to the north have heretofore gone unmeasured, as have the relativelylower deposition rates in East Passage (Cores #1 and 2). These new datachange the overall view that highest accumulation occurs between Seattle andTacoma (Carpenter et al., 1985) to one where highest accumulation occurs offof and to the nort~and south of Elliott Bay and perhaps in the vicinity ofCommencement Bay (Tacoma).
The sources of sediment for deposition in the Main Basin are possiblythree: 1) rivers 2) bluff erosion along the shoreline 3) submarine erosionand slumping of the sidewalls of the Basin (slopes of 20% are common).Atmospheric, biological, and wastewater particulate inputs are small(Carpenter et al., 1985). Little can be said about submarine erosion andslumping because no observations have been made to document its occurrence orimportance.
Riverine inputs are based on sparse upriver sediment flux measurementsfor some rivers and on extrapolations based on guaged flow for the rest(Dexter et al., 1981; Downing, 1983). For example, the sediment yield of theDuwamish is based on daily measurements of vertically integrated sediment fluxover a three year period (1963-66) at Tukwila, Washington (U.S. GeologicalSurvey, 1964-66; Santos and Stoner, 1972). Those yields are overestimates ofsediment available to the Main Basin, however, because many river-borne
17
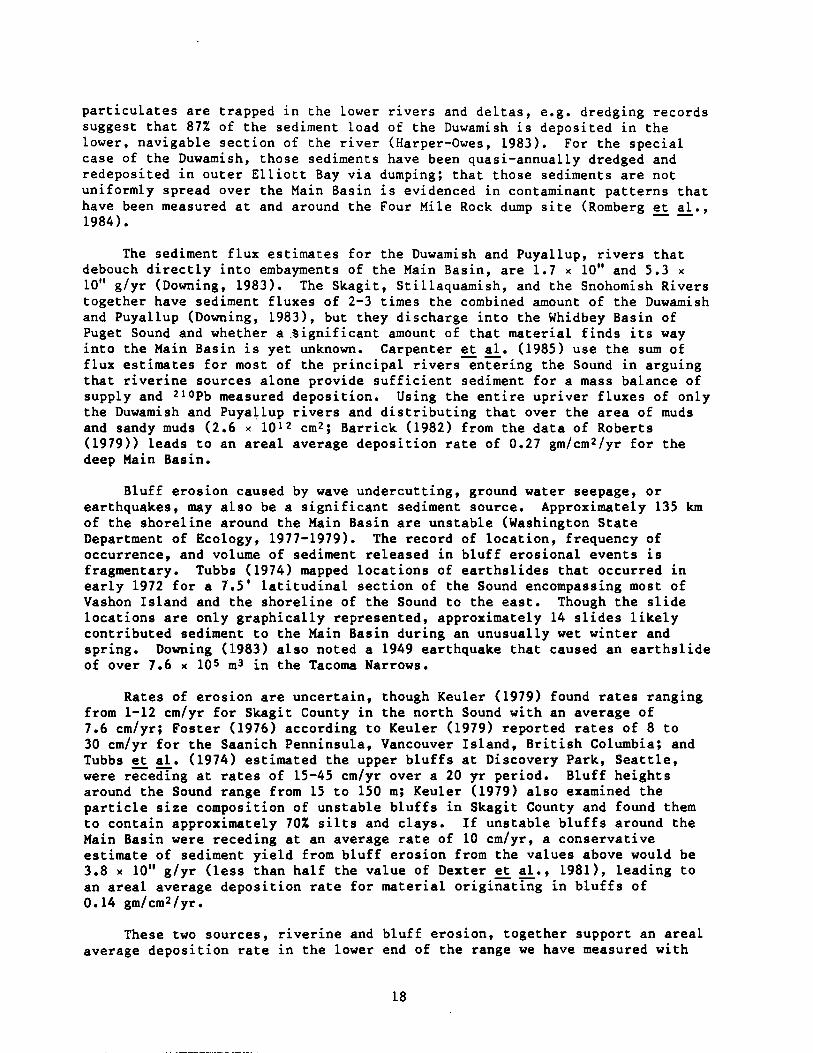
particulates are trapped in the lower rivers and deltas, e.g. dredging recordssuggest that 87% of the sediment load of the Duwamish is deposited in thelower. navigable section of the river (Harper-Owes, 1983). For the specialcase of the Duwamish, those sediments have been quasi-annually dredged andredeposited in outer Elliott Bay via dumping; that those sediments are notuniformly spread over the Main Basin is evidenced in contaminant patterns thathave been measured at and around the Four Mile Rock dump site (Romberg et al.,1984). -
The sediment flux estimates for the Duwamish and Puyallup, rivers thatdebouch directly into embayments of the Main Basin, are 1.7 x 10" and 5.3 x
10" g/yr (Downing, 1983). The Skagit, Stillaquamish, and the Snohomish Riverstogether have sediment fluxes of 2-3 times the combined amount of the Duwamishand Puyallup (Downing, 1983), but they discharge into the Whidbey Basin ofPuget Sound and whether a .§ignificant amount of that material finds its wayinto the Main Basin is yet unknown. Carpenter et al. (1985) use the sum offlux estimates for most of the principal rivers-entering the Sound in arguingthat riverine sources alone provide sufficient sediment for a mass balance ofsupply and 2l0Pb measured deposition. Using the entire upriver fluxes of onlythe Duwamish and Puyallup rivers and distributing that over the area of mudsand sandy muds (2.6 x 10 12 cm2; Barrick (1982) from the data of Roberts(1979» leads to an areal average deposition rate of 0.27 gm/cm 2 /yr for thedeep Main Basin.
Bluff erosion caused by wave undercutting, ground water seepage, orearthquakes, may also be a significant sediment source. Approximately 135 kmof the shoreline around the Main Basin are unstable (Washington StateDepartment of Ecology, 1977-1979). The record of location, frequency ofoccurrence, and volume of sediment released in bluff erosional events isfragmentary. Tubbs (1974) mapped locations of earths1ides that occurred inearly 1972 for a 7.5' latitudinal section of the Sound encompassing most ofVashon Island and the shoreline of the Sound to the east. Though the slidelocations are only graphically represented, approximately 14 slides likelycontributed sediment to the Main Basin during an unusually wet winter andspring. Downing (1983) also noted a 1949 earthquake that caused an earths1ideof over 7.6 ~ 10 5 m3 in the Tacoma Narrows.
Rates of erosion are uncertain, though Keu1er (1979) found rates rangingfrom 1-12 cm/yr for Skagit County in the north Sound with an average of7.6 cm/yr; Foster (1976) according to Keu1er (1979) reported rates of 8 to30 cm/yr for the Saanich Penninsu1a, Vancouver Island, British Columbia; andTubbs et a1. (1974) estimated the upper bluffs at Discovery Park, Seattle,were receding at rates of 15-45 cm/yr over a 20 yr period. Bluff heightsaround the Sound range from 15 to 150 m; Keu1er (1979) also examined theparticle size composition of unstable bluffs in Skagit County and found themto contain approximately 70% silts and clays. If unstable bluffs around theMain Basin were receding at an average rate of 10 cm/yr, a conservativeestimate of sediment yield from bluff erosion from the values above would be3.8 x 10" g/yr (less than half the value of Dexter et a1., 1981), leading toan areal average deposition rate for material originating in bluffs of0.14 gm/cm 2/yr.
These two sources, riverine and bluff erosion, together support an arealaverage deposition rate in the lower end of the range we have measured with
18

210Pb (0.26 - 1.20 gm/cm 2/yr). Because the 210Pb data are from axial stationsand depositions rates are thought to be lower off axis, the true areal averagedeposition rate for fine sediment in the Main Basin that might ultimately comefrom more complete 210Pb measurement coverage could well be expected to have avalue croser to the lower end of the range of our measured 210Pb values. Howthe average deposition would be partitioned among the possible sources ofsediment (rivers, bluff erosion, and submarine erosion and slumping) isunclear because of the numerous uncertainties involved in the supply-sideestimates.
The episodic and localized nature of earthquake triggered landslidesserves to emphasize the interrupted nature, both in space and time, of allshoreline source of sediments. Those slides caused by wave activity are mostlikely to occur during the winter months. Those triggered by seepage are mostlike to occur after the heaviest sustained rains of January through March(Downing, 1983). River sources of sediment also have seasonal and interannualvariability. River runoff in the Duwamish and Puyallup is highest in Decemberfrom rains and in June with snow melt; the sediment yield measured in theDuwamish (Santos and Stoner, 1972) was such that in years with the highest andlowest peak water discharge the sediment flux was twice and only 1/3 the 3year mean value. Submarine erosion and slumping could also be expected to belocalized and episodic. Thus, these combined, time and space-variable sourcesof sediment to the Main Basin ought to lead to a spatially complex and timevariable sedimentation pattern in the Sound. One might expect some reflectionof this in short-lived isotopes, e.g. different sedimentation rates at thesame location at different times within a year or in different years. Thatthe 210Pb profiles presented here are generally consistent with an assumptionof constant sedimentation must be partly the result of the homogenization ofcore sections and partly the result of the efficiency of the mixing processunderway in the sediment column and along the Sound.
4. CONCLUSIONS
Deposition rates of sediments in the Main Basin of Puget Sound can be ashigh as 1.20 gm/cm 2 /yr based on accumulations over the past approximately 70years in cores. These measurements show highest deposition rates occurring inthe central region of the Basin off of and north and south of Elliott Bay.Rates five times lower were observed in lower East Passage. Bioturbated layerdepths can apparently be as large as 35-40 cm; a core shorter than two orthree times that length in some cases may not be adequate to evaluate thesedimentation rate. Bioturbation mixing rates, though poorly determined,appear to be greater than a few tens of cm 2 /yr.
Mass balance calculations point out the need for better resolution ofdeposition patterns and more accurate characterization of source volumes. Thefirst requires cross-axis and other small-scale variability to be furtherexamined. The second requires a number of issues to be addressed: the roleof submarine erosion and slumping; sediment flux to the Main Basin fromWhidbey Basin; trapping of riverine sediment by the lower rivers andembayments; the volume, frequencies, and locations of shoreline blufferosion. The present-day horizon will be deep in sediment cores before theseissues are fully resolved.
19

5. ACKNOWLEDGMENTS
We thank R. Carpenter and many colleagues at the Pacific MarineEnvironmental Laboratory for their constructive comments.
The work has been supported by NOAA Environmental Research Laboratoriesand by the NOAA Office of Oceanography and Marine Services under the LongRange Effects Research Program/Sec. 202.
20

6. REFERENCES
Aller, R.C., L.K. Benninger, and J.K. Cochran, 1980. Tracking particleassociated processes in nearshore environments by use of 23~Th/238U
disequilibrium. Earth Planet. Sci. Lett., 47, 161-175.
Baker, E.T., 1984. Patterns of suspended particle distribution and transportin a large fjord-like estuary, J. Geophys. Res., 89(C4), 6553-6566.
Barrick, R.C., 1982. Flux of aliphatic and polycyclic aromatic hydrocarbonsto central Puget Sound from Seattle (Westpoint) primary sewageeffluent. Environ. Sci. Technol., 16(10), 682-692.
Berner, R.A., 1980. Early diagensis, a theoretical approach. PrincetonUniversity Press, Princeton, 241 pp.
Blank, H.R, Jr., 1950.radium analysis.
Rate of sedimentation in the Skagit Bay Region byM.S. Thesis, University of Washington, 28 pp.
Carpenter, R., M.L. Peterson, and J.T. Bennett, 1982. 210Pb-derived sedimentaccumulation and mixing rates for the Washington Continental Slope,Marine Geology, 48, 135-164.
Carpenter, R., M.L. Peterson, and J.T. Bennett, 1985. 210Pb derived sedimentaccumulation and mixing rates for the Greater Puget Sound Region, MarineGeology, in press.
Christensen, E.R., 1982. A model for radionuclides in sediments influenced bymixing and compaction, J. Geophys. Res., 87, 566-572.
Collias, E.E., N. McGary, and C.A. Barnes, 1974. Atlas of physical andchemical properties of Puget Sound and its approaches. University ofWashington Press, Seattle, WA.
Dexter, R.N., D.E. Anderson, E.A. Quilan, L.S. Goldstein, R.M. Strickland,S.P. Pav1ou, J.R. Clayton, Jr., R.M. Kocan, and M. Landolt, 1981. Asummary of knowledge of Puget Sound related to chemical contaminants.NOAA Technical Memorandum OMPA-13, NOAA, Boulder, Co. 435 pp.
Downing, J.P., 1983. The coast ofPuget Sound, its processes anddevelopment. Puget Sound Books, a Washington State Sea GrantPublication, University of Washington Press, Seattle, 126 pp.
Foster, H.D., 1976. Coastal erosion: a natural hazard of the SaanichPeninsula, Vancouver Island. In H.D. Foster (ed)., Victoria: PhysicalEnvironment and Development, Victoria, B.C., University of Victoria,Dept. of Geography, Western Geophysical Series, 12, 131-184.
Gill, A.E., 1982. Atmosphere-Ocean Dynamics. Academic Press, New York.
Goldberg, E.D. and M. Koide, 1962. Geochronological studies of deep seasediments by the Io/Th method, Geochim. Cosmochim. Acta, 26, 417-450.
Guinasso, N.L. and D.R. Shink, 1975. Quantitative estimates of biologicalmixing in abyssal sediments. J. Geophys. Res., 80, 3032-3034.
21

Harper-Owes, 1983. Water quality assessment of the Duwamish estuary,Washington. Report prepared for Municipality of Metropolitan Seattle(METRO), Seattle, WA, 194 pp + appendices.
Jenkins, G.M. and D.G. Watts, 1968. Spectral analysis and its applications.Holden-Day, San Francisco, 525 pp.
Keuler, R.F., 1979. Coastal zone processes and geomorphology of SkagitCounty, Washington. M.S. Thesis. Western Washington University,Bellingham, WA. 127 pp.
Lavelle, J.W., H.O. Mofjeld, and E.T. Baker, 1984. An in-situ erosion ratefor a fine-grained marine sediment. J. Geophys. Res., 89(C4), 6543-6552.
Lebel, J., N. Silverberg, and G. Sundby, 1982. Gravity core shortening andpore water chemical gradients. Deep Sea Research, 29(11A), 1365-1372.
Link, J.M., 1982. A biochemical study of Pb-210 in Puget Sound. M.S. Thesis,University of Washington, Seattle, 243 pp.
Peng, T.H., W.S. Broeker, and W.H. Berger, 1979. Rates of benthic m1x1ng 1ndeep-sea sediment as determined by radioactive tracers. Quartenary Res.,!!' 141-149.
Robbins, J.A., 1978. Geochemical and geophysical application of radioactivelead. In: J.O. Nriagu (ed)., The Biogeochemistry of Lead in theEnvironment. Elsevier, Amsterdam, 285-393.
Robbins, J.A., and D.N. Edgington, 1975. Determination of recentsedimentation rates in Lake Michigan using Pb-2l0 and Cs-137., Geochim.Cosmochim. Acta, 39, 285-304.
Roberts, R.W., 1979. Sediment distribution maps for Puget Sound.Unpublished. University of Washington, Seattle.
Romberg, G.P., S.P. Pavlou, R.F. Shokes, W. Hom, E.A. Crecelius, P. Hamilton,J.T. Gunn, R.D. Muench, and J. Vinelli, 1984. Toxicant pretreatmentplanning study, technical report Cl: presence, distribution and fate oftoxicants in Puget Sound and Lake Washington, Municipality ofMetropolitan Seattle (METRO), Seattle, WA.
Santos, J.F. and J.D. Stoner, 1972. Physical, chemical, and biologicalaspects of the Duwamish River Estuary, King County, Washington 1963-67.U.S. Geol. Survey Water Supply Paper l873-C, Washington, D.C., 74 pp.
Schell, W.R., 1974. Sedimentation rates and mean residence time of stable Pband Pb-210 in Lake Washington, Puget Sound estuaries and a coastalregion. University of Washington, College of Fisheries, Ecology Lab.,Seattle, Wash., USAEC Rep. RLO-2225-T14-6.
Schell, W.R., and A. Nevissi, 1977. Heavy metals from waste disposed incentral Puget Sound. Environ. Sci. Technol., 11(9), 887-893.
22

Schell, W.R., A. Nevissi, D. Piper, G. Christian, J. Murray, D. Spyradakis, S~
Olsen, D. Huntaner, E. Knudson, D. Zafiropoulos, 1977. Heavy metals nearthe West Point outfall and in the Central Basin of Puget Sound,Municipality of Metropolitan Seattle (METRO), Seattle, WA, 174 pp.
Tubbs, D., 1974. Landslides and associated damage during early 1972 in partof West-central King County, Washington. Miscellaneous InvestigationSeries Map #I-852-B. U.S. Geological Survey, Washington, D.C.
Tubbs, D., T. Dunne, and R. Sternberg, 1974. Discovery Park inventory andnatural history report (Earth Services component). Institute forEnvironmental Studies Rept., University of Washington, Seattle, WA,p. 15-46.
U.S. Geological Survey, 1964-1966. Quality of the surface waters of theUnited States. Geological Survey Water Supply Papers 1959, 1966 and1996. U.S. Government Printing Office, Washington, D.C.
Washington State Department of Ecology, 1977-1979. The coastal zone atlas ofWashington, v. 1-12. State of Washington, Olympia, WA.
23
Appendix I: Salt Correction Calculations
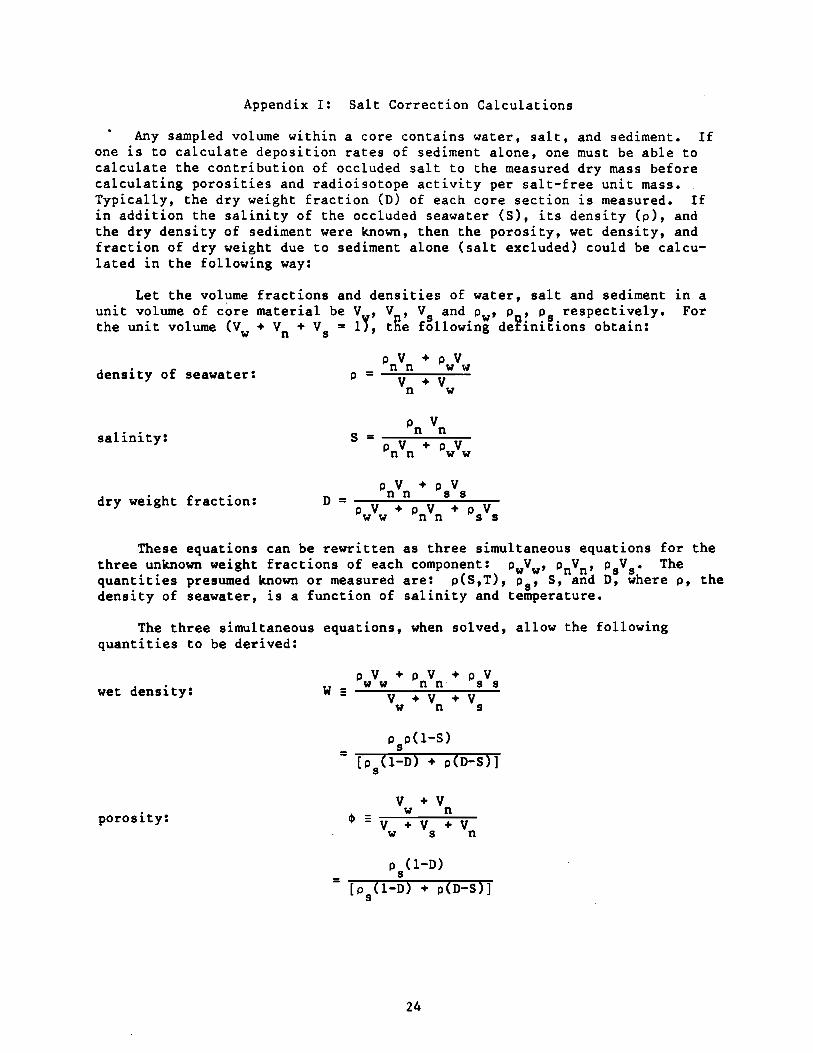
Any sampled volume within a core contains water, salt, and sediment. Ifone is to calculate deposition rates of sediment alone, one must be able tocalculate the contribution of occluded salt to the measured dry mass beforecalculating porosities and radioisotope activity per salt-free unit mass.Typically, the dry weight fraction (D) of each core section is measured. Ifin addition the salinity of the occluded seawater (S), its density (p), andthe dry density of sediment were known, then the porosity, wet density, andfraction of dry weight due to sediment alone (salt excluded) could be calculated in the following way:
Let the volumeunit volume of corethe unit volume (Vw
fractions and densities of water, salt and sedimentmaterial be VV' VR' VS and Pw' P~' Ps respectively.+ Vn + Vs = lJ, t e following de initions obtain:
in aFor
density of seawater: P =
salinity:
dry weight fraction: D =P V + P Vn n s s
P V + P V + P Vw w n n s s
These equations can be rewritten as three simultaneous equations for thethree unknown weight fractions of each component: PwVw' pnVn ' PsVs • Thequant1t1es presumed known or measured are: p(8,T), Ps' S, and D, where P, thedensity of seawater, is a function of salinity and temperature.
The three simultaneous equations, when solved, allow the followingquantities to be derived:
wet density: w _ PwVw + PnVn + PsVsV + V + Vw n s
P p(1-S)s
porosity:
= [p (l-D) + p(D-S)]s
V + Vell w n
- Vw + Vs
+ Vn
p (1-D)s= [p (l-D) + p(D-S)]
s
24

weight corrector:o V
s sFc - p V + p V
n n s s
=(D-S)
[D(l-S)]
The measured dry weight 0 can be multiplied by F to get the salt-free dryweight of sediment for normalization of activityCmeasurements. The porositymust also be calculated before mass accumulation rate calculations can bemade.
In the present context, values of temperature of 11°C and a salinity of30%0, corresponding to typical bottom water conditions in Puget Sound(Collias et a1., 1974), were used in the equation of state (Gill, 1982) toderive a val~ of p = 1.0229 g/cm3 • Sediment density, as measured onrepresentative samples, was 2.6 g/cm 3 and the salinity fraction wasS = 0.030. Salt-free porosity and 210Pb activity per unit mass of salt-freesediment were calculated for each core section using these values and themeasured dry weight (Appendix II).
25

Appendix II: Data Tables
26

CORE-1DATE: March 1984 LAT: 47°21.9' N LONG: 122°22.0' W
Depth Percent Total 210Pb Activity Porosity Unsupported 210PbDry Weight (dpm/g, salt-free) (dpm/g, salt-free)
0- 2 30.0 9.12±0.28 0.871 8.404- 6 33.0 7. 54±0 .22 0.853 6.829- 11 35.3 7.50±0.34 0.839 6.78
14- 16 36.0 7.68±0.23 0.835 6.9619- 21 33.1 6.01±0.23 0.853 5.2929- 31 33.6 4.80±0.25 0.877 4.0837- 41 35.1 4.19±0.17 0.840 3.4749- 51 37.4 2.03±0.15 0.826 1.3159- 61 35.8 2.02±0.14 0.836 1.3069- 71 36.3 1.52±0.09 0.833 0.8079- 81 36.0 1.06±0.07 0.835 0.3489- 91 36.6 0.77±0.09 0.83199-101 35.6 0.85±0.07 0.837
119-121 38.8 0.66±0.06 0.817139-141 37.9 0.64±0.05 0.823159-161 38.6 0.62±0.06 0.818179-181 36.7 0.75±0.08 0.830199-201 35.7 0.71±0.08 0.837219-221 40.2 0.70±0.06 0.807259-261 38.6 0.86±0.09 0.818
27

CORE-2DATE: March 1984
Depth PercentDry Weight
Total 210Pb Activity(dpm/g, salt-free)
Porosity Unsupported 210Pb(dpm/g, salt-free)
0- 2 30.0 9.90±0.28 0.871 9.184- 6 33.5 8.30±0.27 0.850 7.589- 11 34.4 8.75±0.32 0.845 8.03
14- 16 32.5 7.60±0.22 0.856 6.8819- 21 34.9 7.32±0.28 0.842 6.6029- 31 32.9 7.53±0.32 0.853 6.8139- 41 36.0 5.15±0.16 0.835 4.4349- 51 35.3 4.09±0.19 0.839 3.3759- 61 41.4 1.53±0.13 0.799 0.8169- 71 40.7 1.47±0.12 0.804 0.7579- 81 38.4 0.99±0.09 0.819 0.2789- 91 38.7 0.95±0.09 0.817 0.2399-101 39.9 0.86±0.09 0.809
119-121 38.2 0.68±0.06 0.821139-141 37.9 0.67±0.08 0.823159-161 39.1 0.89±0.07 '0.815179-181 41.6 0.65±0.08 0.761199-201 40.9 0.57±0.08 0.802219-221 41.6 0.89±0.09 0.798259-261 43.2 0.57±0.08 0.786
28

CORE-3DATE: March 1984 LAT: 47°25.6' N LONG: 122°23.5' W
Depth Percent Total 210Pb Activity Porosity Unsupported 210PbDry Weight (dpm/g, salt-free) (dpm/g, salt-free)
0- 2 31.2 9.5 7±0 .28 0.864 8.634- 6 33.8 9.60±0.30 0.848 8.669- 11 35.5 9.89±0.28 0.838 8.95
14- 16 31.8 9.21±0.33 0.860 8.2719- 21 31.6 9 .87±0 .32 0.862 8.9329- 31 33.3 8.25±0.26 0.852 7.3139- 41 36.7 8.58±0.26 0.830 7.6449- 51 32.7 7.05±0.24 0.855 6.1159- 61 36.0 5.64±0.21 0.835 4.7069- 71 35.7 5.04±0.19 0.837 4.1079- 81 38.0 4.74±0.22 0.822 3.8089- 91 38.0 3.58±0.16 0.822 2.6499-101 40.6 3.14±0.16 0.805 2.20
119-121 35.9 2.88±0.12 0.835 1.94139-141 40.1 1. 98±0.13 0.808 1.04159-161 41.0 1. 53±0. 09 0.802 0.59179-181 37.8 1. 18±0 .11 0.823 0.24199-201 38.4 0.87±0.09 0.819219-221 39.8 1.02±0.07 0.810259-261 39.0 0.94±0.07 0.815
29

CORE-4DATE: March 1984 LAT: 47°25.6' N LONG: 122°23.5' W
Depth Percent Total 210Pb Activity Porosity Unsupported 210PbDry Weight (dpm/g, salt-free) (dpm/g, salt-free)
0- 2 29.1 10.61±0.31 0.876 9.644- 6 34.1 9.86±0.25 0.847 8.899- 11 33.9 l1.44±0.34 0.848 10.47
14- 16 33.7 8.85±0.24 0.849 7.8819- 21 32.2 9.36±0.22 0.858 8.3929- 31 33.6 8.60±0.28 0.850 7.6339- 41 35.6 7.31±0.27 0.837 6.3449- 51 36.0 6.77±0.23 0.835 5.8059- 61 35.5 5.30±0.22 0.837 4.3369- 71 37.6 5.09±0.22 0.825 4.1279- 81 39.9 4.36±0.18 0.809 3.3989- 91 37.6 4.21±0.17 0.825 3.2499-101 37.2 4.95±0.21 0.827 3.98
119-121 38.3 2.26±0.12 0.820 1.29139-141 36.7 2.56±0.17 0.830 1.59159-161 40.9 1. 70±0.11 0.802 0.73179-181 37.7 1.55±0.11 0.824 0.58199-201 38.8 0.94±0.07 0.817219-221 39.1 0.98±0.12 0.815259-261 37.6 0.99±0.07 0.825
30

CORE-SDATE: March 1984 LAT: 47°25.6' N LONG: 122°23.5' W
Depth Percent Total 210Pb Activity Porosity Unsupported 210PbDry Weight (dpm/g, salt-free) (dpm/g, salt-free)
0- 2 3L4 10.04±0.31 0.863 9.224- 6 32.8 9.71±0.32 0.855 8.899- 11 3L2 8.64±0.29 0.864 7.82
14- 16 33.5 8.36±0.27 0.850 7.5419- 21 32.6 7.69±0.29 0.856 6.8729- 31 35.6 6.10±0.27 0.837 5.2839- 41 34.6 7.83±0.25 0.843 7.0149- 51 34.4 6.68±0.21 0.845 5.8659- 61 35.0 4.83±0.25 0.841 4.01.69- 71 37.4 5.48±0.20 0.826 4.6679- 81 * 2.98±0.19 * 2.1689- 91 37.9 3.04±0.12 0.823 2.2299-101 35.8 3.03±0.14 0.836 2.21
119-121 40.5 L87±0.13 0.805 LOS139-141 40.0 L43±0 .11 0.808 0.61159-161 37.9 L36±0.11 0.823 0.54179-181 39.1 LOO±0.10 0.815 0.18199-201 38.6 L09±0.10 0.818 0.27219-221 36.6 0.77±0.10 0.831259-261 37.6 0.86±0.09 0.825
31

CORE-6DATE: March 1984 LAT: 47°31.6' N LONG: 122°25.4' W
Depth Percent Total 210Pb Activity Porosity Unsupported 210PbDry Weight (dpm/g, salt-free) (dpm/g, salt-free)
0- 2 30.6 11.28±0.42 0.867 10.284- 6 35.2 11. 76±0.40 0.840 10.769- 11 35.5 10.19±0.29 0.838 9.19
14- 16 36.3 9.48±0.27 0.833 8.4819- 21 35.8 9.86±0.30 0.836 8.8629- 31 37.2 10.42±0.26 0.827 9.4239- 41 37.5 8.85±0.27 0.825 7.8559- 61 37.5 8.11±0.16 0.825 7.1169- 71 38.1 7.39±0.23 0.821 6.3979- 81 36.7 7.82±0.35 0.830 6.8289- 91 36.0 5.89±0.36 0.835 4.8999-101 39.1 6.17±0.21 0.815 5.17
119-121 38.0 4.97±0.25 0.822 3.97139-141 40.2 4.29±0.17 0.807 3.29159-161 39.3 4.53±0.23 0.813 3.53179-181 41.0 3.28±0.17 0.801 2.28199-201 40.6 2.74±0.13 0.805 1.74219-221 41.3 1.85±0.16 0.801 0.85259-261 42.4 1.27±0.11 0.792 0.27
32
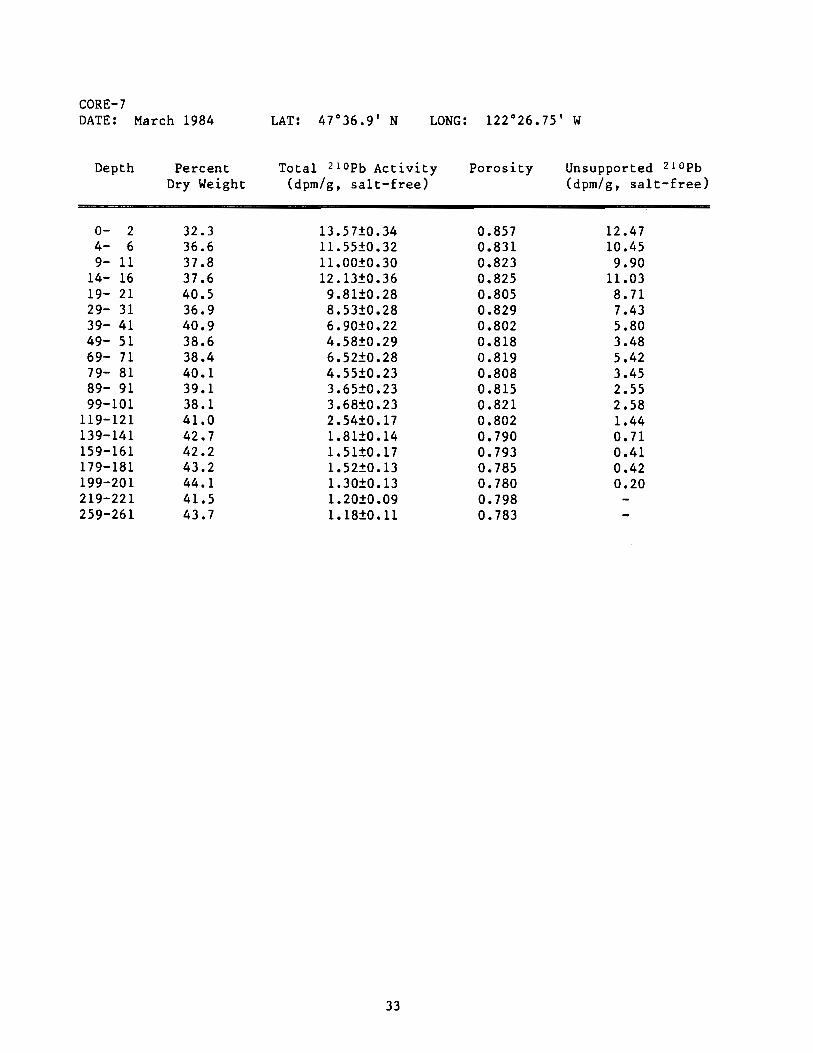
CORE-7DATE: March 1984 LAT: 47°36.9' N LONG: 122°26.75' W
Depth Percent Total 210Pb Activity Porosity Unsupported 210PbDry Weight (dpm/g, salt-free) (dpm/g, salt-free)
0- 2 32.3 13.5 7±0. 34 0.857 12.474- 6 36.6 11.55!0.32 0.831 10.459- 11 37.8 11.00!0.30 0.823 9.90
14- 16 37.6 12.13!0.36 0.825 11.0319- 21 40.5 9.81!0.28 0.805 8.7129- 31 36.9 8.53!0.28 0.829 7.4339- 41 40.9 6.90!0.22 0.802 5.8049- 51 38.6 4.58!0.29 0.818 3.4869- 71 38.4 6.52!0.28 0.819 5.4279- 81 40.1 4.55!0.23 0.808 3.4589- 91 39.1 3.65!0.23 0.815 2.5599-101 38.1 3.68!0.23 0.821 2.58
119-121 41.0 2.54!0.17 0.802 1.44139-141 42.7 1.81!0.14 0.790 0.71159-161 42.2 1.51!0.17 0.793 0.41179-181 43.2 1.52!0.13 0.785 0.42199-201 44.1 1.30!0.13 0.780 0.20219-221 41.5 1.20!0.09 0.798259-261 43.7 1. 18!0 .11 0.783
33

CORE-8DATE: March 1984 LONG: 122°27.9' W
Depth PercentDry Weight
Total 210Pb Activity(dpm/g, salt-free)
Porosity Unsupported 210Pb(dpm/g, salt-free)
0- 2 36.2 11. 09±0. 39 0.833 10.224- 6 38.2 9.88±0.33 0.821 9.019- 11 42.0 10.19±0.27 0.795 9.32
14- 16 42.0 10.93±0.30 0.795 10.0619- 21 42.3 9.21±0.25 0.793 8.3429- 31 45.1 8.18±0.39 0.772 7.3139- 41 41.1 7.28±0.25 0.801 6.4149- 51 42.6 6.23±0.24 0.790 5.3659- 61 42.7 6.20±0.27 0.790 5.3369- 71 39.3 6.84±0.27 0.813 5.9779- 81 43.8 3.00±0.17 0.782 2.1389- 91 43.4 3.06±0.24 0.785 2.1999-101 44.4 2.69±0.17 0.778 1.82
119-121 43.3 1.69±0.14 0.785 0.82139-141 46.3 1.24±0.12 0.767 0.37159-161 45.3 1.13±0.12 0.771 0.26179-181 45.7 0.94±0.10 0.768199-201 47.2 0.99±0.12 0.757219-221 46.3 0.92±0 .11 0.763259-261 45.8 0.64±0.09 0.767
34

CORE-9DATE: August 1982 LONG: 122°23.55' W
Depth PercentDry Weight
Total 210Pb Activity(dpm/g, salt-free)
Porosity Unsupported 210Pb(dpm/g, salt-free)
4- 6 44.3 6.15±0.22 0.778 5.617- 8 45.0 5.48±0.26 0.773 4.949- 11 46.4 5.77±0.24 0.763 5.23
14- 16 45.3 4.54±0.24 0.771 4.0019- 21 47.0 4.15±0.22 0.758 3.6124- 24 53.2 2.79±0.13 0.707 .2.2529- 31 53.8 1.97±0.13 0.702 1.4332- 34 52.2 1.85±0.10 0.716 1.3135- 38 48.4 2.74±0.15 0.747 2.2039- 41 55.9 1.74±0.1l 0.683 1.2049- 51 54.4 1. 36±0.11 0.696 0.8259- 61 49.9 1.88±0.12 0.735 1.3469- 71 60.3 0.45±0.06 0.64079- 81 54.6 1.65±0.12 0.695 1.1189- 91 56.6 1.29±0 .11 0.676 0.7599-101 67.6 0.56±0.08 0.559
109-111 66.6 0.54±0.08 0.571119-121 68.2 0.57±0.08 0.552129-131 67.8 0.48±0.08 0.557
35
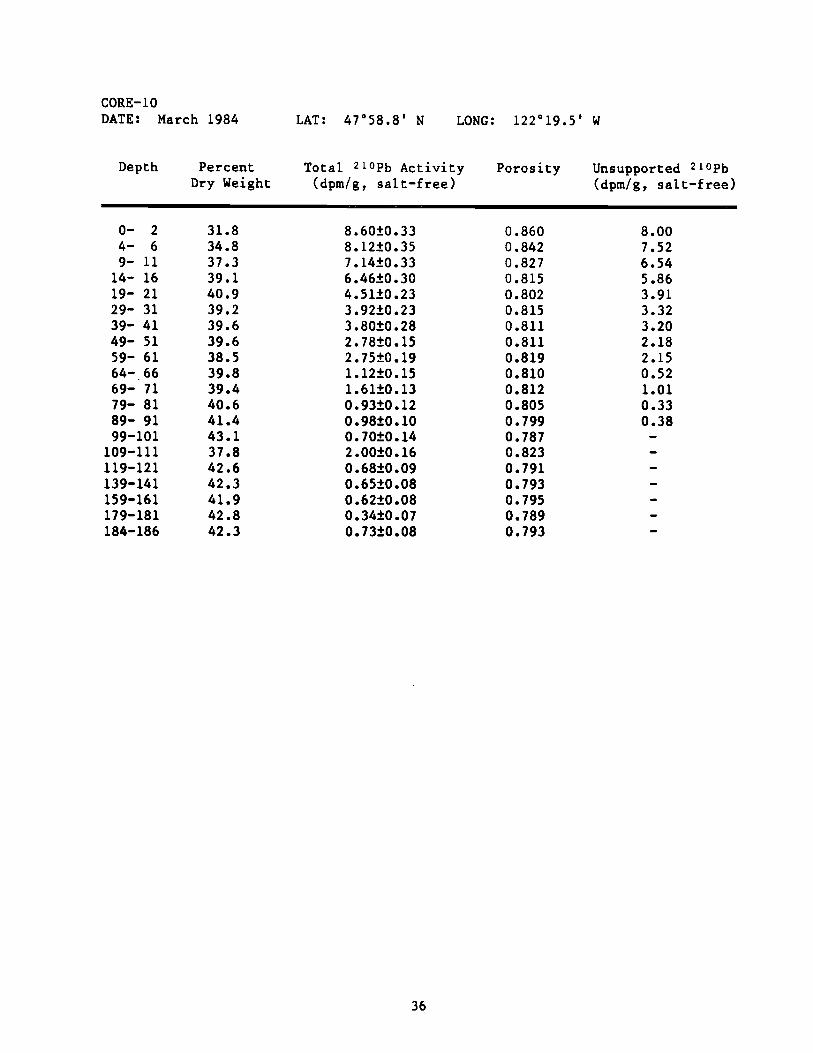
CORE-10DATE: March 1984 LAT: 47°58.8' N LONG: 122°19.5' W
Depth PercentDry Weight
Total 210Pb Activity(dpm/g, salt-free)
Porosity Unsupported 210Pb(dpm/g, salt-free)
0- 2 31.8 8.60tO.33 0.860 8.004- 6 34.8 8.12fO.35 0.842 7.529- 11 37.3 7.14fO.33 0.827 6.54
14- 16 39.1 6.46tO.30 0.815 5.8619- 21 40.9 4.51tO.23 0.802 3.9129- 31 39.2 3.92fO.23 0.815 3.3239- 41 39.6 3.80fO.28 0.811 3.2049- 51 39.6 2.78tO.15 0.811 2.1859- 61 38.5 2.75tO.19 0.819 2.1564-.66 39.8 1. 12fO .15 0.810 0.5269- 71 39.4 1.6l±0.13 0.812 1.0179- 81 40.6 0.93fO.12 0.805 0.3389- 91 41.4 0.98fO.l0 0.799 0.3899-101 43.1 0.70fO.14 0.787
109-111 37.8 2.00fO.16 0.823119-121 42.6 0.68fO.09 0.791139-141 42.3 0.65fO.08 0.793159-161 41.9 0.62fO.08 0.795179-181 42.8 0.34fO.07 0.789184-186 42.3 0.73±0.08 0.793
36

CORE-IIDATE: August 1982 LONG: 122°25.8' W
Depth PercentDry Weight
Total 210Pb Activity(dpm/g, salt-free)
Porosity Unsupported 210Pb(dpm/g, salt-free)
o- S 53.5 11. 99±0 .48 0.701 10.985- 10 53.8 1l.00±0.44 0.698 9.99
10- 15 58.4 9.69±0.39 0.657 8.6820- 25 58.9 5.73±0.34 0.652 4.7235- 40 62.1 4.93±0.35 0.620 3.9260- 65 60.0 2.37±0.26 0.641 1.3670- 75 54.9 1. 39±0 .25 0.689 0.3880- 85 53.8 1.26±0.33 0.698 0.25
100-105 54.6 1.00±0.30 0.691125-130 56.8 1. 72±0.33 0.672175-180 61.9 0.92±0.27 0.622225-230 54.8 1.46±0.25 0.689270-275 54.7 1.13±0.29 0.691
37

CORE-12DATE: August 1982
Depth PercentDry Weight
Total 210Pb Activity(dpm/g, salt-free)
Porosity Unsupported 210Pb(dpm/g, salt-free)
o- S 33.7 10.65±0.37 0.846 9.845- 10 38.5 11. 70±0 .40 0.815 10.89
15- 20 37.6 12.51±0.53 0.821 11. 7020- 25 41.3 9.89±0.36 0.796 9.0825- 30 41.4 9.62±0.44 0.795 8.8130- 35 41.6 11.44±0.36 0.794 10.6335- 40 41.3 8.59±0.38 0.796 7. 7845- 50 45.0 8.15±0.41 0.769 7.3455- 60 42.9 5.79±0.24 0.785 4.9865- 70 44.3 4.55±0.28 0.775 3.7475- 80 40.7 3.63±0.22 0.800 2.8285- 90 43.2 2.34±0.14 0.783 1.53
115-120 45.5 1.56±0.14 0.766 0.75135-140 45.3 0.66±0.16 0.767155-160 44.1 0.61±0.13 0.776195-200 45.3 1.18±0.18 0.767225-230 46.7 0.77±0.13 0.756
38

CORE-13DATE: August 1982 LAT: 47 D42.3' N LONG: 122 D26.4' W
Depth Percent Total 210Pb Activity Porosity Unsupported 210PbDry Weight (dpm/g, salt-free) (dpm/g, salt-free)
O- S 36.2 14.46±0.70 0.830 13.4610- 15 43.9 11.09±0 .45 0.777 10.0915- 20 46.4 9.79±0.46 0.759 8.7920- 25 45.1 10.11±0.55 0.769 9.1130- 35 45.6 10.13±0 .65 0.765 9.1350- 55 45.0 6.85±0.37 0.769 5.8560- 65 44.2 7.35±0.50 0.775 6.3570- 75 42.6 7.13±0.28 0.787 6.1380- 85 43.9 5.64±0.27 0.777 4.64
100-105 44.9 4.23±0.22 0.770 3.23110-115 44.8 4.33±0.29 0.771 3.33135-140 45.9 2.27±0.42 0.763 1.27195-200 46.5 1.62±0 .41 0.758 0.62220-225 47.9 1.45±0 .36 0.747 0.45260-264 46.7 0.87±0.18 0.756260-264 * 1.38±0 .30 *260-264 * 1. 24±0 .19 *
39

CORE-14DATE: August 1982 LAT: 47°36.9' N LONG: 122°26.8' W
Depth Percent Total 210Pb Activity Porosity Unsupported 210PbDry Weight (dpm/g, salt-free) (dpm/g, salt-free)
5- 10 33.5 12.65±0.51 0.847 11.6515- 20 36.1 12.35±0.49 0.831 11.3525- 30 40.6 10.95±0.33 0.801 9.9545- 50 39.8 9.47±0.38 0.806 8.4765- 70 39.8 7.60±0.61 0.806 6.6075- 80 41.5 7.62±0.61 0.795 6.6295-100 39.2 5.28±0.74 0.811 4.28
135-140 44.2 3.02±0.33 0.775 2.02195-200 42.8 1.28±0.40 0.785 0.28235-240 43.4 1.54±0.32 0.781 0.54275-280 41.8 0.94±0.36 0.793
40

CORE-ISDATE: August 1982
Depth PercentDry Weight
Total 210Pb Activity(dpm/g, salt-free)
Porosity Unsupported 210Pb(dpm/g, salt-free)
5- 10 32.7 12.74±0.38 0.852 11. 7415- 20 33.6 10.72±0.32 0.847 9.7225- 30 31.3 10.45±0.31 0.861 9.4535- 40 33.4 11.20±0.45 0.848 10.2055- 60 36.3 8.05±0.32 0.830 7.0565- 70 35.9 6.76±0.34 0.832 5.7675- 80 36.4 5.32±0.32 0.829 4.32
115-120 36.9 3.61±0.32 0.826 2.61175-180 38.8 2.30±0.30 0.813 1.30225-230 40.5 1. 62±0 .24 0.802 0.62275-280 40.3 1.62±0 .24 0.803 0.62
41

CORE-16DATE: August 1982 LONG: 122°24.4' W
Depth PercentDry Weight
Total 210Pb Activity(dpm/g, salt-free)
Porosity Unsupported 210Pb(dpm/g, salt-free)
0- 5 31.0 9.89±0.40 0.863 8.555- 10 34.3 9.50±0.38 0.842 8.16
25- 30 34.3 8.00±0.48 0.842 6.6645- 50 34.8 5.64±0.34 0.839 4.3065- 70 39.1 4.38±0.35 0.811 3.0475- 80 40.1 2.84±0.31 0.804 1.5095-100 39.0 2.85±0.60 0.812 1.51
135-140 37.7 1.60±0.27 0.821 0.26225-230 41.4 1.31±0.22 0.795265-270 60.3 1.49±0.22 0.638300-305 41.2 1.25±0.30 0.797
42

CORE-17DATE: August 1982 LAT: 47°18.7' N LONG: 122°27.7' W
Depth Percent Total 210Pb Activity Porosity Unsupported 210PbDry Weight (dpm/g, salt-free) (dpm/g, salt-free)
O- S 37.3 4.21±0.23 0.823 3.5915- 20 49.8 4.02±0.13 0.732 3.4015- 20 * 3.55±0.13 0.732 2.9325- 30 49.7 3.21±0.16 0.733 2.5935- 40 56.2 1.71±0.13 0.677 1.0945- 50 49.9 2.42±0.60 0.731 1.8055- 60 59.8 1. 48±0 .20 0.643 0.8675- 80 64.0 0.68±0.06 0.60095-100 52.8 1.69±0.10 0.706 1.07
105-110 56.0 1.l3±0.13 0.679 0.51125-130 59.0 1.09±0.13 0.651 0.47135-140 59.2 0.56±0.09 0.649155-160 64.5 0.71±0.07 0.595185-190 62.0 0.72±0.22 0.621205-210 62.0 0.57±0.10 0.621225-230 63.1 0.53±0.10 0.610
43