draft final report evaluation of 2017 demand...
TRANSCRIPT

DRAFT FINAL REPORT
Evaluation of 2017 Demand Response Demonstration: C&I Connected Solutions National Grid and the Energy Efficiency Advisory Council
Date: February 23, 2018

DNV GL – www.dnvgl.com February 23, 2018 Page i
Table of contents
1 EXECUTIVE SUMMARY ..................................................................................................... 1
2 DEMONSTRATION OVERVIEW AND STUDY OBJECTIVES ....................................................... 6
3 STUDY METHODS ........................................................................................................... 8
3.1 Impact Methods 8
3.2 Process Methods 10
4 RESULTS ..................................................................................................................... 12
4.1 Customer Characteristics 12
4.2 Impact Results 13 4.2.1 Event Curtailment Confirmation 13 4.2.2 Event Curtailment with Adjusted Baseline and Regression Results 17 4.2.3 Baseline Analysis 21
4.3 Process Results 28 4.3.1 Communication and Coordination Among Demonstration Implementers 28 4.3.2 Demonstration Information 29 4.3.3 Marketing and Outreach 31 4.3.4 Demonstration Enrollment 36 4.3.5 Load Curtailment 38 4.3.6 Financial Incentives 42 4.3.7 Overall Demonstration Satisfaction 43 4.3.8 Scalability 44 4.3.9 Impacts on ISO-NE DR Programs 45 4.3.10 Suggested Recommendations for Demonstration Improvements 46
5 CONCLUSIONS, RECOMMENDATIONS AND CONSIDERATIONS ............................................ 48
5.1 Conclusions 48 5.1.1 Impact Conclusions 48 5.1.2 Process Conclusions 50
5.2 Recommendations and Considerations 51 5.2.1 Recommendations 51 5.2.2 Considerations 52
LOAD CURTAILMENT DETAILS BY PARTICIPANT ...................................................... A-1 APPENDIX A.
SURVEY AND INTERVIEW RECOMMENDATION DETAILS ........................................... B-1 APPENDIX B.
PARTICIPATING CUSTOMER INTERVIEW GUIDE ...................................................... C-1 APPENDIX C.
CURTAILMENT SERVICE PROVIDER INTERVIEW GUIDE ............................................ D-1 APPENDIX D.
List of figures Figure 1: Process Data Collection Summary ....................................................................................... 11 Figure 2: Average Load across Sites .................................................................................................. 12 Figure 3: Aggregate Daily Load Shapes for Sites with Negative Reads ................................................... 13 Figure 4: Summary of Committed Capacity Achieved .......................................................................... 15
DNV GL – www.dnvgl.com February 23, 2018 Page ii
Figure 5: Scatterplot of Committed vs Actual Reduction (kW) ............................................................... 16 Figure 6: Aggregate Event Curtailment .............................................................................................. 18 Figure 7: Example Customer A, July 20, 2017 Event ........................................................................... 20 Figure 8: Example Customer A, August 22, 2017 Event ....................................................................... 20 Figure 9: Example Customer B, August 22, 2017 Event ....................................................................... 21 Figure 10: Aggregate Baselines on Top 9 Non-Event High System Load Days ......................................... 22 Figure 11: Demonstration-Level Relative Baseline Error, Top 9 Summer, Non-Event High System Load Days* .................................................................................................................................................... 23 Figure 12: Relative Baseline Error Box Plots, Site-Level for Top 9 Non-Event Peak Dates ......................... 26 Figure 13: Root Mean Square Relative Error (RMSRE), Site-Level for Top 9 Non-Event Peak Days ............. 27 Figure 14: Participant Motivations for Demonstration Enrollment .......................................................... 33 Figure 15: Reported Enrollment Process ............................................................................................ 37 Figure 16: Load Curtailment Activities Reported by Participants ............................................................ 39 Figure 17: Summary of Participant Curtailment Experiences ................................................................. 41 Figure 18: Summary of Suggested Demonstration Improvements ......................................................... 46 Figure 19: CSP and Participant Demonstration Satisfaction .................................................................. 51
List of tables Table 1: Summary of Capacity Committed by NAICS ............................................................................. 1 Table 2: Summary of Committed Capacity by NAICS ............................................................................ 6 Table 3: Aggregate Event Curtailment for Thursday, July 20th, 2017..................................................... 14 Table 4: Aggregate Event Curtailment for Tuesday, August 22nd, 2017 ................................................. 14 Table 5: Rate of Adjusted versus Unadjusted Baseline Use ................................................................... 15 Table 6: Aggregate Event Curtailment for Thursday, July 20th, 2017 with Regression ............................. 17 Table 7: Aggregate Event Curtailment for Tuesday, August 22nd, 2017 with Regression .......................... 17

DNV GL – www.dnvgl.com February 23, 2018 Page 1
1 EXECUTIVE SUMMARY
DNV GL evaluated National Grid’s Connected Solutions Commercial and Industrial Demand Response
demonstration activity over the summer of 2017. The Connected Solutions demonstration is a two year
demonstration project for demand response available to Massachusetts C&I customers on a G2 (General
Service, Demand) or G3 (Time of Use) rate with demand of 250 kW or higher that are able to curtail at least
50kW of summer demand with day ahead notice. National Grid has selected three curtailment service
providers (CSPs) to sign up customers and identify demand response and demand management
opportunities. National Grid administers the demonstration and uses an AutoGrid system to dispatch
notification, aggregate data, and complete the settlement process. Table 1 summarizes enrolled
participating accounts by NAICS code, including their committed capacity that totals just over 20 MW. The
committed capacity is that which the CSP and customer have determined to be reasonable based on a
reduction plan developed together. Payments are based on performance and there are no penalties for non-
performance.
Table 1: Summary of Capacity Committed by NAICS
NAICS Classification Number of Accounts
Committed Capacity (MW)
Percent of Total
Manufacturing 28 10.82 52.5%
Educational Services 31 6.36 30.8%
Retail Trade 31 1.48 7.2%
Health Care 2 0.80 3.9%
Transportation and Warehousing 2 0.75 3.6%
Professional, Scientific, and Technical Svcs 1 0.25 1.2%
Department Store 3 0.12 0.6%
Wholesale Trade 1 0.04 0.2%
Total 99 20.61 100.0%
This study had both impact and process research activities. While there were many objectives pursued
within each of these broad efforts, the bullets below summarize the two primary purposes of the study:
Impact: To provide verification of the proper baseline application and impacts calculated by the
AutoGrid system, examine the effectiveness of the Connected Solution baseline, and assess ex-post
impacts.
Process: To understand customer acceptance and experience with the intervention, readiness of
systems for larger deployment, and PA and vendor success in delivery
The impact methods undertaken in this study included three primary activities. These are summarized
below and include developing an AutoGrid connection and acquiring data, performing a baseline analysis,
and carrying out an ex-post regression analysis.

DNV GL – www.dnvgl.com February 23, 2018 Page 2
Study Impact Evaluation Methods
AUTOGRID SYSTEM REVIEW
AND DATA ACQUISITION
BASELINE ANALYSIS
EX POST ANALYSIS
II III
DNV GL worked with AutoGrid to
establish a system connection and gathered consumption data from National Grid to support the analysis. Three data deliveries were received, including an estimate of curtailment from the AutoGrid system.
Validation of the AutoGrid curtailment
estimates were performed using the 10 of 10 unadjusted baseline.
DNV GL performed an assessment of
the effectiveness of a range of alternative baselines, including those used by ISO-NE and CAISO (10 of 10), ERCOT (mid 8 of 10) and PJM (high 4 of 5).
This analysis included unadjusted,
scalar adjusted and additive
adjusted versions.
DNV GL performed a site-level,
regression based analysis including schedule and weather independent variables.
These results offer a retrospective
assessment of the summer's curtailments for each customer and the program in aggregate.
I
Study Process Evaluation Methods
The process methods undertaken in this study included four primary activities. We reviewed demonstration
materials, interviewed the National Grid demonstration manager and three vendors, and surveyed 13
participants.

DNV GL – www.dnvgl.com February 23, 2018 Page 3
Connected Solutions is a two-year demonstration that aims to enroll 40 MW of demand response by the end of 2018.
National Grid enrolled 99 accounts in 2017, representing more than 20 MW of committed curtailable load.
C o n c lu s io n s
Impact Evaluation Highlights
The committed enrolled capacity of the demonstration was 20.6 MW. The reduction calculated by the hybrid baseline used by National Grid and verified in this study produced curtailment estimates of 14.5 and 15.9 MW for the two events. A regression analysis performed on participants provided impact estimates of 12.3 and 12.8 MW for each event.
The nature of the hybrid baseline offers a generous, low risk baseline for customers that carries an aggregate impact that is higher than reductions based on an adjusted or unadjusted 10 of 10 baseline individually, as well as the regression load reduction estimate.
The combination of achieving less than committed curtailment despite a baseline that has increased potential for upward bias has implications for the demonstration as it evolves. In the absence of penalties for non-performance, incentive changes may be necessary to better align committed and achieved reductions. Left unchanged, this combination can be expected to put pressure on cost-effectiveness.
Demonstration Delivery OpportunitiesDemonstration
Satisfaction
Participants are very satisfied with the demonstration: average
satisfaction ratings were above 4 (out of a 1-5 scale) in all demonstration
elements
CSPs were less satisfied with the demonstration; average satisfaction
ratings were in the 3-3.8-point range.
Demonstration Improvement Opportunities
Evaluators found that Connected Solutions is a well-designed demonstration that is developing a qualified contractor network and helping C&I customers control peak demand.
The demonstration has a good general design with areas that performed very well. Participants received customized services that fit their unique opportunities. Planned curtailment included a diverse set of end uses and systems.
With a few minor exceptions, participant respondents indicated that they curtailed load when asked to do so. There were only a few incidents of employee complaints or disruptions of business operations.
Collaboration and communication between National Grid and the CSPs was very good. CSPs appreciated that National Grid staff were open to "on-the-fly tweaks" of demonstration design and delivery.
Participants were very satisfied with the Connected Solutions demonstration, though these results are based upon surveys performed prior to participant receipt of incentives.
The impact evaluation analyzed demonstration impacts–an estimate of curtailed
load–and assessed the baseline methods used to estimate curtailed load.
There were delays in providing CSPs and participants with event performance data, which also delayed participant payment.
The demonstration missed the system's peak, which occurred in June when the demonstration was still in its early stages. This prevented some participants the benefit of an ICAP reduction.
Demonstration information could better describe several program elements including when events might be called, the possibility of events being cancelled, how customers would be paid and for how much, and participation benefits.
Though there were other issues observed in our study that we regard as reasonable given the short time frame to launch a first-year effort. These include:
o CSPs indicated that they considered demonstration incentives to be low and that
they might inhibit National Grid’s ability to grow the demonstration. The demonstration missed the peak day this summer (June 13), resulting in no reduction of future ICAP payments.
o The enrollment process, while well established and understood, was noted to
have a very specific format for uploaded data that is difficult to adhere to.
o Guidance and expectations to track marketing leads and sales pipeline were not
clear or effective, resulting in incomplete or outdated information on customers and their status in the recruitment funnel.
1
2
3
4
5

DNV GL – www.dnvgl.com February 23, 2018 Page 4
DNV GL offers the following recommendations and considerations to improve Connected Solutions’ 2018
demonstration offering. Connected Solutions customers, in aggregate, did not deliver the committed load
reduction in the 2017 season. This needs to be recognized both from a system operations perspective and
from a cost-effectiveness perspective. It is common for there to be a rule of thumb derating process for
demand reduction for internal program use or system operations personnel. Demonstration incentive
adjustments may also spur curtailment performance to bring it in line with capacity commitments. We also
acknowledge that this is a new demonstration, and delivered load reduction may improve. However, the
challenge of assessing the relationship between demonstration activity and actual system demand relief is a
defining part of demand reduction offerings. This issue drives the first recommendation provided below.
DNV GL notes that some of these activities may already be underway as part of National Grid's ongoing
efforts to improve the demonstration.
Recommendations
1. Given the divergence between delivered load reduction and committed capacity at the customer level,
National Grid should develop a way to manage this shortfall. We recommend that National Grid either
recognize this underperformance as part of establishing a planning assumption that reflects the
difference between the reduction committed versus achieved, or consider an adjustment to the incentive
structure to bring performance and committed capacity into closer alignment.
2. We recommend examining the root cause(s) that prevented prediction of the system peak.
Understanding this cause will enable corrections to be made before the 2018 summer season.
3. We recommend improvements to data availability for AutoGrid to calculate and provide event
performance values to customers and vendors to confirm their performance level and as a touchpoint to
foster further demonstration engagement.
4. We recommend revising demonstration supporting information to better describe how customers will be
paid, the level of incentive they can expect, the possibility of events being cancelled or not allowing
cancellations, and the (potential) ancillary benefits of participation such as ICAP tag reduction.
5. We recommend revising the process for uploading data needed as part of the enrollment process to
make it more flexible and easier for CSP data submissions.
6. We recommend working with CSPs to develop a more effective system to support demonstration
management needs in terms of tracking marketing leads and the sales pipeline.
7. Recognizing that we were unable to ask participants about satisfaction with their incentive payments due
to evaluation timing, we recommend that National Grid or the vendors inquire with participants about
the sufficiency of their final 2017 incentive payments. Alternatively, DNV GL can ask about them as part
of the 2018 season evaluation, though incentive receipt would have occurred roughly 11 months prior, if
gathered this way.
Considerations 1. Consider beginning demonstration recruitment and marketing early to allow more marketing, customer
education and systematic enrollment effort than experienced in 2017. Given demonstration complexity,
we believe a longer “runway” will help support participation levels and ease of recruitment.
2. Consider holding a pre-season webinar for enrolled participants and CSPs that reviews demonstration
operations (e.g., how and what the event notifications look like, how incentives are calculated and
provided, demonstration criteria for scheduling and cancelling events etc.), in addition to reviewing the
roles and responsibilities of National Grid, AutoGrid, and the CSPs.

DNV GL – www.dnvgl.com February 23, 2018 Page 5
3. All demand response programs struggle with the correct balance between capacity type incentives to
stimulate general participation and performance payments, perhaps including penalties, intended to get
customers motivated to perform for a specific event. In a new initiative, such as Connected Solutions,
the priority of enrolling customers has an effect on that balance. But as long term demonstration design
is considered, the movement toward a performance payment is sometimes necessary to ensure the
long-term viability of the demonstration. We recommend that National Grid monitor the balance
between capacity and performance payments as the demonstration evolves to ensure they are suitable
to achieve the end goals of the demonstration.
4. Consider the balance between customer convenience and load reduction estimation accuracy as it
pertains to time of notification. Day ahead notification provides customer convenience, while event day
notification will support a more accurate settlement baseline. This consideration may inform how you
deal with the observed challenge in the 2017 season of calling off day ahead notifications and being able
to cancel day of. National Grid could also consider offering a same day notification option, perhaps with
its own incentive structure, which would limit opportunities for strategic load shifting.
5. In the 2017 summer season participants were offered two incentive payment options. One was to
receive the incentive directly based upon their performance while the other was to have the incentive
paid to the CSP based on the aggregate performance of a group of participants. National Grid should
consider simplifying or choosing a single incentive payment option for participants.
6. Consider discussions with ISO-NE regarding sharing event information. The concerns related to event
days in the baseline affects them as well. The baseline used for ISO-NE emergency events would benefit
from dropping active event days in the Connected Solutions Demonstration.
DNV GL – www.dnvgl.com February 23, 2018 Page 6
2 DEMONSTRATION OVERVIEW AND STUDY OBJECTIVES
During the summer of 2017, National Grid deployed a C&I Demand Reduction Demonstration called C&I
Connected Solutions. Customers with interval meters on G-3 rates, or G-2 rates that upgraded to an
interval meter, with demand of 250 kW or higher and the ability to curtail 50 kW were eligible for the
demonstration. The demonstration is a two year effort with a goal to enroll 40 MW of demand response
curtailable load by the end of 2018. Ninety nine accounts participated in the demonstration in 2017,
representing over 20 MW of committed curtailable load. Payment is based strictly on performance without
penalties for non-performance.
National Grid considered various baselines to determine the curtailment performance of participants. A 10
of 10 baseline approach without adjustments was initially planned for the demonstration, however a hybrid
additive adjusted baseline and unadjusted baseline was ultimately used. This baseline used the higher
curtailment provided by the two baseline techniques as the basis for performance payments. The 10 of 10
baseline is an average for each interval across the 10 most recent days that are eligible for inclusion in the
baseline. This baseline adjusts to the load prior to the event to which they are being applied.
Three approved curtailment service providers (IPKeys, CPower, and EnerNOC) marketed and sold the
demonstration along with National Grid’s commericial salesforce . These recruitment activities included
visiting customer sites, explaining the demonstration offering and helping identify curtailable loads and
strategies. Events are called the day before curtailment is needed. All events start after 11 am, end before
5 pm and are no longer than 4 hours. The goal of the demonstration is to call fewer than 20 event hours
per year, though no more than 40 event hours will be called. In the summer of 2017, two curtailments were
implemented through an AutoGrid demand response managment system (DRMS) that dispatched
notification, aggregated demand data, and completed the settlement process. The first was held on July
20th and the second on August 22nd.
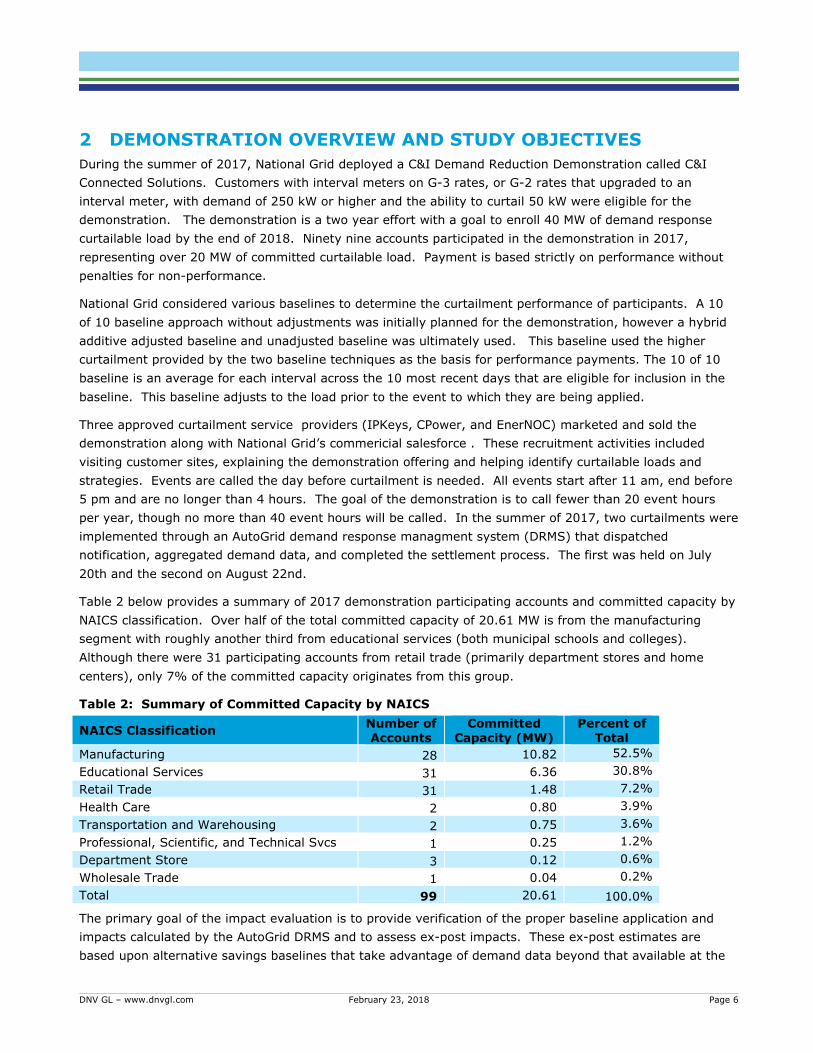
Table 2 below provides a summary of 2017 demonstration participating accounts and committed capacity by
NAICS classification. Over half of the total committed capacity of 20.61 MW is from the manufacturing
segment with roughly another third from educational services (both municipal schools and colleges).
Although there were 31 participating accounts from retail trade (primarily department stores and home
centers), only 7% of the committed capacity originates from this group.
Table 2: Summary of Committed Capacity by NAICS
NAICS Classification Number of Accounts
Committed Capacity (MW)
Percent of Total
Manufacturing 28 10.82 52.5%
Educational Services 31 6.36 30.8%
Retail Trade 31 1.48 7.2%
Health Care 2 0.80 3.9%
Transportation and Warehousing 2 0.75 3.6%
Professional, Scientific, and Technical Svcs 1 0.25 1.2%
Department Store 3 0.12 0.6%
Wholesale Trade 1 0.04 0.2%
Total 99 20.61 100.0%
The primary goal of the impact evaluation is to provide verification of the proper baseline application and
impacts calculated by the AutoGrid DRMS and to assess ex-post impacts. These ex-post estimates are
based upon alternative savings baselines that take advantage of demand data beyond that available at the

DNV GL – www.dnvgl.com February 23, 2018 Page 7
time of the event itself. There are three core research
questions that will be answered as part of the impact study:
1. What are the load reduction effects the system will
experience based on different load reduction
estimation approaches?
2. What is the load reduction that ISO-NE would
recognize?
3. Will ISO-NE baselines provide a reasonable estimate
of load reduction in general (i.e., is it a valid baseline
based on an examination of other available baselines)?
The objective of the process evaluation is to understand
customer acceptance and experience with the equipment and intervention, assess the readiness of the
demonstration and systems for larger deployment, and National Grid and vendor success in delivery.
Participant surveys and vendor interviews will be performed to inform these objectives. National Grid has
also identified very specific key process issues they would
like examined within the higher-level themes above. These
include:
4. Is there customer fatigue that sets in as events
are called over time?
5. How well is the open market (three-vendor) model
working as opposed to a single vendor model?
6. Are the incentives offered by National Grid
sufficient? Are participants “stacking” all of the
revenue streams available (FCM Revenue, ICAP,
demand charges) as a way to make their
curtailment as valuable as possible? If so, what
role does the demonstration provided DR incentive
play in the overall benefit to the customer?
The primary goal of the process evaluation is to understand customer
acceptance and experience with the equipment and
intervention, readiness of systems for larger
deployment, and PA and vendor success in delivery.
The primary goal of the impact evaluation is to
provide verification of the proper baseline
application and impacts calculated by the
AutoGrid DRMS and to assess ex-post impacts.
DNV GL – www.dnvgl.com February 23, 2018 Page 8
3 STUDY METHODS
This study included impact and process evaluation elements. Both efforts were necessary to fully assess the
success of the demonstration, how well its design worked, and to determine its preparedness for broader
deployment. We discuss the methods for both study pieces in this section.
3.1 Impact Methods
There were four tasks in the impact work performed. These were to establish an AutoGrid connection to
become familiar with the system and acquire data, verify demonstration demand reduction calculations,
perform a baseline analysis, and complete an ex-post regression analysis.
ESTABLISH AUTOGRID CONNECTION AND ACQUIRE DATA
AutoGrid DRMS is the solution National Grid uses to dispatch event notification, aggregate demand data, and
complete the settlement process (i.e., calculate impacts). DNV GL opened an evaluator account with
AutoGrid to get access to the system. We became familiar with the system, how events are tracked, and
the data available. We ultimately received the demand data for the impact analysis directly from National
Grid and not the AutoGrid system.
DNV GL received three deliveries of participant interval data from National Grid; one in September, one in
October and a final dataset in January. The January dataset included the final AutoGrid event curtailment
estimates for each customer for the two events held.
VALIDATION OF AUTOGRID LOAD REDUCTION ESTIMATES
As a validation work stage, we compared the AutoGrid curtailment estimates to our estimates of reduction
based on using the same baseline that participants are paid upon (a hybrid additive adjusted and
unadjusted 10 of 10). This baseline provides the customer with the higher curtailment amount calculated
from the additive adjusted 10 of 10 approach or the unadjusted 10 of 10 approach with a practical
maximum load reduction equal to the max load in the prior 3 days. We refer to this approach as the hybrid
approach. The goal was to validate AutoGrid’s use of the baseline calculation method and assure the
replicability of the demonstration process.
PERFORM BASELINE ANALYSIS
The baseline analysis provides a general assessment of the effectiveness of a range of baselines on the
Connected Solution population. For this demonstration, National Grid opted to use the above referenced
hybrid baseline method. The 10 of 10 baseline with adjustment, which served as part of the National Grid
baseline approach, is widely used by Independent System Operators (ISOs).1 Other baselines include
different selections of days (mid 8 of 10, high 4 of 6) with and without adjustment. Because baselines
simply serve as rudimentary rolling forecast algorithms for un-curtailed load during a curtailment event,
their effectiveness is a function of customer load characteristics, weather and other factors.
The baseline analysis uses historical data without events to test baselines for each hour as if it were going to
be an event. Because the load during that hour is, in fact, not curtailed, the difference between the baseline
load and the actual, un-curtailed load represents the error of the baseline prediction.
1 ISO-NE adjusts the 10 of 10 additively. CAISO adjusts the 10 of 10 with a scalar adjustment with a cap.

DNV GL – www.dnvgl.com February 23, 2018 Page 9
Baseline errors can be aggregated in various ways to quantify the bias and variability of a baseline that will
be part of any estimate of curtailment during an actual event. It is useful to produce the metric separately
by hour to see how baseline effectiveness varies across the event hours. Similarly, for an effort that is
attempting to curtail on the system peak day, it is useful to aggregate hours across a subset of days with
typical peak load conditions. As peak system load is typically coincident with hot temperatures in New
England, we focused on baseline performance under these conditions.
Baseline errors are characterized with two metrics:
Normalized mean baseline error.
Normalized variance2
The normalized mean baseline error indicates whether there is a systematic bias to the baseline algorithm.
Under different circumstances, certain baselines will, on average, over-or under-estimate load. The
variability metric indicates the variability of the error, or how far above or below actual load the baseline can
be on any given day.
Our analysis focused on these metrics because they are particularly useful for comparing the effectiveness of
different baseline algorithms. The C&I Connected Solutions Demonstration used the before mentioned
hybrid baseline. In our analysis, we compared this baseline to others used by Independent system
operators around the country. This list included:
10 of 10 (ISONE, CAISO)
Mid 8 of 10 (ERCOT3)
High 4 of 5 (PJM)
MBMA (Meter before, meter after, a flat baseline set at the level of the prescribed pre-activation
interval, used for balancing by most Independent System Operators and Regional Transmission
Operators in North America.
The first three of these baselines examined, in their official format for the respective ISOs, are adjusted on
the day of the event with either a scalar or additive adjustment. We compared these 10 baseline versions
(3 versions of the first three -- unadjusted, scalar adjusted and additive adjusted, and MBMA which is flat
and implicitly adjusted) to see how they perform for participants under expected demonstration conditions.
The three baselines in study have a x of y definition (10 of 10, mid 8 of 10, and high 4 of 5).
A rolling baseline is a methodology for estimating load on a given day by constructing a pool of the most
recent y eligible days occurring prior to the day being estimated. Eligible days are days that are considered
to be similar to the day for which load is being estimated. As event days only occurred on weekdays for the
Connected Solutions demonstration, all non-holiday, weekdays are eligible for a baseline pool, whereas
Saturdays and Sundays are not eligible. In addition, event days and other days deemed not eligible by
program rules are also not included. When x = y (i.e. 10 of 10), the rolling baseline is constructed by
averaging load across all days in the baseline pool, for each interval. When x does not equal y (i.e. High 4 of
2 There are a number a metrics used to capture the variability of an estimate: Coefficient of Variation – root mean squared error (CV(RMSE)),
normalized mean absolute error, etc. We can be flexible to the needs of stakeholders regarding which metric is used but there are advantages to a normalized variance metric
3 Electric Reliability Council of Texas
DNV GL – www.dnvgl.com February 23, 2018 Page 10
5), the pool of y days is ranked in terms of load during a critical period (for this study, the critical period was
equal to potential event hours 11 AM – 5 PM) and x days are selected from the pool based upon the ranking
and selection criterion (low, mid, high). For a High 4 of 5, the 4 days ranked highest in terms of load during
the hours 11 AM – 5 PM are selected for the baseline. The baseline is then constructed by averaged load
across the x days, for each interval. For a Mid 8 of 10, the lowest and highest ranked days are dropped from
the pool of 10 eligible days and the baseline is constructed by averaging across the 8 selected days, for each
interval.
PERFORM EX-POST ANALYSIS
This report also includes a site-level, regression-based estimate of load reduction that functions as an Ex-
post impact analysis result. This site-level, regression-based estimate of load reduction provides a
comprehensive view of load curtailment across the summer for each customer and the demonstration in
aggregate. Because the customer-level regressions have access to all data for the season and explicitly
control for weather and schedule effects, the results offer an assessment of the summer’s curtailments that
are in contrast to the rolling, settlement-type baseline results. The regression-based approach can control
for weather without a same day adjustment thus avoiding the potential shortcomings associated with a
same day adjustment. Another advantage of the regression approach is that, for weather-correlated loads,
it facilitates ex-ante predictions of curtailments under a range of conditions.4
DNV GL used a regression specification that includes schedule and weather independent variables. This
approach to parameterizing the hourly models recognizes the diversity of industry practice but applies a
coherent, econometrically sound logic to the choice of specific structure. The model includes different 24-
hour loadshapes for each day of the week as well as a weather trend across weekdays. The site-level
models were run across a range of degree day bases and the optimal model selected. We tested for the
inclusion of other weather variables but found limited evidence these additions improved the performance of
most of the site-level models.
The site-level model results are reported for the two even periods and are also included, for comparison’s
sake in the baseline analysis.
3.2 Process Methods
DNV GL based the process findings on in-depth interviews with 17 demonstration stakeholders, including
National Grid staff, representatives of all three CSPs, and participating customers. We completed the
National Grid and CSP interviews in the September-October period and the participant interviews in October.
Figure 1 summarizes the topics addressed across the three groups surveyed/interveiwed. The CSP interview
guide can be found in Appendix D.
Due to the small participant population for this demonstration, we did not do a sample design but rather
attempted to complete interviews with the whole population (i.e., a census). DNV GL called each participatnt
at least three times and did not encounter any refusals. Participant interviews were stopped after 13
completes to allow time for analysis and reporting. The 13 participants that we interviewed included eight
industrial customers, two office building participants (including one city government), two schools, and one
warehouse. All the participants surveyed owned the buildings except the warehouse, which leased its space.
The participant survey can be found in Appendix C.
4 While the loads taking part in the program are less likely to be weather-correlated, such loads represent a particular challenge to rolling, settlement-
type baselines so it is important to have evaluation approaches that are flexible to weather.

DNV GL – www.dnvgl.com February 23, 2018 Page 11
Figure 1: Process Data Collection Summary

DNV GL – www.dnvgl.com February 23, 2018 Page 12
4 RESULTS
This section provides impact and process results as separate sections. This is followed by a section on
overall conclusions and recommendations that draw from the findings of each series of results.
4.1 Customer Characteristics
The Connected Solutions Demonstration attracted 99 participating accounts. DNV GL received load data for
all participants for analysis. The Load data reveals basic characteristics of the participant population. Figure
2 summarizes the average load for sites received and used in this analysis. The bars present the average
hourly load for summer period data that was received. The green bars represent customers with no
negative load values. The blue bars indicate a site with negative load values which we interpret as evidence
of on-site generation. The population includes two sites that have significantly higher load than the others,
with an average demand of 11.5 and 6.5 MW. All but 11 of the sites have an average demand less than 1
MW.
Figure 2: Average Load across Sites
The evidence of on-site generation may be important for a couple of reasons. First, demonstration rules
indicated that demand response supported by on-site fossil-fuel generation was not eligible. To the extent
that on-site generation can be present at a site, it may be necessary to clarify or adjust rules to assure that
on-site generation is not, in fact, supporting the load curtailment. Second, sites with on-site generation may
not be well-served by standard DR baselines. ISO-NE baselines for DR assets with on-site generation
require incorporation of the metered generation into the baseline calculation process.

DNV GL – www.dnvgl.com February 23, 2018 Page 13
Figure 3 shows the average load shapes for the sites that we identified as likely having onsite generation.
Each site shown had at least one negative interval read during 2016/17. Two of the sites on average have
negative loads during the middle of the day (presumably due to peak solar PV production).
Figure 3: Aggregate Daily Load Shapes for Sites with Negative Reads
4.2 Impact Results
There are four sections in the impact results. These are the verification of the curtailment results calculated
by National Grid using the hybrid baseline, reduction results observed when using other common baselines
from across the country, a baseline analysis that examines the potential for baseline error, and a regression
based ex post analysis.
4.2.1 Event Curtailment Confirmation
During the summer of 2017, National Grid’s demand response demonstration, C&I Connected Solutions,
called two successful curtailment events. The first event occurred on Thursday, July 20th, the other on
Tuesday, August 22nd. Both events began at 2 P.M. and continued until 5 P.M, with a total event duration of
three hours.
This section validates event demand reduction estimates provided by National Grid.5 For the validation, DNV
GL applied the hybrid baseline approach that National Grid applied in their calculations for settlement
purposes. This baseline provides the customer with the higher curtailment amount calculated from the
5 After the first draft of this report National Grid provided new analysis data and their calculations of load reduction based on those data. These data
were more complete than the data used for the prior analysis.

DNV GL – www.dnvgl.com February 23, 2018 Page 14
additive adjusted 10 of 10 approach or the unadjusted 10 of 10 approach. National Grid also has a
calculation condition that limits the curtailment to the maximum load of the customer in the preceding three
days, although there were no occurrences of this adjustment for these events. The adjustment period for
the adjusted baseline is the two hours starting before the three hours of the event.
Table 3 and Table 4 contain the actual load (MW), committed capacity, and reduction estimates for the
hybrid baseline approach employed, across participants for each event hour of the first and second event,
respectively, and total across all three hours. We also include the committed capacity of the participants in
the third column. DNV GL was able to replicate National Grid’s load reduction estimates for both events, as
evidenced in the mean hourly aggregate row. The hour to hour estimates from AutoGrid are averaged
across them while the DNV GL estimates are calculated for each specific hour.
Table 3: Aggregate Event Curtailment for Thursday, July 20th, 2017
Hour Load (MW)
Capacity Commitment
(MW)
Reduction DNV GL
Reduction AutoGrid
MW % MW %
15 61.0 20.6 15.1 24.7% 14.5 23.7%
16 60.1 20.6 14.6 24.3% 14.5 24.1%
17 59.6 20.6 13.7 23.0% 14.5 24.3%
Mean Hourly (Aggregate) 60.2 20.6 14.5 24.0% 14.5 24.0%
Mean Hourly Per Site 0.62 0.21 0.15 24.0% 0.15 24.0%
Table 4: Aggregate Event Curtailment for Tuesday, August 22nd, 2017
Hour Load (MW)
Capacity Commitment
(MW)
Reduction DNV GL
Reduction AutoGrid
MW % MW %
15 59.7 20.6 16.0 26.8% 15.9 26.7%
16 57.8 20.6 16.6 28.7% 15.9 27.5%
17 57.7 20.6 15.2 26.3% 15.9 27.6%
Mean Hourly (Aggregate) 58.4 20.6 15.9 27.0% 15.9 27.0%
Mean Hourly Per Site 0.59 0.21 0.16 27.0% 0.16 27.0%
For the first event, on Thursday, July 20th, the aggregate event reduction estimated by the hybrid baseline
ranged from 13.7 to 15.1 MW or 23.0 to 24.7%% of load. The average hourly event curtailment estimated
by both DNV GL and National Grid was 14.5 MW or 24.0% of load. Aggregate event reduction for the
second event, on Tuesday, August 22nd, estimated by the hybrid baseline ranged from 15.2 to 16.6 MW or
26.3 to 28.7% of load. The average hourly event curtailment estimated by DNV GL and National Grid was
15.9 MW or 27.0% of load.
Table 5 below shows the proportion of curtailment estimates from each event that used the Adjusted 10 of
10 versus unadjusted 10 of 10 in the final reduction determination. Recall, the core hybrid approach uses
the higher estimate from the two approaches as the final estimate of reduction for each customer.
Customers designated as having “no performance” had negative savings using both approaches and
accordingly received no payment. The reduction calculated from the adjusted baseline was used as the
basis for the incentive payment 70% of the time. This indicates a degree of weather sensitivity in the
majority of customers though it is not the only explanation for an algorithmic choice of the adjusted baseline.

DNV GL – www.dnvgl.com February 23, 2018 Page 15
A customer without any systematic correlation with weather will still have random variation in their pre-
event, adjustment period load. The hybrid will always choose the adjusted baseline that is adjusted to
upward variation in load. If there were no other systematic upward bias, the hybrid baseline would choose
the adjusted baseline about half of the time.
Table 5: Rate of Adjusted versus Unadjusted Baseline Use
Event # Adjusted Unadjusted No Performance
Event 1 60% 23% 17%
Event 2 81% 9% 10%
Overall 70% 16% 14%
Figure 4 presents a summary of the committed capacity achieved by demonstration participants. To
examine this, we used the average of each participant’s performance across the two events and compared
that performance to their committed capacity. Thirty participants (~30%) achieved more than their
committed capacity (i.e., over 100%) and nearly half (~46%) achieved less than 50% of their committed
capacity. This rate of non-performance among participants might be expected for a demonstration that does
not have penalties for non-performance.
Figure 4: Summary of Committed Capacity Achieved
Figure 5 is a scatterplot that shows the committed capacity versus actual reduction for each participant. As
above, we used the average of the two events as the final achieved reduction. We have placed a line that
roughly delineates the participants that achieved more than 100% of their commitment versus those that
did not. Dots above the line indicate customers who delivered greater load reduction than they committed.
There are 10 participants that achieved 100 kW or more above their commitment (including one that
achieved nearly a full MW more). While these can be regarded as successes, the variation of performance
versus commitment is a primary challenge for DR programs. It raises concerns around the difficulty
participants might be having in predicting the amount of curtailable load in addition to the possibility that
participants are reticent to over commit themselves to a high capacity commitment. There are ways to
incentivize performance that is closer to commitment level if National Grid desires to reduce that variability.

DNV GL – www.dnvgl.com February 23, 2018 Page 16
Figure 5: Scatterplot of Committed vs Actual Reduction (kW)
It should be noted that an unadjusted 10 of 10 baseline was initially planned as the demonstration baseline.
However, as the summer progressed it was determined that the use of an adjusted 10 of 10 baseline was
more appropriate. DNV GL initially developed results around a 10 of 10 unadjusted baseline and
subsequently revised them to reflect the new baseline. Additional data intervals provided in the new data
also affected our initial results.
As a result of replicating and verifying the demonstration calculated impacts, we were able to make some
observations regarding the baseline process undertaken by National Grid.
Days included in the baseline are intended to represent typical load for the customer. It is common
to remove event days and weekends and holidays from consideration. There may be additional
reasons why other days should be considered ineligible for inclusion in the baseline. For instance,
the event schedule for the summer included at least two events that were scheduled and then
cancelled. In the case of both events, these days became part of the baseline day set for
subsequent events that were implemented. To the extent that customers took action in expectation
of the called-off events, the data from those days will not be representative of typical non-event load.
There is also the possibility that an ISO NE event might occur that would also represent an abnormal
day. While this did not happen during the period examined (the summer of 2017), there is a
possibility that it will occur in the future, in which case those days would need to be identified and
dropped from the baseline days.
There was no evidence that National Grid had any rules for removing data as part of a quality
control process. Similar to the previous bullet, spikes, missing data, exact zeros or other indications
of potentially abnormal meter data could justify removing a day from baseline consideration. Data
quality and sufficiency rules would support this process.
This report includes a baseline analysis that provides an assessment of the bias and variability of a
range of common baselines. The hybrid baseline used by National Grid selects the better baseline
for the customer (adjusted or unadjusted), building in a possible upward bias into load reduction

DNV GL – www.dnvgl.com February 23, 2018 Page 17
estimates. This has implications with regards to cost-effectiveness calculations and the accuracy of
load reduction claims resulting from that baseline.
4.2.2 Event Curtailment with Adjusted Baseline and Regression Results
This section compares the demand reduction estimates for each event with estimates from the ex-post
analysis site-level regression. The site-level, regression-based estimates take advantage of the additional
data available from the full-season retrospective view with the regression structure to avoid event day
adjustments and the associated risks. For these results, load reduction is zero if the regression baseline is
lower than load during the event period.
Table 6 and Table 7 are the same as Table 3 and Table 4 but include the regression-based results. The
site-level regression provides reduction estimates that are lower than the adjusted baselines. During the
first event, on Thursday, July 20th, the aggregate event reduction estimated ranged from 11.6 to 13.2 MW,
or 19.5 to 21.6% of load. The regression results for the second event were similar.
Table 6: Aggregate Event Curtailment for Thursday, July 20th, 2017 with Regression
Hour Load (MW)
Capacity Commitment
Reductions
Hybrid Site-level
Regression
MW % MW %
14 61 20.6 15.1 24.7% 13.2 21.6%
15 60.1 20.6 14.6 24.3% 12.1 20.1%
16 59.6 20.6 13.7 23.0% 11.6 19.5%
Mean Hourly (Aggregate) 60.2 20.6 14.5 24.0% 12.3 20.4%
Mean Hourly Per Site 0.62 0.21 0.15 24.0% 0.13 20.2%
Table 7: Aggregate Event Curtailment for Tuesday, August 22nd, 2017 with Regression
Hour Load (MW)
Capacity Commitment
Reductions
Hybrid Site-level
Regression
MW % MW %
14 59.7 20.6 16.0 26.8% 13.3 22.3%
15 57.8 20.6 16.6 28.7% 12.9 22.3%
16 57.7 20.6 15.2 26.3% 12.1 21.0%
Mean Hourly (Aggregate) 58.4 20.6 15.9 27.3% 12.8 21.9%
Mean Hourly Per Site 0.6 0.21 0.16 27.3% 0.13 21.7%
Figure 6 contains visual representations of the first and second events. They include the aggregate actual
load, the hybrid baseline used for settlement for this demonstration, the unadjusted and adjusted 10 of 10
settlement baselines used by the hybrid baseline and the regression baseline. The event period includes
hour-ending 15, 16 and 17. For both events, the actual MW load shows clear evidence of load curtailment
during the event hours. The baselines provide an estimate of load had the event not occurred.

DNV GL – www.dnvgl.com February 23, 2018 Page 18
Figure 6: Aggregate Event Curtailment
The visual check of a baseline, that it lines up with load in the pre- and post-event hours, is a useful but
potentially misleading basis for assessing the accuracy of the baseline. Any abnormal load characteristics
before or after the event period will cause baseline and actual load to diverge in the pre- and post-event
hours. For instance, a baseline that is higher than actual load in post period could indicate that some
customers never resumed “typical” load level even after the finish of the event. Alternatively, if cooling was
reduced during the event period, then post-event load might be higher than the baseline after the event, as
the HVAC system catches up. The same scenarios can affect the pre-event load as well, with early
shutdown and pre-cooling similarly affecting pre-event load. These latter scenarios are particularly
important as artificially high or low load prior to the event will affect the point of adjustment making the
baseline, across all hours, higher or lower than the underlying counterfactual baseline. As a result, it is
worth remembering that the most accurate baseline does not necessarily match the actual non-event load of
the event day.
With this in mind, it is possible to make some general statements about the baselines for these event days.
The unadjusted 10 of 10 baseline is consistently below actual load for non-event hours on both event days.
For weather-sensitive loads, typical load varies with the weather. The unadjusted baselines do not adjust to
typical load under extreme conditions and will frequently underestimate load for extreme condition events.

DNV GL – www.dnvgl.com February 23, 2018 Page 19
In contrast, in Figure 6, the adjusted baseline is aligned with load just prior to the event period (by design)
and slightly high in the post event period for the second event. The second event also shows evidence of
load reduction in the two hours prior to the event which lowers the point of adjustment.
The hybrid baseline, which chooses the more generous baseline of the unadjusted and adjusted 10 of 10
baselines, provides the highest baseline in each plot and a baseline that is well above actual load in the post
event period. By design, the hybrid baseline will choose the adjusted baseline when pre-event load is high
relative to unadjusted baseline load, but will default to that unadjusted baseline load when pre-event load is
lower. For the first event, the hybrid baseline produces an aggregate baseline that is clearly higher than the
actual load shape in the pre-event period. For the second event, the hybrid baseline appears to correct for
the early load reduction producing a baseline that aligns well with actual load shape in the pre-event period.
These two events exemplify the strength and weakness of a hybrid baseline. At both the customer and
aggregate level, the hybrid baseline minimizes the negative effect of low load in the pre-event period. For
the first event, the hybrid baseline clearly produces an exaggerated aggregate load reduction estimate. For
the second event, the hybrid baseline appears to have resulted in a more suitable aggregate load reduction
estimate.
Finally, the regression baseline falls between unadjusted and adjusted baselines. The regression approach
represents the mean expected load for that event period given the available data. In this case, the
regression baseline is day-of-week specific (unlike the 10 of 10 baselines) and will vary with daily degree
days if the customer is weather-sensitive. The regression baseline is the probabilistic expectation for load
during the event period. To the extent that pre-and post-event period load is higher or lower than the
regression baseline, that difference represents some combination day specific random variation or event-day
specific activity.
The regression approach has the advantage of not being dependent on the event-day adjustment which can
be affected by changes in event day load characteristics. This means that activites such as pre-cooling and
early curtailment will not artificially increase or decrease, respectively, a customer’s estimated load
reduction. The lower regression baseline estimates of load reduction could indicate an artificial increase in
load that is affecting the adjusted baselines. On the other hand, the regression adjusts to weather-related
increases in load by explicitly modeling load as a function of weather. If a customer’s weather-related
behavior is complex or variable the regression may not effectively characterize it, and this could lead to
lower estimates of load under peak conditions. Furthermore, there could be other drivers of system peak
load that are not accounted for in the regression. The true aggregate load reduction for the demonstration is
likely between the regression and hybrid baseline estimates.
The following figures provide examples of different scenarios at the customer level. Figure 7 shows all of the
baselines for a customer for the first event on July 20, 2017. In this plot, the additive adjusted baseline and
the regression baseline are at similar level prior to the event, though they have different shapes through the
event period. The unadjusted baseline is well below the other baselines, essentially halving the load
reduction estimate. The hybrid baseline overlaps the adjusted baseline (visible only for the adjustment
hours) because that is the higher baseline for this customer for this event.

DNV GL – www.dnvgl.com February 23, 2018 Page 20
Figure 7: Example Customer A, July 20, 2017 Event
In Figure 8, the plot shows the same customer for the second event on August 22, 2017. For this event, the
customer’s load through the morning hours is almost double the level it was for the prior event. The
unadjusted baseline has increased compared to the unadjusted baseline for the earlier event, but not as
much as actual load. The regression baseline, in contrast, is almost identical to the regression baseline for
the first event indicating that the change in load is not weather-correlated. The adjusted baseline is
substantially higher than the other baselines because of the adjustment to the high pre-event load. For this
customer and event, the hybrid baseline would again utilize the adjusted baseline. The customer reduces to
a similar level during both events. The customer appears to have had unexpectedly high load on this event
day and thus be able to reduce substantially more than for the first event.
Figure 8: Example Customer A, August 22, 2017 Event
Actual MW
Hybrid National Grid
Regression
Adjusted 10 of 10 (additive)
Unadjusted 10 of 10
Actual MW
Hybrid National Grid
Regression
Adjusted 10 of 10 (additive)
Unadjusted 10 of 10

DNV GL – www.dnvgl.com February 23, 2018 Page 21
Figure 9 shows the load of a different customer during the second event. On this event day, the customer
appears to have reduced load early. The adjusted baseline, the lowest baseline in the plot, is adjusted to
this low pre-event load and as a result appears to severely underestimate the load reduction. The
unadjusted baseline and the regression are both much closer to load levels outside of the event period. For
this customer, the hybrid baseline would choose the unadjusted baseline as it indicates greater load
reduction.
Figure 9: Example Customer B, August 22, 2017 Event
These examples demonstrate the way the hybrid baseline approach chooses the more generous baseline
between the unadjusted and adjusted 10 of 10 baselines. This approach has the advantage of avoiding
underestimating load reduction as appears to be the case with the adjusted baseline in Figure 9. However,
the hybrid baseline will also choose the adjusted baseline in scenarios such as in Figure 8 when it appears to
indicate a much higher load reduction than would be expected from that customer. In these examples, the
regression baseline, by contrast, avoids the dependence on pre-event load and offers a baseline that reflects
the conditions of the event day.
4.2.3 Baseline Analysis
In the prior sections, demand reduction estimates were compared across adjusted and unadjusted versions
of the 10 of 10 baselines and the regression baseline for each event. As discussed in section 4.2.2, it is
possible to make a superficial assessment of which baseline is better or worse. However, it is impossible to
fully assess the accuracy of a baseline during an actual curtailment event. The true load absent the event
effect cannot be known. To complicate the matter, event-related activities themselves may alter the load in
the period both before and after the event which provide the visual clues relating to accuracy.
4.2.3.1 Demonstration Population Analysis
As an alternative to assessing baselines on event days, baselines can be calculated for the same event hours
on non-event days. Under non-event conditions, the baseline should predict the actual load. For these non-
events, the actual load during the event period represents the ideal baseline had an event been called. The
difference between actual load and the baselines on non-event days is an important way to test the
Actual MW
Hybrid National Grid
Regression
Adjusted 10 of 10 (additive)
Unadjusted 10 of 10

DNV GL – www.dnvgl.com February 23, 2018 Page 22
underlying accuracy of baseline methodologies and understand the potential for baseline error on event days.
The baseline analysis is a particularly useful assessment for unadjusted baselines because they are not
additionally sensitive to possible event day changes in load during the adjustment period, for instance.
Figure 10 plots average customer-level actual load and three baselines for the top 9 non-event, ISO-NE
system load days that occurred from June 15th to August 31st during the summer of 2017. These aggregate
results for all the baselines reproduce the same pattern of baselines as the event day base plots. The
greater of the two 10 of 10 baselines would be chosen at the customer level by the hybrid baseline used by
the demonstration. As with the first event in Figure 6, a baseline that reflected the hybrid baseline choice
would be higher than actual load through the afternoon. In aggregate, the regression baseline falls in
between the unadjusted and adjusted 10 of 10 baselines.
Figure 10: Aggregate Baselines on Top 9 Non-Event High System Load Days6
Figure 11 provides the aggregate population relative error separately for each of the top 9 non-event peak
days.7 The days are labeled by their rank with respect to average daily temperature. The two days on the
left of the figure were the two non-events, highest system load days and were among the six hottest non-
event days. The two event days were also among the top six hottest days and top six highest load days.
During the summer of 2017, there was a strong correlation between system load and temperature for the
top six days. Outside of those 6 days, the correlation was less obvious.
6 The adjusted baseline should cross actual load between hours ending 12 and 13. A small number of customer have insufficient data with which to
construct a 10 of 10 for some days. 7 Demonstration-level relative error is the total baseline error relative to total actual load and is calculated using averages across the three simulated
event hours. Peak days were ranked by ISO-NE system load for hour ending 17.
Actual MW
Hybrid National Grid
Regression
Adjusted 10 of 10 (additive)
Unadjusted 10 of 10

DNV GL – www.dnvgl.com February 23, 2018 Page 23
Figure 11: Demonstration-Level Relative Baseline Error, Top 9 Summer, Non-Event High System Load Days*
*Data for most customers spanned June through August. Early June high system load days had insufficient data to produce rolling 10 of 10 baselines.
Figure 11 demonstrates how the unadjusted baseline curtailment estimates consistently underestimate
actual load on high system load days. The symmetric additive day-of-event adjustment curtailment
estimates both under- and over-estimate actual load within +/- 3%. The regression curtailment estimates
under- and over-estimate actual load within a wider band with a negative bias (+5% and -11%). The
regression results are more accurate than the unadjusted baseline on average and for most of the days but
demonstrate a downward bias and greater variability than the adjusted baselines. This indicates that there
are drivers of high load on high system load days that are un-related to temperature.
4.2.3.2 Generalized Baseline Analysis
The prior section, Section 4.2.3.1 compares baselines on aggregate demonstration data. This provides a
retrospective view of the demonstration and how the baselines performed for this specific set of customers
on high system load days. In this section, we prepare the data so that the results are more representative
of the effectiveness of these baselines on the next typical individual customer. Rather than summarize a

DNV GL – www.dnvgl.com February 23, 2018 Page 24
demonstration -total error that may be driven by a single large customer, the boxplots summarize the
customer-level relative error for each event. This approach gives the baseline accuracy characteristics for
each customer an equal weight. Each customer’s event period errors are calculated relative to their average
load for the days included. We look at the full range of analyzed baselines on the same 9 non-event days
with high system loads from the 2017 summers.
This section summarizes baseline performance for these proxy event periods with two metrics.
Relative baseline prediction error - the mean customer-level difference between baseline load and
observed load normalized by load at the customer level.
Root Mean Square Relative Error (RMSRE), - The standard deviation of the customer-level baseline
prediction error normalized by load at the customer level.
The relative error and RMSRE characterize the bias and variation of a baseline, respectively. The RMSRE is
similar to CVRMSE, and is a widely-used metric that combines both bias and variation in one metric.
Box plots are an effective way to display multiple distributions side by side. They simplify the plot into only
a handful of key statistics and make comparison among different groups (in this case baseline approaches)
easier. The elements in a box plot are the:
Mean - shown by the small cross, the average percent error across all the intervals
Median - the line in the box. Half of the intervals are below this magnitude and half are above
Interquartile range – the box itself, with the top of a vertical box plot being the 75th percentile and
the bottom being the 25th percentile
1.5 x the interquartile range – the whiskers above and below the box mark 1.5 x the interquartile
range of intervals
Minimum and maximum –square mark outliers outside of 1.5 x the interquartile range. The highest
and lowest blue dot represent the minimum and maximum value. If there are no outliers, the
minimum and maximum are indicated by the whiskers
When we look at a box plot of load we are interested in seeing how the plots are different among the groups,
in this example, the baseline type. We can visually compare the means and medians, the relative spread of
the interquartile range and the minimum and maximum.
The boxplots include 11 baselines for comparison:
Meter Before-Meter After (MBMA)– A flat baseline adjusted to the two-hour adjustment period
starting three hours prior to the event period.
10 of 10 (_10_10) – Average hourly load over the 10 prior eligible demonstration days.
Mid 8 0f 10 (_8_10) - Average hourly load over the middle 8 of the 10 prior eligible demonstration
days, ranked based on average event period load.
High 4 0f 5 (_4_5) - Average hourly load over the highest 4 of the 5 prior eligible demonstration
days, ranked based on average event period load.
Symmetric additive adjusted versions of the three settlement baselines above (A1).

DNV GL – www.dnvgl.com February 23, 2018 Page 25
o A1_10_10
o A1_8_10
o A1_4_5
Symmetric scalar adjusted versions of the three settlement baselines above (A2).
o A2_10_10
o A2_8_10
o A2_4_5
Regression – Baseline from site-level regressions with daily temperature and day of week variables
with an optimized degree day base.
Figure 12 presents box plots of relative baseline error across 11 baselines for the top 9 non-event, high
system load days of the summer of 2017. Baseline error is a measure of accuracy or how close the
predicted value is to the actual value. For these extreme days, the three unadjusted rolling baselines
underestimate actual load. This is to be expected because the days used to construct the baseline load are
likely to be milder than an extreme day.8 The unadjusted high 4 of 5 underestimates actual load to a lesser
degree than the other unadjusted baselines. It is constructed with an explicit upward bias by using the 4
highest days, in terms of load, of the 5 possible eligible days. On mild days, this baseline will consistently
overestimate load, but on extreme days such as these, the upward bias makes the baseline more accurate
than an unadjusted 10 of 10 baseline.
8 Each extreme day is treated as a single event day for the period. That is, other extreme days that fall among the 10 day baseline period are not
excluded from the baseline. This is an appropriate approach if only a handful of events are expected across the summer. If the demonstration were expected to call many events across the summer, then the extreme days could be removed from baselines for subsequent events. Under this assumption, the underestimation of the unadjusted baselines would be even more extreme. The effect on the adjusted baselines would be less extreme and would be a function of the load shapes of the customers and how they change as conditions get more extreme. Typically, removing the extreme days from the baseline would cause a flatter baseline, increasing the positive error.

DNV GL – www.dnvgl.com February 23, 2018 Page 26
Figure 12: Relative Baseline Error Box Plots, Site-Level for Top 9 Non-Event Peak Dates
The adjusted baselines do a much better job of estimating actual load with the notable exception of the
Meter Before Meter After (MBMA) baseline. The MBMA baseline is a flat load baseline set at the actual load
occurring during the adjustment period. While the MBMA baseline is effectively adjusted, the flat baseline
does not track typical loadshape like a rolling baseline. Because the event period under consideration is late
in the afternoon, many loads decrease during the event period. The MBMA baseline does not compensate
for this and the resulting error causes a serious over estimate of curtailment during this event period. The
MBMA baseline can seriously underestimate load if applied during a period load increase. This baseline is
only accurate for very consistent loads or very short event periods.
The adjusted rolling baselines all fall within a couple percent of zero. Figure 12 indicates that the additive
adjustment of the centralized baselines (10 of 10 and mid 8 of 10) has a slight upward bias and a wider
range of error in contrast to the scalar adjusted versions of those baselines. This can be traced to the time
of day of the event period being used. The scalar adjustment scales with the level of baseline load thus
tracking better as load reduces at the end of the day. Conversely, the additive adjustment is set at a certain
magnitude and remains at that magnitude even as the load drops considerably. The scalar adjustment is
riskier during periods with increasing loads. A scalar adjustment calculated during a low load period can be
extreme when applied to high loads later in the day. The Connect Solutions demonstration had the

DNV GL – www.dnvgl.com February 23, 2018 Page 27
additional challenge of some customers with on-site generation, which exacerbated the scalar-adjustment
issues. The boxplots do not include three customers for whom the scalar adjustments exploded.
Finally, the regression baseline has a negative bias that is less than the central, unadjusted baselines but
greater than all of the adjusted baselines and high 4 of 5.for these 9 days. Because of the potential event
day issues with same day adjustment, the regression approach is an important alternative to the adjusted
10 of 10 baselines. The regression approach offers a robust counter point to the adjusted baselines
especially for a high system load days driven by weather.
Figure 13 shows RMSRE across all selected baselines. The box plots show a distinct pattern related to the
kind of adjustment. The unadjusted set of baselines are more variable than the additive baselines which are
more variable than the scalar baselines. Among the adjusted baselines, the 10 of 10 baseline is the least
variable of the three with the high 4 of 6 baseline being the most variable. The regression baseline exhibits
RMSRE levels that are better than any of the unadjusted baselines. Again, the regression approach is
particularly useful because it maintains this relative low level of variation even without a same day
adjustment.
Figure 13: Root Mean Square Relative Error (RMSRE), Site-Level for Top 9 Non-Event Peak Days

DNV GL – www.dnvgl.com February 23, 2018 Page 28
Overall, with the exception of the MBMA baseline, the unadjusted baselines are the least accurate and least
precise. At the aggregate level, they have a significant downward bias, are more biased in absolute terms
than baselines with a symmetric same-day adjustment, and their baseline errors have the largest spread.
The unadjusted high 4 of 5 is less biased than the other unadjusted baselines as it selects the 4 highest load
dates within the 5-day pool, but is still more biased than the adjusted baseline types presented.
The rolling baselines with symmetric day-of-event adjustments performed similarly in terms of accuracy but
the scalar adjusted baselines were slightly superior to the additive adjustment baselines with respect to
precision. While the scalar adjusted baselines performed better in general for the event period and
customers analyzed here, this might not be the case for morning events or other situation where
adjustments are calculated during low load periods. Among this population, we saw volatile behavior from
scalar adjustments for sites with on-site generation.
Other factors, beyond baseline accuracy should also be considered when choosing a baseline. Those factors
will vary depending on the situation. A primary motivator for considering an unadjusted baseline is concern
over the effect of strategic behavior on baseline levels given day ahead warning of an event. The same day
adjustment means that the baseline can move up or down due to activity during the hours used for the
adjustment. Reasonable strategic behaviors such as pre-cooling or sending a shift home early will move a
baseline up or down, respectively, in a way that is not representative of typical load during the event period.
Alternatively, a customer could use something similar to pre-cooling to artificially increase the baseline and
thus artificially increase estimated load reduction. In general, the improvement due to the adjusted
baselines is considered sufficient that the risk related to any strategic behavior is of secondary importance.
The hybrid option further minimizes the potential downward adjustment due to an early load reduction. If
the demonstration is clearly advertised as a demonstration where the final decision regarding an event is
made just prior to the event period, then the effect of the day-ahead notification is muted
4.3 Process Results
In this section of the report we provide results pertaining to demonstration communication, information, and
marketing/outreach (including a discussion on demonstration drivers and barriers). Following this, we
review findings related to the demonstration enrollment process, curtailment related observations, and the
experience of the stakeholders around the demonstration financial elements. We close this section with a
discussion of demonstration satisfaction.
4.3.1 Communication and Coordination Among Demonstration Implementers
DNV GL asked National Grid and the CSPs how they communicated with each other. The interviews revealed
that National Grid staff and the CSPs had weekly phone
meetings during the demonstration’s peak level of activity
in the summertime. Additionally, they conducted regular
“training meetings” over the phone in which CSP field staff
and National Grid sales representatives could ask each
other questions. One CSP rep said that these joint training
sessions were useful for teaching the National Grid sales
representatives how to better recognize “qualified”
candidates. There was also frequent email communication.
Typical topics of discussion included how customers could
Weekly meetings and regular training sessions with
supporting email interactions provided the basis for largely
effective program communication during the
peak level of activity

DNV GL – www.dnvgl.com February 23, 2018 Page 29
obtain new metering/ special equipment and which National Grid sales personnel represented which
customers.
We asked the interviewees about any challenges in these communications. In general, they said the
communications part of the demonstration went well. “[National Grid staff] were timely in getting back to
us, the administrators in particular, and if we needed decisions, they were made in a timely fashion,” said
one CSP rep. “It really didn't get bogged down in a lot of red tape.” However, National Grid and the CSPs
did identify a few challenges with the communications process including:
Incomplete/outdated sales pipeline information: National Grid said that it regularly runs reports for its
DR demonstration which indicate how many sales leads are close to and/or have signed a contract. Both
National Grid and the CSPs acknowledged that their sales representatives sometimes lagged in entering
information on sales leads into the CRM software which feeds into these sales reports. Two of the CSP
representatives also thought that National Grid could have been clearer up front as to their expectations
for pipeline reporting. “I think it was unclear at the beginning when we signed up to participate in the
demonstration, that we were going to be providing a pipeline report,” one of them said.
Insufficient access to, knowledge of National Grid sales representatives: “One of the things that was
definitely tough on our side is we feel like we weren't able to get in touch with sales people from
National Grid very easily,” said one CSP rep. “I know our sales lead had a lot of difficulty reaching out to
some of the people that [the National Grid Project Manager] had tried to connect him with.” “[One thing]
that we learned as we went is who the responsible sales person is on their [National Grid’s] end,” said
another CSP. “That … wasn't obvious upfront, the way they're constructed.”
Difficulties downloading the customer performance reports: One of the CSPs reported challenges
downloading these reports. “It took us the better part of two days to download each one of the
individual reports that were finally generated,” said the CSP rep. “So …. some automation work has got
to get in place to make that easier.”
National Grid staff said that their communications with AutoGrid have gone fairly smoothly. They noted that
having an AutoGrid representative in their Waltham office greatly facilitated the communications and
troubleshooting. Finally, National Grid staff said that they have had several meetings with ISO-NE staff,
especially in the beginning of the demonstration. The purpose of these meetings was mainly to make ISO-
NE aware of the Connected Solutions. There were only two glitches cited by CSPs in their communication
with AutoGrid:
One CSP reported having difficulty getting the AutoDR connection with AutoGrid to work. “We've
worked with AutoGrid a bunch outside of this [Connected Solution] program and for whatever reason,
it's been slow getting the AutoDR connection to work for this program in particular,” he said.
Another CSP said that their challenges with AutoGrid were mainly due to some late customer
enrollments. “It wasn't really until the 11th hour that we were actually able to enroll folks,” the CSP
rep explained. “But it was not hard once we got it sorted out … with AutoGrid.”
4.3.2 Demonstration Information
We asked National Grid staff and the CSPs about the development of the demonstration information, both on
the demonstration website and in the demonstration’s two-page flyer. National Grid staff said that they
developed this information after consulting with their internal (National Grid) stakeholders, the CSPs, and an

DNV GL – www.dnvgl.com February 23, 2018 Page 30
outside consultant. All the CSPs confirmed that they had reviewed and made contributions to this
information. However, as discussed in the next section, two of the three CSPs preferred to mostly use their
own customized demonstration information.
THE EFFECTIVENESS OF DEMONSTRATION INFORMATION
National Grid and the CSPs all agreed that while the printed or online demonstration information was useful,
it could never answer all the questions a customer might have. Therefore, a phone or face-to-face
conversation with a customer was still needed to explain how the demonstration worked. “This is a very
new idea for [C&I customers] and I don’t know if that can be solved just by having better printed materials,”
said a National Grid representative. “Sometimes people need you to walk you through a new idea.” One of
the CSPs described the demonstration flyer as a “door opener” and as something that “whets the appetite.”
The figure below presents two suggestions to improve demonstration information made by one of the CSPs.
Two of the CSPs said they primarily used their own demonstration information rather than the collateral
developed by the demonstration. One CSP rep said that they did this so they could supplement the core
National Grid FAQs with additional FAQs describing how the Connected Solutions demonstration interacted
with the ISO-NE FCM program. “For most of these customers, … we were looking to enroll them in the FCM
program,” the CSP rep explained. “And so, by necessity, we needed to be providing them information for
that.”
Another CSP rep said he did not use the demonstration -produced information for two reasons. First he
thought it had confusing descriptions of how the financial incentives were shared between the CSP and the
customer. “The original collateral … [said that the] customer can get paid directly and then pay the CSP or
vice versa … and it confused some of the National Grid sales
guys,” he said. “They thought the customer was going to get
all the money in one of these cases, and they didn't have to pay
the CSP.” He said he was working with National Grid so that the
only payment option would be the one where the demonstration
pays the CSPs and then the CSPs distribute the financial
incentives to the customers after taking their cut. In our
assessment of the demonstration flyer used in the 2017
marketing, it does give the impression that one payment option
is for a customer to receive the full incentive amount without
regard for CSP payment (Payment Choice A).
The other reason he gave for not using the demonstration -produced information was that he did not think it
did a good enough job of emphasizing the multiple financial benefits of demonstration participation. “Our
Although CSPs had some concerns with the content in
the demonstration information provided to
customers, participants were quite satisfied with the
information received, offering an average rating of 4.5 out
of 5

DNV GL – www.dnvgl.com February 23, 2018 Page 31
collateral … talked about the stacking of benefits,” he said, “how you can actually earn or save in three
different ways [capacity payment, performance payment, and ICAP tag reduction] by taking the same
action.”
Demonstration participants were quite satisfied with the information they received in terms of explaining
how the demonstration worked.9 Eight of 13 respondents rated their satisfaction as a five on the five-point
scale, three rated their satisfaction as a four, and two rated their satisfaction as a three (85% satisfied,
average rating of 4.5). One of the less-than-satisfied respondents explained the reasoning for his rating
indicated that their CSP presentation on load shedding was complex with a lot of jargon and would have
been confusing had he (the participant) not already had familiarity with the subject. The other was unsure
about whether they had properly signed up for the demonstration and had recently received a message that
they were not.
4.3.3 Marketing and Outreach
When asked how they market the demonstration, National Grid indicated it is primarily through its dedicated
sales representatives. These sales representatives have existing relationships with the C&I customers and
this demonstration is one of a range of energy efficiency and DR offerings that the sales representatives
were promoting to these customers. When a C&I customer expressed interest in the demonstration, the
National Grid sales representatives would provide them with a flyer which lists all three CSPs.
National Grid also said that it provided its sales representatives with customer analytics that identified which
customers had load characteristics that made them good candidates for DR. This included customers who
had high energy use during peak hours relative to their average load. National Grid said that this
information helped their sales representatives know “which of their customers are really the cream of the
crop to go to talk to about demand response.” National Grid did not think it was proper to share that level
of information with the CSPs, though they do anticipate those customers will reach out to the vendors after
being approached by their sales representatives.
The interviews also revealed that the National Grid sales representatives would sometimes play a supporting
role rather than being the sales lead. For example, if a CSP made first contact with the C&I customer and
the customer was not sure if the CSP was a legitimate vendor, the customer might contact their National
Grid representative to get some reassurance. Or they might even ask the sales representative to sit in on
the meeting with the CSP. The National Grid staff also said that they promoted the demonstration via
presentations to relevant customer groups such as waste water treatment plants or grocery store owners.
National Grid staff said that they allowed all three CSPs to go after all C&I customers. While they
acknowledged that multiple CSP contacts could potentially confuse some customers, they believed that the
benefits of price competition outweighed the costs of any customer confusion.
For similar reasons, the National Grid staff was not concerned with consistency in the sales process. “We
don’t really ensure consistency, we leave it up to the vendors to not be consistent,” explained one National
Grid representative. “Whatever their style of presentation is, whatever order they sell it in, we’re not
dictating any of those things. They’re out to sell the demonstration the best way they think they can … at
the best rate they think they can go at. We don’t want to dictate that stuff.”
9 This could have been either demonstration information from National Grid or customized demonstration information from the CSPs.

DNV GL – www.dnvgl.com February 23, 2018 Page 32
The CSPs said that they used both phone calls and onsite visits to recruit customers into the demonstration.
One CSP representative said the site visits were more common for customers with complicated operations
(e.g., multiple buildings) or those who just needed some personal attention to get comfortable with the
demonstration.
All the CSPs said that they helped the customers identify load
reduction opportunities. They noted that some of the larger
customers were fairly self-sufficient though some needed
more assistance. “We're helping them figure out what they
can turn off, how long they can turn it off, when they can turn
it off, and how many days in a row they can turn it off,” said
one CSP rep about some of his less-sophisticated customers.
One CSP rep said that an additional challenge of developing a
load reduction plan, besides lack of customer sophistication,
was the load reduction option that a customer had. He
explained that it was easier to develop load reduction plans for
customers who could shut down a specific piece of large equipment – such as a shredder in a lumber mill –
or discrete processes with single motor/line loads – such as metal recyclers, rock crushers, cement
processors, and waste water treatment plants. He said it was more difficult to develop plans for customers
who reduce load via reducing temperature set points, cycling fans, or modulating variable frequency drives.
“It's really a function of how much control they actually do have,” he explained. “Is it well thought out, and
there's one central keyboard and a guy who can do everything at his fingertips? Or do folks have to run
around shutting down compressors?”
One CSP explained the development of the load reduction plan as a “discovery process” where his company
provides some high-level guidance and through targeted questions about the customer’s load patterns helps
them “figure it out” for themselves. “We just tell them, from our experience with other people and
programs, what's commonly done, and then let them find, from that basket of potential “toys,” maybe find
something fits what they want to do.”
One CSP rep said that when the customer sign the contracts there’s “a sort of accepted or agreed-upon
[load reduction] level.” However, he explained that there is also an understanding with the customer “that
that may change as we do a pre-season test with them or start to refine their load reduction plan.”
DRIVERS OF DEMONSTRATION PARTICIPATION
We asked participants for the main and secondary reasons for their organization’s demonstration enrollment.
The large majority mentioned financial benefits as their primary reason. These financial benefits included
receiving the demonstration’s incentive payments, achieving more favorable electricity rates through
decreased ICAP tags, and being able to maximize revenue potential by joining multiple DR programs.
Helping National Grid was also one of the main motivators. Figure 14 shows the full range of responses.
Developing the customer load reduction plan is a very
customized process that is dependent on the controls present, customer ability to shut down specific pieces of equipment, and the ability of
the customer to discover opportunities with some CSP
guidance.

DNV GL – www.dnvgl.com February 23, 2018 Page 33
Figure 14: Participant Motivations for Demonstration Enrollment
We also asked National Grid staff and the CSPs what factors drove demonstration participation. Consistent
with participant responses, they thought that financial benefits, especially demonstration incentives, were
the main drivers of demonstration participation. “If there's no check, they won't do it,” said one CSP rep
bluntly. One CSP rep also mentioned that the prospect of combining Connected Solution incentives with
ISO-NE DR program incentives had additional appeal for customers. “The demonstration does allow for a
new customer … somebody that's not been a DR regular, to stack additional benefits between the two
programs,” he said. “And so there's a revenue side of that to the customer that's impactful.”
The CSPs acknowledged that some customers had cited other reasons for joining the demonstration besides
the financial incentives. For example, some customers cited additional benefits such as getting credits
toward LEED certification or for a corporate environmental initiative. One customer even announced their
participation in the Connected Solution demonstration in a
press release.
There was some disagreement among the CSPs as to the
importance of these non-financial motivations for
demonstration participation. For example, one CSP rep
characterized these non-financial motivations as much weaker
and likely after-the-fact justifications for joining the
demonstration while another indicated that one of their
customers only participated in the demonstration due to
corporate sustainability objectives.
A couple of the CSP representatives did think the
demonstration could produce some secondary benefits for
customers by making them more familiar with their load patterns, thereby opening the door to peak
management outside the Connected Solutions demonstration. “if you put the demonstration in place to
shed [load], then you can start looking at other data sources and shed on your own, separate from the
utility demonstration, to avoid cost,” said one CSP rep. He said that the customers for whom energy is a
15%
23%
15%
15%
38%
92%
0% 20% 40% 60% 80% 100%
Ability to schedule productionaround events
Positive experience with anotherdemand response program
Access to electric usage data
Environmental concerns
Help National Grid
Financial benefit
Main reason
Secondary reason
CSPs and participants consistently reported that despite some fringe non-financial motivations, the
main demonstration drivers are financial benefits,
including the possibility of stacking the benefits from
multiple streams such as ISO NE and a reduction in ICAP
charges

DNV GL – www.dnvgl.com February 23, 2018 Page 34
significant portion of their overall business expenses – such as those in the metal-casting industries – are
more likely to adopt such practices.
BARRIERS TO DEMONSTRATION PARTICIPATION
DNV GL asked the National Grid staff and the CSPs what were the major barriers to demonstration
participation. Some of the barriers identified include:
Smaller incentives compared to other DR programs: Several interviewees claimed that the Connected
Solutions demonstrations’ incentives were lower than the incentives from other DR programs, including
those which ISO-NE offers. The Connected Solutions demonstration offers incentives of just about $35
per MW while the ISO-NE emergency program offers roughly $80 per MW. Some of the responses we
received regarding this included:
o “[The ISO-NE program] is much higher paying, … [large C&I customer] costs per shutdown are
on the order of $10,000 an hour. In a lot of cases it doesn’t really make sense for them to do a
demonstration like the National Grid one.”
o “I think the real limiting factor is the price that customers get for participating in this [Connected
Solution] demonstration. Most other peak savings programs that we've seen have [incentives]
two to three to four times higher.”
o “Given this past year, when there was only eight hours of event as opposed to the 20, I think
that customers might be somewhat surprised with the payments that they ended up getting,” he
said. “[The incentives] are the value driver for them, but …we saw a lot of people not
participate in the demonstration because the value drivers weren't there.”
o “When we bid on this [Connected Solution demonstration] originally, we kind of flipped a coin on
whether we should pursue it or not, because it just really wasn't a very lucrative demonstration.
We elected to go with it anyway … But if you just compare all the programs across the country,
the payouts were definitely on the lower side.10”
More frequent load curtailments compared to the ISO-NE program: “[The ISO-NE program] is much
higher paying and much fewer hours especially for large
commercial and industrial,” said one CSP rep. He also
said that in the last three years, the ISO-NE program
only had one control event (in August 2016). “If you're
looking at doubling the [curtailment] hours and one-
third of the payment [compared to the ISO-NE
program], participation in [the Connected Solutions
demonstration] is tough unless the customer has a
really low cost to curtail.”
Smaller C&I customers lack interval metering data: One
CSP rep noted that it was difficult for smaller C&I
customers to participate in the demonstration because
they lack interval metering. “There's no interval meter data available for … a certain level [of
customer],” he said. “Between the cost of the sales discussion, and the cost of the metering that we'd
10
We note that it is difficult to know how directly comparable the incentives being referenced are versus the demonstration and whether any variance
noted is due to the efforts targeting different outcomes. However, we believe the CSP respondent felt they were comparing programs of a similar nature to that of the Connected Solutions offer.
CSPs reported barriers to participation in the
demonstration, including lower incentives than other programs, more frequent
curtailment than ISO-NE, a lack of interval meters among smaller businesses, and low
appetite for the potential disruption of production lines

DNV GL – www.dnvgl.com February 23, 2018 Page 35
need to install to account for the fact that there's no interval data from National Grid, then it makes it
completely noneconomic to pursue those sorts of smaller customers.”
Some customers lack discretionary loads: The interviewees noted that some C&I customers, such as
hotels, have limited ability to curtail their loads.
Some customers do not want to deal with complex impacts of load reduction: One CSP rep noted that
curtailing load can create some complicated logistics which some customers might rather avoid. For
example, he described some of the decisions an industrial customer must make when contemplating a
production shift change for load curtailment: “It's going to cause me some labor issues, what do I do
with the people? Do I send them home early? Do I conduct training? Do I put in place a standby
maintenance program, so we could perform some online maintenance if we get a call?”
The inability to use backup generation: One CSP rep claimed that the demonstration disallowing the use
of backup generation was a barrier to some customer participation. “If you had a back-up generator in
the old days, you could run it … and [participants] didn't have a problem with [load curtailment],
because it did not disrupt normal operations,” he said. “This new program says: ‘No, you can't do that,
they must turn something off.’ … Turning anything off means I've changed my business behaviors for
some reason.” He also noted that the inability to use backup generation limits the amount of load
customers can curtail. “There's going to be boundaries on what you can accomplish when you can't use
generation,” he explained. “Since I can't run an alternate generation system, I've got to do a temporary
action. Those temporary actions are going to be duration and frequency limited.”
DNV GL also asked the demonstration participants whether they faced any barriers or difficulties in trying to
join the demonstration. Only one of the 13 respondents said that they did.11 This respondent said that their
organization had difficulty in figuring out the metering necessary to participate. After deliberation, including
email and telephone conversations with their CSP, the CSP visited the customer’s site and the situation was
resolved relatively quickly.
THE EFFECTIVENESS OF DEMONSTRATION MARKETING/OUTREACH
The CSPs were asked whether the demonstration introduced them to any new sales leads or helped them
expand their DR offerings to existing customers. Two of the three CSP representatives said that it did,
although these also said that the numbers of new leads and expansions of DR offerings to existing
customers were small, as discussed in more detail below. One CSP rep mentioned that the opportunity for
new leads from National Grid was limited by the fact that many of their C&I customers with discretionary
loads were already participating in the ISO-NE programs before the Connected Solution demonstration
became available. Another said that his customers were all involved in a solar balancing pilot program (in
Boston) in addition to the Connected Solutions Demonstration.
We asked the National Grid staff and the CSPs whether they were satisfied with the current level of
demonstration participation. A National Grid rep noted that as of September 2017 the demonstration had
over 20 MW of committed load curtailment, which was more than halfway towards their 2018 goal. “We’re
very confident that we’ll hit our 40-megawatt goal next summer,” he said. The CSPs had a more mixed
assessment of participation levels. One CSP rep said that there had been an inadequate number of qualified
11
It is worth noting that demonstration participants are not the best source for finding out about demonstration barriers because their very
participation suggests that the barriers they faced were not significant. Therefore, for this demonstration barriers section, the perspectives of National Grid and the CSPs are more important since they can comment on the barriers of customers who have chosen not to participate in the demonstration.

DNV GL – www.dnvgl.com February 23, 2018 Page 36
leads while another noted satisfaction with the recruitment efforts. “It exceeded our internal target I think
National Grid met their target,” he said.
A couple of the CSPs said that several sales leads from National Grid turned out to be non-qualifying for
various reasons, though this was not characterized as a major issue overall. One of the CSPs noted that
incentives provided to utility key account managers for leads that closed might have caused less ideal
candidates to be placed as a demonstration prospect. However, he also acknowledged that the sales
incentives can be very effective when combined with training on how to identify good demonstration
candidates and that ultimately it is likely to lead to a richer pool of marketable customers for him to
approach with the offer.
One CSP rep was satisfied with current level of participation, but thought that if National Grid wanted to
significantly expand the demonstration, the outreach effort
would have to increase proportionately. “We hit the minimum
[participation] requirement,” he said. “If [National Grid] wants
to dramatically increase the number of people enrolled next
year, I would say the average effort definitely needs to be
stepped up.”
The CSPs had mixed feelings about the marketing messages
that National Grid was using to recruit customers into the
demonstration. One CSP rep thought that the demonstration
might be overstating the benefit to participants of reducing
their ISO-NE ICAP tag. “That's something that really is only
the case for a small portion of customers that we've seen,” he
said. “A lot of customers just don't have that as part of what drives their utility bill.”
With one exception, National Grid staff and the CSPs reported that the current balance between the
demonstration marketing/outreach responsibilities of National Grid and those of the CSPs was effective and
fair. The lone exception indicated they could have used a little more help in getting more leads. All the
CSPs appreciated National Grid’s role of providing customers with promising load characteristics as leads.
They saw their own role as taking that lead and turning it into a demonstration participant through close
customer interaction. “[We provide] in depth conversation with the customers to see if they were in fact a
good fit for the demonstration,” said one CSP rep. “[National Grid] is not staffed for outreach and spending
a lot of time talking to people,” said another. The outreach approach resulted in nine of thirteen participants
hearing about the demonstration mostly from their National Grid Representative (69%). Two participants
said they heard about the demonstration internally within their organization (from corporate staff), and one
each heard about the demonstration from their CSP (with whom they were already enrolled in another
program).
4.3.4 Demonstration Enrollment
Figure 15 illustrates the demonstration enrollment process as described by National Grid and CSP
representatives. The process is fairly standard and includes a contracting phase, AutoGrid enrollment stage,
and onboarding effort followed by establishing a system to access the customer demand data. While these
steps are standard, some enrollments have additional activities. These include instances where some CSPs
had to install additional metering to give customers real-time visibility on their usage patterns and one did a
“dispatch readiness test” using a controlled environment to test the customer’s curtailment capabilities.
The demonstration met the participation goal for 2017
with a good balance of outreach between National
Grid and the CSPs. However, market messaging and leads
provided were noted as possible areas for
improvement to help meet 2018 goals.

DNV GL – www.dnvgl.com February 23, 2018 Page 37
Figure 15: Reported Enrollment Process
When asked about the effectiveness of the demonstration enrollment process, National Grid staff observed
that the demonstration got a later start than they had originally planned for various reasons, which reduced
the amount of time that the utility staff and the CSPs could recruit customers into the demonstration. For
this reason, the CSPs successfully lobbied National Grid to extend the sales period in summer 2017. Besides
this late start, the demonstration enrollment process also received mixed reviews from National Grid and the
CSPs. A National Grid rep described it as “clunky” since it required CSPs to upload customer data to the
AutoGrid platform in a very specific CSV file format.
We asked demonstration participants and CSPs to rate their satisfaction with the demonstration enrollment
process using a five-point satisfaction scale where five indicated “very satisfied” and one indicated “very
dissatisfied.” These results and the reasons for ratings of three or less are provided in the figure below.
CSP
Satisfaction on 1 (very dissatisied) to 5 (very satisfied) Scale
13 respondentsAverage rating 4.7One 3 rating, who indicated “[The contract] was completely devoid of any specifics about financial incentives and things like that. I remembered thinking that it should have been more specific.”
3 RespondentsAverage rating 3One 3 rating, who indicated “The process of uploading customers into the system seemed cumbersome,” One 2 rating, who indicated “I think the AutoGrid folks just weren't set up until late in the game.”
Partic-ipants

DNV GL – www.dnvgl.com February 23, 2018 Page 38
4.3.5 Load Curtailment
National Grid staff and the CSP representatives discussed how the load curtailment process worked with us.
According to the interviewees, AutoGrid was responsible for deciding whether to initiate a load curtailment
event. If its monitoring of the ISO-NE system data indicated a need for curtailment, it used the AutoGrid
system to notify the CSPs by 4:00 PM that it would call a load curtailment event on the following day. The
CSPs would then be responsible for notifying their customers of the upcoming event, which is performed by
both email and phone with multiple contacts at each site. If, on the following morning, system conditions no
longer justified a load curtailment, the event would be cancelled by 9:00 AM. If the curtailment event was
going ahead, as planned, the customers would receive a confirmation by 11:00 AM. The interviews also
revealed that after the load curtailment events, the CSPs were responsible for telling their customers how
they performed. During the period evaluated, there were two events cancelled; one on July 12th and one on
August 21st.
Consistent with the operation described by the CSPs and
National Grid, all twelve participants recalled receiving the
notification for events12, with all but one indicating notification
was received a day in advance through such means as phone
calls, text messages and emails. The other respondent
thought the notifications came 5-10 minutes before the event
(this respondent may have confused the Connected Solutions
demonstration with the ISO-NE DR program). All 12 reported
that their organizations reduced power in response to the
notifications, based on their power reduction plans.
The National Grid and CSP interviewees observed that a large percentage of customers are curtailing their
loads manually rather than using automated controls. However, one CSP rep said that this was only
because it was the first year of the demonstration and that his company was pushing to get most of their
customers set up for automatic curtailment.
The figure below summarizes participant responses when asked whether they received advice on how to
reduce their power during periods of peak electricity usage.
Figure 16 summarizes the load-curtailment activities reported by demonstration participants. The most
common activities for reducing load included production line and air conditioner shutdowns followed by
lighting. Interestingly, one customer reported using backup power, which the demonstration technically
12
The respondent pool for the load curtailment questions dropped from 13 to 12 because one participant said that they had signed up for the
demonstration in mid-August, after the last event was called. Therefore, this respondent could not provide any information on the notification process.
The use of multiple communication mediums and
more than one contact at each site was effective in
providing sufficient time for participants to respond to the
events called.
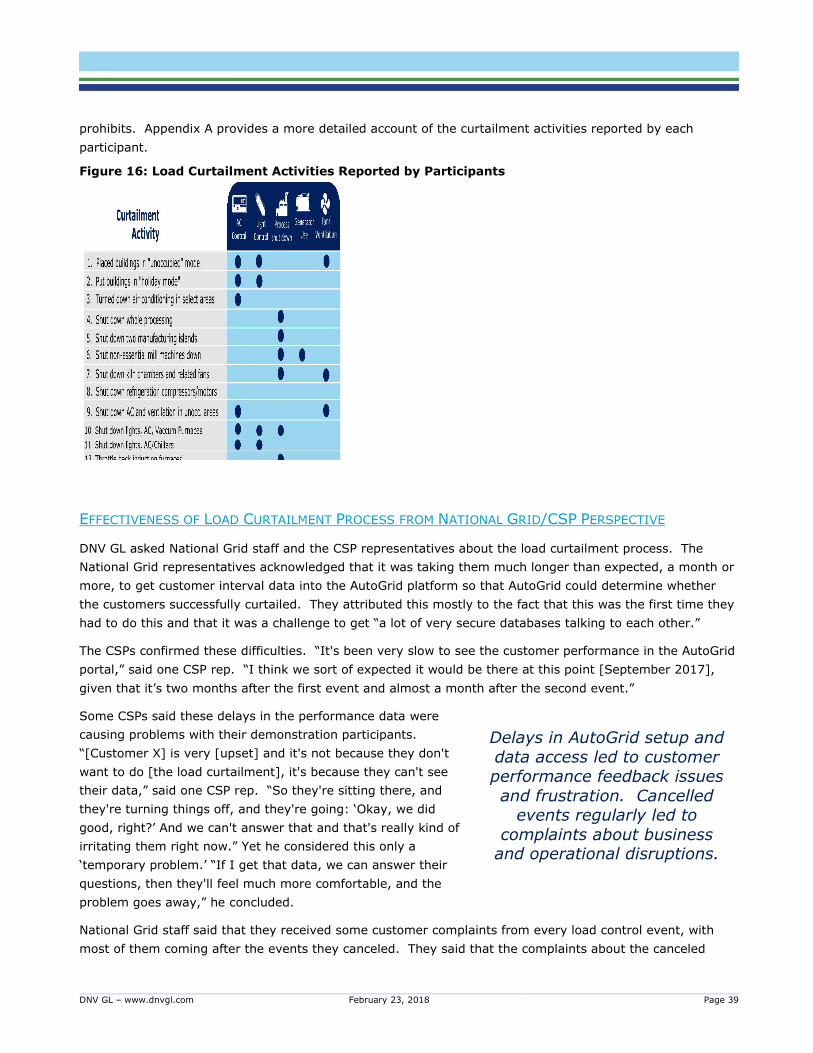
DNV GL – www.dnvgl.com February 23, 2018 Page 39
prohibits. Appendix A provides a more detailed account of the curtailment activities reported by each
participant.
Figure 16: Load Curtailment Activities Reported by Participants
EFFECTIVENESS OF LOAD CURTAILMENT PROCESS FROM NATIONAL GRID/CSP PERSPECTIVE
DNV GL asked National Grid staff and the CSP representatives about the load curtailment process. The
National Grid representatives acknowledged that it was taking them much longer than expected, a month or
more, to get customer interval data into the AutoGrid platform so that AutoGrid could determine whether
the customers successfully curtailed. They attributed this mostly to the fact that this was the first time they
had to do this and that it was a challenge to get “a lot of very secure databases talking to each other.”
The CSPs confirmed these difficulties. “It's been very slow to see the customer performance in the AutoGrid
portal,” said one CSP rep. “I think we sort of expected it would be there at this point [September 2017],
given that it’s two months after the first event and almost a month after the second event.”
Some CSPs said these delays in the performance data were
causing problems with their demonstration participants.
“[Customer X] is very [upset] and it's not because they don't
want to do [the load curtailment], it's because they can't see
their data,” said one CSP rep. “So they're sitting there, and
they're turning things off, and they're going: ‘Okay, we did
good, right?’ And we can't answer that and that's really kind of
irritating them right now.” Yet he considered this only a
‘temporary problem.’ “If I get that data, we can answer their
questions, then they'll feel much more comfortable, and the
problem goes away,” he concluded.
National Grid staff said that they received some customer complaints from every load control event, with
most of them coming after the events they canceled. They said that the complaints about the canceled
Delays in AutoGrid setup and data access led to customer performance feedback issues and frustration. Cancelled
events regularly led to complaints about business
and operational disruptions.

DNV GL – www.dnvgl.com February 23, 2018 Page 40
events mostly concerned annoyance that the customer had made changes to the operations. “They’ve
called off their crew … and then the day of comes, and they have to go back to their crew … and say: ‘Oh,
just kidding. There’s no event today’,” said one National Grid rep.”
Two of the CSPs reported receiving similar complaints about the canceled events from their customers. “It's
confusing when you send the customer one thing the day of and then send the customer another thing the
day after,” said one CSP rep. “The very first event was canceled the day of … and the customers didn't
know that that was an option, because that was not part of the original description of the plan, and we had
some folks that were quite upset about that,” another CSP rep mentioned. However, one CSP rep said that
his customers did not even notice the canceled events.
One CSP also faulted National Grid for changing the curtailment periods over the course of the
demonstration. “They were originally billed as 1:00 p.m. to 5:00 p.m., that was changed from 11:00 a.m.
to 5:00 p.m., and we settled at 2:00 p.m. to 5:00 p.m.” he said. “That was a moving situation.”
We asked the three CSPs to rate their satisfaction with this control event notification process using the five-
point satisfaction scale described above. Two of the three CSPs were satisfied (4 or 5 satisfaction ratings)
with the notification process with the third only giving a satisfaction rating of 2. Some of their comments
explaining these satisfaction ratings included:
[Satisfaction rating of 5] " It is the most common [notification] method and it works.”
[Satisfaction rating of 4] "I think on our end, it's been fine. I'd give our end 5 stars. I think on the
National Grid end, 3 stars just for the delays with figuring out the AutoDR piece, that notification piece
from National Grid to us. And … the sort of cancellation seems like it was unclear towards the middle of
the season if they were going to continue to be used or not. And … generally just calling events towards
the middle of the season when it's even clear that the peak was not going to be hit again.”
[Satisfaction rating of 2] “The very first event was canceled the day of … and the customers didn't know
that that was an option, because that was not part of the original description of the plan, and we had
some folks that were quite upset about that. … And then as we moved into the season, it became
apparent that the hours of calls were going to change. They were originally billed as 1:00 p.m. to 5:00
p.m., that was changed from 11:00 a.m. to 5:00 p.m., and we settled at 2:00 p.m. to 5:00 p.m. and
that was a moving situation … By the time we got to the middle of July … those on-the-fly tweaks were
behind us. But all in all, you have to give it bad marks, because when we sold the product to the
customer, we didn't sell it that way.”
EFFECTIVENESS OF THE LOAD CURTAILMENT PROCESS FROM THE PARTICIPANT PERSPECTIVE
DNV GL asked the demonstration participants a series of questions about their load curtailment experiences.
These results are summarized in Figure 17. Curtailment request compliance, curtailment difficulty and
serious business disruptions due to curtailment were all rarely reported with one participant reporting such
issues in each instance. In addition, almost all (10 of 12) participants said they were aware of instances in
which National Grid canceled planned events on the morning of the event due to an updated forecast.
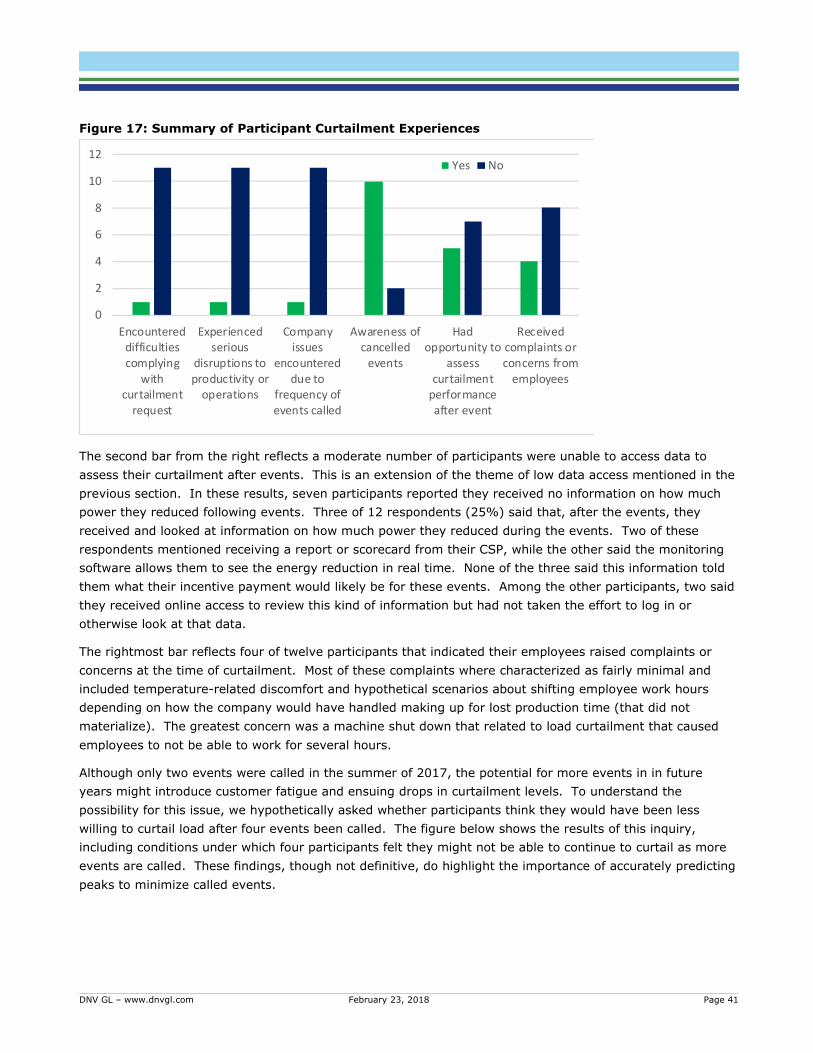
DNV GL – www.dnvgl.com February 23, 2018 Page 41
Figure 17: Summary of Participant Curtailment Experiences
The second bar from the right reflects a moderate number of participants were unable to access data to
assess their curtailment after events. This is an extension of the theme of low data access mentioned in the
previous section. In these results, seven participants reported they received no information on how much
power they reduced following events. Three of 12 respondents (25%) said that, after the events, they
received and looked at information on how much power they reduced during the events. Two of these
respondents mentioned receiving a report or scorecard from their CSP, while the other said the monitoring
software allows them to see the energy reduction in real time. None of the three said this information told
them what their incentive payment would likely be for these events. Among the other participants, two said
they received online access to review this kind of information but had not taken the effort to log in or
otherwise look at that data.
The rightmost bar reflects four of twelve participants that indicated their employees raised complaints or
concerns at the time of curtailment. Most of these complaints where characterized as fairly minimal and
included temperature-related discomfort and hypothetical scenarios about shifting employee work hours
depending on how the company would have handled making up for lost production time (that did not
materialize). The greatest concern was a machine shut down that related to load curtailment that caused
employees to not be able to work for several hours.
Although only two events were called in the summer of 2017, the potential for more events in in future
years might introduce customer fatigue and ensuing drops in curtailment levels. To understand the
possibility for this issue, we hypothetically asked whether participants think they would have been less
willing to curtail load after four events been called. The figure below shows the results of this inquiry,
including conditions under which four participants felt they might not be able to continue to curtail as more
events are called. These findings, though not definitive, do highlight the importance of accurately predicting
peaks to minimize called events.
0
2
4
6
8
10
12
Encountereddifficultiescomplying
withcurtailment
request
Experiencedserious
disruptions toproductivity or
operations
Companyissues
encountereddue to
frequency ofevents called
Awareness ofcancelled
events
Hadopportunity to
assesscurtailment
performanceafter event
Receivedcomplaints orconcerns from
employees
Yes No

DNV GL – www.dnvgl.com February 23, 2018 Page 42
Willingness to curtail beyond 4 events, had they been called
7 participants would have curtailed at same level, 4 were ambivalent. The 4 ambivalent participants reported: “Mandates for production probably would have introduced needed adjustments to keep production to a certain level.”“It would have depended on the timing of those other events...for instance, 5 days consecutive would be a problem.”“People were unhappy when they fell behind on orders. Maybe it pays in normal times but during busy times, it's less convenient.”“The [up-front] payment was fixed, so the more we have to do it, the less we get paid per event. Our payment was $5,000 for the season. As you get more, are you willing to do it for $500 or less? Probably no. If we had a higher rate per event or added rate...we'd be more likely to do it.”
Partici-pants
4.3.6 Financial Incentives
Since the interviews took place in September and demonstration incentive payments were scheduled for
October, the CSPs nor National Grid could say much about the incentive payment process, though we did
discuss whether the demonstration incentive levels were adequate to encourage participation. National Grid
staff thought the incentives were adequate based on their
experience that “no customer asked for more incentives to
close the deal.”
However, all the CSPs said that the demonstration incentives
levels should increase. As discussed above, they claimed that
the Connected Solution incentives were much lower than those
from the ISO-NE program and other DR programs. They also
believed that increasing incentive levels would expand
demonstration participation. “I think there's a lot more of a
market out there for more peak saving if the incentive level is
increased” said one CSP rep. Finally, they noted that lower
incentives limited their own activities. “When the incentives are low, that means that the portion that we
can use to recoup our expenses is low as well,” said one CSP rep.
One CSP representative wished that the demonstration could provide more clarity on the CSP’s expected
share of the incentive dollars. “[They need to] ensure that we do get compensated for the recruitment, the
on-boarding, the dispatching, and the follow-up and performance coaching that we do,” he said. “In the
model that was proposed by National Grid, it was really unclear exactly what the incentive was supposed to
be for CSPs that actually recruit customers.”
As noted, some CSP representatives thought that the demonstration’s potential benefits from reducing
customer’s ICAP obligations were exaggerated. “I think [the program manager] overestimated the number
of customers in this pool that were on an ICAP pass-through and therefore, had the potential to reduce their
ICAP costs by reducing their load during ICAP hours,” one CSP representative said. While he noted that it
The CSPs suggested higher incentive levels can be expected to broaden
participation. Some also noted that ICAP reductions
due to the demonstration did not transpire among 2017 participants, despite some expectations that it would.
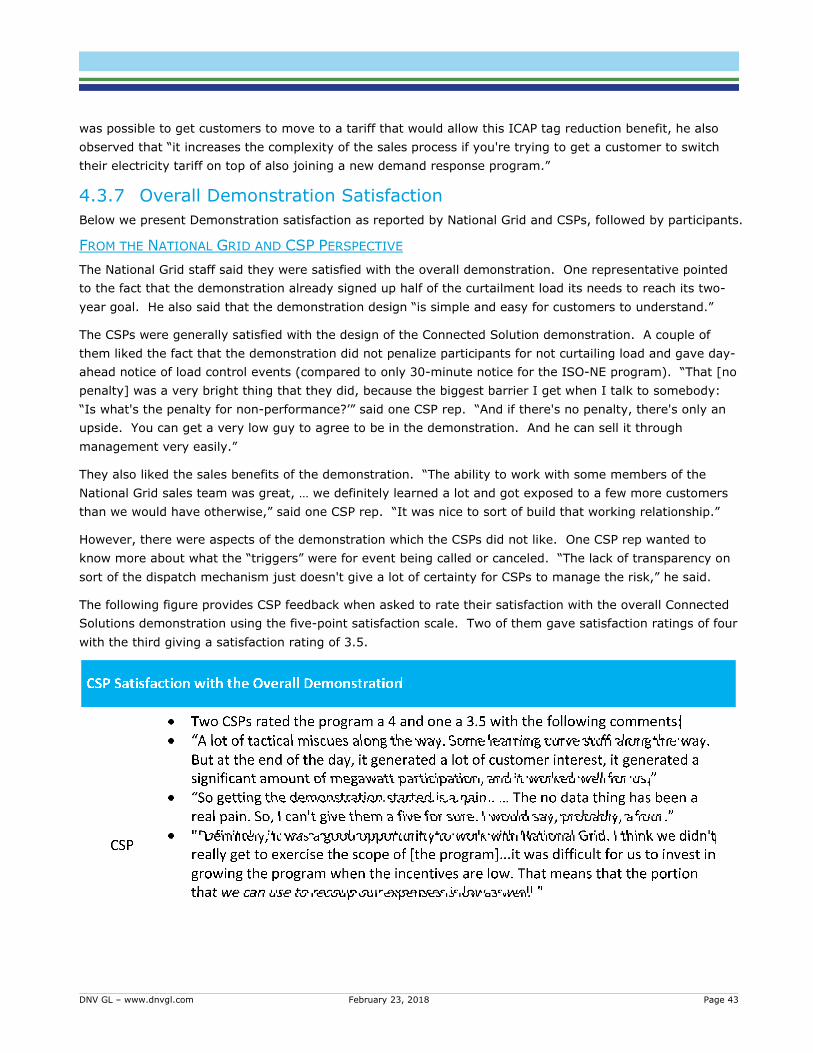
DNV GL – www.dnvgl.com February 23, 2018 Page 43
was possible to get customers to move to a tariff that would allow this ICAP tag reduction benefit, he also
observed that “it increases the complexity of the sales process if you're trying to get a customer to switch
their electricity tariff on top of also joining a new demand response program.”
4.3.7 Overall Demonstration Satisfaction
Below we present Demonstration satisfaction as reported by National Grid and CSPs, followed by participants.
FROM THE NATIONAL GRID AND CSP PERSPECTIVE
The National Grid staff said they were satisfied with the overall demonstration. One representative pointed
to the fact that the demonstration already signed up half of the curtailment load its needs to reach its two-
year goal. He also said that the demonstration design “is simple and easy for customers to understand.”
The CSPs were generally satisfied with the design of the Connected Solution demonstration. A couple of
them liked the fact that the demonstration did not penalize participants for not curtailing load and gave day-
ahead notice of load control events (compared to only 30-minute notice for the ISO-NE program). “That [no
penalty] was a very bright thing that they did, because the biggest barrier I get when I talk to somebody:
“Is what's the penalty for non-performance?’” said one CSP rep. “And if there's no penalty, there's only an
upside. You can get a very low guy to agree to be in the demonstration. And he can sell it through
management very easily.”
They also liked the sales benefits of the demonstration. “The ability to work with some members of the
National Grid sales team was great, … we definitely learned a lot and got exposed to a few more customers
than we would have otherwise,” said one CSP rep. “It was nice to sort of build that working relationship.”
However, there were aspects of the demonstration which the CSPs did not like. One CSP rep wanted to
know more about what the “triggers” were for event being called or canceled. “The lack of transparency on
sort of the dispatch mechanism just doesn't give a lot of certainty for CSPs to manage the risk,” he said.
The following figure provides CSP feedback when asked to rate their satisfaction with the overall Connected
Solutions demonstration using the five-point satisfaction scale. Two of them gave satisfaction ratings of four
with the third giving a satisfaction rating of 3.5.

DNV GL – www.dnvgl.com February 23, 2018 Page 44
FROM THE PARTICIPANT PERSPECTIVE
We asked the demonstration participants to rate their satisfaction with their CSPs, with the National Grid
staff (if they had any interaction with them) and with the demonstration overall. Participants were largely
satisfied with their CSP as evidenced by 8 of 10 providing a rating of either 4 or 5. The remaining two
participants gave satisfaction ratings of 3 and 2 respectively. The comments from these dissatisfied
respondents are summarized in the figure below.
Participant Satisfaction with the Overall Program
Eight of ten participants were satisfied with their CSPs (4 or 5 satisfaction ratings). The remaining two participants gave satisfaction ratings of 3 and 2, and noted:[Satisfaction rating of 3] “[There was a] lack of follow-up and lack of discussion with [CSP] after commitment to the program. Also, our monitoring device wasn't working at one point The electronics board in the National Grid meter failed. The company [CSP] selected to do field service asked my company to call my National Grid representative to help find out who was the right person to help push it along. It's odd they couldn't coordinate on their own.”[Satisfaction rating of 2] “It seems like there's been some confusion with the communications and we didn't get the curtailments we are looking for. I received an email last week from [CSP] that said there was some paperwork error made with the contract, and that we weren't properly enrolled. I was going to get a paperwork correction, a new version. And none of that has happened.”
Partici-pants
Twelve of the participants provided satisfaction ratings for the Connected Solutions demonstration as a
whole. Ten of these (83%) were satisfied with the demonstration (satisfaction ratings of 4 or 5). These
results and the reasons provided by the two unsatisfied participants are provided inthe figure below.
Participant Satisfaction with the Overall Demonstration
Ten of twelve participants were satisfied with the demonstration overall (4 or 5 satisfaction ratings). The remaining two participants gave satisfaction ratings of 3 and 2, and noted:[Satisfaction rating of 3] “Communication with National Grid. We never get any communication with them. It's hard to see what's going on. The problem is you have no idea. Nobody ever gets back to you.[Satisfaction rating of 2] “Lack of events, and enrollment paperwork issues. Lack of communication overall.”
Partici-pants
4.3.8 Scalability
We asked CSP representatives whether the current demonstration participants are representative of the
types of customers who would likely participate in a full-scale program. Two of them did not think there was
any difference between the demonstration participants and the participants likely to be encountered in a full-
scale program. “[The demonstration participants] are the regular kind of people we go after every day,” one
of these CSP representatives said.

DNV GL – www.dnvgl.com February 23, 2018 Page 45
However, one CSP rep claimed that the current demonstration participants were mostly customers who have
“a low enough cost to curtail that they can participate in a demonstration like this.” He said that for the
demonstration to expand, it would need to increase the incentives. “I think there definitely are more
megawatts out there,” he said, “but they require a higher incentive payment to reach.”
4.3.9 Impacts on ISO-NE DR Programs
DNV GL asked the CSPs how many of their customers participating in Connected Solutions were also
participating in the ISO-NE DR program. One CSP estimated it was about 70%, another estimated 40-50%,
and the third said that none of their customers were participating in the ISO-NE DR program. Four of twelve
participants reported that they actively participated in another demand response program during their
participation in the Connected Solutions demonstration. Of these four, three said that they had participate
in the ISO-NE DR program and one in a Metropolitan Area Planning Council effort. Two more respondents
said they signed up for the ISO New England, but not in time to experience both initiatives simultaneously.
An additional six said they participated in the ISO New England program (or described one fitting the
description) a few years ago, but that that program had been discontinued.
Involvement with the ISO-NE DR programs influenced CSP perspectives on whether the Connected Solution
demonstration was encouraging new DR practices. One CSP, who estimated that around 70 percent of their
customers were involved with the ISO-NE DR program, thought that the ISO-NE DR program’s higher
incentives and less frequent curtailments meant that if customers were going to pursue DR, they would go
to that program first. “If they're not already making the decision to do [the ISO-NE program],” he said, “it
would be surprising to me if [the customer] decides to change their mind because of the lower value option
[of the Connected Solutions demonstration].”
However, another CSP rep reported that none of his customers were participating in the ISO-NE DR program,
even though some of them had significant load curtailment potential. He was surprised by this, especially
when he compared it to his experience with ISO DR programs in other states or regions, like California, New
York, and PJM. “In general, demand response is underutilized in the ISO New England territory,” he
concluded. “And the fact that National Grid is making an effort to go visit customers and see them and get
them enrolled in their effort is driving [DR] adoption.”
One CSP rep did think that customers participating in both the Connected Solutions and ISO-NE program
were likely to curtail more than if they only participated in the ISO-NE program. “They're contracted to
participate in the [Connected Solution] demonstration and that demonstration expects them to show up for
more hours, so, yes, I think that they are incented to do more,” said one CSP representative. However, he
thought the number of C&I customers in this situation was limited. “I think it only works for a pretty small
subset of customers where that incremental money is worth the much more incremental dispatch likelihood,”
he explained.
As noted, only three participants said they were participating in both ISO-NE and Connected Solutions in
2017. Two of these said that they enrolled in ISO-NE after enrolling in Connected Solutions. The other
stated that positive experience with ISO-NE did influence their decision to enroll in Connected Solutions.
The three Connected Solutions demonstration participants also participating in the ISO-NE DR program said
that they had positive experiences in maximizing their revenue potential through dual participation.

DNV GL – www.dnvgl.com February 23, 2018 Page 46
4.3.10 Suggested Recommendations for Demonstration Improvements
We asked National Grid, the CSPs and participants for demonstration improvement recommendations. The
most commonly provided suggestion themes are summarized by source in Figure 18 below. Following this
figure, we provide some additional detail on each. Appendix B contains a more detailed accounting of all
responses received, including verbatim quotes when appropriate.
Figure 18: Summary of Suggested Demonstration Improvements
As suggestions were provided, many respondents provided additional thoughts on their areas of
improvement. Below is a bulleted discussion that further expands each suggestion presented in the
summary above.
Provide more timely data on customer load curtailment performance: This was the most significant
source of dissatisfaction among the CSPs and was the often-cited suggestion by participants as well.
The core issue is the inability of the 2017 demonstration to provide timely information on load
curtailment performance for CSP use and customer information.
Improve the forecasting of load control events: All the CSPs were disappointed that the demonstration
was calling load control events on days when the forecasted load did not seem to be near the system
peak, cancelling events, and missing the ICAP system peak (which occurred on June 13 in 2017).
Get the demonstration started earlier: A couple of the interviewees said that an earlier start to the
demonstration would give National Grid account representatives and the CSP sales representatives more
time to recruit customers into the demonstration. National Grid has already adopted this
recommendation by starting the next demonstration cycle in October rather than in late January.

DNV GL – www.dnvgl.com February 23, 2018 Page 47
Make the enrollment process more user-friendly: As discussed previously, the 2017 demonstration
required the CSPs to upload their enrolled customer information in a “clunky” CSV format that was
susceptible to data entry errors. Multiple interviewees suggested that this process could be made easier
to use.
Increase the demonstration incentive levels: As discussed above, all CSP representatives said that the
demonstration incentive levels should increase to make the incentive levels closer to those of other load
curtailment programs and increase participation. This was echoed by some participants, one of whom
indicated: “[the incentive] is peanuts compared to the savings we'll get through that [ICAP]. So, the
payment for this program is not enough to motivate.”
Be more transparent about the demonstration’s criteria for scheduling and cancelling events: The CSPs
suggested that there could be benefits to both participants and CSPs if they knew more about what load
conditions would trigger a demonstration curtailment event. Some customers likewise indicated it would
have been good to know why events were cancelled.
More demonstration engagement with participating customers: Suggestions in this area was primarily
from participants and included suggestions to have more events to keep customers familiar with the
demonstration and more information on why load was needed.
Improve the content of the demonstration flyer: As discussed in the demonstration Information section,
the CSPs thought that the demonstration information could better describe how customers would be paid,
how much money they could receive, and the ancillary benefits of participation such as ICAP tag
reduction. In addition, maybe participants indicated that they would have benefited from more
information on the amount of payment they might see for the savings produced.
Provide more customer education: CSPs indicated that many customers lacked basic knowledge of how
the demonstration worked and some of the participant responses confirmed this. While some of the
previous suggestions (calling more control events, improving the demonstration flyer) should improve
customer knowledge, one CSP thought that a pre- demonstration webinar for enrolled customers would
be very helpful preparation for the next demonstration cycle.
Improve the process for CSPs updating the sales pipeline: All three CSPs said that clearer guidelines or
templates for reporting sales information would benefit them and National Grid. The National Grid staff
also indicated that they would like to see more current and complete sales pipeline information.
Clearer responsibilities between organizations: This issue cut two directions. As mentioned in the
demonstration Communication section, a couple of CSP representatives said that it would have been
helpful to their outreach efforts to have more specific information up front as to which National Grid key
account managers were responsible for which customers. In addition, some participants suggested
some confusion over who they should work with in their demonstration engagement (National Grid or
the CSP)
More information on what customers can expect to be paid: A couple of the CSPs and some of the
participants said that the demonstration needed to be able to provide better information on what
participants could expect to be paid, even if this was a preliminary estimate. CSPs especially thought
this was important for recruiting new participants into the demonstration, since they needed to know, at
a high level, whether the financial benefits of load curtailment would outweigh the costs.

DNV GL – www.dnvgl.com February 23, 2018 Page 48
14.5
12.3
20.6
15.9
12.8
20.0
0.0
5.0
10.0
15.0
20.0
25.0
Hybrid Baseline(Program)
Site Level Regression Committed Capacity
MW Mean Hourly Aggregate MW
Event 1 Event 2
5 CONCLUSIONS, RECOMMENDATIONS AND CONSIDERATIONS
This section presents conclusions, recommendations and considerations for future demonstration changes.
5.1 Conclusions
The Connected Solutions demonstration was designed by National Grid to develop a qualified contractor
network to help C&I customers control their peak demand in Massachsuetts. The demonstration rests on an
AutoGrid DRMS platform that predicts the expected peak day, dispatches day ahead event notification,
compiles power data, and calculates participant curtailment levels using a hybrid baseline. This baseline
approach used the higher curtailment provided by either an adjusted or undadjusted 10 of 10 baseline for
performance payments. The 10 of 10 baseline is an average for each interval across the 10 most recent
days that are eligible for inclusion in the baseline. This baseline adjusts to the load prior to the event to
which they are being applied. The demonstration only pays based on performance calculated from the
hybrid baseline and does not have penalties for non-performance.
The AutoGrid system is intended to minimize the number of events forecasted while hitting the ISO-NE peak
day. The demonstration allows customers to stack the economic benefits of the Connected Solutions
demonstration and National Grid bill demand charge reductions with benefits related to or available through
ISO-NE. These benefits include ICAP charge reductions, ISO-NE Forward Capacity Market capacity payments,
and, starting in 2018, participation in the new energy and reserves market.
The demonstration is a two year effort with a goal to enroll 40 MW of curtailable load by the end of 2018.
National Grid was able to successfully enroll ninety nine accounts in the demonstration in 2017, representing
over 20 MW of committed curtailable load. For this impact evaluation, data were available for the two event
days.
5.1.1 Impact Conclusions
The impact portion of this analysis includes an impact analyisis – an estimate of curtailed load – and an
assessment of the methods for estimating curtailed load. DNV GL validated National Grid load reduction
estimates using final data
provided by National Grid.
We reproduced results from
the hybrid baseline used by
the demonstration as well
as a site-level regression-
based load reduction
estimate. The figure to the
right shows the average
hourly MW load reduction
based on the hybrid
demonstration baseline and
the site-level regression
baseline. The righthand
bars show the committed
capacity of those
particpants included in each event. The hybrid baseline used by the demonstration produced load reduction

DNV GL – www.dnvgl.com February 23, 2018 Page 49
estimates that are approximately 25% lower than committed capacity. The regression baseline produces
load reduction estimates that are another 15 to 20% lower than the hybrid baseline estimates. The
flexibility of the hybrid baseline avoids negative adjustments for individual customers but comes at the cost
of a potential of upward bias in the aggregate hybrid load reduction estimate. In contrast, the regression
baseline is an unbiased estimate of load reduction given the schedule and weather data available for
inclusion in the regression. The regression baseline could have a downward bias if there are drivers of high
system load days that are not controlled for in the regression.
Other conclusions include:
The validation of the hybrid baseline highlighted a need for more clear rules with regards to baseline
calculation and day eligibility. It is essential that all parties know what days are eligible for inclusion
in a baseline and which are not. Days to drop might include days with participation in an ISO-NE
emergency event, last minute event cancellations and/or data quality or sufficiency concerns.
The Connected Solutions hybrid baseline offers a generous, low risk baseline for customers and
implementers. With the addition of capacity payments, this demonstration should be attractive to
customers. In short, the hybrid baseline offers the greatest chance for ongoing participation from
both customers and vendors.
Clear messaging with regards to the potential for late cancellation of proposed events will make it
less likely cancelled event will affect baseline process. It could also have the effect of dampening
potential strategic load shifting into the adjustment period.
Divergence of performance from capacity committment is not uncommon in DR programs that are
more established than the Connected Solutions Demonstration. It can be difficult for customers new
to DR to develop reasonable estimates of load reduction in advance, especially with weather
correlated loads. There does not appear to be clear disincentive in the demonstration payment
scheme that will discourage over-estimating committed load. Despite its innaccuracy, the aggregate
committed capacity still allows for an ad hoc adjustment that provides a closer estimate of overall
load reduction for the demonstration.
The impact evaluation also raises the question as to whether the hybrid baseline used for the
demonstration provides an accurate estimate of load reduction in itself. The hybrid baseline
minimizes potential negative effects of an adjusted baseline on individual customers. While this
approach supports customer satisfaction, it also exacerbates what could already be an upward bias
in the adjusted baseline. This might be a reasonable price to pay with respect to cost effectiveness
if it attracts customers. Aggregate committed load reduction expectations can be derated by 25 to
35% to provide preliminary forecast of expected load reduction. The hybrid baseline will produce
upwardly biased estimates of load reduction. A comparison to the regression results or the
unadjusted 10 of 10 baseline will provide a more conservative estimate of actual reduction.
A day ahead initiative with an adjustment has the potential to encourage strategic load shifting to
improve load reduction performance. This will further distort the true load shedding value of the
demonstration. The advantages of day ahead notification to the customer need to be balanced with
the potential costs to the demonstration of inflated curtailments and inaccurate evidence of true load
reduction.
DNV GL – www.dnvgl.com February 23, 2018 Page 50
5.1.2 Process Conclusions
On the process side, we conclude that the Connected Solutions demonstration has a good general design
with areas that performed very well. By most accounts, participants received customized services that fit
their unique opportunities and the planned curtailment included a diverse set of end uses and systems. All
participants reported curtailing their load when asked to do so, with only minimal reports of employee
complaints or disruptions to business operations. Collaboration and communication between National Grid
and the CSPs was largely characerized as very good, with CSPs particularly appreciative that National Grid
staff were open to "on-the-fly tweaks” of demonstration design and delivery. The system of providing event
notification was reliable and worked well. The 2017 effort met its participation goal in terms of the number
of customers signed up and committed load curtailment, which appears to have been achieved with a good
balance of outreach between CSPs and National Grid. There is also plenty of evidence that customers are
generally accepting the solution that is being offered in Connected Solutions.
Despite the many things the demonstration is doing well, there are elements of the demonstration that
present opportunities for improvement. Most of these concerns center around problems observed in
demonstration delivery. There are three primary findings that rose to the top in this regard:
There were long delays in providing CSPs and participants with data on how they performed during
the control events, which also delayed incentives payments to participants;
There were two canceled load events and the missing of the system peak, which occured in June,
very early in demonstration deployment. This denied some participants the benefits of reductions
in their ICAP tags;
Demonstration information could better describe when events might be called, how customers
would be paid, how much money they could receive, the possiblilty of events being cancelled and
the ancillary benefits of participation such as ICAP tag reduction.
Although there were several other demonstration issues noted, we regard them as reasonable given the
short time frame to launch the demonstration before the summer of 2017 and this being the first year of the
Connected Solutions demonstration. Some of these additional issues include:
CSPs indicated that they considered demonstration incentives to be low and that they might inhibit
National Grid’s ability to grow the demonstration. Because National Grid missed the peak day this
summer (June 13), the reduction of future ICAP payments was also lost.
In contrast to this perspective, the Connected Solution demonstration should provide a second
opportunity to be paid to supply capacity for customers already in the ISO-NE FCM or an
introduction to the process that could allow future involvement in the FCM. Missing out on the ICAP
reduction is an expected risk of the demonstration. Finally, some customers indicated that they
preferred fewer events because it made the effective capacity payment per event higher. For them,
the performance payments were not sufficient to justify the hassle of reducing load.
The enrollment process, while well established and understood, was noted to have a very specific
format for uploaded data that is difficult to adhere to.
Guidance and expectations to track marketing leads and sales pipeline were not clear or effective,
resulting in incomplete or outdated information on customers and their status in the recruitment
funnel.

DNV GL – www.dnvgl.com February 23, 2018 Page 51
Participants are very satisfied with the demonstration, with average satisfaction ratings above 4 (out of a 1-
5 scale) in all demonstration elements inquired about. In contrast, the CSPs were less satisfied with the
demonstration with an average satisfaction rating of 3.8 within a range of 3.5-4. This difference is likely due
to the fact that the CSPs were aware of logistical difficulties which were invisible to most participants. In
addition, all the CSPs were participating in many other DR programs besides the Connected Solution
demonstration. This broader experience made them aware of comparative deficiencies (e.g., incentive
levels) in the Connected Solution demonstration. Unfortunately, due to the timing of this study, we were
not able to inquire with participants about their satisfaction with the incentives provided for their summer
curtailment efforts.
Figure 19: CSP and Participant Demonstration Satisfaction
Note: The participant sample sizes were 13 for the demonstration information and enrollment process satisfaction questions, 12 for the control event notification process and overall demonstration satisfaction questions, and 10 for the CSP performance satisfaction question.
5.2 Recommendations and Considerations DNV GL offers the following recommendations and considerations to improve Connected Solutions’ 2018
demonstration offering. Connected Solutions customers, in aggregate, did not deliver the committed load
reduction in the 2017 season. This needs to be recognized both from a system operations perspective and
from a cost-effectiveness perspective. It is common for there to be a rule of thumb derating process for
demand reduction for internal program use or system operations personnel. Demonstration incentive
adjustments may also spur curtailment performance to bring it in line with capacity commitments. We also
acknowledge that this is a new demonstration, and delivered load reduction may improve. However, the
challenge of assessing the relationship between demonstration activity and actual system demand relief is a
defining part of demand reduction offerings. This issue drives the first recommendation provided below.
DNV GL notes that some of these activities may already be underway as part of National Grid’s ongoing
internal efforts to improve the demonstration based upon their own observations and experience.
5.2.1 Recommendations
Below are seven recommendations that rest upon the conclusions above.
4.54.7
4.44.1 4.2
3
3.7 3.8
0
0.5
1
1.5
2
2.5
3
3.5
4
4.5
5
ProgramInformation
EnrollmentProcess
Control EventNotification
Process
Performanceof the CSPs
OverallProgram
Participant (10-13) CSP (3)

DNV GL – www.dnvgl.com February 23, 2018 Page 52
1. Given the divergence between delivered load reduction and committed capacity at the customer
level, National Grid should develop a way to manage this shortfall. We recommend that National
Grid either recognize this underperformance as part of establishing a planning assumption that
reflects the difference between the reduction committed versus achieved, or consider an
adjustment to the incentive structure to bring performance and committed capacity into closer
alignment.
2. We recommend examining the root cause(s) that prevented prediction of the system peak.
Understanding this cause will enable corrections to be made before the 2018 rollout.
3. We recommend improvements to data availability for AutoGrid to calculate and provide event
performance values to customers to confirm their performance level and as a touchpoint to
foster further demonstration engagement.
4. We recommend revising demonstration supporting information to better describe how customers
will be paid, the level of incentive they can expect, the possibility of events being cancelled, and
the (potential) ancillary benefits of participation such as ICAP tag reduction.
5. We recommend revising the process for uploading data needed as part of the enrollment process
to make it more flexible and easier for CSP data submissions.
6. We recommend working with CSPs to develop a more effective system to support demonstration
management needs in terms of tracking marketing leads and the sales pipeline.
7. Recognizing that we were unable to ask participants about satisfaction with their incentive
payments due to evaluation timing, we recommend that National Grid or the vendors inquire
with participants about the sufficiency of their final 2017 incentive payments. Alternatively, DNV
GL can ask about them as part of the 2018 season evaluation, though incentive receipt would
have occurred roughly 11 months prior, if gathered this way.
5.2.2 Considerations
Below are six suggestions for National Grid consideration.
1. Consider beginning demonstration recruitment and marketing early to allow more marketing,
customer education and systematic enrollment effort than experienced in 2017. Given
demonstration complexity, we believe a longer “runway” will help support participation levels
and ease of recruitment.
2. Consider holding a pre-season webinar for enrolled participants and CSPs that reviews
demonstration operations (e.g., how and what the event notifications look like, how incentives
are calculated and provided, demonstration criteria for scheduling and cancelling events etc.), in
addition to reviewing the roles and responsibilities of National Grid, AutoGrid, and the CSPs.
3. All demand response programs struggle with the correct balance between capacity type
incentives to stimulate general participation and performance payments, perhaps including
penalties, intended to get customers motivated to perform for a specific event. In a new
initiative, such as Connected Solutions, the priority of enrolling customers has an effect on that
balance. But as long term program design is considered, the movement toward a performance
payment is sometimes necessary to ensure the long-term viability of the program. We
recommend that National Grid monitor the balance between capacity and performance payments
as the program evolves to ensure they are suitable to achieve the end goals of the program.
4. Consider the balance between customer convenience and load reduction estimation accuracy as
it pertains to time of notification. Day ahead notification provides customer convenience, while
event day notification will support a more accurate settlement baseline. This consideration may

DNV GL – www.dnvgl.com February 23, 2018 Page 53
inform how you deal with the observed challenge in the 2017 season of calling off day ahead
notifications and being able to cancel day of. National Grid could also consider offering a same
day notification option, perhaps with its own incentive structure, which would limit opportunities
for strategic load shifting.
5. In the 2017 summer season participants were offered two incentive payment options. One was
to receive the incentive directly based upon their performance while the other was to have the
incentive paid to the CSP based on the aggregate performance of a group of participants.
National Grid should consider simplifying or choosing a single incentive payment option for
participants.
6. Consider discussions with ISO-NE regarding sharing event information. The concerns related to
event days in the baseline affects them as well. The baseline used for ISO-NE emergency
events would benefit from dropping active event days in the Connected Solutions Demonstration.

DNV GL – www.dnvgl.com February 23, 2018 Page A-1
LOAD CURTAILMENT DETAILS BY PARTICIPANT APPENDIX A.
Load Curtailment Activities
We shut things off in buildings (putting buildings in "unoccupied mode" where lights are turned
off and temperature settings are different). We have a building management system schedule
and set-points for when buildings are occupied or not. Not sure which specific pieces of
equipment we curtailed in addition to that. It could have been exhaust fans.
We shut down our whole processing line during that time
Put buildings in "holiday mode" from 12-5pm (whatever the times that were requested). This
involves shutting off AC in buildings from a centralized control and having custodial staff walk
around and manually shutting off lights
We put the AC down in some areas. That was the only intentional action we took. The rest is
coincidence. Also, there was one day we could have extended production and we decided not to
because of the program.
We have a few of islands of consumption, two of which consume the most energy. Based on our
own discussions, we shut down those two manufacturing islands. Typically, it was a 4-hour
period. 1-5pm or 2-5pm. We shut down those two islands for balance of day until the following
morning. We left the administration portion of the building running just as it was
We had to shut machines down. We kept monitoring our load balance here in the mill. Kept
shutting non-essential machines down. Timing: once we hit that point in time (1-5pm), we shut
down. The turbine generator was able to keep systems functional. Not importing any power from
the grid at that time, but still running things with on-site power. Can make 3-4 MW on-site.
Our major power consumption is our kilns that run 24/7. But we can shut those fans that run
those kilns off. Choose as many as possible to turn them off. All of our drying chambers, we
turned off 10 of them. Any production, if possible, we will turn off. We reduce our power
significantly, 75-80% of load. I think it started at noon or 1 (a few minutes before), and we turn
back on after 5. No backup power
We are a cold storage warehouse. 80% of our power consumption is from compressors (large
motors). We can shut the motors down for up to 6 hours and maintain cold storage temperature.
We have solar, so we "go negative" during the events and become a net exporter. We do not use
supplementary power
We had three different locations that we were load shedding. Carefully monitor activities taking
place. Shut off extraneous HVAC equipment. A lot of it is ventilation. Some is temperature-
related. We don't have staffing to be only conditioning spaces only when occupied. We tend to
over-condition to err on the side of caution. On these days, we take the extra time to check
where there are activities scheduled. And turn those building places off. Manual - don't have
occupancy sensors for that kind of thing
Before 2pm, we shut off unused lights, unused equipment, rooftop units (AC), and the morning

DNV GL – www.dnvgl.com February 23, 2018 Page A-2
before would schedule the vacuum furnaces not to come on until after 5pm
Our maintenance staff would shut off common area lights not needed. Our engineer is able to
drop one of our chillers, shut off power to it, for a period of time. Did it during the hours
requested only
We have induction furnaces. We have to throttle them back just a handful of hours. No
supplementary power. Just have to make it up on another day

DNV GL – www.dnvgl.com February 23, 2018 Page B-1
SURVEY AND INTERVIEW RECOMMENDATION APPENDIX B.DETAILS
This appendix contains the detailed suggestions made by National Grid, CSP, and participants on how the
demonstration could improve going forward. We begin by providing those offered by National Grid and the
CSPs followed by participants.
National Grid and CSP demonstration Improvement Suggestions
We received nearly twenty recommendations from National Grid and the CSPs. Recommendations which
came from multiple respondents included:
Provide more timely data on customer load curtailment performance: The most significant source of
dissatisfaction among the CSPs was the inability of National Grid to provide them with timely information
on the load curtailment performance of their customers. “We have customers who did respond, they did
perform, but they can't verify that,” said one CSP rep. “And neither National Grid nor ourselves have
that data, and so that's a little troubling for a couple of our customers.” “The customer doesn't want to
sit around and wait three months for his results, he wants to know how he did,” said another CSP rep.
“That’s definitely something we want to improve next year,” said one National Grid staff person.
Improve the forecasting of load control events: All the CSPs were disappointed that the demonstration
was calling load control events on days when the forecasted load did not seem to be near the system
peak, cancelling events, and missing the ICAP system peak, which we note occurred very early in the
demonstration this year (June 13). Some representative quotes included:
o “Some of our customers were a little surprised to be getting dispatched in June and August when
what they were seeing is the load well below the … current peak day,” said one CSP rep. “Those
customers who were trying to do this demonstration as a way to hit the ICAP day, I think they
were definitely disappointed that they weren't able to do that.”
o “We have some work to do on our algorithms, so that we call events when they’re needed and
only when they're needed. And we’re working on that,” said one National Grid representative.
Get the demonstration started earlier: A couple of the interviewees said that an earlier start to the
demonstration would give National Grid account representatives and the CSP sales representatives more
time to recruit customers into the demonstration. National Grid has already adopted this
recommendation by starting the next prog demonstration ram cycle in October rather than in late
January.
Make the enrollment process more user-friendly: As discussed, the 2017 demonstration required the
CSPs to upload their enrolled customer information in a “clunky” CSV format that was susceptible to
data entry errors. Multiple interviewees suggested that this process could be made easier to use.
Increase the demonstration incentive levels: As discussed above, all CSP representatives said that the
demonstration incentives levels should increase to make the incentive levels closer to those of other load
curtailment demonstrations and increase participation. One CSP rep thought that National Grid should be
able to afford such an incentive increase based on the transmission and capacity cost savings it reaps
when it curtails load.

DNV GL – www.dnvgl.com February 23, 2018 Page B-2
Be more transparent about the demonstration’s criteria for scheduling events: The CSPs suggested that
there could be benefits to both customers and CSPs if they knew more about what load conditions would
trigger a demonstration curtailment event. “It was sort of a black box on our end as to what the trigger
is,” said one CSP rep. “For most other peak saving programs, we know exactly what the trigger is, and
we can do more on our end to help get customers prepped for it,” he said. “A lot of that was sort of
opaque to us because we didn't know what the methodology was that was being used on National Grid's
end.”
Improve the content of the demonstration flyer. As discussed in the demonstration Information section,
the CSPs thought that the demonstration information could better describe how customers would be paid,
how much money they could receive, and the ancillary benefits of participation such as ICAP tag
reduction.
Improve the process for CSPs updating the sales pipeline: All three CSPs said that clearer guidelines or
templates for reporting sales information would benefit them and National Grid. Their feedback included:
o “[We need] to figure out a better structure going forward for … passing [sales lead] information
back and forth because a lot of it relied on e-mail and I think [the National Grid project manager]
didn't really get information as quickly as he'd like. [We need] a common framework and
template for streamlining the exchange of information going forward.”
o “We didn't have a formal process [for sales reporting]. … “I would get requests from [the
National Grid program manager]: ‘What's been contracted? What's been enrolled? What's been
proposed? Where are you in the sales process? What's the size of the pipeline?’ I think there's
that kind of information at some level … that we track internally in our CRM. But I think next
year we just need to build out a custom report for National Grid.”
o [We would like he program to be] “clearly defining what the expectations were from the National
Grid team … in terms of reporting and checking in.”
Provide the CSPs with clearer information on the responsibilities of the National Grid sales
representatives: As mentioned in the demonstration Communication section, a couple of CSP
representatives said that it would have been helpful to their outreach efforts to have more specific
information up front as to which National Grid key account managers were responsible for which
customers.
More information on what customers can expect to be paid. A couple of the CSPs said that the
demonstration needed to be able to provide better information on what participants could expect to be
paid, even if this was a preliminary estimate. They asserted that this was important for recruiting new
participants into the demonstration, since they needed to know, at a high level, whether the financial
benefits of load curtailment would outweigh the costs.
Besides these demonstration improvement recommendations from multiple interviewees, there were also
some recommendations which came from single respondents. These included:
Provide enrolled customers with a pre-season educational webinar: “One thing we would do differently
this year, … that we didn't do last year, would be conduct a pre-season webinar for …. for those that
have signed up,” one CSP rep suggested. “Sometime in May, we would create a 30-40-minute slot …
and run through how this [demonstration] unfolds, what the messaging looks like for dispatch. We
DNV GL – www.dnvgl.com February 23, 2018 Page B-3
would take some Q&A, and put the thing on a video, so it's accessible on our website.” In addition to
this webinar, he suggested also running a test to make sure that they have a connection with the
customer contact who is going to receive dispatch signals and initiate their action.
Develop case studies to help with customer recruiting: One National Grid rep saw opportunities to make
more use of customized case studies to help recruit customers into the demonstration. For example, he
saw waste water treatment as a sector where there were opportunities for load curtailment, even though
many treatment facilities were skeptical. “If we can get one large wastewater treatment customer with a
few different plants doing that case study, then we can kind of prove them wrong,” he said. “[If] we do
a public case study, then we can change people’s perceptions of how discretionary their loads are.”
More timely installation of metering equipment: One CSP expressed frustration that National Grid’s
metering department took so long to install equipment that would give demonstration participants real-
time visibility into their usage patterns. He said that these delays not only prevented some C&I
customers from participating in the Connected Solution demonstration but also in the ISO-NE FCM
program.
Increase capacity payments relative to the performance payments: One CSP rep believed National Grid
should increase the capacity payment amount relative to the performance payment amount. He noted
that in 2017 the demonstration had planned to curtail 20 hours13, but “only six hours were called, and
therefore, most of that variable side of the compensation was not earned.” He thought increasing
capacity payments would improve customer participation. “Pay a higher value on fixed reservations so a
customer knows what he's getting -- a fixed stipend, if you will -- and do less on the energy side,” he
recommended. “That's a significant matter for customer acceptance and for customers coming back.”
Provide more guidance on CSP compensation: One CSP rep wished that the demonstration could provide
more clarity on the CSP’s expected share of the incentive dollars for the services they provide.
Provide final demonstration rules: “We were waiting on more finalized demonstration rules … something
more like a contract or a demonstration rules document,” said one CSP rep.
Align the demonstration more with ISO-NE forecasting and dispatching practices: “[The Connected
Solution demonstration should] more thoroughly integrate with ISO New England operator rules for the
FCM demonstration,” said one CSP rep. “That's something that the current [Connected Solution]
demonstration design doesn't really allow for based on the way it's constructed in terms of forecasting
and dispatching.”
Recommendations for Demonstration Improvements from Participants
DNV GL asked the participants for suggestions on improving the design and delivery of the Connected
Solution demonstration. Twelve of the participants did have suggestions. The two most-cited ones were
providing customers with more information on curtailment amounts (4 respondents) and increasing
customer engagement (4 respondents) through more control events and more demonstration
communications after a control event about why the event was called. The following is their full list of
recommendations (we repeated some of the verbatim because they cover multiple recommendation
categories):
13
Note that there was a time component to the demonstration incentive in 2017 but that has changed to be less time dependent in 2018.

DNV GL – www.dnvgl.com February 23, 2018 Page B-4
More information on the curtailment amounts:
o “Become more hands-on, do more telling you how much you are shedding load.”
o “I guess if there was a way to see what the savings were and how much you cut back, and what
the payment was going to be.”
o “It'd also be nice to receive access to a portal that would show our own profile, savings to date,
suggestions on voluntary shutdown. More information content on how our participation is helping
the demonstration 's objective.”
o “It would be nice if, after we participated in event, we get an email thanking us and saying this
is how much we saved and/or this is the reason we had to curtail.
More demonstration engagement with participating customers, including more events to keep customers
familiar with the demonstration, and more information on why load was needed:
o “Even though you're waiting on their event to happen, we could do some test runs where you
can see the reduction. The bottom line is you're saving kW. We are creatures of habit - if you do
it once (through a test run), you're more likely to do it then. I don't think it's too much to ask for
once a month to do a test-run. It would allow us to get more familiar with the demonstration.
Right now, with the level of engagement, I can't tell you hardly anything about the
demonstration or the link to log-in. I wish it was more engaging.”
o “More information content on how our participation is helping the demonstration 's objective. We
signed up but not sure if we're really benefiting from the demonstration because after signing on
the dotted line, they disappeared.”
o “It would be nice if, after we participated in event, we get an email thanking us and saying this
is how much we saved and/or this is the reason we had to curtail -- a little more information as
to why we're doing this. Folks in the mill want to know why their workday was disrupted. All I
can tell them is that power is needed someplace else and we're getting paid by National Grid but
we don't know how much.”
o “It's a little hard to answer because this summer I didn't really get to experience the
demonstration. … I would like to have more events called as long as they're not called for long
periods of time (4-6 hours max). Not making it mandatory or some version of that is helpful to
everybody.”
Earlier notification of control events:
o “It would be nice to be notified earlier. From our perspective, there are many people whose
day’s end at 3:30.”
o “About those expected brown-out dates in which they will expect us to dial down - doesn't give
me the time as an engineer to cool down enough to shut down a chiller. If the notification would
come out a couple days before.”
Make it clearer who participants should be dealing with: “Always been confused with who I am supposed
to be dealing with (Grid or EnerNOC).”

DNV GL – www.dnvgl.com February 23, 2018 Page B-5
Higher incentive levels: “The real benefit is the ICAP tag. It's peanuts compared to the savings we'll get
through that. So, the payment for this demonstration is not enough to motivate.’
Information on why control events were canceled: “When the event got canceled and we had just
started the demonstration, it was confusing. Just a little better explanation on why that happened, to
reassure us that everything is going OK.”
More outreach to municipal customers: “There are a lot of other opportunities with other municipalities.
A lot of my colleagues don't know about the demonstration, but they're doing it [curtailing load during
peak times] anyway. So, do more outreach to municipal customers.”
Keep control events in normal business hours: “I really think it's tailored for realistic business hours. If
they maintain that, they'll have many companies that will respond to it. Rather than having peak hours
at 6pm.”
More information on what they can expect to be paid: “I guess if there was a way to see what the
savings were and how much you cut back, and what the payment was going to be.”
Improve the interconnection process: “The interconnecting portion could be better coordinated.”
More education of how demonstration works: “Make sure everybody understands it. We're experienced.
Others may not be. You need a little bit more orientation. Make sure they understand how the
demonstration operates.”
Allow direct customer enrollment: “My preference is to join these programs directly. I didn't want to give
25% of the incentive to a consultant. I tried to reach out to National Grid about this, but they said I had
to enroll through a third-party. So, having a direct enrollment option for customers so you don't have to
give up payment.”

DNV GL – www.dnvgl.com February 23, 2018 Page C-1
PARTICIPATING CUSTOMER INTERVIEW GUIDE APPENDIX C.
Interview Tracking Information
Interviewer Survey Length (min.)
Completion Date
Contact Information
Phone
Alt info (email, cell)
Call Tracking Date/Time
Notes/result/actions:
(Who spoke to, new contact info, when to call back, etc.)

DNV GL – www.dnvgl.com February 23, 2018 Page C-2
Introduction
1. [IF WE HAVE CONTACT INFO] May I please speak with <CONTACT NAME>? [SKIP TO Q3 WHEN CONTACT GETS ON PHONE]
2. [IF WE DO NOT HAVE CONTACT INFO] Hello, my name is _____, and I’m calling from DNV GL on behalf National Grid. According to our records, your company recently participated in National Grid’s Connected Solutions program through [CURTAILMENT SERVICE PROVIDER]. This program pays your company rebates in return for occasionally asking you to decrease your energy use. Who at your company would be most knowledgeable about your participation in this National Grid program? [RECORD NAME AND CONTACT INFO OF PROGRAM-FAMILIAR CONTACT, AND SKIP TO Q3 WHEN YOU GET PROGRAM-FAMILIAR CONTACT ON THE PHONE]
3. Hello, my name is _____, and I’m calling from DNV GL on behalf National Grid. According to our records, your company recently participated in National Grid’s Connected Solutions program through [CURTAILMENT SERVICE PROVIDER]. This program pays your company rebates in return for occasionally asking you to decrease your energy use. I would like to ask you some questions about your participation in this program that will help National Grid improve this program going forward.
Sources of First Information, Drivers of Participation, Program Information, Enrollment
4. How do you first hear about this Connected Solutions program from National Grid?
5. What was your company’s main reason for getting involved with this program?
6. Were there any other reasons?
a. [IF YES] What were these other reasons?
` 7. How did you learn about how this program worked? [IF THEY JUST MENTION A PROGRAM ACTOR –
E.G., NATIONAL GRID OR THEIR CSP – PROBE FOR WHAT TYPES OF INFORMATION THEY RECEIVED AND WHAT FORM IT TOOK - E.G., WEBSITE VS. HARD COPY, PROGRAM FLYER, NGRID SALES REP]
8. Using a five-point scale where 5 equals very satisfied and 1 equals very dissatisfied, how satisfied were you with this information in terms of explaining to you how this program works?
a. [IF SATISFACTION RATING OF 3 OR LESS] Why do you say that?
9. Do you recall the process for getting your company enrolled in this program? a. [IF YES] Using a five-point scale where 5 equals very satisfied and 1 equals very dissatisfied,
how satisfied were you with this enrollment process?
a. [IF SATISFACTION RATING OF 3 OR LESS] Why do you say that?
10. [CSP] is the contractor that is helping National Grid deliver this program and would have enrolled
your company into the program. Besides the enrollment process, have you had any other interactions with [CSP]?
a. [IF YES] What were the nature of these interactions?
11. Did your company face any barriers or difficulties in trying to join this program?

DNV GL – www.dnvgl.com February 23, 2018 Page C-3
a. [IF YES] What were these?
12. The main goal of this program is to pay customers to reduce their power consumption at times when
electricity use on power grid reaches its highest levels. Did anybody provide advice to your company on the best ways to reduce your power consumption during these periods of peak electricity usage?
a. [IF YES] Who provided this advice?
b. [IF YES] What kind of advice did they provide you?
13. Did National Grid or [CSP] provide you with any data showing your company’s electric power consumption levels that might help you participate in this program?
a. [IF YES] Who provided this power consumption data?
b. [IF YES] What kind of power consumption data did they provide you?
14. Besides this National Grid Connected Solutions program, has your company participated in any other
load curtailment or demand response programs?
a. [IF YES] What other programs? [PROBE FOR NATURE OF THEIR PARTICIPATION IN THESE PROGRAMS]
b. [IF YES, THEY PARTICIPATED IN AN ISO NE PROGRAM] Were you able to actively participate in both programs to maximize incentives received for your curtailment capability?
c. [IF YES TO 14] How was your experience participating in both programs? [PROBE FOR
WHETHER PARTICIPATING IN BOTH PROGRAMS WAS ECONOICALLY BETTER OR MORE FEASIBLE THAN ONLY ONE]
The Control Events, Incentive Payments
15. Do you recall your CSP notifying your company that it had to reduce its electric power consumption?
[IF THEY ARE UNSURE, MENTION THAT THE NOTIFICATION MIGHT HAVE COME FROM AUTOGRID, A CONTRACTOR WORKING FOR NATIONAL GRID]
a. [IF YES] Who notified you?
b. [IF YES] Approximately when did you receive this notification?
c. [IF YES] Did your company reduce its power consumption in response to this notification?
i. [IF NO] Why not?
16. [IF THEY RECALL RECEIVING NOTIFICATION (Q13=YES)] Using that same five-point satisfaction scale [REPEAT THE SCALE, IF NEEDED], how satisfied were you with the program procedures for notifying your company that it had to reduce its power consumption?
a. [IF SATISFACTION RATING OF 3 OR LESS] Why do you say that?
17. [IF THEY INDICATED THAT THEY HAD REDUCED THEIR POWER CONSUMPTION IN RESPONSE TO THE PROGRAM NOTIFICATION (Q15C=YES)]
a. How did your company reduce its electric power consumption in response to the program? [PROBE FOR SPECIFIC ACTIONS TAKEN, THE TIMING OF THESE ACTIONS, AND WHETHER

DNV GL – www.dnvgl.com February 23, 2018 Page C-4
THE CUSTOMER MADE USE OF BACKUP GENERATION OR OTHER SUPPLEMENTARY SOURCES OF POWER]
b. Were the ways that your company reduced its electric power consumption what it originally planned to do before receiving the notification?
i. [IF NO] How was it different?
c. Did your company encounter any technical difficulties in trying to comply with the program’s
request to reduce your power consumption?
i. [IF YES] What were they?
d. Were there any serious disruptions to your company’s productivity or operations when it responded to the program’s request to reduce power consumption?
i. [IF YES] What were they?
e. Were you aware of any complaints or concerns raised by your company’s employees in response to the reduced power consumption? [IF NECESSARY PROBE FOR INSTANCES OF TEMPERATURE-RELATED DISCOMFORT, ETC.]
i. [IF YES] What were they?
f. [IF INTERVIEW IS FIELDED BEFORE END OF SEPTEMBER] So far the program has only called
4 load curtailment events this summer, with 2 of those event being cancelled the same day due to an updated forecast. If there are more events than this in the future, do you think your company will be less willing to curtail its load than it had been for the previous events?
i. Why do you say this?
g. [IF INTERVIEW IS FIELDED AFTER END OF SEPTEMBER] The program called 4 load curtailment events with 2 of those being canceled the day of the event due to an updated forecast, over the course of the program. Did the frequency of these events cause any issues with your company?
i. [IF YES] What were these issues?
h. [ALL RESPONDENTS] If the program had called more than the 4 load curtailment events, would your company have been less willing to curtail its load for these additional events than it had been for the previous events?
i. [IF YES] What were these issues?
i. [IF THEY RECALLED RECEIVING ADVICE ON HOW TO REDUCE THEIR POWER CONSUMPTION (THEY GAVE A RESPONSE TO Q11A AND Q11B)] You said earlier that [CSP/National Grid] provided you with advice on how to reduce your power consumption. Did you follow this advice when choosing to reduce your electric power consumption?
i. [IF NO] Why not?
j. After you responded to the program’s request for you to curtail your power consumption, did you receive any information on how much power you were able to reduce?
i. [IF YES] Who provided this information?
ii. [IF YES] What was the nature of this information?

DNV GL – www.dnvgl.com February 23, 2018 Page C-5
iii. [IF YES] Did this information tell you what your incentive payments were likely to be for this level of consumption?
k. Are you aware of any instances where the National Grid Connected Solutions told your
company that they needed power curtailment the next day and then later cancelled that request? (This happened twice this summer)
i. [IF YES] Did this cancellation cause your company any significant inconvenience?
l. [IF INTERVIEWS TAKE PLACE IN OCTOBER AFTER PAYMENT OF PROGRAM INCENTIVES AND PARTICIPANT HAS BEEN IDENTIFIED AS SCHEDULED FOR PAYMENT] Has your company received its incentive payment for the Connected Solutions program?
i. [IF YES] Did the incentive amount meet your expectations?
1. [IF NO] Why not? ii. [IF YES] Did you think the incentive payment was fair given the level of curtailment
you provided and the challenges of curtailing this load?
1. [IF NO] Why not?
iii. [IF YES] Using that same five-point satisfaction scale [REPEAT THE SCALE, IF NEEDED], how satisfied were you with the program’s incentive payments?
1. [IF SATISFACTION RATING OF 3 OR LESS] Why do you say that?
m. [IF THEY INDICATED EARLIER IN RESPONSE TO Q14 THAT THEY ARE ALSO PARTICIPATING IN THE ISO NEW ENGLAND DR PROGRAM] You told us earlier that your company is also participating in an ISO New England demand response program. Did your participation in this ISO New England program have any influence in your decision to also participate in this National Grid Connected Solutions program?
i. [IF YES] How did it influence it?
ii. [IF NO] Why not?
iii. [IF NOT ALREADY MENTIONED] Did your participation in this National Grid Connected Solutions program influence you to reduce your electric power consumption more often than you would have if you only participated in the ISO New England DR program?
1. [IF YES] To what extent? [TRY TO GET THEM TO QUANTIFY THE
INCREMENTAL LOAD REDUCTION, IF POSSIBLE]
Program Satisfaction, Suggestions for Program Improvements
We’re almost done. Just some final program satisfaction questions and a couple of questions about what your company/organization does/
18. [IF THEY RECALLED INTERACTIONS WITH THEIR CSP (Q10=YES)] You mentioned earlier that you
had some interactions with [CSP]. Using that same five-point satisfaction scale [REPEAT THE SCALE, IF NEEDED], how satisfied were you with the overall performance of [CSP]?
a. [IF SATISFACTION RATING OF 3 OR LESS] Why do you say that?

DNV GL – www.dnvgl.com February 23, 2018 Page C-6
19. During your participation in the program, did you have any interactions with the National Grid staff?
a. [IF YES] What were the nature of these interactions?
b. [IF YES] How satisfied were you with the overall performance of the National Grid program staff? [REPEAT THE SCALE, IF NEEDED]
i. [IF SATISFACTION RATING OF 3 OR LESS] Why do you say that?
20. What would be your level of satisfaction with the National Grid Connected Solutions Program overall, considering all the various aspects of the program we already discussed? [REPEAT THE SCALE, IF NEEDED]
a. [IF SATISFACTION RATING OF 3 OR LESS] Why do you say that?
21. If this program were to mature into a larger offering, what suggestions would you have for improving the design or delivery of it?
Firmographics
Lastly just a couple of questions about your company/organization?
22. What is the principal activity of your organization at this location? [CHOOSE ONE. IF RESPONDENT TELLS YOU MULTIPLE, ASK THEM WHICH ONE BEST DESCRIBES THE MAIN ACTIVITY AT THIS LOCATION.]
1 Agriculture/Farm
2 Casino 3 College/university 4 Community Service/Church/Temple/Municipality 5 Convenience store 6 Gas Station 7 Grocery store 8 Health care/hospital 9 Hotel or motel 10 Industrial Process/Manufacturing/Assembly 11 Office 12 Recreational Facility 13 Restaurant 14 Retail (non-food) 15 School 16 Warehouse 17 Water/wastewater Treatment 77 [Other](RECORD)________________ 97 [Don’t know] 98 [Refused]
23. At this location, does your organization [READ UNBRACKETED LIST]
Own all the space it occupies Lease all the space it occupies?
Or own some and lease some of the space it occupies?
97 [Don’t know]
98 [Refused]

DNV GL – www.dnvgl.com February 23, 2018 Page C-7
24. Are any of your energy costs included in your normal lease payment?
1 [Yes]
2 [No] 97 [Don’t know] 98 [Refused]

DNV GL – www.dnvgl.com February 23, 2018 Page D-1
CURTAILMENT SERVICE PROVIDER INTERVIEW APPENDIX D.GUIDE
Interviewer Survey Length (min.)
Completion Date
Contact Information
Phone
Alt info (email, cell)
Call Tracking Date/Time
Notes/result/actions:
(Who spoke to, new contact info, when to call back, etc.)

DNV GL – www.dnvgl.com February 23, 2018 Page D-2
Introduction
Thanks for agreeing to participate in this interview. As we discussed earlier via email, the objectives of this interview are to find out how National Grid’s Connected Solutions program is working, what could be done to make it better, and what it would take to make this pilot program a full-scale program.
Program Design, Management
25. What have been your company’s motivation for getting involved with this Connected Solutions
program? a. Did this program introduce you to new sale leads and consequently sales with customer you
would not have otherwise reached this year? b. Did this program help you to close sales with customers you have been working with for a
while? c. Has selling this program help you to sell other services to customers such as participating in
the forward capacity market (FCM)?
26. Before we get into the details, at a high level, what are your general impressions of the design of this program, both positive and negative?
27. How does your company communicate with National Grid? [IF NOT ALREADY MENTIONED, PROBE FOR TYPICAL TOPICS COVERED IN THESE COMMUNICATIONS, THEIR FREQUENCY, AND THE MODE OF COMMUNICATION (E.G. EMAIL VS. PHONE VS. FACE TO FACE)]
28. Have there been any challenges in your communications with National Grid?
a. [IF YES] What were these challenges?
29. Does your company communicate with AutoGrid?
a. [IF YES] What is the nature of these communications? [IF NOT ALREADY MENTIONED, PROBE FOR TYPICAL TOPICS COVERED IN THESE COMMUNICATIONS, THEIR FREQUENCY, AND THE MODE OF COMMUNICATION (E.G. EMAIL VS. PHONE VS. FACE TO FACE)]
b. [IF YES] Have there been any challenges in these communications with AutoGrid?
i. [IF YES] What were these challenges?
30. How do you share these program tracking data with National Grid?
31. Have there been any challenges in managing these program tracking information?
a. [IF YES] What were these challenges?
32. We understand you have access to Schneider EPO to get consumption data. How do you use this customer consumption information to help you implement this program?
a. Have there been any challenges in working with this customer consumption information?
b. [IF YES] What were these challenges?
Program marketing/information, participation, barriers

DNV GL – www.dnvgl.com February 23, 2018 Page D-3
33. Are you involved in the creation of information on how the program works? [PROBE FOR WEBSITE INFORMATION AS WELL AS HARD COPY MATERIAL]
a. [IF YES] What specifically is your role in creating this program information?
34. Do you think the program information that participants currently receive is adequate for helping them understand how the program works and what their responsibilities are as participants?
a. Why do you say that?
35. Do you think that program’s marketing messages are the right ones to encourage customers to join the program?
a. [IF NO] What alternative marketing messages should the program be using?
36. What is your standard practice for recruiting new customers into the program? [IF NOT MENTIONED, PROBE FOR:
a. HOW THEY FIND C&I CUSTOMERS WHO WOULD BE GOOD CANDIDATES FOR THE PROGRAM
b. WHAT KIND OF MARKETING MESSAGES THEY USE TO RECRUIT THESE CUSTOMERS
c. WHAT INFORMATION THEY PROVIDE ABOUT HOW THE PROGRAM WORKS, THE INCENTIVE LEVELS
d. WHAT SORTS OF SITE VISITS THEY MAY DO AND WHAT THINGS THEY LOOK FOR WHEN
THEY ARE ONSITE
e. WHAT KIND OF ADVICE THEY PROVIDE CUSTOMERS ON HOW TO CURTAIL THEIR LOAD
f. WHAT SORTS OF ENERGY CONSUMPTION INFORMATION THEY COLLECT FROM THE CUSTOMERS TO DETERMINE THEIR SUITABILITY FOR THE PROGRAM, OR AS BASELINE INFORMATION]
37. Do you think the current balance between your company’s program marketing/outreach responsibilities and those of National Grid are in the right balance?
a. Why do you say that?
38. Have you been satisfied with your level of program recruitment?
a. Why do you say that?
39. Do you think the resources devoted to marketing and outreach for this program are adequate for achieving program objectives?
a. Why do you say that?
40. What do you think are the greatest barriers to the C&I customers participating in this program?
41. What would be some ways to help mitigate these program participation barriers?
Program delivery
42. What is the process for enrolling customers into the program?

DNV GL – www.dnvgl.com February 23, 2018 Page D-4
43. Using a five-point scale, where five equals “very satisfied” and one indicates “very dissatisfied”, how satisfied have you been with this program enrollment process?
a. Why do you say that?
44. What is the process for notifying customers of an upcoming load control event? [IF NOT MENTIONED, PROBE FOR HOW CUSTOMERS ARE NOTIFIED, HOW MUCH ADVANCED WARNING THEY RECEIVE]
45. Using this same five-point satisfaction scale [REPEAT SCALE IF NEEDED], how satisfied have you been with this control event notification process?
a. Why do you say that?
46. What is the process for paying incentives out to customers?
a. [IF NOT MENTIONED] The program gives customers the option of either keeping the incentives themselves or having their curtailment service providers retain the incentives. Do you think this is a valuable option to give customers?
47. Are any of your customers participating in both National Grid’s Connected Solutions program and ISO New England demand response programs?
a. [IF YES] About what percentage of your customers are participating in both these programs? b. [IF YES] Do you think the National Grid program encourages customers who would not
ordinarily participate in demand response to participate in demand response?
c. [IF YES] For those of your customers who are participating in both these programs, do you think that the incentives from the National Grid Connected Solutions program are encouraging them to curtail more often than they would be if they participated in the ISO New England demand response programs only?
The impact of the load curtailment on program participants
48. Do you think the program’s current incentive levels are adequate for compensating participants for any inconvenience stemming from the load curtailments?
a. Why do you say that?
49. Do you think that program participants are receiving any other benefits from program participation besides receiving the financial incentives? [NOTE: POSSIBLE ANSWERS MIGHT INCLUDE A BETTER UNDERSTANDING OF THE ENERGY CONSUMPTION PATTERNS OF THEIR BUILDINGS AND OPPORTUNITIES TO REDUCE ENERGY WASTE, LOWERING ICAP TAG, PARTICIPATING IN ISO-NE PROGRAM]
50. Have there been any indications (e.g., customer complaints, program drop-outs) that program participants are dissatisfied with the load control event(s)?
a. [IF YES] What are these indications?
b. [IF YES] What is the relative frequency of these complaints/dropouts?
51. Do you think the participants in this pilot program are representative of the larger group of C&I customers who might participate in a full-scale program?
a. Why do you say that?

DNV GL – www.dnvgl.com February 23, 2018 Page D-5
Summing up
52. Using this same five-point satisfaction scale [REPEAT SCALE IF NEEDED], how satisfied have you been with this National Grid Connected Solutions as a whole?
a. Why do you say that?
53. What aspects of the program have gone well?
54. What aspects of the program have gone less well?
55. Based on your experience with the pilot so far, what do you think would be the challenges of making this a full-scale program?
56. If you could do it over again, what changes would you make in the design or delivery of this program?

ABOUT DNV GL Driven by our purpose of safeguarding life, property and the environment, DNV GL enables organizations to advance the safety and sustainability of their business. We provide classification and technical assurance along with software and independent expert advisory services to the maritime, oil and gas, and energy industries. We also provide certification services to customers across a wide range of industries. Operating in more than 100 countries, our 16,000 professionals are dedicated to helping our customers make the world safer, smarter, and greener.