draft demand management plan - ctw.nsw.gov.au
TRANSCRIPT

_______________________
Central Tablelands Water 30 Church Street Blayney NSW (02) 6391 7200
PO Box 61 Blayney NSW 2799 www.ctw.nsw.gov.au
Draft Demand Management Plan
June 2021
3.0

Draft Demand Management Plan .
Document Status:
Version: 3.0
Document History:
Status Reviewer Version Date Internal draft Annalisa Contos 1.0 30/09/19
For comment CTW SMT 2.0 07/02/20
For comment CTW Council/SMT 3.0 18/11/20
Final draft CTW Council/SMT 4.0 16/06/21
Authors: Lucy Parsons, David Bartley
Contact: Annalisa Contos
Atom Consulting 65 Cambourne Ave
St Ives NSW 2075 [email protected]
02 9488 7742
File Name: CTW1805 Demand Management Plan v4.0.docx
This plan was adopted by Central Tablelands Water on DATE

Introduction
Atom Consulting for Central Tablelands Water
iii
Executive Summary
This report outlines Central Tablelands Water’s demand management plan to be adopted by Council in 2021.
Demand forecasting
The historical demand has been analysed and future demand has been forecast. Residential water consumption makes up 64% of the annual water use and represents the greatest opportunity to decrease demand.
The water loss due to leakage has increased from 8% in 2013/14 to 14% in 2017/18. Central Tablelands Water’s water loss is above the state-wide median.
The population increase is predicted to be 0.7% annually. The demand is forecast to increase proportionally with the population.
The demand target is to maintain 254 L/person/day and minimise water loss due to leakage.
Demand management
In 2015/16 the weighted median inland water utility annual residential water supplied was 248kL/property (DPIE, 2017). The target of this demand management plan is to maintain the total water consumption per person of 254kL/person/year.
The demand management measures that are detailed in this report are summarised in Table i-i.
Table i-i. Central Tablelands Water demand management controls
Demand management measure
Direct annual costs Target water customers
Estimated annual water saving
Volume (ML/yr)
Permanent water
restrictions
- All 35
Community education $2,000
$0.15/kL
Residential 13
Water loss management $46,800 $9.54/kL
Water leakage 5
Key user internal efficiency
audits
- Commercial,
industrial, public and parks
0.22
Implementation
In order to manage the demand effectively it is recommended that the implementation of the measures outlined above is monitored and their success evaluated. The water consumption should be reviewed every year against the demand forecast in Section 3.3.2 and the demand management targets. The review should be brief and assess:
Change in water consumption to ensure target of 254 L/person/day is maintained,
Residential and non-residential customer consumption percentage change since previous year to assess which controls are most effective,
The implementation of all controls outlined in this plan,
The need to strengthen existing controls or implement new controls to meet water targets,

Draft Demand Management Plan .
Correct implementation of water restrictions.
Controls found to need strengthening or implementation should be recorded for assessment in the following year’s review.

Introduction
Atom Consulting for Central Tablelands Water
v
Contents
Executive Summary .............................................................................................................. iii
Demand forecasting....................................................................................................... iii
Demand management .................................................................................................... iii
Implementation ............................................................................................................ iii
1 Introduction .................................................................................................................. 1
1.1 Demand management goals .................................................................................. 1
1.2 Benefits of demand management .......................................................................... 1
1.3 History of demand management in the Central Tablelands region .............................. 1
1.4 Best practice requirements ................................................................................... 2
1.5 Consultation ....................................................................................................... 3
2 Water supply systems .................................................................................................... 4
2.1 System description .............................................................................................. 4
2.1.1 System upgrades ..................................................................................... 6
3 Demand forecasting ....................................................................................................... 7
3.1 Previous demand trends ....................................................................................... 7
3.2 Current water use ................................................................................................ 8
3.2.1 Residential and total demand ..................................................................... 8
3.2.2 Non-revenue water ................................................................................. 10
3.3 Future water use ................................................................................................ 10
3.3.1 Population growth ................................................................................... 10
3.3.2 Changing water demand .......................................................................... 11
4 Demand management planning ...................................................................................... 13
4.1 Long-term demand management measures ........................................................... 13
4.1.1 Permanent water restrictions .................................................................... 13
4.1.2 Community education .............................................................................. 13
4.1.3 Water loss management .......................................................................... 14
4.1.4 Key user internal efficiency audits ............................................................. 15
4.2 Effect of long-term demand management on demand forecast ................................. 15
5 Monitoring, evaluation and reporting ............................................................................... 16
6 References .................................................................................................................. 17
Appendix A Water restrictions triggers ............................................................................ A-18
Appendix B Best practice checklist ................................................................................... B-1
Appendix C Consultation workshop attendees ................................................................... C-3
Appendix D Top non-residential customers ....................................................................... D-1

Draft Demand Management Plan .
Appendix E Annual report template ................................................................................. E-2
Tables
Table i-i. Central Tablelands Water demand management controls ............................................. iii
Table 1-1. Adopted demand management strategies ................................................................ 2
Table 1-2. Stakeholder consultation ........................................................................................ 3
Table 2-1. Central Tablelands Water raw water sources and allocations ...................................... 4
Table 3-1. 2017/18 Connections and metered usage ................................................................ 8
Table 3-2. Daily average and peak demand ............................................................................ 10
Table 4-1. Water loss management estimated costs ................................................................ 14
Table 4-2. Adopted demand management strategies ............................................................... 15
Table A-1. CTW restriction triggers ..................................................................................... A-18
Table D-1. CTW top customers (2018/19) ............................................................................ D-1
Figures
Figure 2-1. Central Tablelands Water network map .................................................................. 5
Figure 2-2. Lake Rowlands historical storage ........................................................................... 6
Figure 3-1. Total water production January 2005 to June 2019 .................................................. 7
Figure 3-2. Bore water use .................................................................................................... 8
Figure 3-3. Customer distribution in 2017/18 water consumption ............................................... 9
Figure 3-4. Average residential potable water consumption for local water utilities ....................... 9
Figure 3-5. Non-revenue water 2011 to 2018 ......................................................................... 10
Figure 3-6. Population forecast ............................................................................................. 11
Figure 3-7. Demand forecast ................................................................................................ 12
Figure 4-1. Demand management scenario forecasts ............................................................... 15

Introduction
Atom Consulting for Central Tablelands Water 1 1
1 Introduction
This Demand Management Plan (DMP) describes the water supply demand management initiatives to be implemented in the Central Tablelands Water (CTW) area of operations over the next four years. These initiatives will support and maintain efficient water use and water supply security in the region.
This Plan builds on the initiatives in the 2010 Demand Management Plan (CTW, 2010) and recommends actions that aim to be economically, socially and environmentally sound.
1.1 Demand management goals
The overall goals for demand management in CTW’s area of operations are:
Responsible and efficient water use
Overall consistency in water demand
Reduce and maintain water losses from CTW infrastructure to sustainable levels
Minimise or defer capital expenditure in new water sources
Implement innovative water efficiency measures
Develop effective mechanisms to monitor, report and evaluate the success of demand management actions.
The water supply systems operated by CTW, supply a range of residential and non-residential customers (see Section 3.1). The actions in this plan have therefore been targeted to customer type.
While water pricing is often effective for demand management, it is not addressed in this Plan. Water pricing forms part of CTW’s financial planning.
1.2 Benefits of demand management
Effective demand management provides economic, social and environmental benefits to the community. In particular by reducing total water demand, the capital cost of constructing new water supplies, treatment and transportation can be deferred. Demand management can also reduce the required capacity of new infrastructure and reduce operating cost relative to population.
Demand management reduces the need for extraction of water from rivers and aquifers which increases environmental flows. This increase in river flows not only provides environmental benefits but improves community wellbeing by providing water for amenity and recreation.
Effective demand management requires strong community engagement. Education of the community is essential to uptake of water efficient appliances and to highlight the impact of water wastage. Community engagement also encourages them to be advocates for water conservation and develops the expectation that water is supplied and used efficiently.
1.3 History of demand management in the Central Tablelands region
Details of the demand management strategies currently in place are detailed in Table 1-1.
Draft Demand Management Plan .
2
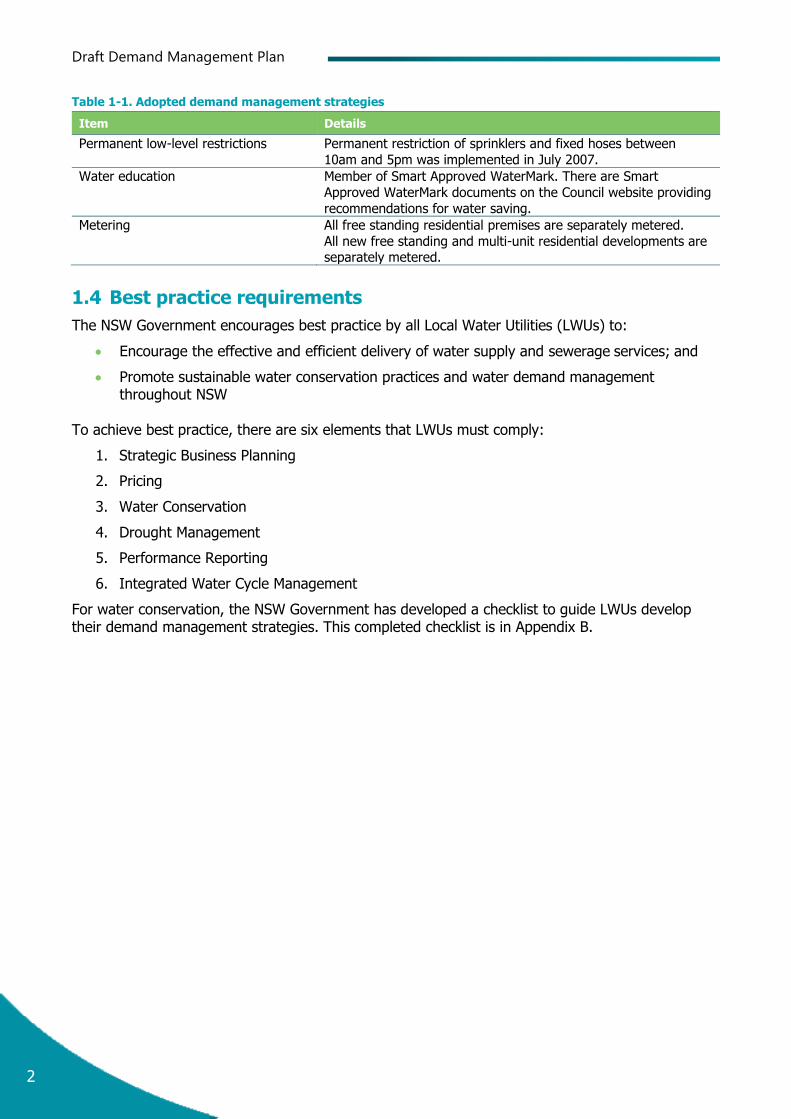
Table 1-1. Adopted demand management strategies
Item Details
Permanent low-level restrictions Permanent restriction of sprinklers and fixed hoses between
10am and 5pm was implemented in July 2007.
Water education Member of Smart Approved WaterMark. There are Smart
Approved WaterMark documents on the Council website providing
recommendations for water saving.
Metering All free standing residential premises are separately metered.
All new free standing and multi-unit residential developments are separately metered.
1.4 Best practice requirements
The NSW Government encourages best practice by all Local Water Utilities (LWUs) to:
Encourage the effective and efficient delivery of water supply and sewerage services; and
Promote sustainable water conservation practices and water demand management throughout NSW
To achieve best practice, there are six elements that LWUs must comply:
1. Strategic Business Planning
2. Pricing
3. Water Conservation
4. Drought Management
5. Performance Reporting
6. Integrated Water Cycle Management
For water conservation, the NSW Government has developed a checklist to guide LWUs develop their demand management strategies. This completed checklist is in Appendix B.

Introduction
Atom Consulting for Central Tablelands Water 3 3
1.5 Consultation
A workshop was held on 14 November 2019 to gather input from stakeholders, workshop participants are listed in Table 1-3. The attendance sheet is in Appendix C. The CENTROC demand management plan was also consulted as part of the development of this document.
Table 1-2. Stakeholder consultation
Company Name Role
Central Tablelands Water Cameron Townsend Network Manager
Bernadina Smith Governance and Executive Support Officer
Peter McFarlane Director Finance and Corporate Services
Gavin Rhodes General Manager
Noel Wellham Director Operations and Technical Services
Weddin Shire Council and
Central Tablelands Water
Paul Best Central Tablelands Water Councillor
Weddin Shire Council Councillor
Cabonne Council and Central Tablelands Water
Kevin Walker Central Tablelands Water Deputy Chair Cabonne Council Councillor
Atom Consulting David Bartley Workshop facilitator
Lucy Parsons Workshop recorder
A follow up workshop was held on 4 March 2021 to review the 2019 draft Drought and Demand Management Plans taking into account the 2019/20 drought period. The workshop attendees are listed in Table 1-33. The attendance sheet is in Appendix C.
Table 1-3. Workshop attendees
Company Name Role
Central Tablelands Water Gavin Rhodes General Manager
Bernadina Smith Governance and Executive Support Officer
Peter McFarlane Director Finance and Corporate Services
Noel Wellham Director Operations and Technical Services
Blayney Shire Council and Central Tablelands Water
David Somervaille
Central Tablelands Water Chairman Blayney Shire Council Councillor
Blayney Shire Council and
Central Tablelands Water
John Newstead
Central Tablelands Water Councillor
Blayney Shire Council Councillor
Weddin Shire Council and
Central Tablelands Water
Craig Bembrick
Central Tablelands Water Councillor
Weddin Shire Council Councillor
Weddin Shire Council and Central Tablelands Water
Paul Best
Central Tablelands Water Councillor Weddin Shire Council Councillor
Atom Consulting David Bartley Workshop facilitator
Lucy Parsons Workshop recorder

Draft Demand Management Plan .
4
2 Water supply systems
This section of the report details the current system operated by Central Tablelands Water.
2.1 System description
CTW has approximately 6,000 water connections and 15,000 consumers in 14 towns and villages including Blayney, Cudal, Mandurama, Canowindra, Eugowra, Millthorpe, Carcoar, Grenfell, Manildra, Cargo, Lyndhurst, Quandialla, Woodstock, Gooloogong and Cowra Shire Council rural’s and rural properties on Council Trunk Mains. The main water source is Lake Rowlands, with groundwater bores supplying the town of Quandialla, and bores at Gooloogong supplementing supply to Gooloogong, Grenfell and Eugowra as required. Lake Rowlands was completed in 1953 with a total storage capacity of 4,500 ML and a catchment area of approximately 197 km2. Raw water sources are detailed in Table 2-1.
Table 2-1. Central Tablelands Water raw water sources and allocations
Capacity Volume extraction licence (ML/yr)
Lake Rowlands Dam 4,500 ML 3,150
Gooloogong Bore 1 Bore pump: 3.8ML/d
Bore field rated: 5 ML/day
400
Gooloogong Bore 2
Quandialla Bore 1 Bore pump: 1.2 ML/day
Bore: 1 ML/day
266
Quandialla Bore 2 (stand by)
Cudal Bore Well: 4 L/s (0.35 ML/day)
Bore pump: 0.35 ML/day
100
Bangaroo Bore 1 Bore field rated: 3.8 ML/day
Northern pump: 0.8 ML/day Western pump: 3.0 ML/day
472
Bangaroo Bore 2
Blayney Well Well: 0.6 ML/day
Surface pump: 0.6 ML/day
250
Blayney Blue Hole
Water from Lake Rowlands is treated at two water treatment plants located at Blayney and Carcoar. Figure 2-1 shows the CTW network map.

Water Supply Systems
Atom Consulting for Central Tablelands Water 5 5
Figure 2-1. Central Tablelands Water network map
CTW water restrictions for all customers are based on the water levels at Lake Rowlands. The water level at Lake Rowlands is recorded weekly. The historical water storage levels at Lake Rowlands are graphed in Figure 2-2.

Draft Demand Management Plan .
6
Figure 2-2. Lake Rowlands historical storage
2.1.1 System upgrades
There are plans to improve the capacity and resilience of the water supply system by building a pipeline between Lake Rowlands and Carcoar dam, with the ability to pump water from Carcoar Dam to CTW’s Blayney WTP for urban use. This has not yet been approved but should be considered in the next demand management plan.
20%
30%
40%
50%
60%
70%
80%
90%
100%
110%
120%
19
83
19
84
19
85
19
86
19
87
19
88
19
89
19
90
19
91
19
92
19
93
19
94
19
95
19
96
19
97
19
98
19
99
20
00
20
01
20
02
20
03
20
04
20
05
20
06
20
07
20
08
20
09
20
10
20
11
20
12
20
13
20
14
20
15
20
16
20
17
20
18
20
19
Dam
leve
l
Year
Lake Rowlands storage level (%)

Demand Forecasting
Atom Consulting for Central Tablelands Water 7 7
3 Demand forecasting
This section of the plan details the historical analysis of water demand and future forecasting.
3.1 Previous demand trends
Historical records for the surface water and ground water are assessed in this section with climate correction.
Bulk water production is metered and recorded on a daily basis. This data from Lake Rowlands has been plotted in Figure 2-1. The permanent level 1 water restriction has not had an effect on the water demand.
Figure 3-1. Total water production January 2005 to June 2019
Source: Central Tablelands Water dam monitoring
An investigation into water losses due to evaporation at Lake Rowlands was carried out in 2010. During 2010 and 2011, the maximum evaporative losses from Lake Rowlands was 36 ML/week in summer and the minimum in winter was 6 ML/week.
Bore water flow is monitored daily when in use. The use of Quandialla and Gooloogong Bores, the Blayney well from June 2006 to 2018 is graphed in Figure 3-2.
-
2,000
4,000
6,000
8,000
10,000
12,000
14,000
Jan
-05
Jul-
05
Jan
-06
Jul-
06
Jan
-07
Jul-
07
Jan
-08
Jul-
08
Dec
-08
Jul-
09
Dec
-09
Jul-
10
Dec
-10
Jul-
11
Dec
-11
Jun
-12
Dec
-12
Jun
-13
Dec
-13
Jun
-14
Dec
-14
Jun
-15
Dec
-15
Jun
-16
Dec
-16
Jun
-17
Dec
-17
Jun
-18
Dec
-18
Jun
-19
Dai
ly V
olu
me
(kL)
CTW total water production Jan 2005 to Jun 2019
Permanent Outdoor Restrictions

Draft Demand Management Plan .
8
Figure 3-2. Bore water use
3.2 Current water use
3.2.1 Residential and total demand
Water customers are classified in accordance with the categories defined in the NSW Water Supply and Sewerage Performance Monitoring Report. All free-standing residential premises meters are separately metered. The most recent financial year’s water use has been analysed to assess the viability of demand management options. The connections and water billed in 2017/18 are shown in Table 3-1. The divide between the different customer types has been represented in Figure 3-3.
Table 3-1. 2017/18 Connections and metered usage
Customer type Connections Billed water 2017/18 (kL)
Percentage of total usage
Residential (incl Rural) 5,036 1,139,383 64.2%
Multi residential 49 24,856 1.4%
Commercial 637 216,772 12.2%
Industrial 13 235,964 13.3%
Parks 65 44,495 2.5%
Institutions 36 58,138 3.3%
Cowra bulk supply 1 54,839 3.1%
TOTAL 5,837 1,774,447 Source: DPIE LWU performance reporting
-
50
100
150
200
250
300
350
2006 2007 2008 2009 2010 2011 2012 2013 2014 2015 2016 2017 2018
Wat
er c
on
sum
pti
on
(kL
)
Date
Annual water use by bore (kL)
Gooloogong Bores Quandialla Bores Blayneys Well

Demand Forecasting
Atom Consulting for Central Tablelands Water 9 9
Figure 3-3. Customer distribution in 2017/18 water consumption
Source: DPIE LWU performance reporting 2017/18
In 2015/16 the weighted median inland water utility annual residential water supplied was 248 kL/property, the CTW average consumption in 2017/18 was below this at 205 kL/property/year (DPIE, 2018). The CTW consumption has been benchmarked with neighbouring local water utilities and graphed in Figure 3-4.
Figure 3-4. Average residential potable water consumption for local water utilities
Source: DPIE LWU performance reporting 2017/18
The daily peak and average demand have been calculated and summarised in Table 3-2.
Residential (incl Rural), 1,139,383
Multi residential, 24,856
Commercial, 216,772
Industrial, 235,964
Parks, 44,495
Institutions, 58,138Cowra bulk supply,
54,839Billed water 2017/18 (kL)
Residential (incl Rural)
Multi residential
Commercial
Industrial
Parks
Institutions
Cowra bulk supply
0
50
100
150
200
250
300
350
400
450
Ave
rage
res
iden
tial
po
tab
le w
ater
su
pp
lied
(k
L/p
rop
erty
/yea
r)
Local water utility
2017/18 average residential potable water supplied (kL/property/year)
Draft Demand Management Plan .
10
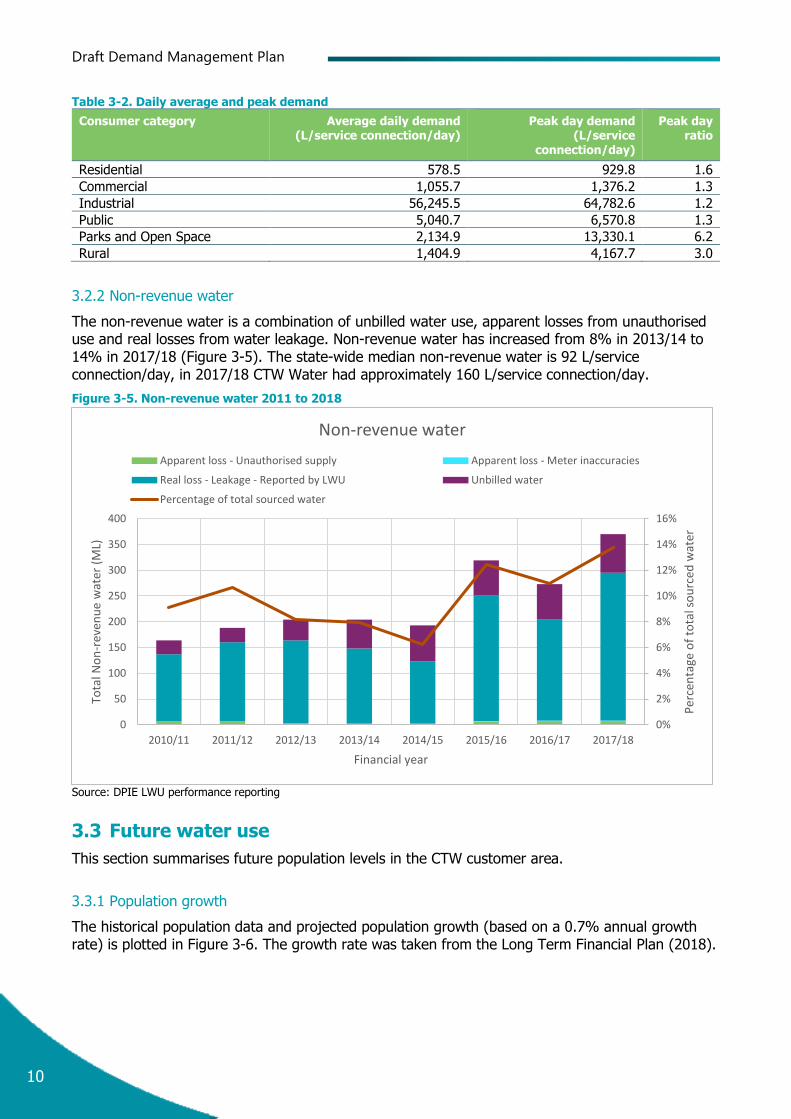
Table 3-2. Daily average and peak demand
Consumer category Average daily demand (L/service connection/day)
Peak day demand (L/service
connection/day)
Peak day ratio
Residential 578.5 929.8 1.6
Commercial 1,055.7 1,376.2 1.3
Industrial 56,245.5 64,782.6 1.2
Public 5,040.7 6,570.8 1.3
Parks and Open Space 2,134.9 13,330.1 6.2
Rural 1,404.9 4,167.7 3.0
3.2.2 Non-revenue water
The non-revenue water is a combination of unbilled water use, apparent losses from unauthorised use and real losses from water leakage. Non-revenue water has increased from 8% in 2013/14 to 14% in 2017/18 (Figure 3-5). The state-wide median non-revenue water is 92 L/service connection/day, in 2017/18 CTW Water had approximately 160 L/service connection/day.
Figure 3-5. Non-revenue water 2011 to 2018
Source: DPIE LWU performance reporting
3.3 Future water use
This section summarises future population levels in the CTW customer area.
3.3.1 Population growth
The historical population data and projected population growth (based on a 0.7% annual growth rate) is plotted in Figure 3-6. The growth rate was taken from the Long Term Financial Plan (2018).
0%
2%
4%
6%
8%
10%
12%
14%
16%
0
50
100
150
200
250
300
350
400
2010/11 2011/12 2012/13 2013/14 2014/15 2015/16 2016/17 2017/18
Per
cen
tage
of
tota
l so
urc
ed w
ater
Tota
l No
n-r
even
ue
wat
er (
ML)
Financial year
Non-revenue water
Apparent loss - Unauthorised supply Apparent loss - Meter inaccuracies
Real loss - Leakage - Reported by LWU Unbilled water
Percentage of total sourced water

Demand Forecasting
Atom Consulting for Central Tablelands Water 11 11
Figure 3-6. Population forecast
3.3.2 Changing water demand
The target demand is to maintain 254 L/person/day. The demand forecast takes into account a reduction in dam yield. Demand was forecast in three ways:
1. The baseline forecast was based on a consistent demand per person and a population growth of 0.7% per year as forecast in Figure 3-6.
2. Using the 5/10/10 rule which is based on the average production with 5% time on restrictions, restrictions in less than 10% of years and severity of restrictions does not exceed 10% (ie. System can provide 90% of unrestricted dry year water demand).
3. 25% reduced inflow in the next 30 years which resulted in decrease of 17.6 ML dam yield each year.
The increase in water demand has been graphed in Figure 3-7. The risks to water supply associated with climate change are discussed in the Drought Management Plan.
0
2,000
4,000
6,000
8,000
10,000
12,000
14,000
16,000
18,000
2010 2012 2014 2016 2018 2020 2022 2024 2026 2028 2030
Po
pu
lati
on
Date
Central Tablelands Water customer population
Population data Population projection with 0.7% growth

Draft Demand Management Plan .
12
Figure 3-7. Demand forecast
0
500
1,000
1,500
2,000
2,500
3,000
2006 2010 2014 2018 2022 2026 2030 2034 2038 2042 2046
Tota
l Wat
er D
eman
d (
ML/
yr)
Year
Demand forecastExisting Dam Yield (5/10/10 rule) Historical25% Reduction in Dam Yield Climate CorrectedBaseline Forecast

Demand Management Planning
Atom Consulting for Central Tablelands Water 13 13
4 Demand management planning
The target of this demand management plan is to maintain the residential water consumption of 226 kL/connection/year.
4.1 Long-term demand management measures
The actions that CTW will carry out to manage demand are outlined below with cost estimates. These include measures currently in place and those that are proposed. Reduced energy costs have not been considered in the cost estimates as it has been assumed that variable energy costs are incorporated into the water usage charge.
4.1.1 Permanent water restrictions
Level one water restrictions are permanently in place and have been since July 2007 to encourage smart water use. This control will stay in place and communication will be improved to ensure consumers are aware of the restrictions. The community awareness program should include improved communication of water restrictions.
The limitations included in level one residential water restrictions include:
Watering systems, microsprays, drip systems, soaker hoses, non-fixed sprinklers, handheld hoses only
o Summer time between 1800-0900 hrs only daily
o Winter time 0600-1000 hrs and 1600-2200 hrs daily
Irrigation of new turf permitted for one week after laying after which level 1 restriction on watering lawns applies
Washing down walls or paved surfaces is only permitted when Lake Rowlands is at 90% capacity or above
Washing down walls or paved surfaces under an exemption application consideration process when Lake Rowlands is below 90%, and
Washing cars at home is permitted with bucket and rinse with trigger hose on lawn at any time.
Details of other water restrictions are listed in Appendix A.
Level one water restrictions aim to achieve 260 L/person/day water consumption. This target is already routinely met with an average water consumption in 2017/18 was 254 L/person/day. It is estimated that implementation of this demand control measure will reduce external water use in all categories by 20%. This will result in average water savings of 35 ML/yr.
There are no costs for CTW to implement the permanent water restrictions. Communication costs are included in community education.
4.1.2 Community education
CTW will continue to educate the community about opportunities for water saving. Community education measures that will be implemented include:
Maintaining a ‘Saving Water’ page on their website, and share information regarding water saving tips, water restriction levels and links to Smart WaterMark on their Facebook page.
Improving public understanding regarding the significance of the water restriction levels.

Draft Demand Management Plan .
14
Continuing the distribution of quarterly newsletters with information about water pricing, water restrictions and water saving tips.
Hosting workshops to educate the public about water saving options in the garden and home.
Developing and implementing a school education program.
CTW promotional video that emphasising the importance of water conservation.
For this measure to effectively impact demand it must be implemented consistently, particularly in drought periods. It is estimated that these measures will reduce residential water use by toilets and baths by up to 1%, residential water use by showers, taps, dishwashers, washing machines, evaporative cooling systems and external leakage by up to 5% external residential water use by up to 20% and external commercial, industrial and public use by 10%. This would result in water savings of up to 13 ML/yr.
The cost of implementing the community education is approximately $2,000 per year. This number is for pamphlets, advertisements and membership to Smart Approved WaterMark subscription, the cost of staff has not been included in this estimate. The annual cost of this is equivalent to $0.15 per kL of water.
4.1.3 Water loss management
Leakages lead to the loss of 12% of the total sourced water in 2017/18. The Central Tablelands Water distribution is comprised of approximately 561km of water mains that require regular maintenance and routine monitoring for the quick detection and resolution of water leaks in order to minimise water loss. One of the challenges for CTW is that of the 561km of water mains, there are 294km of transfer mains where leaks can go undetected as they are remote from customer’s properties. CTW will implement the following water loss management strategies:
Water main maintenance program to improve the asset condition and minimise the likelihood of mains breaks.
All free-standing residential premises are separately metered and CTW encourage multi-residential developments to meter each unit separately to improve leak detection.
CTW will investigate options to minimise water loss due to evaporation and implement resulting actions.
CTW will investigate the use of a drone to visually inspect leaks in trunk mains
Water for mains flushing is necessary and cannot be reduced, because of this it is assumed that 50% of water losses are avoidable. The cost of implementing this measure was estimated using values in Table 4-1.
Table 4-1. Water loss management estimated costs
Item Details
Start Date for program 2020
% of avoidable losses in total losses 50%
Ongoing annual administration costs $2000
Current total length of water mains (km): 561
Percentage of system covered each year 10%
Percentage reduction in avoidable losses on repair 75%
Life span for loss reduction (years) 3
Inspection costs per km $300
Repair costs per km $500
Demand Management Planning
Atom Consulting for Central Tablelands Water 15 15
This results in average water savings of 5 ML/year and annual cost of $46,800 or $3.52 per kL of water.
4.1.4 Key user internal efficiency audits
CTW will maintain a list of the high quantity water customers and during periods of water restrictions level 3 or higher will encourage internal water efficiency audits be carried out by the customers. It is predicted that this will only require two years of implementation.
It is estimated that there will be a 75% decrease in internal and external water leakage for commercial, industrial, public and parks and garden customers. This will result in the temporary saving of 0.22 ML/yr. No costs were included in this estimate.
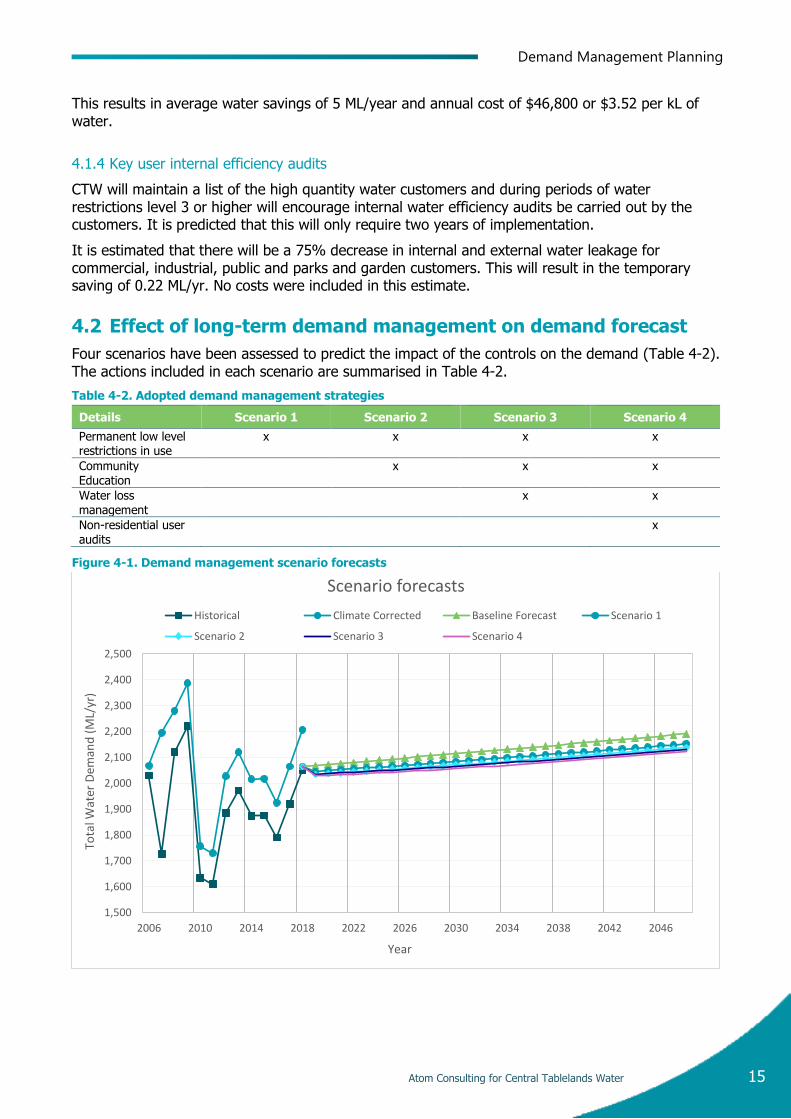
4.2 Effect of long-term demand management on demand forecast
Four scenarios have been assessed to predict the impact of the controls on the demand (Table 4-2). The actions included in each scenario are summarised in Table 4-2.
Table 4-2. Adopted demand management strategies
Details Scenario 1 Scenario 2 Scenario 3 Scenario 4
Permanent low level restrictions in use
x x x x
Community Education
x x x
Water loss management
x x
Non-residential user audits
x
Figure 4-1. Demand management scenario forecasts
1,500
1,600
1,700
1,800
1,900
2,000
2,100
2,200
2,300
2,400
2,500
2006 2010 2014 2018 2022 2026 2030 2034 2038 2042 2046
Tota
l Wat
er D
eman
d (
ML/
yr)
Year
Scenario forecasts
Historical Climate Corrected Baseline Forecast Scenario 1
Scenario 2 Scenario 3 Scenario 4
Draft Demand Management Plan .
16
5 Monitoring, evaluation and reporting
In order to manage the demand effectively it is recommended that the implementation of the measures outlined above is monitored and their success evaluated. The water consumption should be reviewed every year against the demand forecast in Section 3.3.2 and the demand management targets. The review should be brief and assess:
Change in water consumption to ensure target of maintaining 205 L/person/day (DPIE, 2018) residential use is maintained,
Residential and non-residential customer consumption percentage change since previous year to assess which controls are most effective,
The implementation of all controls outlined in this plan,
The need to strengthen existing controls or implement new controls to meet water targets,
Correct implementation of water restrictions.
Controls found to need strengthening or implementation should be recorded for assessment in the next year’s review.
A template for the annual review in Appendix E.

References
Atom Consulting for Central Tablelands Water 17 17
6 References
Central Tablelands Water (2010), Demand Management Plan, Hydroscience Consulting
Centroc (2013), Regional Water Demand Management Plan, MWH
DWE (2007), Best Practice Management of Water Supply and Sewerage – Guidelines, NSW
Department of Water & Energy
Turner, A., Willetts, J., Fane, S., Giurco, D., Kazaglis, A., and White S., (2008). Guide to Demand
Management. Prepared by the Institute for Sustainable Futures, University of Technology, Sydney
for Water Services Association of Australia Inc.
NSW Department of Primary Industries Water (2017). 2015-16 NSW Water Supply and Sewerage
Performance Monitoring Report, NSW DPI, Sydney.
Draft Demand Management Plan .
A-18
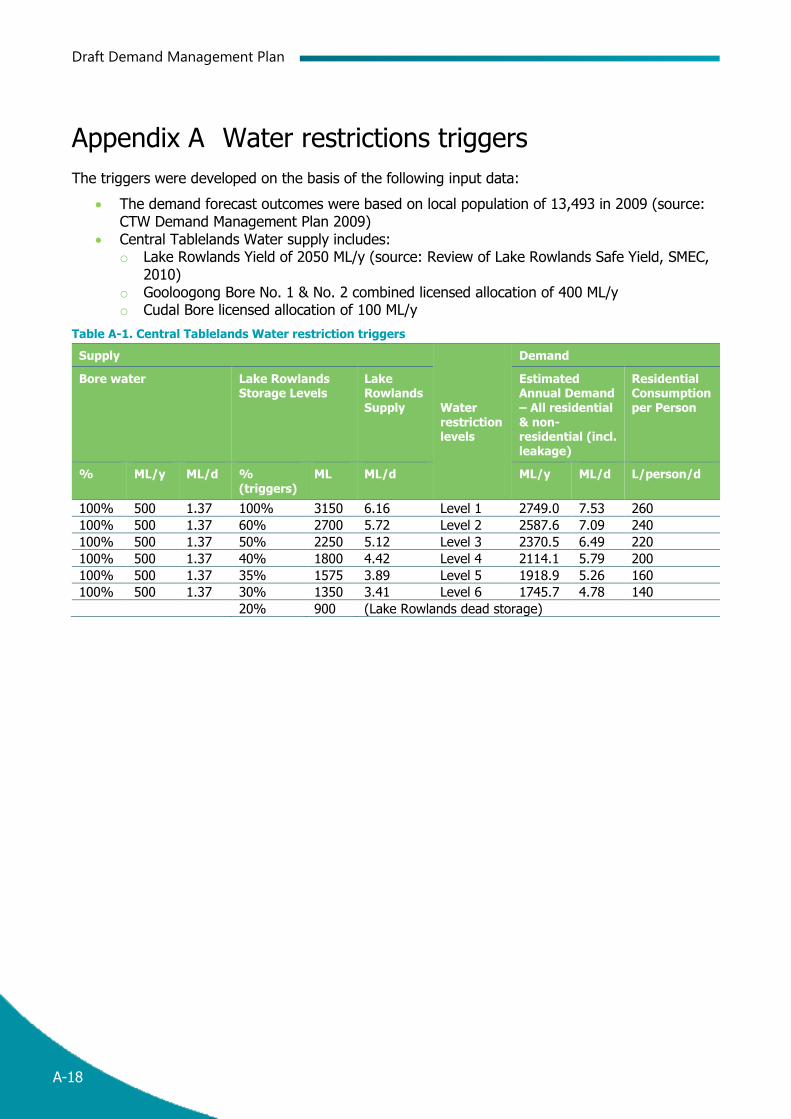
Appendix A Water restrictions triggers
The triggers were developed on the basis of the following input data:
The demand forecast outcomes were based on local population of 13,493 in 2009 (source: CTW Demand Management Plan 2009)
Central Tablelands Water supply includes: o Lake Rowlands Yield of 2050 ML/y (source: Review of Lake Rowlands Safe Yield, SMEC,
2010) o Gooloogong Bore No. 1 & No. 2 combined licensed allocation of 400 ML/y o Cudal Bore licensed allocation of 100 ML/y
Table A-1. Central Tablelands Water restriction triggers
Supply
Water restriction levels
Demand
Bore water Lake Rowlands Storage Levels
Lake Rowlands Supply
Estimated Annual Demand – All residential & non-residential (incl. leakage)
Residential Consumption per Person
% ML/y ML/d % (triggers)
ML ML/d ML/y ML/d L/person/d
100% 500 1.37 100% 3150 6.16 Level 1 2749.0 7.53 260
100% 500 1.37 60% 2700 5.72 Level 2 2587.6 7.09 240
100% 500 1.37 50% 2250 5.12 Level 3 2370.5 6.49 220
100% 500 1.37 40% 1800 4.42 Level 4 2114.1 5.79 200
100% 500 1.37 35% 1575 3.89 Level 5 1918.9 5.26 160
100% 500 1.37 30% 1350 3.41 Level 6 1745.7 4.78 140
20% 900 (Lake Rowlands dead storage)
……….Best Practice Checklist
Atom Consulting for Central Tablelands Water B-1
B-1
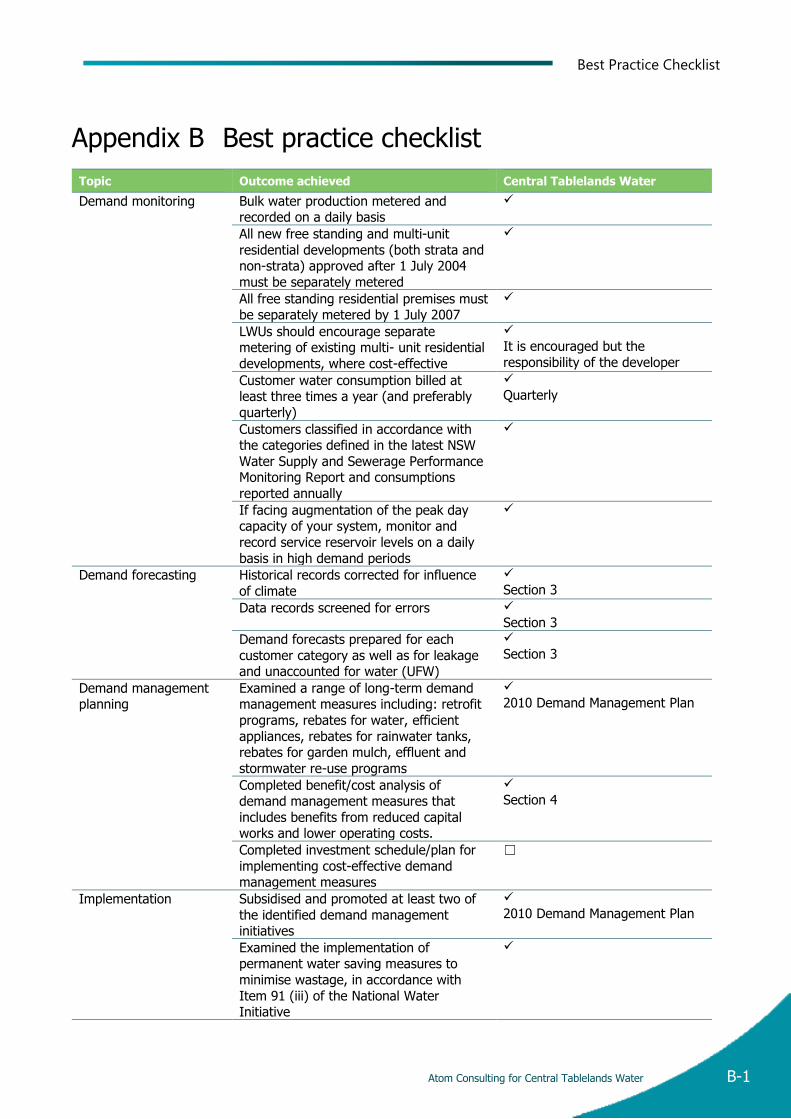
Appendix B Best practice checklist
Topic Outcome achieved Central Tablelands Water
Demand monitoring Bulk water production metered and recorded on a daily basis
All new free standing and multi-unit
residential developments (both strata and non-strata) approved after 1 July 2004
must be separately metered
All free standing residential premises must be separately metered by 1 July 2007
LWUs should encourage separate metering of existing multi- unit residential
developments, where cost-effective
It is encouraged but the
responsibility of the developer
Customer water consumption billed at least three times a year (and preferably
quarterly)
Quarterly
Customers classified in accordance with the categories defined in the latest NSW
Water Supply and Sewerage Performance Monitoring Report and consumptions
reported annually
If facing augmentation of the peak day capacity of your system, monitor and
record service reservoir levels on a daily
basis in high demand periods
Demand forecasting Historical records corrected for influence
of climate
Section 3
Data records screened for errors
Section 3
Demand forecasts prepared for each
customer category as well as for leakage and unaccounted for water (UFW)
Section 3
Demand management planning
Examined a range of long-term demand management measures including: retrofit
programs, rebates for water, efficient
appliances, rebates for rainwater tanks, rebates for garden mulch, effluent and
stormwater re-use programs
2010 Demand Management Plan
Completed benefit/cost analysis of demand management measures that
includes benefits from reduced capital works and lower operating costs.
Section 4
Completed investment schedule/plan for
implementing cost-effective demand management measures
☐
Implementation Subsidised and promoted at least two of
the identified demand management initiatives
2010 Demand Management Plan
Examined the implementation of permanent water saving measures to
minimise wastage, in accordance with
Item 91 (iii) of the National Water Initiative

Draft Demand Management Plan .
B-2
Topic Outcome achieved Central Tablelands Water
Implemented a cost-effective leakage reduction program to reduce system
water losses
Drone for trunk mains to visually
check for leaks
Mains replacement program
Ongoing customer education campaign
focussing on the importance of conserving our valuable water resources
Website, Facebook
If average residential water use per
property exceeds that for the median NSW utility (290 kL/yr in 2002/03) by
over 20%, the LWU must show progress
towards achieving a reduction in average residential use by 1 July 2007
☐
N/A
Monitoring program for reviewing the effectiveness of the implemented demand
management measures

……….Consultation Workshop Attendees
Atom Consulting for Central Tablelands Water C-3
C-3
Appendix C Consultation workshop attendees

Draft Demand Management Plan .
C-4

……….Top Non-Residential Customers
Atom Consulting for Central Tablelands Water D-1
D-1
Appendix D Top non-residential customers
Table D-1. Central Tablelands Water top customers (2018/19)
Top customer Town Type Average annual consumption (ML/y)
Friskies Pet Care / Nestle Blayney Industrial 82.68
Manildra Flour Mills Manildra Industrial 52.06
Williams Crossing Quandialla Quandialla rural 42.64
MSM Milling P/L Manildra Industrial 40.24
Western White Linen Blayney Industrial 15.62
Blayney Shire Council Blayney Public Parks 12.53
Newcrest Mining Ltd Blayney Industrial 11.85
Cabonne council Canowindra Commercial 11.49
Metziya Blayney Commercial 10.74
Blayney Shire Council Blayney Commercial 9.83
Draft Demand Management Plan .
E-2
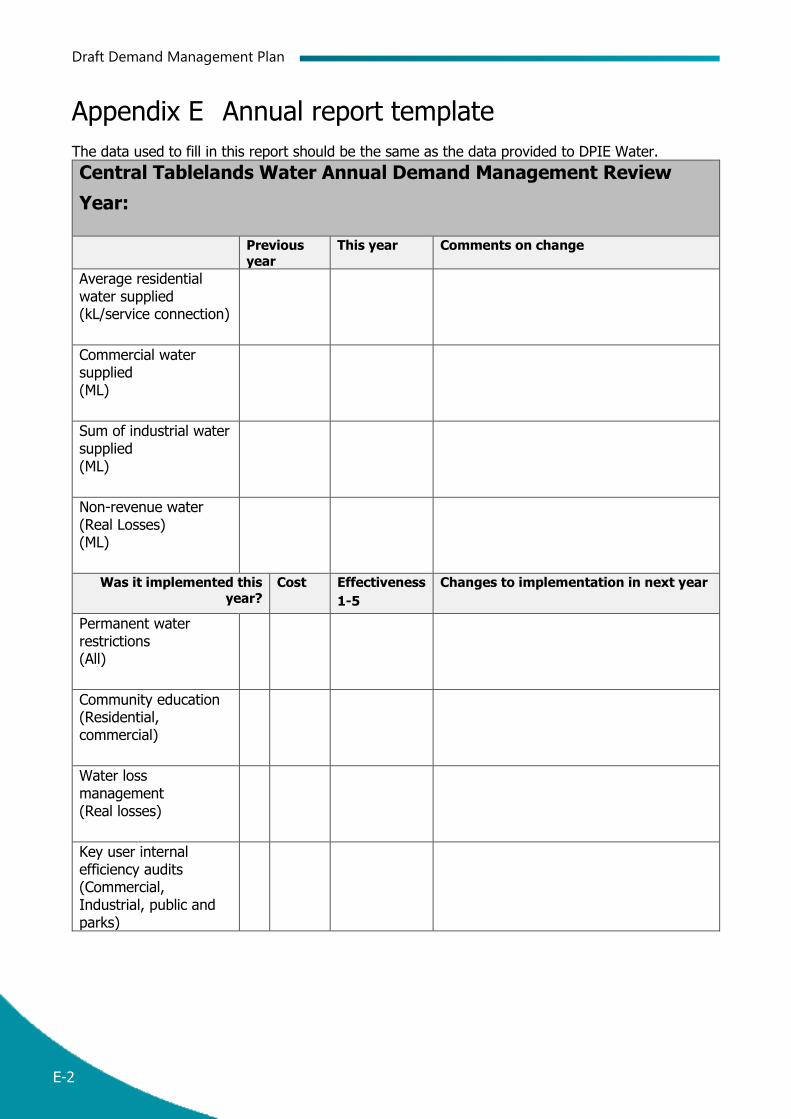
Appendix E Annual report template
The data used to fill in this report should be the same as the data provided to DPIE Water.
Central Tablelands Water Annual Demand Management Review
Year:
Previous year
This year Comments on change
Average residential water supplied (kL/service connection)
Commercial water supplied (ML)
Sum of industrial water supplied (ML)
Non-revenue water (Real Losses) (ML)
Was it implemented this year?
Cost Effectiveness
1-5
Changes to implementation in next year
Permanent water restrictions (All)
Community education (Residential, commercial)
Water loss management (Real losses)
Key user internal efficiency audits (Commercial, Industrial, public and parks)