travel demand model technical memo draft 2020-1001
TRANSCRIPT

RESEARCH PARK STRATEGIC VISION PLAN | TRAVEL DEMAND TECHNICAL MEMO (02 Oct 2020) University of Utah
Nelson\Nygaard Consulting Associates, Inc. | 1
TRAVEL DEMAND MODEL TECHNICAL MEMO DESCRIPTION AND PURPOSE OF ANALYSIS The following technical memorandum outlines the analyses conducted to estimate vehicle trips generated by the University of Utah’s Research Park Strategic Vision Plan. As discussed below, the methodology uses traditional trip generation rates provided in the Institute of Transportation Engineers (ITE) Trip Generation Manual (10th Edition); specific adjustments were incorporated to refine (and reduce) daily and weekday peak-hour vehicle trips based on a number of factors that influence travel behavior. Reductions are applied to the baseline calculations to develop projected vehicle trips created from various phases associated with buildout of Research Park. The University of Utah has developed four phases for the buildout of the Strategic Vision Plan as shown in Table 1.
Due to the significant amount of time and resources required to plan, design, and build many of the mobility infrastructure components of the Strategic Vision Plan, Phases 2 and 3 were the focus of this travel demand modeling effort and technical memorandum. Sufficient information related to the transportation network and regional trip patterns at the 30-year planning horizon of 2050 was not available for modeling. The analysis utilizes a traditional 4-step model and assigns trips in the study area, including background growth on key arterials adjacent to Research Park.
Table 1 Phased Development Plan Timeline
Phase Projected Timeline Year of Completion
Phase 1 5 Years 2025
Phase 2 10 Years 2030
Phase 3 20 Years 2040
Phase 4 30 Years 2050
The results shown in this memorandum are to be used to inform the effects of a shift in travel behavior associated with significant changes to Research Park related to land use, transportation, and various mobility programming and policies. The following memorandum does not analyze vehicle delay or level of service and is intended to support decision-making for transportation and land use elements of the vision planning effort. In addition to the travel demand modeling exercise, this memorandum also reports on the existing and future street network utilizing the Utah

RESEARCH PARK STRATEGIC VISION PLAN | TRAVEL DEMAND TECHNICAL MEMO (02 Oct 2020) University of Utah
Nelson\Nygaard Consulting Associates, Inc. | 2
Street Connectivity Guide’s methodology to evaluate the performance of the Vision Plan’s street grid. The indices from this analysis methodology can be used to compare phases and scenarios to make decisions on improvements to street connectivity.
METHODOLOGY The following section describes the methodology used to determine vehicle trips and the tools used to calibrate existing and future phase volumes. A flow chart detailing the methodology for calculating travel demand for the Vision Plan study area is shown in Figure 1.
Figure 1 Travel Demand Methodology
Baseline Trip Generation The vehicle trip generation methodology uses the ITE Trip Generation Manual (10th Edition) to determine baseline daily and weekday morning (AM) and evening (PM) peak-hour vehicle trips1. The traditional impact methodologies of the ITE Trip Generation Manual are regularly used to conduct local area or use-specific traffic studies, as they include the most comprehensive sources of empirical data on the traffic impacts of different land uses. That said, Trip Generation is generally well suited for auto-oriented, stand-alone suburban sites, from where the vast majority of data were collected. For downtown mixed-use areas or neighborhoods with good public transportation, ITE simply advises that traffic engineers either collect local data or adjust the ITE average trip generation rate to account for reduced auto use – hence the ad hoc approach used by project proponents.
1 ITE Land Use Codes used: Land Use 210 (Single Family); Land Use 220 (Multifamily Housing [Low-Rise]); Land Use 820 (Shopping Center); and Land Use Code 110 (Industrial). Trip Generation Manual 10th Edition, Volume 2: Date; ITE, 2017. For purposes of this analysis and to provide a conservative estimation of potential vehicle demand, land uses categorized as “suburban-urban” were applied as opposed to land uses categorized as “dense, mixed-use urban, or city core”, to avoid overestimating vehicle trip reductions or utilizing incomplete data, as the latter categories were recently introduced to the ITE Trip Generation Manual and comprehensive data is still being collected as of the current 10th Edition.
Calculate future growth for baseline counts
Apply future growth to existing counts for
future base volumes
Add net new trips to future base volumes to
calculate future volumes
Calculate MXD & CAPCOA reductions
Calculate trip generation based on existing and
future land use schemes
Apply MXD & CAPCOA reductions to calculate existing and future
trips
Calculate net new trips per phase based on
existing and future trips
RESEARCH PARK STRATEGIC VISION PLAN | TRAVEL DEMAND TECHNICAL MEMO (02 Oct 2020) University of Utah
Nelson\Nygaard Consulting Associates, Inc. | 3
The methods of performing a traffic study often fail to account for a variety of potential conditions that have been shown to have significant impacts on vehicle trip rates, such as parking pricing, quality of bike facilities, live-work mix, or housing density. The traditional methodology for conducting traffic studies is well established in the transportation planning and traffic engineering profession. The first step – which is the only element considered for revision in this study – is to calculate the number of vehicle trips that will be generated by each land use. Engineers draw from the Trip Generation manual, which notes that:
“The average trip generation rates… were primarily collected at suburban locations having little or no transit service, nearby pedestrian amenities, or transportation demand management (TDM) programs. At specific sites, the user may wish to modify trip generation rates presented in this document to reflect the presence of public transportation service, ridesharing or other TDM measures, enhanced pedestrian and bicycle trip-making opportunities, or other special characteristics of the site or surrounding area (Institute of Transportation Engineers, 2010).”
Trip Reduction Calibration Methods Adjustments to the trip generation estimation were applied for all analysis scenarios, existing conditions included due to the University context, existing transportation network, and accessibility to available modes. Further reductions, explained below, are applied in future phase scenarios in the Vision Plan based on the project’s focus on promoting increased modal connectivity, development of multimodal facilities aimed to reduce dependency on vehicle trips, and providing a more balanced mix of land uses.
Mixed-Use Trip Generation Model (MXD) Mixed-use developments, such as the Strategic Vision Plan, generally shorten trips and thus allow what might otherwise be vehicle trips to external destinations to become internal walking, cycling, or transit trips. Thus, a mixed-use development that generates a given number of total trips creates less demand on the external roadway network than single-use developments generating the same number of trips. For example, the project would include 135,000 square feet of retail located within close proximity to the residential units; therefore, a certain percentage of the residents would likely opt to bike or walk to these shops instead of driving. As a result, a percent reduction in total vehicle trips generated is applicable.
Trip reductions were calculated using the MXD+ method developed by Fehr & Peers, which includes a combination of quantifiable methods used to more accurately assess trip generation estimation for mixed-use developments; the quantifiable methods that form the basis for the MXD+ method were developed and sponsored by the U.S. Environmental Protection Agency (EPA) and Transportation Research Board (TRB). The
RESEARCH PARK STRATEGIC VISION PLAN | TRAVEL DEMAND TECHNICAL MEMO (02 Oct 2020) University of Utah
Nelson\Nygaard Consulting Associates, Inc. | 4
MXD+ method uses ITE trip generation rates and then adjusts those estimates to account for the mix of uses and environmental characteristics (e.g., geographic layout of the site, land use in surrounding area, socioeconomic data, proximity to land uses and transportation resources, etc.)2
The findings indicate that the amount of external traffic generated by the planned development is affected by a wide variety of factors including the mix of employment and residents, the overall size and density of the development, the internal connectivity for walking or driving among land uses, the availability of transit service, and the surrounding trip destinations. An empirically validated method of estimating vehicle trip generation at mixed-use developments was the result of the research. The model allows for predicting external vehicle trip reduction as a function of the mixed-use characteristics. Applying the external vehicle trip reduction percentage to “raw trips”, as predicted by ITE, produces an estimate for the number of vehicle trips traveling in or out of the site. To reiterate, the basis for this MXD+ model is the standard ITE trip generation rates and equations.
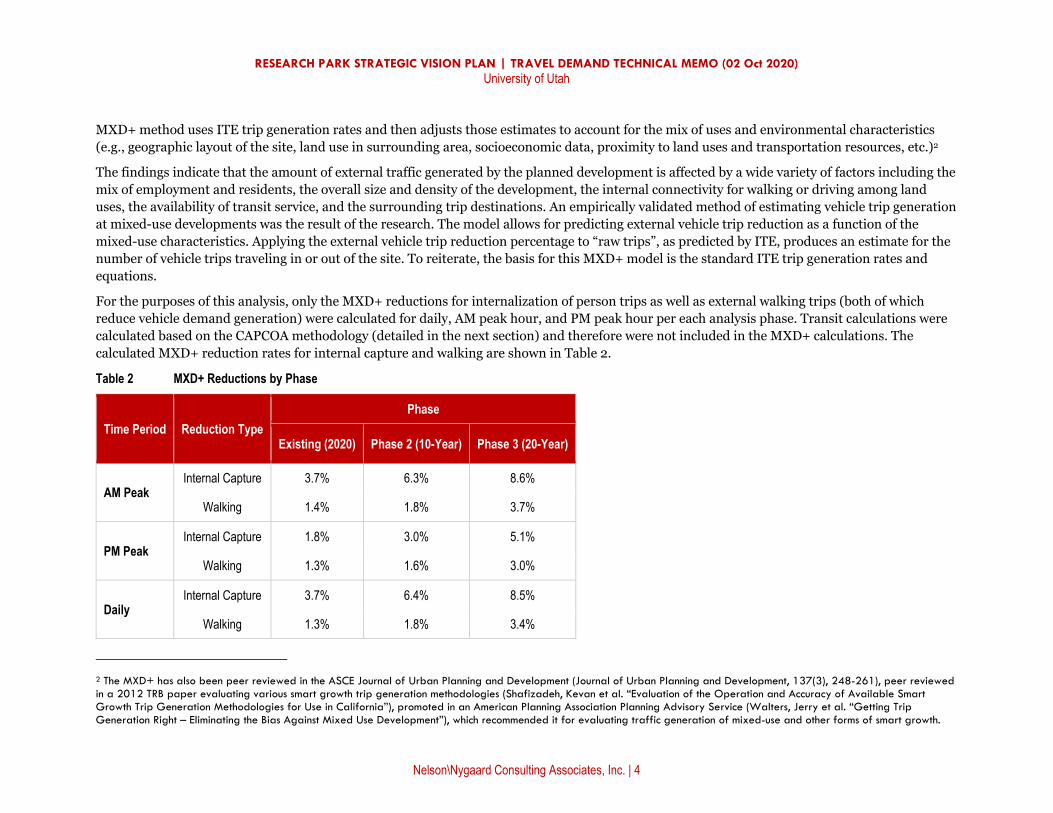
For the purposes of this analysis, only the MXD+ reductions for internalization of person trips as well as external walking trips (both of which reduce vehicle demand generation) were calculated for daily, AM peak hour, and PM peak hour per each analysis phase. Transit calculations were calculated based on the CAPCOA methodology (detailed in the next section) and therefore were not included in the MXD+ calculations. The calculated MXD+ reduction rates for internal capture and walking are shown in Table 2.
Table 2 MXD+ Reductions by Phase
Time Period Reduction Type Phase
Existing (2020) Phase 2 (10-Year) Phase 3 (20-Year)
AM Peak Internal Capture 3.7% 6.3% 8.6%
Walking 1.4% 1.8% 3.7%
PM Peak Internal Capture 1.8% 3.0% 5.1%
Walking 1.3% 1.6% 3.0%
Daily Internal Capture 3.7% 6.4% 8.5%
Walking 1.3% 1.8% 3.4%
2 The MXD+ has also been peer reviewed in the ASCE Journal of Urban Planning and Development (Journal of Urban Planning and Development, 137(3), 248-261), peer reviewed in a 2012 TRB paper evaluating various smart growth trip generation methodologies (Shafizadeh, Kevan et al. “Evaluation of the Operation and Accuracy of Available Smart Growth Trip Generation Methodologies for Use in California”), promoted in an American Planning Association Planning Advisory Service (Walters, Jerry et al. “Getting Trip Generation Right – Eliminating the Bias Against Mixed Use Development”), which recommended it for evaluating traffic generation of mixed-use and other forms of smart growth.

RESEARCH PARK STRATEGIC VISION PLAN | TRAVEL DEMAND TECHNICAL MEMO (02 Oct 2020) University of Utah
Nelson\Nygaard Consulting Associates, Inc. | 5
As previously discussed, there are several planned infrastructure and policy improvements that would result in a connected, multimodal network that supports transit and other non-driving modes. Key vehicle trip adjustments factors associated with these policies and investments are described in the following section.
California Air Pollution Control Officers Association (CAPCOA) Reduction Model Traditional traffic and parking models do not always capture the impacts of mixed-used development, multimodal investments, and transportation demand management (TDM) programs. Quantifying Greenhouse Gas Mitigation Measures prepared by the California Air Pollution Control Officers Association (CAPCOA) provides additional guidance to estimate vehicle miles travelled (VMT) reductions from six primary categories of transportation improvements. This methodology is utilized as a tool to estimate the potential vehicle trip reduction impacts at Research Park.
Within its six general categories, CAPCOA also provides a range of impacts for a more specific subsets of projects, policies, or program elements/strategies. The expected range of impact is primarily dependent on level of investment/implementation (e.g. amount of transit service expansion or increase in employee parking price) and overall land use context for the study area – “urban, compact infill, suburban center, and suburban.” In short, the higher the level of implementation and the more “urban” the land use context, the higher potential impact. Other methodological notes include:
Impact estimation: CAPCOA provides a range of quantitative methods and factors. It is important to note that application of CAPCOA, especially with a district master plan, is based on a mix of its quantitative methods and qualitative assumptions. For example, predicting trip and/or parking reduction impacts 20 years from now from a TDM program that is currently in development is ultimately an exercise in best available judgement and reasonable assumptions. CAPCOA is best utilized to provide an approximate range of impact.
Combining elements or strategies: Transportation strategies are often implemented together, not in isolation, which complicates measurement of cumulative impact. Strategies are not additive, as “each successive measure is slightly less effective than predicted when implemented on its own.” CAPCOA provides guidance on how to combine strategies to avoid “double counting” reduction impacts.
Global maximum: CAPCOA also caps reduction impacts, recognizing that the location of a project site is crucial. For example, even the most robust TDM program in a “suburban” setting will be limited in its ability to reduce vehicle trips simply due to its suburban location.
Finally, it is important to note that while the travel demand model, high capacity transit (HCT) pivot-point analysis model, and the shared parking model are related efforts, they are ultimately distinct analyses. For the travel demand model, CAPCOA provides a cumulative vehicle trip reduction

RESEARCH PARK STRATEGIC VISION PLAN | TRAVEL DEMAND TECHNICAL MEMO (02 Oct 2020) University of Utah
Nelson\Nygaard Consulting Associates, Inc. | 6
factor for transit, parking, and TDM improvements in the 10-year and 20-year model scenarios, supplementing the MXD+ model’s ability to estimate reduced vehicle trips due to internal capture. For the shared parking model, CAPCOA was not utilized as a direct input, but rather to ensure that the transit trip reductions and parking demand reductions achieved in the parking model due to TDM and multimodal investment are equivalent in scale to what was assumed in the travel demand model.
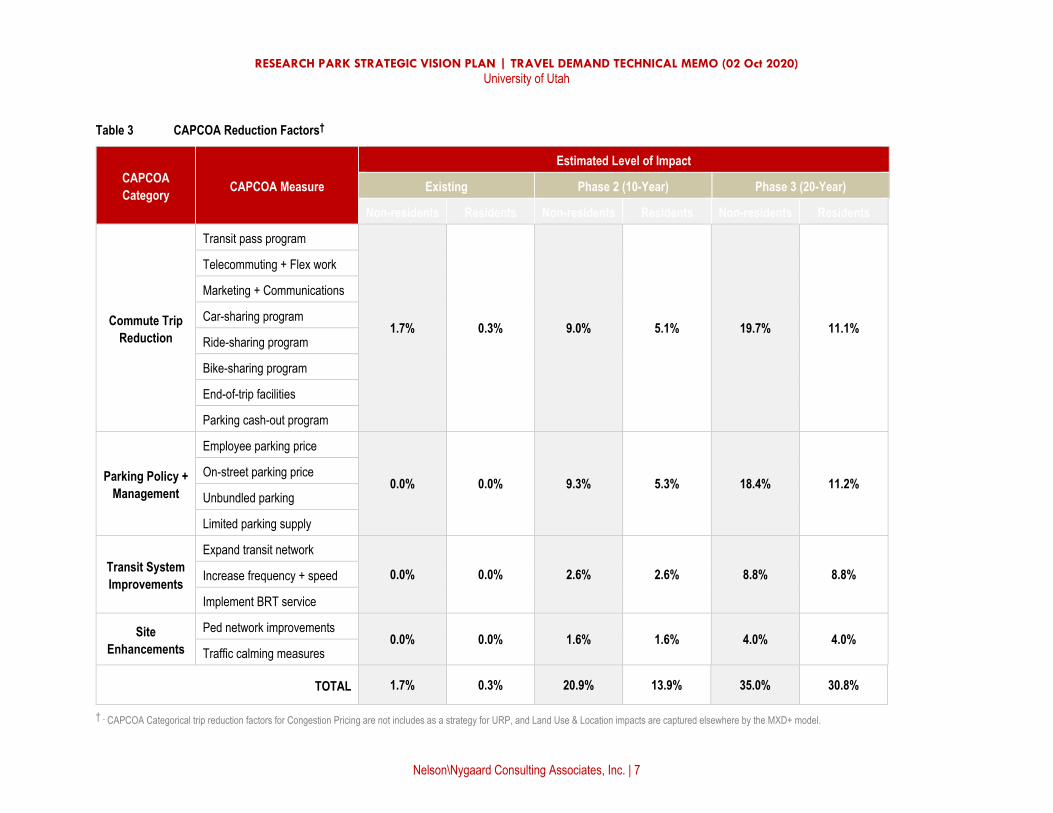
More information on programs, strategies, and improvements related to transit, parking, and transportation demand management and their effects on reducing vehicle trips into and out of the study area is available in the High Capacity Transit Memo and Parking and Transportation Demand Management Memo, respectively. A summary showing CAPCOA related reductions can be found below in Table 3.
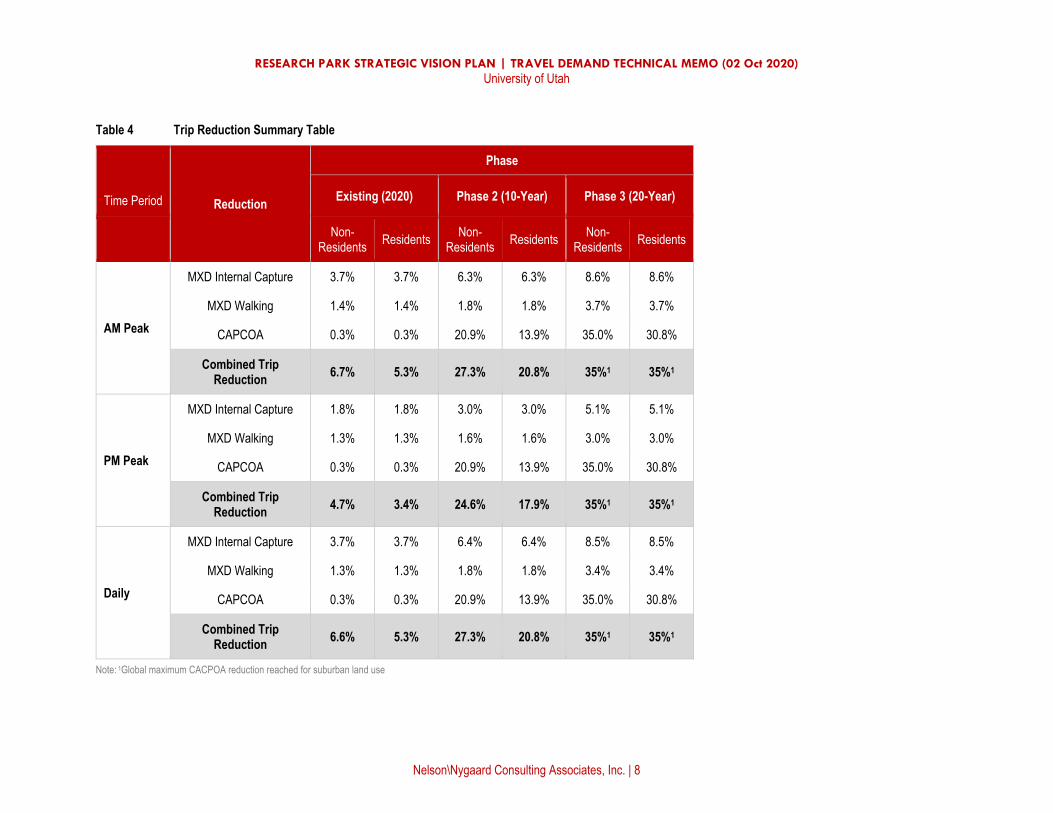
Combined Trip Reduction Calculation (MXD+CAPCOA) The CAPCOA and MXD+ reductions were combined to calculate trip reductions for each phase for AM peak hour, PM peak hour, and daily volumes. These strategies were not additive but rather complementary and synergistic. This is mathematically represented by the formula below:
Combined Trip Reduction = 1 – (1 – MXD Internal Capture) * (1 – MXD Walking) * (1 – CAPCOA)
The global maximum reduction per CAPCOA for suburban center, the land use context most appropriate for this analysis, is 35% overall. For this reason, the combined trip reduction was capped at 35% for each phase. A summary of all trip reductions including the combined trip reductions is shown in Table 4.
RESEARCH PARK STRATEGIC VISION PLAN | TRAVEL DEMAND TECHNICAL MEMO (02 Oct 2020) University of Utah
Nelson\Nygaard Consulting Associates, Inc. | 7
Table 3 CAPCOA Reduction Factors†
CAPCOA Category CAPCOA Measure
Estimated Level of Impact
Existing Phase 2 (10-Year) Phase 3 (20-Year)
Non-residents Residents Non-residents Residents Non-residents Residents
Commute Trip Reduction
Transit pass program
1.7% 0.3% 9.0% 5.1% 19.7% 11.1%
Telecommuting + Flex work
Marketing + Communications
Car-sharing program
Ride-sharing program
Bike-sharing program
End-of-trip facilities
Parking cash-out program
Parking Policy + Management
Employee parking price
0.0% 0.0% 9.3% 5.3% 18.4% 11.2% On-street parking price
Unbundled parking
Limited parking supply
Transit System Improvements
Expand transit network
0.0% 0.0% 2.6% 2.6% 8.8% 8.8% Increase frequency + speed
Implement BRT service
Site Enhancements
Ped network improvements 0.0% 0.0% 1.6% 1.6% 4.0% 4.0%
Traffic calming measures
TOTAL 1.7% 0.3% 20.9% 13.9% 35.0% 30.8%
† - CAPCOA Categorical trip reduction factors for Congestion Pricing are not includes as a strategy for URP, and Land Use & Location impacts are captured elsewhere by the MXD+ model.
RESEARCH PARK STRATEGIC VISION PLAN | TRAVEL DEMAND TECHNICAL MEMO (02 Oct 2020) University of Utah
Nelson\Nygaard Consulting Associates, Inc. | 8
Table 4 Trip Reduction Summary Table
Time Period Reduction
Phase
Existing (2020) Phase 2 (10-Year) Phase 3 (20-Year)
Non-Residents Residents Non-
Residents Residents Non-Residents Residents
AM Peak
MXD Internal Capture 3.7% 3.7% 6.3% 6.3% 8.6% 8.6%
MXD Walking 1.4% 1.4% 1.8% 1.8% 3.7% 3.7%
CAPCOA 0.3% 0.3% 20.9% 13.9% 35.0% 30.8%
Combined Trip Reduction 6.7% 5.3% 27.3% 20.8% 35%1 35%1
PM Peak
MXD Internal Capture 1.8% 1.8% 3.0% 3.0% 5.1% 5.1%
MXD Walking 1.3% 1.3% 1.6% 1.6% 3.0% 3.0%
CAPCOA 0.3% 0.3% 20.9% 13.9% 35.0% 30.8%
Combined Trip Reduction 4.7% 3.4% 24.6% 17.9% 35%1 35%1
Daily
MXD Internal Capture 3.7% 3.7% 6.4% 6.4% 8.5% 8.5%
MXD Walking 1.3% 1.3% 1.8% 1.8% 3.4% 3.4%
CAPCOA 0.3% 0.3% 20.9% 13.9% 35.0% 30.8%
Combined Trip Reduction 6.6% 5.3% 27.3% 20.8% 35%1 35%1
Note: 1Global maximum CACPOA reduction reached for suburban land use

RESEARCH PARK STRATEGIC VISION PLAN | TRAVEL DEMAND TECHNICAL MEMO (02 Oct 2020) University of Utah
Nelson\Nygaard Consulting Associates, Inc. | 9
Background Growth 24-hour traffic counts were taken on February 26, 2020 at Foothill Dr south of Wakara Way and Wakara Way northeast of Foothill Dr. These counts were used to calibrate segment volumes in the study area. A map showing the location of the 24-hour counts is shown in Figure 2.
Figure 2 Research Park Traffic Count- Study Segments

RESEARCH PARK STRATEGIC VISION PLAN | TRAVEL DEMAND TECHNICAL MEMO (02 Oct 2020) University of Utah
Nelson\Nygaard Consulting Associates, Inc. | 10
The Wasatch Front Regional Council (WFRC) manages the travel demand model for Salt Lake City. The current available data forecasts future Average Daily Traffic (ADT) volumes based on 2017 counts. The WFRC values and 2020 ADT counts were used to calculate projected future base vehicle volumes. The 2020 counts were 15% and 17% greater than the projected 2019 volumes. As a result, a 16% calibration adjustment was applied to all 2019 projected volumes to estimate 2020 ADT for all the major roadways in the study area. Future phase auto traffic was calculated using WFRC model projections for 2030 and 2040 years (associated with Phases 2 and 3, respectively), and then applied to the 2020 calibrated volumes, resulting in 2030 and 2040 calibrated base volumes. All values can be seen in Table 5. The calibrated 2030 and 2040 volumes based on the WFRC growth model can be seen in Figure 3 and Figure 4.
Table 5 WFRC Model Projections and Calibrated Volumes by Segment
Segment
Model Projections Calibration
2019 ADT 2030 ADT 2040 ADT 2020 ADT Actual/Calibrated
2030 (% per year)
2030 ADT 2040 (% per year)
2040 ADT
Foothill Dr N of Mario Capecchi Dr 28,000 29,000 30,500 32,589 +0.32% 33,647 +0.52% 35,387
Foothill Dr S of Wakara Way1 47,000 48,000 49,000 54,236 +0.19% 55,285 +0.21% 56,437
Foothill Dr S of Sunnyside Ave 44,000 44,500 45,000 51,211 +0.10% 51,740 +0.11% 52,322
Sunnyside Ave W of Foothill Dr 20,500 21,500 22,500 23,860 +0.44% 24,918 +0.47% 26,077
Sunnyside Ave E of Foothill Dr 4,400 4,700 4,800 5,121 +0.62% 5,439 +0.21% 5,554
Wakara Way NE of Foothill Dr1 17,000 17,000 17,000 19,955 +0.00% 19,955 +0.00% 19,955
Note: 1Study segment; Uses actual 2020 count data for basis of calibration
Per the WFRC model, external street growth, such as those on Foothill Dr and Sunnyside Ave, is very minimal, between 0.1% and 0.5% per year between 2020 and 2040. The WFRC model does not apply growth to streets internal to the University. It is assumed that the Research Park Strategic Vision Plan’s travel demand model trip generation exercise will capture appropriate growth for these streets based on proposed land use and street network.

RESEARCH PARK STRATEGIC VISION PLAN | TRAVEL DEMAND TECHNICAL MEMO (02 Oct 2020) University of Utah
Nelson\Nygaard Consulting Associates, Inc. | 11
Figure 3 Daily Traffic Volumes – Ph.2 (2030) Background

RESEARCH PARK STRATEGIC VISION PLAN | TRAVEL DEMAND TECHNICAL MEMO (02 Oct 2020) University of Utah
Nelson\Nygaard Consulting Associates, Inc. | 12
Figure 4 Daily Traffic Volumes – Ph.3 (2040) Background

RESEARCH PARK STRATEGIC VISION PLAN | TRAVEL DEMAND TECHNICAL MEMO (02 Oct 2020) University of Utah
Nelson\Nygaard Consulting Associates, Inc. | 13
ANALYSIS SCENARIOS The University of Utah has developed four phases for the buildout of the Strategic Vision Plan as shown in Table 1. The land use program for each phase is shown in Figure 5. Figure 5 Land Use Program, by Phase
Three analysis scenarios highlighted as “Studied Phase” in Figure 5 were chosen for the travel demand modeling element of the project to determine the extent to which the project may affect the surrounding transportation environment during weekday morning (AM) and evening (PM) peak periods. These scenarios are as follows:
Existing Conditions (2020) – This scenario represents current traffic conditions and the existing roadway network. Intersection traffic volumes are based on existing intersection turning movement counts collected by Nelson\Nygaard.
0
2,000,000
4,000,000
6,000,000
8,000,000
10,000,000
12,000,000
14,000,000
16,000,000
Existing Phase 1 Phase 2 Phase 3 Phase 4
Squa
re F
eet Retail
Civic
Hotel
Residential
Office / LabStudied Phase

RESEARCH PARK STRATEGIC VISION PLAN | TRAVEL DEMAND TECHNICAL MEMO (02 Oct 2020) University of Utah
Nelson\Nygaard Consulting Associates, Inc. | 14
Phase 2 (10-Year) Conditions (2030) – Future traffic conditions based on the Wasatch Front Regional Council (WFRC) regional travel demand model projected growth for 2030 and trip generation associated with the Phase 2 land use program.
Phase 3 (20-Year) Conditions (2040) – Future traffic conditions based on the Wasatch Front Regional Council (WFRC) regional travel demand model projected growth for 2040 and trip generation associated with the Phase 3 land use program.
Existing Conditions Land Use
The land use program for the existing scenario was used to calculate how many trips Research Park generates in 2020. The existing land use program can be seen in Table 6Error! Reference source not found..
Table 6 Land Use Program – Existing Conditions
Land Uses Development (Units, Square Footage) Office Office Research & Development
3,047,361 square feet 761,840 square feet
Residential Studio/One-Bedroom Two-Bedroom Three-Bedroom Four-Bedroom
70 dwelling units 168 dwelling units 84 dwelling units 0 dwelling units
Hotel 175,000 square feet (188 rooms)
Retail 0 square feet Source: Perkins+Will, July 2020.
Roadway Network
Research Park is located in the southeast corner of the University of Utah campus. It backs up on to the Wasatch Mountain Range foothills in the east and is bounded on the north by Red Butte Creek just north of Wakara Way, on the west by Foothill Drive, and on the south by East Sunnyside Avenue as shown in Figure 6. Figure 7
A list of study intersections and segments can be found below in Table 7 and illustrated in Figure 7. These values were used to calculate projected future base vehicle volumes. The projected volumes calculated for 2019 were compared to 24-hour traffic counts taken at Foothill-S of Wakara and Wakara-NE of Foothill as described in the Background Growth section.

RESEARCH PARK STRATEGIC VISION PLAN | TRAVEL DEMAND TECHNICAL MEMO (02 Oct 2020) University of Utah
Nelson\Nygaard Consulting Associates, Inc. | 15
Table 7 Study Intersections and Segments
ID Study Intersections
1 Foothill Drive / Wakara Way
2 Foothill Drive / Sunnyside Avenue
3 Wakara Way / Chipeta Way
4 Wakara Way / Arapeen Drive
5 Chipeta Way / Arapeen Drive
6 Sunnyside Avenue / Arapeen Drive
Study Segments
Wakara Way northeast of Foothill Drive
Foothill Drive south of Wakara Way
The following roads were included in the analysis as they are the primary arterial roadways providing access and egress points to Research Park.
Wakara Way is 3 lanes in each direction with a landscaped median from Foothill Dr to Arapeen Dr. North of Arapeen Dr, it drops to 2 lanes in each direction. There are continuous sidewalks on the north side and sidewalks begin on the south side just east of Arapeen Dr. There are bike lanes and bus stops along both sides of the street. The intersection of Foothill Dr and Wakara Way is one of 2 main access points to Research Park.
Foothill Dr is 3 lanes in each direction with a painted median and turn lanes at intersections. There is a sidewalk along the west side and a shared use path along the east. There are bus stops on both sides of the street. The intersection of Foothill Dr and Wakara Way is one of 2 main access points to Research Park.
E Sunnyside Ave is 2 lanes in each direction with a center turn lane through the study area with widening for additional turn lanes at the intersections. There are continuous sidewalks along the north side of the road west of the study area to Arapeen Dr and along the south side through the entire study area. There is a bike lane on the north side approaching Arapeen Dr from the east that transitions to a shared use path through the study area and continues north along Foothill Dr. Along the south side of the street, there is a bike lane and on-street parking. The intersection of E Sunnyside Ave and Arapeen Dr is one of 2 main access points to Research Park.
Figure 6 Research Park Study Area
Sunnyside Ave

RESEARCH PARK STRATEGIC VISION PLAN | TRAVEL DEMAND TECHNICAL MEMO (02 Oct 2020) University of Utah
Nelson\Nygaard Consulting Associates, Inc. | 16
Figure 7 Research Park - Study Intersections/Segments
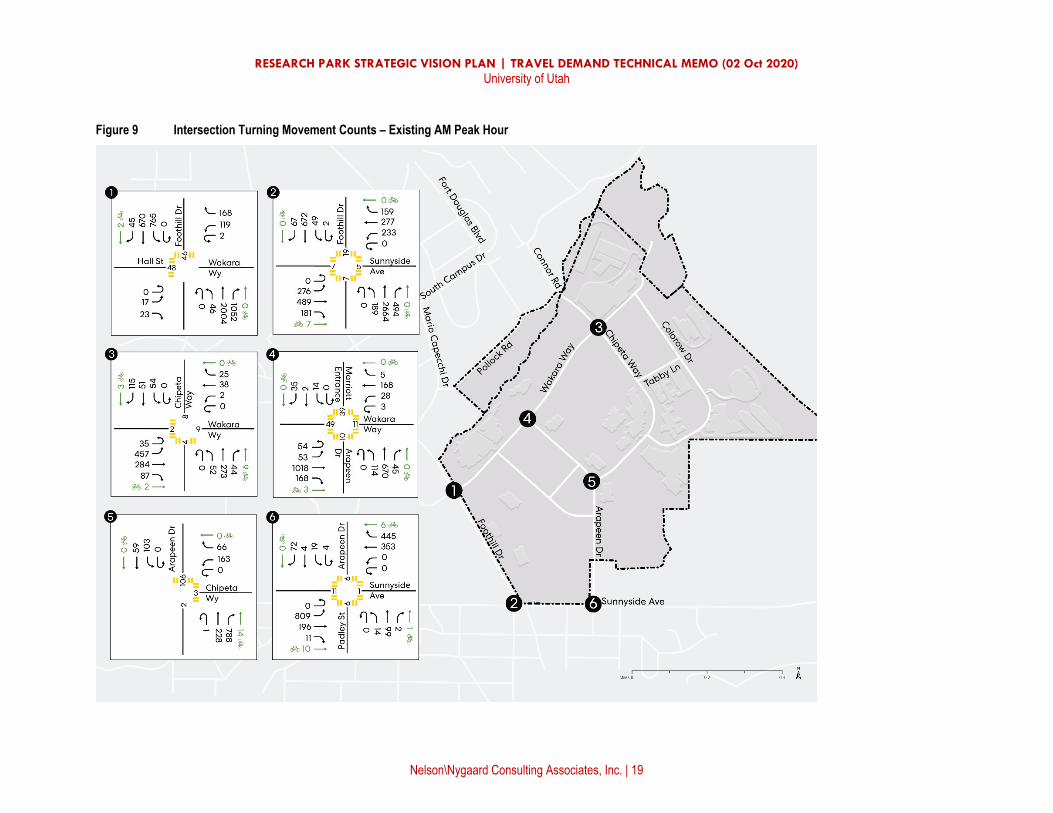
The existing average daily auto traffic volumes along the primary arterials is shown in Figure 8. Multimodal turning movement counts were conducted at study intersections on February 26, 2020. Existing segment volumes at locations that were not studied but used for background growth calculations are also shown. These segments contain traffic volumes calibrated from 2019 Wasatch Front Regional Council data and

RESEARCH PARK STRATEGIC VISION PLAN | TRAVEL DEMAND TECHNICAL MEMO (02 Oct 2020) University of Utah
Nelson\Nygaard Consulting Associates, Inc. | 17
interpolated to 2020. The multimodal turning movement counts and segment volumes can be seen in Error! Reference source not found.Figure 9, and Figure 10.

RESEARCH PARK STRATEGIC VISION PLAN | TRAVEL DEMAND TECHNICAL MEMO (02 Oct 2020) University of Utah
Nelson\Nygaard Consulting Associates, Inc. | 18
Figure 8 Daily Traffic Volumes – Existing (2020)
RESEARCH PARK STRATEGIC VISION PLAN | TRAVEL DEMAND TECHNICAL MEMO (02 Oct 2020) University of Utah
Nelson\Nygaard Consulting Associates, Inc. | 19
Figure 9 Intersection Turning Movement Counts – Existing AM Peak Hour

RESEARCH PARK STRATEGIC VISION PLAN | TRAVEL DEMAND TECHNICAL MEMO (02 Oct 2020) University of Utah
Nelson\Nygaard Consulting Associates, Inc. | 20
Figure 10 Intersection Turning Movement Counts – Existing PM Peak Hour

RESEARCH PARK STRATEGIC VISION PLAN | TRAVEL DEMAND TECHNICAL MEMO (02 Oct 2020) University of Utah
Nelson\Nygaard Consulting Associates, Inc. | 21
Phase 2 (10-Year) Conditions In Phase 2 (10-Year), the land development plan increases square footage for all land uses as seen in

RESEARCH PARK STRATEGIC VISION PLAN | TRAVEL DEMAND TECHNICAL MEMO (02 Oct 2020) University of Utah
Nelson\Nygaard Consulting Associates, Inc. | 22
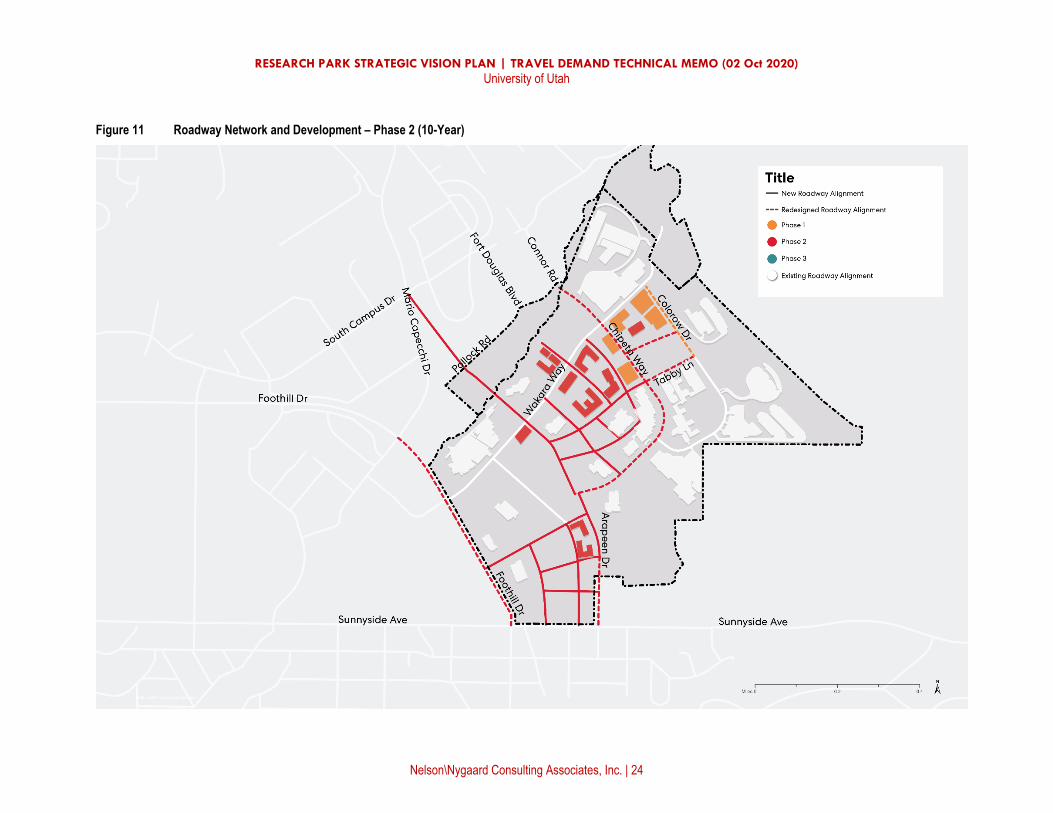
Table 8. Some residential units are added near Arapeen Dr, while most of the additional buildings are constructed along Wakara Way. A map of the proposed roadway changes and additional buildings can be seen in Figure 11. Additional roadways are also constructed to provide increased connectivity within the area bounded by Wakara Way, Arapeen Dr, and Chipeta Way.
Arapeen Dr is realigned slightly between Sunnyside Ave and Wakara Way to respond to the land use changes completed at the Phase 2, 10-year timeline. This includes redevelopment of the East Village campus housing within the next seven years and reconstruction of the adjacent roadway network, which includes Arapeen Dr, to align with the adopted development plans. Arapeen Dr continues to connect to Wakara Way at an intersection location that matches the existing conditions. This intersection continues North through to the new Arapeen Connector, which is a transit-only street with nonmotorized access beginning at Wakara Way and extending to Mario Capecchi/S Campus Dr. Vehicular access to the existing hotel fronting Wakara Way at Arapeen Dr is also preserved.
Additional transit access to Research Park is also provided by a new connection to Foothill Dr, which includes a roadway segment between Foothill Dr north of East Village and running perpendicular to Arapeen Dr. The access control at Foothill Dr is transit-only, while the new roadway segments between Foothill and from Arapeen Dr is mixed flow with vehicles and transit allowed. Details on the signal operations and intersection configuration of Foothill Dr and the new transit-only access point will be determined during subsequent planning and engineering efforts in collaboration with appropriate agencies. More information on enhancements to transit service, facilities, and its phasing can be found in the Vision Plan High Capacity Transit Analysis memo.
Finally, new right-in, right-out access points to Research Park between Sunnyside Ave and Wakara Way are provided by new north-south roads through the East Village. The exact configuration of these minor access points is still to be determined, however for the purposes of this analysis they are assumed to serve local access in and around the East Village area.

RESEARCH PARK STRATEGIC VISION PLAN | TRAVEL DEMAND TECHNICAL MEMO (02 Oct 2020) University of Utah
Nelson\Nygaard Consulting Associates, Inc. | 23
Table 8 Land Use Program – Phase 2 (10-Year) Conditions
Land Uses Net New Development
(Units, Square Footage) Total Development at Phase
(Units, Square Footage) Office Office Research & Development
+208,000 square feet +52,000 square feet
3,255,361 square feet 813,840 square feet
Residential Studio/One-Bedroom Two-Bedroom Three-Bedroom Four-Bedroom
+451 dwelling units +402 dwelling units +138 dwelling units +48 dwelling units
521 dwelling units 570 dwelling units 222 dwelling units 48 dwelling units
Hotel +125,000 square feet (250 rooms) 300,000 square feet (438 rooms)
Retail +60,000 square feet 60,000 square feet Source: Perkins+Will, July 2020.
RESEARCH PARK STRATEGIC VISION PLAN | TRAVEL DEMAND TECHNICAL MEMO (02 Oct 2020) University of Utah
Nelson\Nygaard Consulting Associates, Inc. | 24
Figure 11 Roadway Network and Development – Phase 2 (10-Year)

RESEARCH PARK STRATEGIC VISION PLAN | TRAVEL DEMAND TECHNICAL MEMO (02 Oct 2020) University of Utah
Nelson\Nygaard Consulting Associates, Inc. | 25
Phase 3 (20-Year) Conditions In Phase 3 (20-Year), the land use scheme increases square footage for all land uses, excluding the hotel, as seen in More information on enhancements to transit service, facilities, and its phasing can be found in the Vision Plan High Capacity Transit Analysis memo.
Table 9. Additional development covers mostly the area between Arapeen Dr and Foothill Dr. A map of the proposed roadway changes and additional buildings can be seen in Figure 12. Additional roadways are also constructed to provide increased connectivity within the area bounded by Wakara Way, Arapeen Dr, and Foothill Dr. Wakara Way is redesigned from Foothill Dr to Chipeta Way. No new access points to roadways outside of the University campus are added in this phase (Foothill Dr and Sunnyside Ave).
An important internal access modification in this phase is the Arapeen Dr roadway segment between Wakara Way and Tabby Ln converted to transit-only use, meaning private vehicles are not be permitted on this segment. This is an evolution of the Arapeen Connector west of Wakara Way, which at Phase 3 buildout has new light rail guideway terminating in front of the Convergence Hall, on the southwest side of the intersection of Wakara Way at Arapeen Drive. Nonmotorized travel will still be permitted on Arapeen Dr between Wakara Way and Tabby Ln. More information on enhancements to transit service, facilities, and its phasing can be found in the Vision Plan High Capacity Transit Analysis memo.
Table 9 Land Use Program – Phase 3 (20-Year) Conditions
Land Uses Net New Development
(Units, Square Footage) Total Development at Phase
(Units, Square Footage) Office Office Research & Development
+597,600 square feet +149,400 square feet
3,852,961 square feet 963,240 square feet
Residential Studio/One-Bedroom Two-Bedroom Three-Bedroom Four-Bedroom
+1,585 dwelling units +1,536 dwelling units +558 dwelling units +160 dwelling units
2,106 dwelling units 2,106 dwelling units 780 dwelling units 208 dwelling units
Hotel +0 square feet (0 rooms) 300,000 square feet (438 rooms)
Retail +60,000 square feet 120,000 square feet Source: Perkins+Will, July 2020.

RESEARCH PARK STRATEGIC VISION PLAN | TRAVEL DEMAND TECHNICAL MEMO (02 Oct 2020) University of Utah
Nelson\Nygaard Consulting Associates, Inc. | 26
Figure 12 Roadway Network and Development – Phases 3 (20-Year)

RESEARCH PARK STRATEGIC VISION PLAN | TRAVEL DEMAND TECHNICAL MEMO (02 Oct 2020) University of Utah
Nelson\Nygaard Consulting Associates, Inc. | 27
VEHICLE TRIP GENERATION ANALYSIS The following section describes the results of estimating daily and weekday AM and PM peak-hour vehicle trips generated by the buildout of the Strategic Vision Plan. The analysis includes the vehicle trip reduction analysis and adjustments based on the nature of mixed-use development, an enhanced multimodal network, and improved street network accessibility. ITE land use codes and rates used for the project are shown in Table 10. For each phase, baseline and trip generation with reductions were calculated. Reduction factors applied can be seen in Table 4 of the Methodology section above.
Table 10 Project Land Use Codes & Trip Generation Rates
ITE Land Use Code & Rates1
Use ITE Land Use Code Units Daily Rate AM Rate PM Rate
Off-Campus Student Apartment 225 Bedrooms 3.15 0.12 0.25
Hotel 310 Rooms 8.36 0.47 0.6
General Office Building 710 GFA2 0.00974 0.00116 0.00142
Research and Development Center 760 GFA2 0.01126 0.00042 0.00049
Shopping Center 820 GFA2 0.03775 0.00094 0.00381 1. Trip rates and Inbound/Outbound trip distribution based on ITE Trip Generation, 10th Edition. 2. "GFA” = Gross floor area.
Existing Trip Generation Trip generation was calculated for the existing land use scheme to calculate the net increase in trips for each phase. Baseline trip generation and trip generation with combined MXD+ and CAPCOA reductions applied can be seen in
RESEARCH PARK STRATEGIC VISION PLAN | TRAVEL DEMAND TECHNICAL MEMO (02 Oct 2020) University of Utah
Nelson\Nygaard Consulting Associates, Inc. | 28
and Table 12, respectfully. 4. For a full list and quantifications of trip reductions applied, see Table 4 in the Methodology section above.

RESEARCH PARK STRATEGIC VISION PLAN | TRAVEL DEMAND TECHNICAL MEMO (02 Oct 2020) University of Utah
Nelson\Nygaard Consulting Associates, Inc. | 29
Table 11 Trip Generation - Existing Baseline
ITE Land Use Code & Units1 Project Project Trip Generation
Use Units Units/Rooms/ksf3 Daily AM PM In1 Out1 Total1 In1 Out1 Total1
Off-Campus Student Apartment Bedrooms 658 2,073 32 47 79 82 82 164
Hotel Rooms 188 1,572 52 36 88 58 55 113
General Office Building GFA2 3,047,361 29,682 3,040 495 3,535 779 3,548 4,327
Research and Development Center GFA2 761,840 8,579 240 80 320 56 317 373
Shopping Center GFA2 - - - - - - - -
Total Vehicle Trips 41,906 3,365 658 4,023 975 4,003 4,978 Notes: 1. Trip rates and Inbound/Outbound trip distribution based on ITE Trip Generation, 10th Edition. Total trips may not sum independently due to rounding. 2. "GFA” = Gross floor area. 3. "ksf" = 1,000 gross square feet of development.
Table 12 Trip Generation - Existing with Reductions
ITE Land Use Code & Units1 Project Project Trip Generation (Reductions Applied)
Use Units Units/Rooms/ksf3 Daily AM PM In1 Out1 Total1 In1 Out1 Total1
Off-Campus Student Apartment Bedrooms 658 1,962 31 45 76 78 78 156
Hotel Rooms 188 1,467 50 35 85 54 52 106
General Office Building GFA2 3,047,361 27,702 2,896 471 3,367 727 3,314 4,041
Research and Development Center GFA2 761,840 8,007 229 76 305 52 296 348
Shopping Center GFA2 - - - - - - - -
Adjusted4 Total Vehicle Trips 39,138 3,205 627 3,832 911 3,740 4,651 Notes: 1. Trip rates and Inbound/Outbound trip distribution based on ITE Trip Generation, 10th Edition. Total trips may not sum independently due to rounding. 2. "GFA” = Gross floor area. 3. "ksf" = 1,000 gross square feet of development. 4. Vehicle volumes include the trip reductions as listed in Table 4.

RESEARCH PARK STRATEGIC VISION PLAN | TRAVEL DEMAND TECHNICAL MEMO (02 Oct 2020) University of Utah
Nelson\Nygaard Consulting Associates, Inc. | 30
Phase 2 (10-Year) Trip Generation Trip generation was calculated for the Phase 2 land use scheme. These values were used to calculate net new trips in Phase 2 based on the existing trip generation. Baseline trip generation and trip generation with reductions applied can be seen in
RESEARCH PARK STRATEGIC VISION PLAN | TRAVEL DEMAND TECHNICAL MEMO (02 Oct 2020) University of Utah
Nelson\Nygaard Consulting Associates, Inc. | 31
The total daily trips generated in Phase 2 are 3% higher than the trips estimated based on the existing land use.
RESEARCH PARK STRATEGIC VISION PLAN | TRAVEL DEMAND TECHNICAL MEMO (02 Oct 2020) University of Utah
Nelson\Nygaard Consulting Associates, Inc. | 32
and Table 14 respectfully. For a full list and quantifications of trip reductions applied, see Table 4 in the Methodology section above. The total daily trips generated in Phase 2 are 3% higher than the trips estimated based on the existing land use.

RESEARCH PARK STRATEGIC VISION PLAN | TRAVEL DEMAND TECHNICAL MEMO (02 Oct 2020) University of Utah
Nelson\Nygaard Consulting Associates, Inc. | 33
Table 13 Trip Generation - Phase 2 (10-Year) Baseline
ITE Land Use Code & Units1 Project Project Trip Generation
Use Units Units/Rooms/ksf3 Daily AM PM In1 Out1 Total1 In1 Out1 Total1
Off-Campus Student Apartment Bedrooms 2,519 7,935 124 178 302 315 315 630
Hotel Rooms 438 3,662 121 84 205 134 129 263
General Office Building GFA2 3,255,361 31,708 3,248 529 3,777 832 3,791 4,623
Research and Development Center GFA2 813,840 9,164 256 85 341 60 339 399
Shopping Center GFA2 60,000 2,265 35 21 56 110 119 229
Total Vehicle Trips 54,734 3,784 898 4,682 1,451 4,692 6,143 Notes: 1. Trip rates and Inbound/Outbound trip distribution based on ITE Trip Generation, 10th Edition. Total trips may not sum independently due to rounding. 2. "GFA” = Gross floor area. 3. "ksf" = 1,000 gross square feet of development.
Table 14 Trip Generation - Phase 2 (10-Year) with Reductions
ITE Land Use Code & Units1 Project Project Trip Generation
Use Units Units/Rooms/ksf3 Daily AM PM In1 Out1 Total1 In1 Out1 Total1
Off-Campus Student Apartment Bedrooms 2,519 6,282 102 146 248 249 249 498
Hotel Rooms 438 2,663 92 64 156 97 94 191
General Office Building GFA2 3,255,361 23,061 2,450 399 2,849 605 2,757 3,362
Research and Development Center GFA2 813,840 6,665 193 64 257 44 247 291
Shopping Center GFA2 60,000 1,647 26 16 42 80 86 166
Adjusted4 Total Vehicle Trips 40,319 2,863 690 3,553 1,075 3,433 4,508 Notes: 1. Trip rates and Inbound/Outbound trip distribution based on ITE Trip Generation, 10th Edition. Total trips may not sum independently due to rounding. 2. "GFA” = Gross floor area. 3. "ksf" = 1,000 gross square feet of development. 4. Vehicle volumes include the trip reductions as listed in Table 4.

RESEARCH PARK STRATEGIC VISION PLAN | TRAVEL DEMAND TECHNICAL MEMO (02 Oct 2020) University of Utah
Nelson\Nygaard Consulting Associates, Inc. | 34
Phase 3 (20-Year) Trip Generation Trip generation was calculated for the Phase 3 land use scheme. These values were used to calculate net new trips in Phase 3 based on the existing trip generation. Baseline trip generation and trip generation with reductions applied can be seen in Table 15 and Table 16 respectfully. For a full list and quantifications of trip reductions applied, see Table 4 in the Methodology section above. The total daily trips generated in Phase 3 are 44% higher than the trips estimated based on the existing land use.

RESEARCH PARK STRATEGIC VISION PLAN | TRAVEL DEMAND TECHNICAL MEMO (02 Oct 2020) University of Utah
Nelson\Nygaard Consulting Associates, Inc. | 35
Table 15 Trip Generation - Phase 3 (20-Year) Baseline
ITE Land Use Code & Units1 Project Project Trip Generation
Use Units Units/Rooms/ksf3 Daily AM PM In1 Out1 Total1 In1 Out1 Total1
Off-Campus Student Apartment Bedrooms 9,490 29,894 467 672 1,139 1,186 1,186 2,372
Hotel Rooms 438 3,662 121 84 205 134 129 263
General Office Building GFA2 3,852,961 37,528 3,844 626 4,470 985 4,486 5,471
Research and Development Center GFA2 963,240 10,847 303 101 404 71 401 472
Shopping Center GFA2 120,000 4,530 70 43 113 219 238 457
Total Vehicle Trips 86,461 4,805 1,526 6,331 2,595 6,440 9,035 Notes: 1. Trip rates and Inbound/Outbound trip distribution based on ITE Trip Generation, 10th Edition. Total trips may not sum independently due to rounding. 2. "GFA” = Gross floor area. 3. "ksf" = 1,000 gross square feet of development.
Table 16 Trip Generation - Phase 3 (20-Year) with Reductions
ITE Land Use Code & Units1 Project Project Trip Generation
Use Units Units/Rooms/ksf3 Daily AM PM In1 Out1 Total1 In1 Out1 Total1
Off-Campus Student Apartment Bedrooms 9,490 19,431 303 437 740 771 771 1,542
Hotel Rooms 438 2,380 79 55 134 87 84 171
General Office Building GFA2 3,852,961 24,393 2,498 407 2,905 640 2,916 3,556
Research and Development Center GFA2 963,240 7,051 197 66 263 46 261 307
Shopping Center GFA2 120,000 2,945 45 28 73 143 155 298
Adjusted4 Total Vehicle Trips 56,200 3,124 992 4,116 1,687 4,186 5,873 Notes: 1. Trip rates and Inbound/Outbound trip distribution based on ITE Trip Generation, 10th Edition. Total trips may not sum independently due to rounding. 2. "GFA” = Gross floor area. 3. "ksf" = 1,000 gross square feet of development. 4. Vehicle volumes include the trip reductions as listed in Table 4.

RESEARCH PARK STRATEGIC VISION PLAN | TRAVEL DEMAND TECHNICAL MEMO (02 Oct 2020) University of Utah
Nelson\Nygaard Consulting Associates, Inc. | 36
PROJECT TRIP DISTRIBUTION The trip distribution and assignment of project-generated vehicle trips were developed based on the following:
The existing regional roadway network in proximity of the study area, and
A review of traffic patterns based on Wasatch Front Regional Council model outputs for determining the trip distribution patterns
Figure 13 presents the bidirectional vehicle trip distribution assumed in the Phase 2 and 3 analysis for weekday AM peak hour, PM peak hour, and ADT.

RESEARCH PARK STRATEGIC VISION PLAN | TRAVEL DEMAND TECHNICAL MEMO (02 Oct 2020) University of Utah
Nelson\Nygaard Consulting Associates, Inc. | 37
Figure 13 Existing Trip Distribution (External to Research Park)

RESEARCH PARK STRATEGIC VISION PLAN | TRAVEL DEMAND TECHNICAL MEMO (02 Oct 2020) University of Utah
Nelson\Nygaard Consulting Associates, Inc. | 38
PROJECT TRIP ASSIGNMENT Trip assignment was performed to estimate the number of project trips that would travel along the study segments and through the study intersections in each scenario. Trip assignment was conducted based on the trip distribution percentages outlined in the previous section. In addition, trips were routed to reflect the Phase 2 (10-year) conditions of Arapeen Dr as a transit-only street between Mario Capecchi Dr and Wakara Way, as well as rerouted in Phase 3 (20-year) to reflect the closure of Arapeen Dr between Wakara Way and Tabby Ln to private vehicles. Vehicles were assumed permitted to enter and exit Research Park with right-in, right-out maneuvers via new north-south collector streets connecting to Sunnyside Ave. A marginal number of trips were assigned to these intersections as appropriate. New intersections, beyond modifications to the six existing study area intersections, were not analyzed as part of this analysis. However, trips using new Research Park access points that pass through the six study intersections are accounted for.
Future phase scenario volumes were calculated from existing counts conducted in 2020, along with WFRC data, and include changes in vehicle volumes resulting from:
Background growth, as calculated in the Methodology section above
Rerouted trips from changes to the Research Park transportation network, including proposed auto access restrictions on Arapeen Drive described above
Net new trips to the site from buildout of the Research Park Strategic Vision Plan in each analysis phase
In summary, vehicle trip assignment patterns were determined based on new access points, land-use distribution throughout the entire project site, as well as considering the placement of residential uses, non-residential uses, and key access locations to these uses that would be made by residents, employees, and visitors.
The baseline (background) Phase 2 and Phase 3 traffic volumes can be seen in Figure 3 and Figure 4. Graphics showing the breakdown and variances of the projected volume calculations can be seen in Figure 14 and Figure 15. Phase 2 and Phase 3 turning movement counts in the AM and PM peak hours can be seen in Figure 16 and Figure 17; as well as Figure 18 and Figure 19, respectively.

RESEARCH PARK STRATEGIC VISION PLAN | TRAVEL DEMAND TECHNICAL MEMO (02 Oct 2020) University of Utah
Nelson\Nygaard Consulting Associates, Inc. | 39
Figure 14 Daily Traffic Volume Calculations - Phase 2 (10-Year) Buildout

RESEARCH PARK STRATEGIC VISION PLAN | TRAVEL DEMAND TECHNICAL MEMO (02 Oct 2020) University of Utah
Nelson\Nygaard Consulting Associates, Inc. | 40
Figure 15 Daily Traffic Volume Calculations - Phase 3 (20-Year) Buildout

RESEARCH PARK STRATEGIC VISION PLAN | TRAVEL DEMAND TECHNICAL MEMO (02 Oct 2020) University of Utah
Nelson\Nygaard Consulting Associates, Inc. | 41
Figure 16 Intersection Turning Movements - Phase 2 (10-Year) AM

RESEARCH PARK STRATEGIC VISION PLAN | TRAVEL DEMAND TECHNICAL MEMO (02 Oct 2020) University of Utah
Nelson\Nygaard Consulting Associates, Inc. | 42
Figure 17 Intersection Turning Movements - Phase 2 (10-Year) PM

RESEARCH PARK STRATEGIC VISION PLAN | TRAVEL DEMAND TECHNICAL MEMO (02 Oct 2020) University of Utah
Nelson\Nygaard Consulting Associates, Inc. | 43
Figure 18 Intersection Turning Movements - Phase 3 (20-Year) AM

RESEARCH PARK STRATEGIC VISION PLAN | TRAVEL DEMAND TECHNICAL MEMO (02 Oct 2020) University of Utah
Nelson\Nygaard Consulting Associates, Inc. | 44
Figure 19 Intersection Turning Movements - Phase 3 (20-Year) PM

RESEARCH PARK STRATEGIC VISION PLAN | TRAVEL DEMAND TECHNICAL MEMO (02 Oct 2020) University of Utah
Nelson\Nygaard Consulting Associates, Inc. | 45
STREET CONNECTIVITY ANALYSIS The Utah Street Connectivity Guide methodology was employed to analyze indicators of a transportation network that encourages transportation choice, increases speed for emergency service, improves safety, and promotes a healthy economy.. The methodology was developed by a team of agencies in Utah including the Wasatch Front Regional Council to improve street connectivity and detail the associated benefits for communities across the state. The benefits outlined in the Utah Street Connectivity Guide can be seen in Figure 20.
Figure 20 Benefits of Street Connectivity from the Utah Street Connectivity Guide
Source: Wasatch Front Regional Council. March 2017. Utah Street Connectivity Guide.
The methodology provides four key metrics along with inputs and standards for each aspect based on a community’s context. The four key aspects analyzed herein are:
1. Connectivity Index
This is defined as the ratio of the links, or street lengths, in a given area, to the nodes, or intersections and dead ends, in the same area. This metric calculates how efficient the intersections in a network are. A higher index equates to better connectivity.

RESEARCH PARK STRATEGIC VISION PLAN | TRAVEL DEMAND TECHNICAL MEMO (02 Oct 2020) University of Utah
Nelson\Nygaard Consulting Associates, Inc. | 46
2. Intersections per Square Mile
The number of intersections per square mile indicates density of a network in a region. The inputs and standards for this metric varies depending on the neighborhood context. A higher number of intersections per square mile equates to higher network density and therefore better connectivity.
3. Travel-shed Accessibility Rating
This metric calculates how well a street network facilitates access to destinations. For the purposes of this analysis, a slightly different approach was taken than is what outlined in the Utah Street Connectivity Guide. The methodology was adapted to better fit the character of the study area. Instead of a generating 0.5-mile travel-sheds from specific destinations, this analysis calculated what percentage of buildings could be accessed within 0.5 mile along the network from each building. The output is similar, however, in that the results indicate what percentage of the destinations in the site are accessible within a 0.5-mile distance based on street design. A higher travel-shed accessibility rating equates to better destination access.
4. Pedestrian Block Length
This metric is based on the average of the 5 longest block lengths in a neighborhood. A lower average pedestrian block length equates to fewer barriers to pedestrian accessibility in a network.
The Utah Street Connectivity Guide provides context-based standards for each connectivity metric. The guide defines six types of neighborhoods districts, including a campus district. An educational campus is classified under a campus district and therefore, the most appropriate context type to compare to Research Park. The standard for campus district and the results of the street connectivity analysis can be seen in Table 17.
Table 17 Street Connectivity Analysis Results
Metric Units Campus District Standard1
Phase
Existing (2020)
Phase 2 (10-Year)
Phase 3 (20-Year)
Metric 1: Connectivity Index - 1.50 1.50 1.59 1.63
Metric 2: Intersections per Square Mile Intersections per sq. mile 50 29.55 62.06 81.02
Metric 3: Travel-shed Accessibility Rating Average building accessibility 100%2 62% 65% 64%
Metric 4: Pedestrian Block Length Feet Maximum 500 1,672 1,379 1,113
Notes: 1Campus District Standards as outlined in the Utah Street Connectivity Guide, p. 37

RESEARCH PARK STRATEGIC VISION PLAN | TRAVEL DEMAND TECHNICAL MEMO (02 Oct 2020) University of Utah
Nelson\Nygaard Consulting Associates, Inc. | 47
2Methodolgoy employed varies from the methodology outlined in the Utah Street Connectivity Guide.
Based on the analysis, the connectivity index meets the Campus District Standard in existing conditions and only improves with the implementation of Phase 2 and Phase 3. The existing intersections per square mile ratio is below the standard, however this improves to exceed the standard in Phase 2 and even more in Phase 3, which indicates a higher network density and better connectivity.
The travel-shed accessibility rating and pedestrian block length both do not meet the standard, however they do improve with the implementation of Phase 2 and Phase 3. Also, the variation in the methodology for travel-shed accessibility should be considered when comparing to the standard. Results of the travel-shed accessibility analysis per each phase can be seen in Figure 21, Figure 22, and Figure 23.

RESEARCH PARK STRATEGIC VISION PLAN | TRAVEL DEMAND TECHNICAL MEMO (02 Oct 2020) University of Utah
Nelson\Nygaard Consulting Associates, Inc. | 48
Figure 21 Travel-shed Accessibility Rating with Reference to Existing Conditions

RESEARCH PARK STRATEGIC VISION PLAN | TRAVEL DEMAND TECHNICAL MEMO (02 Oct 2020) University of Utah
Nelson\Nygaard Consulting Associates, Inc. | 49
Figure 22 Travel-shed Accessibility Rating with Reference to Phase 2 Conditions

RESEARCH PARK STRATEGIC VISION PLAN | TRAVEL DEMAND TECHNICAL MEMO (02 Oct 2020) University of Utah
Nelson\Nygaard Consulting Associates, Inc. | 50
Figure 23 Travel-shed Accessibility Rating with reference to Phase 3 Conditions

RESEARCH PARK STRATEGIC VISION PLAN | TRAVEL DEMAND TECHNICAL MEMO (02 Oct 2020) University of Utah
Nelson\Nygaard Consulting Associates, Inc. | 51
Although the standards provide guidelines for the connectivity metrics, the improvement of each metric with the implementation of each phase is most critical. The results show that each phase’s development will improve street connectivity throughout the study area.
CONCLUSIONS Overall, development through Phase 2 is much lower than full build out. This tempered development increase, combined with enhanced trip reduction methods as described above, in the Parking and Transportation Demand Management Memo, and the High Capacity Transit Memo, result in only a 3% increase in daily trips from existing conditions to Phase 2. New policies and increased housing will also help to decrease the number of vehicle trips to and from the existing office and lab space. The improved street connectivity as the phases progress combined with construction of workforce housing and retail space provides more walking and biking opportunities for many trip types.
This model is for planning purposes, however, and rapid changing technology with respect to transportation, as well as massive increase in telecommuting as a result of COVID-19 and cultural changes could shift the projections modeled herein. Monitoring should take place at key milestones of development to ensure trip reduction strategies are working and determine if recalibrating or employing new strategies would be necessary.