draft budget fy 2020-2021 - cloudinary
TRANSCRIPT

FY 2020-2021 Draft BudgetPRESENTED BY: Nick Chaset
DATE: May 24, 2019

FY 2020-21 Draft Budget (Informational)Agenda:1. Budget Overview2. Overview of Revenue3. Overview of Expenses
a. Energy Operationsb. Personnelc. Legal, Policy, & Regulatory Affairsd. Marketing Servicese. General and Administrationf. Other Professional Servicesg. Local Developmenth. Interest
4. New Communities5. Overview of EBCE Net Position and Reserve Allocation6. Review of EBCE Value Proposition and Discount7. Risks and Mitigants8. Alternative Budget Scenarios
2
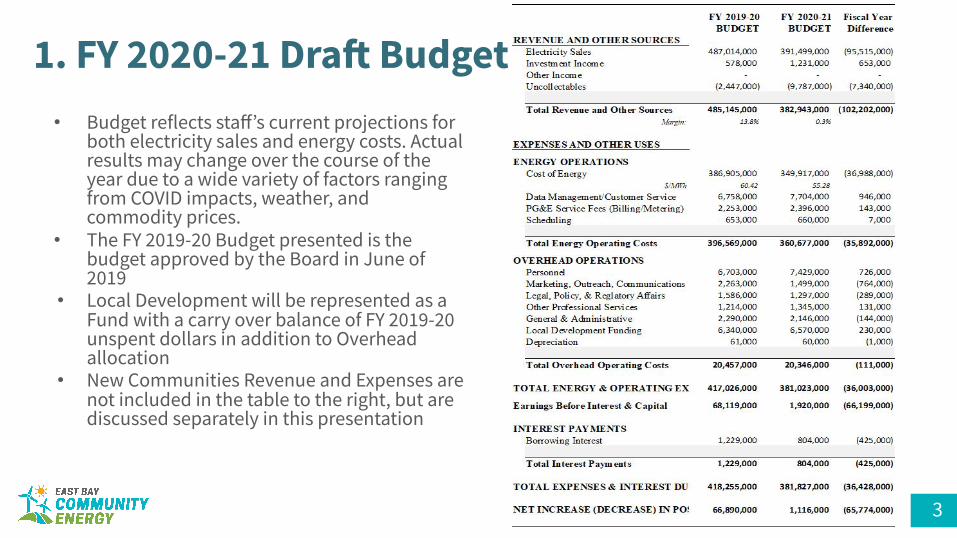
1. FY 2020-21 Draft Budget • Budget reflects staff’s current projections for
both electricity sales and energy costs. Actual results may change over the course of the year due to a wide variety of factors ranging from COVID impacts, weather, and commodity prices.
• The FY 2019-20 Budget presented is the budget approved by the Board in June of 2019
• Local Development will be represented as a Fund with a carry over balance of FY 2019-20 unspent dollars in addition to Overhead allocation
• New Communities Revenue and Expenses are not included in the table to the right, but are discussed separately in this presentation
3
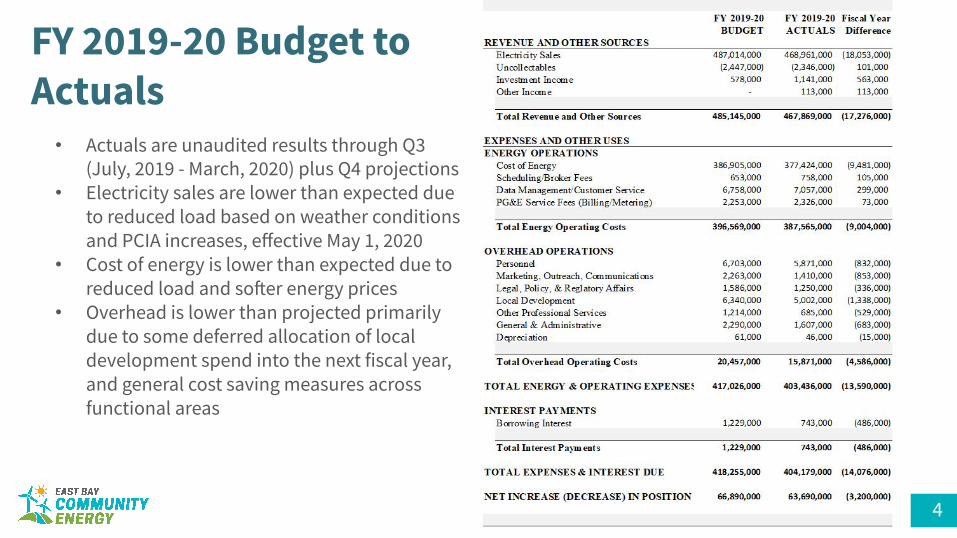
• Actuals are unaudited results through Q3 (July, 2019 - March, 2020) plus Q4 projections
• Electricity sales are lower than expected due to reduced load based on weather conditions and PCIA increases, effective May 1, 2020
• Cost of energy is lower than expected due to reduced load and softer energy prices
• Overhead is lower than projected primarily due to some deferred allocation of local development spend into the next fiscal year, and general cost saving measures across functional areas
FY 2019-20 Budget to Actuals
4

2. Overview of Revenue
Revenue Assumptions and Statistics• Reduction in revenues from Electricity Sales are due largely to increases in PCIA, effective May 1, 2020. Assumptions:
– PUBA trigger occurs in December and PCIA increases in January to maintain 7% under-collection– 2021 PCIA rate changes occur after June 30,2021—beyond the scope of this draft budget– Modest increase in general rates, effective May 1, 2020. Additional rate increase assumed to occur in Jan 2021, per GRC
• Electricity Sales also assume the following rate changes:– Bright Choice is at 1.0% discount to PG&E, and Brilliant 100 is at a 3% premium– This is estimated to increase revenue by approx. $5.7MM ($2.7MM from Bright Choice, and $3MM from Brilliant 100)
• Increase in Investment Income is due to current, higher bank account balances in interest bearing accounts (reserves and ICS) than last year but projected at slightly lower interest rate of 1.5%. Current rate is 1.79%
• Uncollectables increased from 0.5% to 2.5% (in anticipation of COVID recessionary impacts)
5

3. Overview of Expenses: Energy Operations
Energy Costs are made up of four primary energy products—block or shaped energy, renewable energy, carbon free energy, resource adequacy—and CAISO fees• Costs of Energy are estimated based on contracted energy costs and estimated open position costs• Costs are lower due to softer energy market prices• Additional reductions due to anticipated PG&E large hydro allocation and revised power content targets
Data Management, PG&E Service Fees, and Scheduling costs• Data Management/Customer Service are paid to SMUD at $1.05/meter/month through Dec of 2020. EBCE is currently reviewing
options to extend the contract with SMUD and as a result, EBCE is preparing for potentially higher Data Management/Customer Service costs depending on outcome of action on SMUD contract. EBCE has input a placeholder cost of $1.20/meter/month for the second half of the fiscal year to reflect the current uncertainty.
• PG&E Service Fees are paid to PG&E to use their billing and metering systems at $0.35/customer/month • Scheduling costs are paid to NCPA to manage EBCE’s energy purchases and market activity
6

3. Overview of Expenses: Personnel
FY 2019-2020 budget was established with 37 FTE• As of May, 2020 staff consists of 31 FTE and 2 interns
Current hiring plan for remainder of FY 2019-2020 and FY 2020-2021 is 6 FTE to remain flat to the FY 2019-2020 hiring plan• 2 Outreach Fellows for Marketing• Data Engineer for Technology • CRM implementation Manager for Local Development/Technology • Human Resources Business Partner for Operations• Power Contracts Manager for Power Procurement
Increase in FY 2020-21 budget is driven by:• Staff salaries covering the full fiscal year (FY 2019-2020 budget assumed partial year hires)• Enact a policy to allow staff to monetize PTO • 2.5% merit-based adjustments ($118,000)• 3% discretionary promotions/retention-based compensation adjustments ($169,000)
7

3. Overview of Expenses: Personnel Continued
8
● Actuals through Q3 with projections for Q4● Reduction in current fiscal year personnel costs reflect hiring deferrals/delays ● Current Q4 personnel costs are forecasted at $1,747,000, which includes the addition of 3 FTE in Q4

3. Overview of Expenses: Personnel ContinuedEBCE proposes two adjustments to the 2019/2020 salary schedule• Cost of Living Adjustment of 2.5%,
which is below the Bay Area 3-year average CPI of 3.5% (https://data.bls.gov/timeseries/CUURS49BSA0&output_view=pct_12mths)
• Merit-based salary adjustments averaging 2.5% to account for increased experience and performance within job bands
9

3. Overview of Expenses: Marketing, Outreach, and Communications
10
Examples of Marketing, Outreach, and Communications expenses● Advertising/Sponsorships/Events: Active community presence activities in local jurisdictions and
operating communities● Communications: Public relations, media, newsletters, consultants● Community Grants: Grants provided to local community organizations● Data Manager: Data/Billing management system enhancements● Noticing: New account noticing (cost shown does not include new communities)● Promotional Items: Promotional items for outreach/marketing events● Mailings: Joint Rate Mailer/Power Content Label
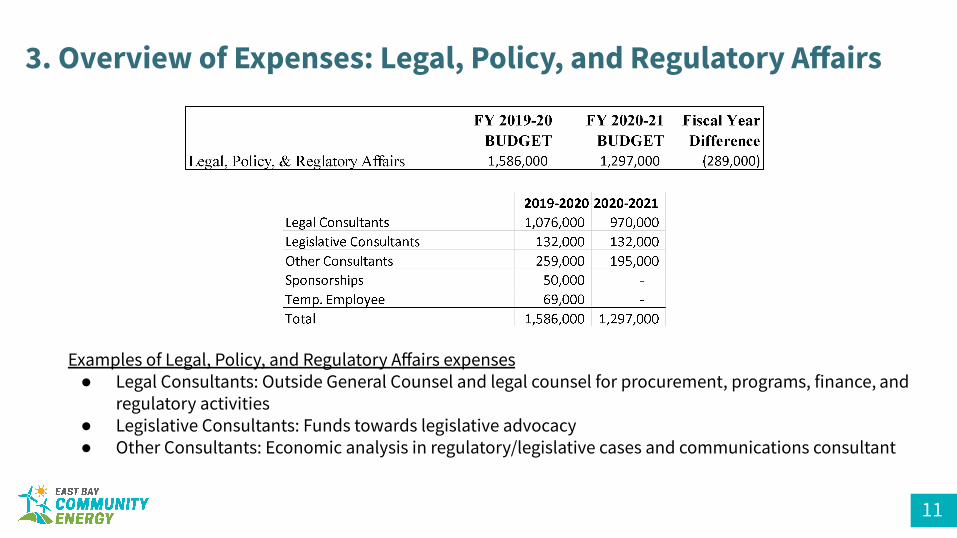
3. Overview of Expenses: Legal, Policy, and Regulatory Affairs
11
Examples of Legal, Policy, and Regulatory Affairs expenses● Legal Consultants: Outside General Counsel and legal counsel for procurement, programs, finance, and
regulatory activities● Legislative Consultants: Funds towards legislative advocacy● Other Consultants: Economic analysis in regulatory/legislative cases and communications consultant
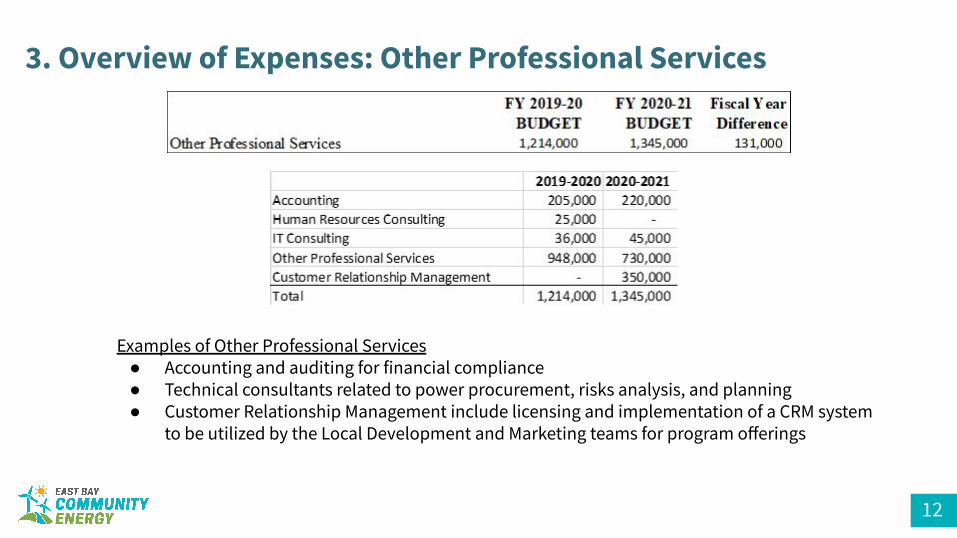
3. Overview of Expenses: Other Professional Services
12
Examples of Other Professional Services● Accounting and auditing for financial compliance● Technical consultants related to power procurement, risks analysis, and planning● Customer Relationship Management include licensing and implementation of a CRM system
to be utilized by the Local Development and Marketing teams for program offerings

3. Overview of Expenses: General & Administrative
13
Examples of General & Administrative Expenditures● Small Equipment & Software includes professional software across all functional areas as well as
equipment replacement as needed● Dues & Memberships includes $375,000 for CalCCA and other essential cooperative organizations● Operational Expenses include Energy Prepay fees, benefits-related administrative fees, office supplies,
and miscellaneous expenses● Rent & Utilities covers all planned costs for office space● Conferences & Professional Development includes travel and lodging
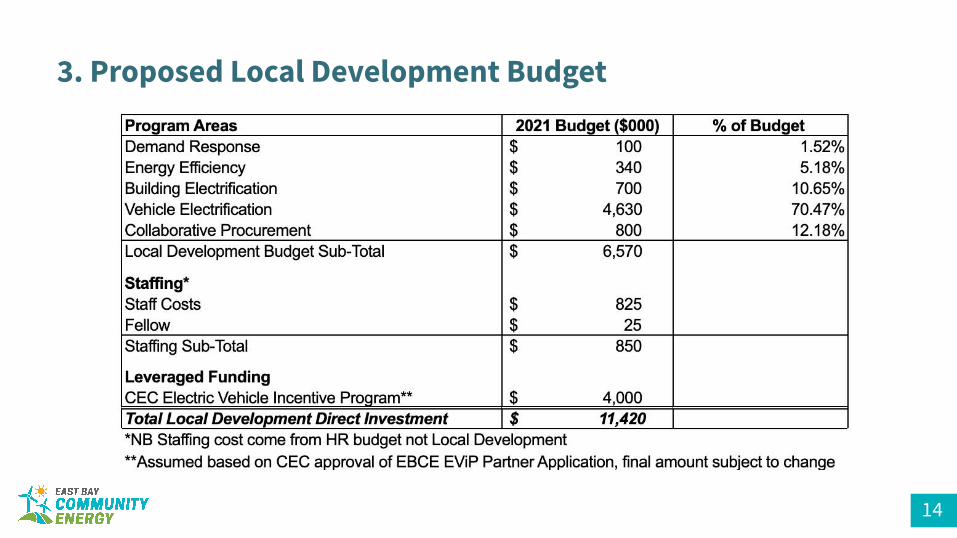
3. Proposed Local Development Budget
14

3. LDBP Program Budgeting Process
• Process– LDBP Document continues to be the blueprint for program planning and
budgeting– Staff will continue to update the CAC and Board on an ongoing basis as
programs are planned and implemented• Budgets Overview
– FY’21 Budget remains flat to FY’20– Programs are focused on job creation and local investment– Team has successfully pursued external funding from Federal and State sources
(EPA funds and CEC) to leverage EBCE funding
15
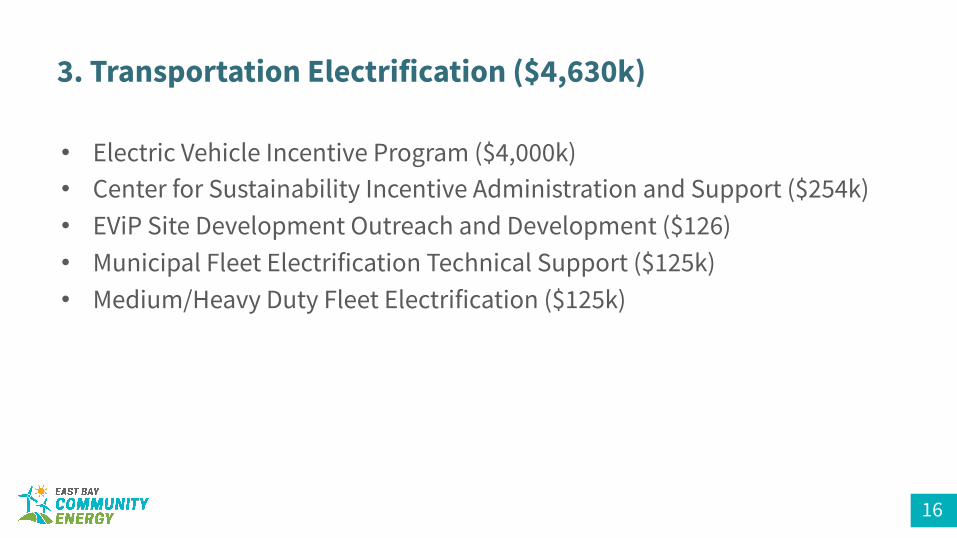
3. Transportation Electrification ($4,630k)
• Electric Vehicle Incentive Program ($4,000k)• Center for Sustainability Incentive Administration and Support ($254k)• EViP Site Development Outreach and Development ($126)• Municipal Fleet Electrification Technical Support ($125k)• Medium/Heavy Duty Fleet Electrification ($125k)
16
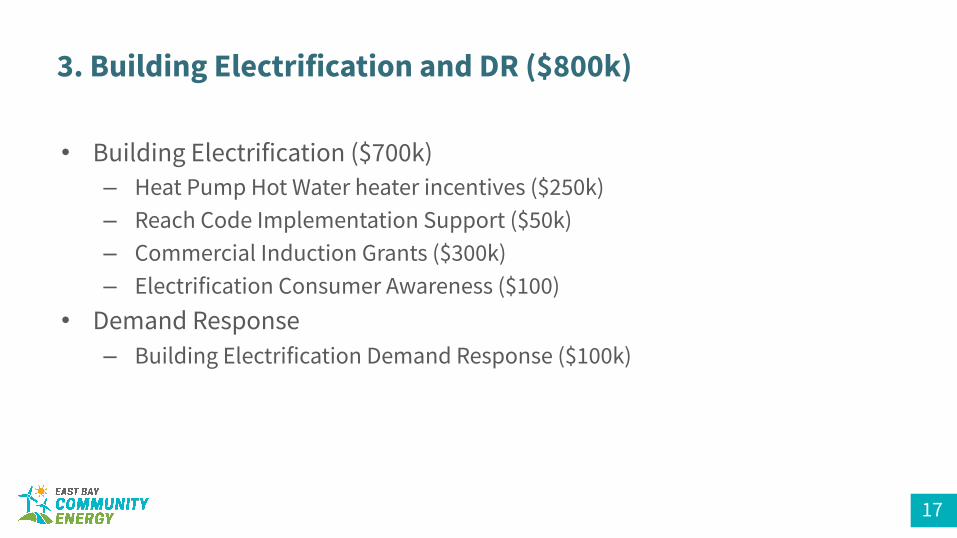
3. Building Electrification and DR ($800k)
17
• Building Electrification ($700k)– Heat Pump Hot Water heater incentives ($250k)– Reach Code Implementation Support ($50k)– Commercial Induction Grants ($300k)– Electrification Consumer Awareness ($100)
• Demand Response– Building Electrification Demand Response ($100k)

3. EE and Local Procurement ($990k)
• Collaborative Procurement ($800k)– Solar+Storage Resilience Program ($400k)– Connected Communities, reducing customer disconnections ($50k)– EBCE Asset development and ownership ($200k)– Municipal Renewable Electrification ($150k)
• Energy Efficiency ($340k)• –Continue data sharing to increase efficacy of EE program• –Phase II Pay for Performance EE Procurement ($240k)• –Technical/legal consultant to pursue public Energy Efficiency funding ($100k)•
18
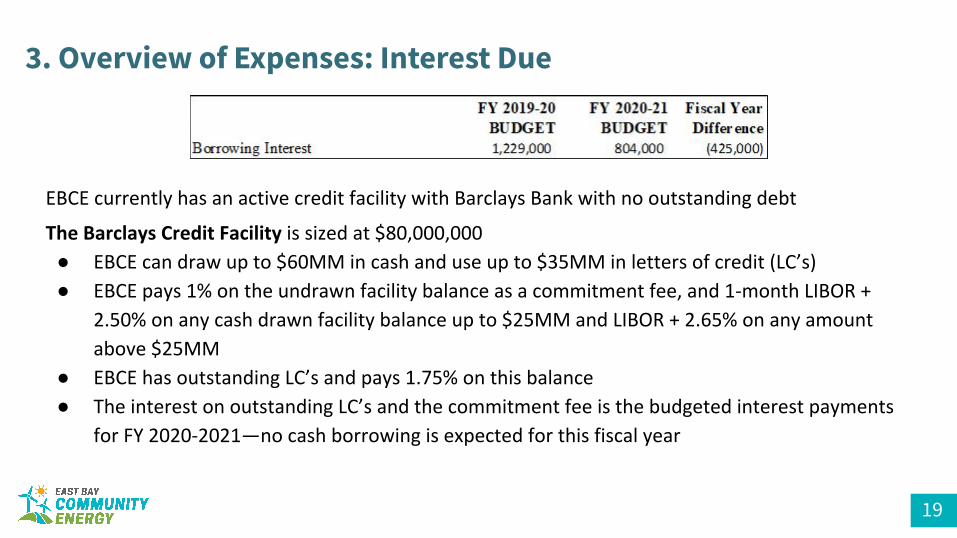
3. Overview of Expenses: Interest Due
19
●●
●●

4. New Communities: Newark, Pleasanton, and Tracy
● Inclusion of new communities is expected to have a positive lift on margins based on an April enrollment timeframe estimated at $3.5MM in net margin based on current market conditions. ○ April-June timeframe represents
higher margin months. Full calendar year net margin is lower.
● Positive margin is driven by a modest increase in operating overhead related to serving these customers and softer energy prices.
● Additional analysis is underway to determine the optimal timing based on different customer rates and procurement risks/opportunities
20
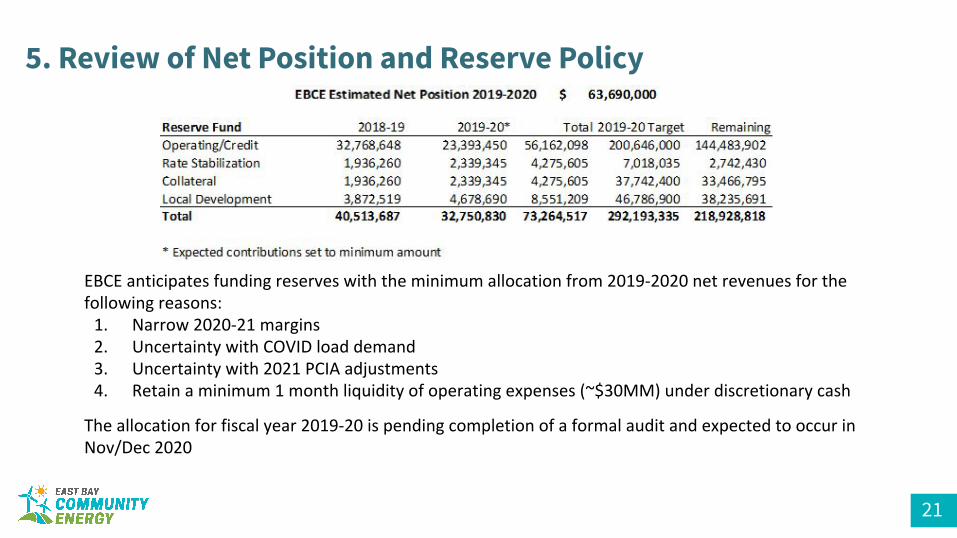
5. Review of Net Position and Reserve Policy
21
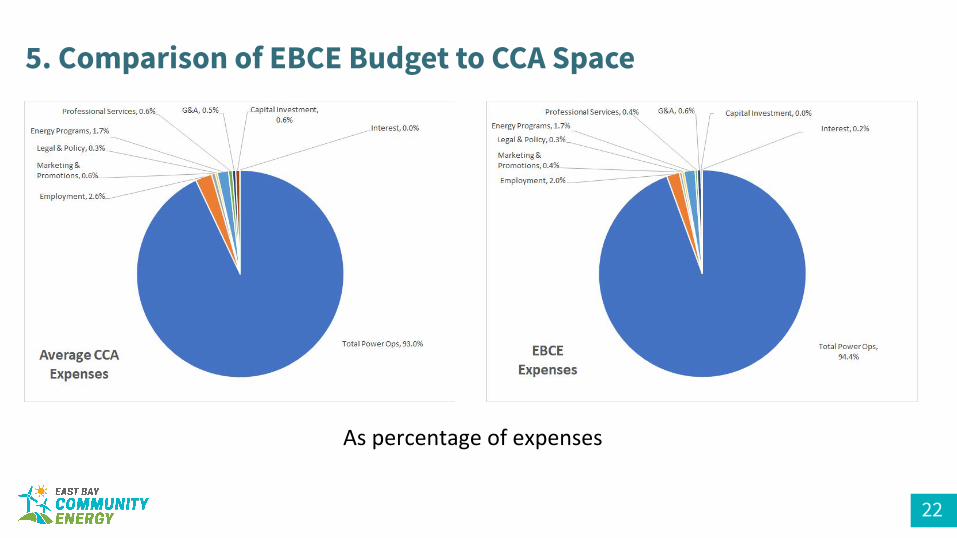
5. Comparison of EBCE Budget to CCA Space
22
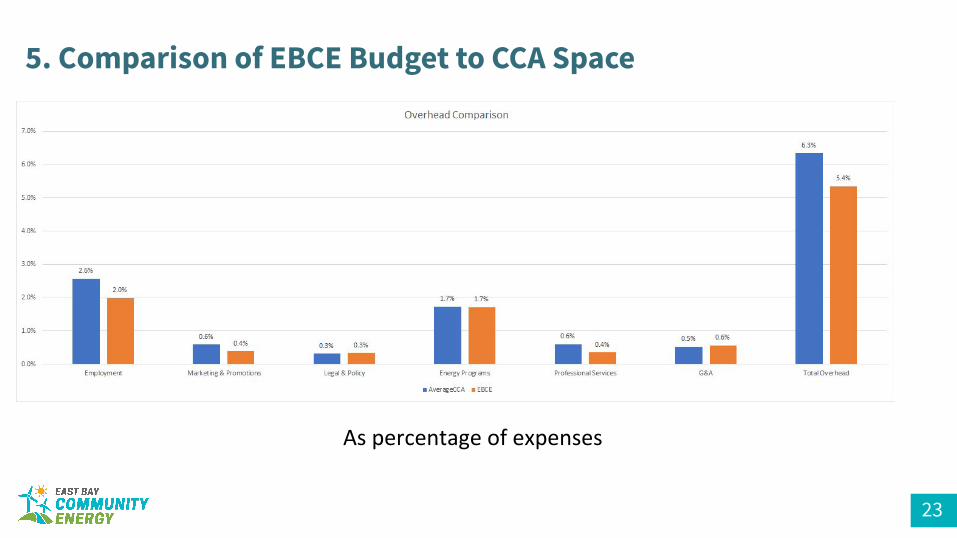
5. Comparison of EBCE Budget to CCA Space
23

5. Comparison of CCA Products & Value
24
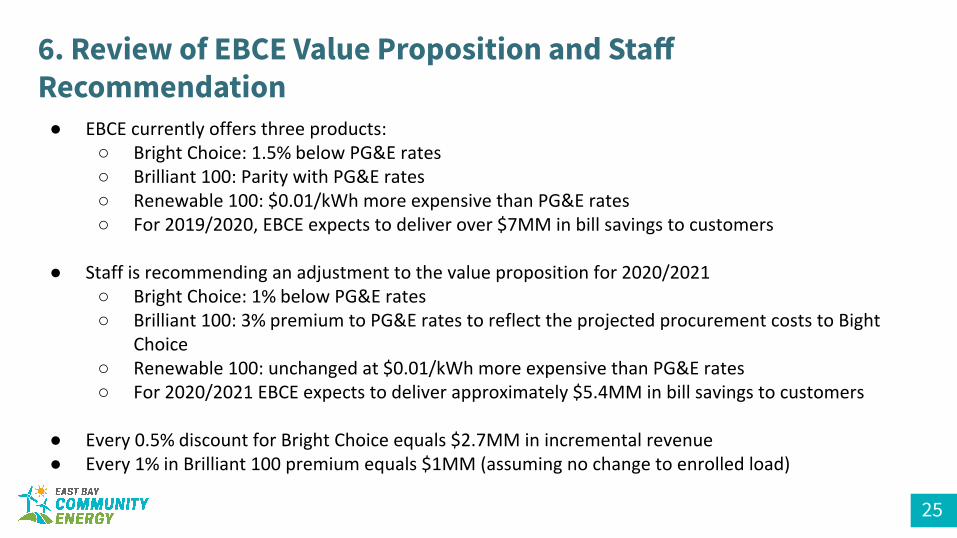
6. Review of EBCE Value Proposition and Staff Recommendation
25
●○○○○
●○○
○○
●●

7. Risks and Mitigations
26

7. Risks and Mitigants: COVID/Load
27
1. Status quo: Quick reversion to a pre-COVID load. Electricity usage based on businesses partial reopening and moderately increased residential use that results in load that closely reflects EBCE load pre-COVID. This is the basis for the current budget.
2. Moderate COVID load decrease: Volumetric load is down 6-8% in the near-term months with a peak reduction of 10-15% and there is a gradual reversion to about 1-3% volumetric load reduction and 4-6% peak reduction, which is maintained starting in 2021.
3. Moderate COVID load increase: With the partial reopening of small businesses and large commercial space, we could see commercial load revert close to normal levels and residential load remain high based on partial families working from home. This could result in a moderate increase in volumetric load of 2-4% and a peak load similar to normal levels
4. Significant and sustained macro recession where volumetric load continues to be depressed. Volumetric load is down 6-10% and peak load is down 10-15% for next 12-24 months

7. Risks and Mitigants: COVID/Load continued
28
● Changes in volumetric load due to ongoing COVID conditions are expected to decrease costs proportional with the projected net decline in demand. Thus, any decline in revenue due to decline in demand should be reasonably offset with a decline in costs. EBCE is projecting a margin of 8.5% of revenues over electricity costs. This means for each dollar decrease in revenue from reduced demand, EBCE can expect an approximate $0.915 reduction in costs. To date, EBCE has generally experienced a positive impact to load shape that has reduced the more expensive peak hours that help to mute this margin impact.
● Load changes can have material implications to EBCE as it relates to planning, procurement, and scheduling. Less certainty when it comes to load forecasting can increase risk. Generally speaking, an overall industry reduction in load directionally leads to softer energy prices. However, the uncertainty also leads to more significant day to day volatility, which can increase or decrease energy costs where EBCE is not hedged.
7. Risks and Mitigants: Energy Market Risk
29

7. Risks and Mitigants: Uncollectables
30
7. Risks and Mitigants: Opt-out Risk
31

7. Risks and Mitigants: Regulatory Risk
32
●
●
●

7. Risk and Mitigants: Mitigants
33
●○○
●
●
8. Alternative Budget Scenarios
34