dr. edward altman nyu stern school of business defaulted bond & bank loan markets and outlook...
TRANSCRIPT
Dr. Edward AltmanNYU Stern School of Business
Defaulted Bond & Bank Loan Markets and Outlook
Investing in Distressed CompaniesGFA SeminarNYU Stern School of BusinessMarch 29, 2004
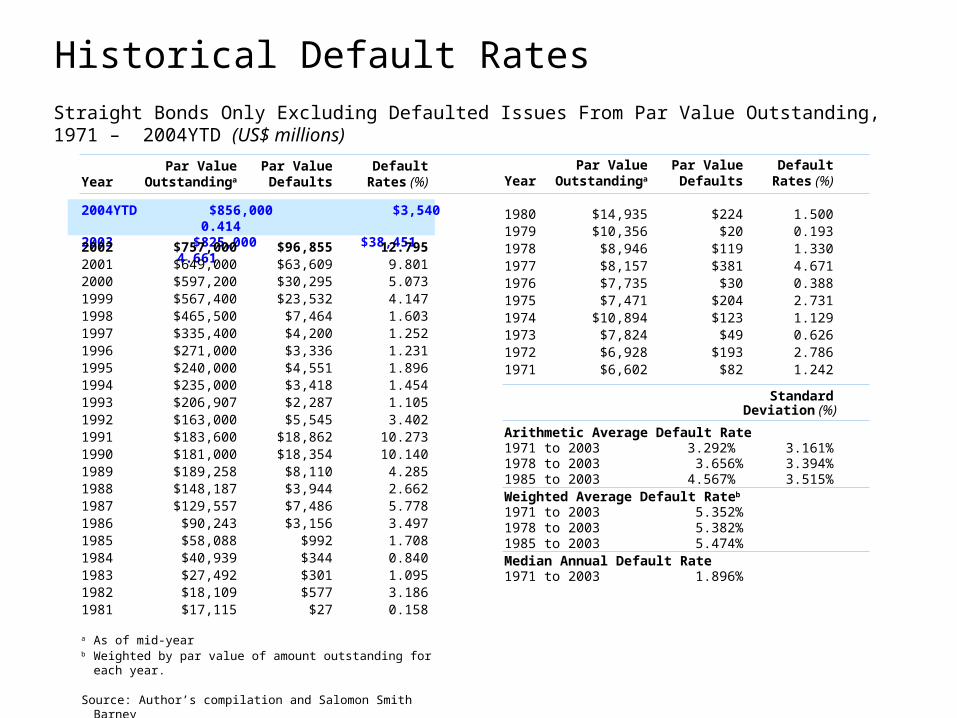
2004YTD $856,000 $3,540 0.4142003 $825,000 $38,451 4.661
Par Value Par Value DefaultYear Outstandinga Defaults Rates (%)
2002 $757,000 $96,855 12.7952001 $649,000 $63,609 9.8012000 $597,200 $30,295 5.0731999 $567,400 $23,532 4.1471998 $465,500 $7,464 1.6031997 $335,400 $4,200 1.2521996 $271,000 $3,336 1.2311995 $240,000 $4,551 1.8961994 $235,000 $3,418 1.4541993 $206,907 $2,287 1.1051992 $163,000 $5,545 3.4021991 $183,600 $18,862 10.2731990 $181,000 $18,354 10.1401989 $189,258 $8,110 4.2851988 $148,187 $3,944 2.6621987 $129,557 $7,486 5.7781986 $90,243 $3,156 3.4971985 $58,088 $992 1.7081984 $40,939 $344 0.8401983 $27,492 $301 1.0951982 $18,109 $577 3.1861981 $17,115 $27 0.158
a As of mid-yearb Weighted by par value of amount outstanding for each year.
Source: Author’s compilation and Salomon Smith Barney
Straight Bonds Only Excluding Defaulted Issues From Par Value Outstanding, 1971 – 2004YTD (US$ millions)
Historical Default Rates
Par Value Par Value DefaultYear Outstandinga Defaults Rates (%)
1980 $14,935 $224 1.5001979 $10,356 $20 0.1931978 $8,946 $119 1.3301977 $8,157 $381 4.6711976 $7,735 $30 0.3881975 $7,471 $204 2.7311974 $10,894 $123 1.1291973 $7,824 $49 0.6261972 $6,928 $193 2.7861971 $6,602 $82 1.242
Standard Deviation (%)
Arithmetic Average Default Rate1971 to 2003 3.292% 3.161%1978 to 2003 3.656% 3.394%1985 to 2003 4.567% 3.515%Weighted Average Default Rateb
1971 to 2003 5.352%1978 to 2003 5.382%1985 to 2003 5.474%Median Annual Default Rate1971 to 2003 1.896%
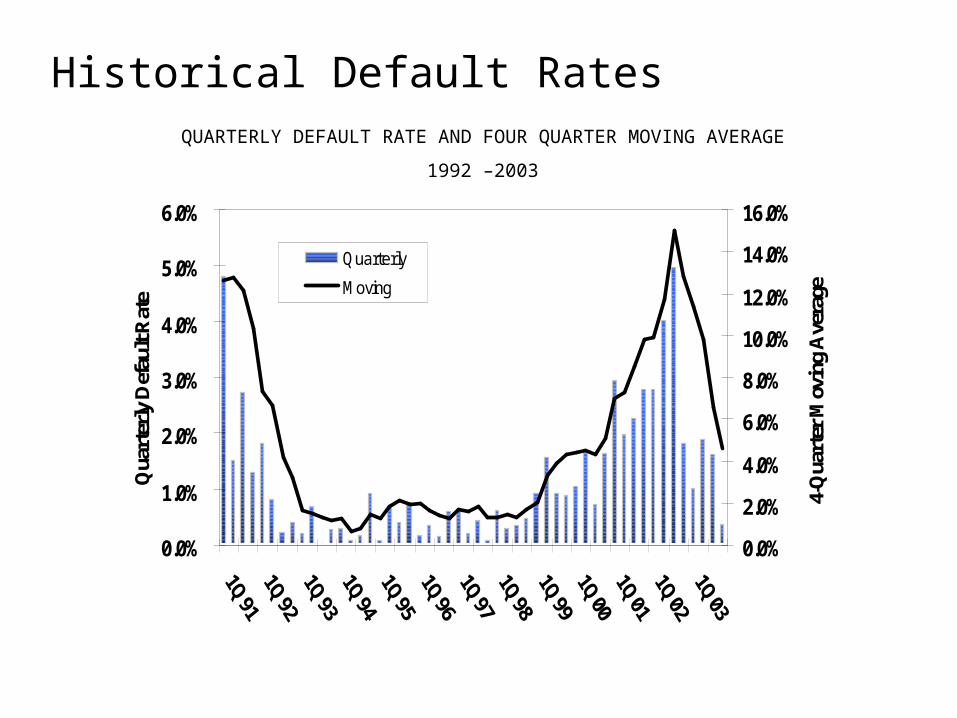
QUARTERLY DEFAULT RATE AND FOUR QUARTER MOVING AVERAGE
1992 –2003
0.0%
1.0%
2.0%
3.0%
4.0%
5.0%
6.0%
Qua
rter
ly D
efau
lt R
ate
0.0%
2.0%
4.0%
6.0%
8.0%
10.0%
12.0%
14.0%
16.0%
4-Q
uart
er M
ovin
g A
vera
ge
Quarterly
Moving
Historical Default Rates
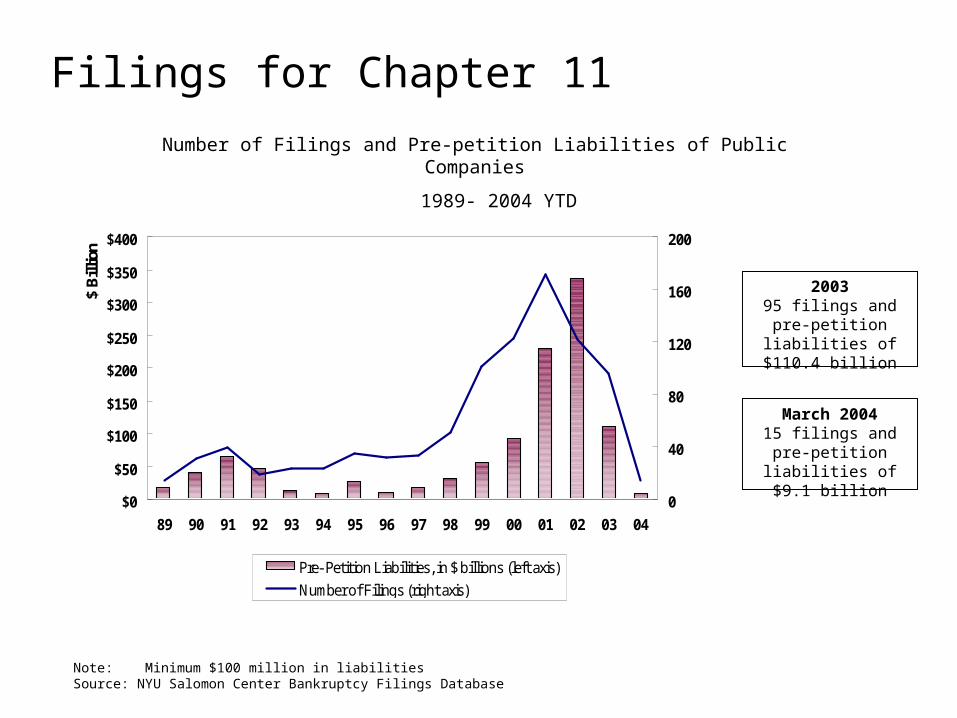
Number of Filings and Pre-petition Liabilities of Public Companies
1989- 2004 YTD
200395 filings and pre-petition liabilities of
$110.4 billion
Note: Minimum $100 million in liabilitiesSource: NYU Salomon Center Bankruptcy Filings Database
Filings for Chapter 11
$0
$50
$100
$150
$200
$250
$300
$350
$400
89 90 91 92 93 94 95 96 97 98 99 00 01 02 03 04
$ B
illio
n
0
40
80
120
160
200
Pre- Petition Liabilities, in $ billions (left axis)
Number of Filings (right axis)
March 200415 filings and pre-petition liabilities of
$9.1 billion
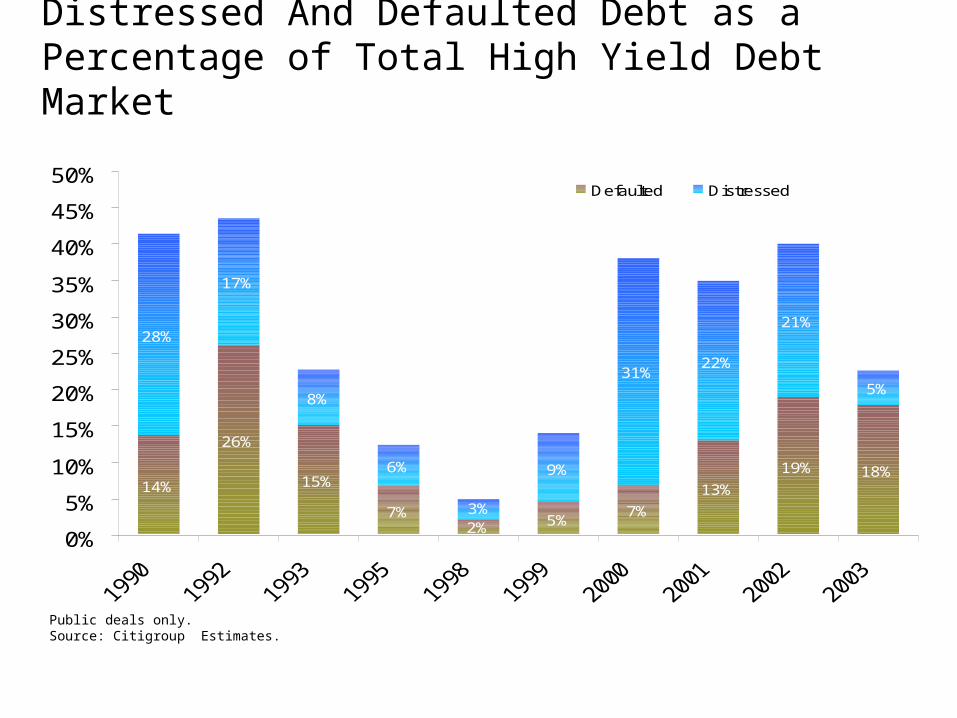
Public deals only. Source: Citigroup Estimates.
14%
26%
15%
7%5%
7%
13%
19% 18%
28%
17%
8%
6% 9%
31%22%
21%
5%
2%3%
0%
5%
10%
15%
20%
25%
30%
35%
40%
45%
50%Defaulted Distressed
Distressed And Defaulted Debt as a Percentage of Total High Yield Debt Market
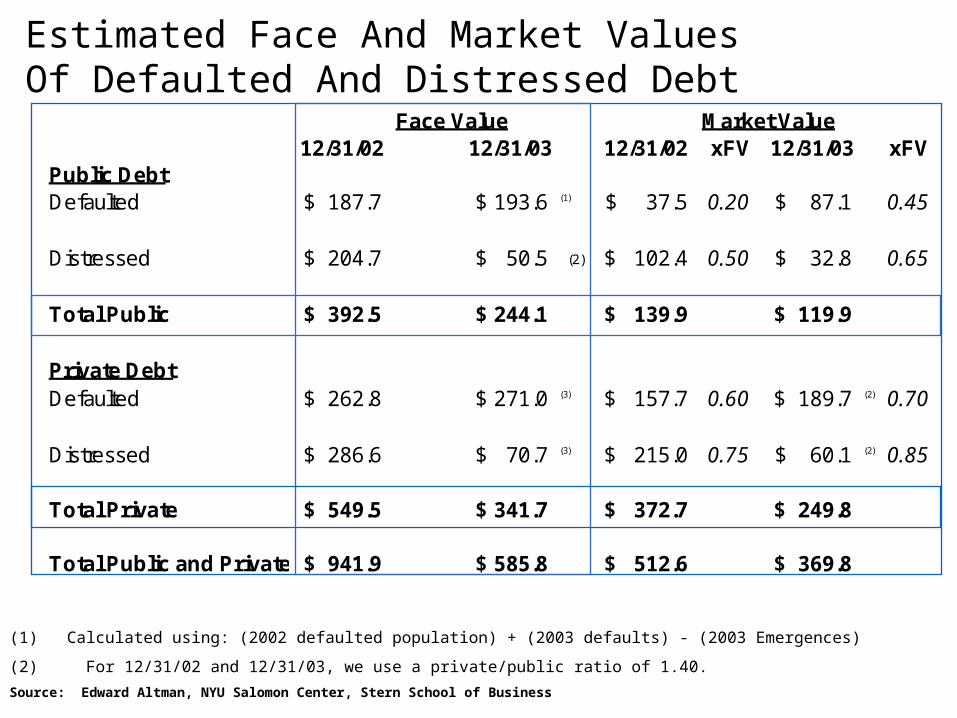
(1) Calculated using: (2002 defaulted population) + (2003 defaults) - (2003 Emergences)
(2) For 12/31/02 and 12/31/03, we use a private/public ratio of 1.40.
Source: Edward Altman, NYU Salomon Center, Stern School of Business
Face Value Market Value12/31/02 12/31/03 12/31/02 xFV 12/31/03 xFV
Public DebtDefaulted 187.7$ 193.6$ (1) 37.5$ 0.20 87.1$ 0.45
Distressed 204.7$ 50.5$ (2) 102.4$ 0.50 32.8$ 0.65
Total Public 392.5$ 244.1$ 139.9$ 119.9$
Private DebtDefaulted 262.8$ 271.0$ (3) 157.7$ 0.60 189.7$ (2) 0.70
Distressed 286.6$ 70.7$ (3) 215.0$ 0.75 60.1$ (2) 0.85
Total Private 549.5$ 341.7$ 372.7$ 249.8$
Total Public and Private 941.9$ 585.8$ 512.6$ 369.8$
Estimated Face And Market ValuesOf Defaulted And Distressed Debt
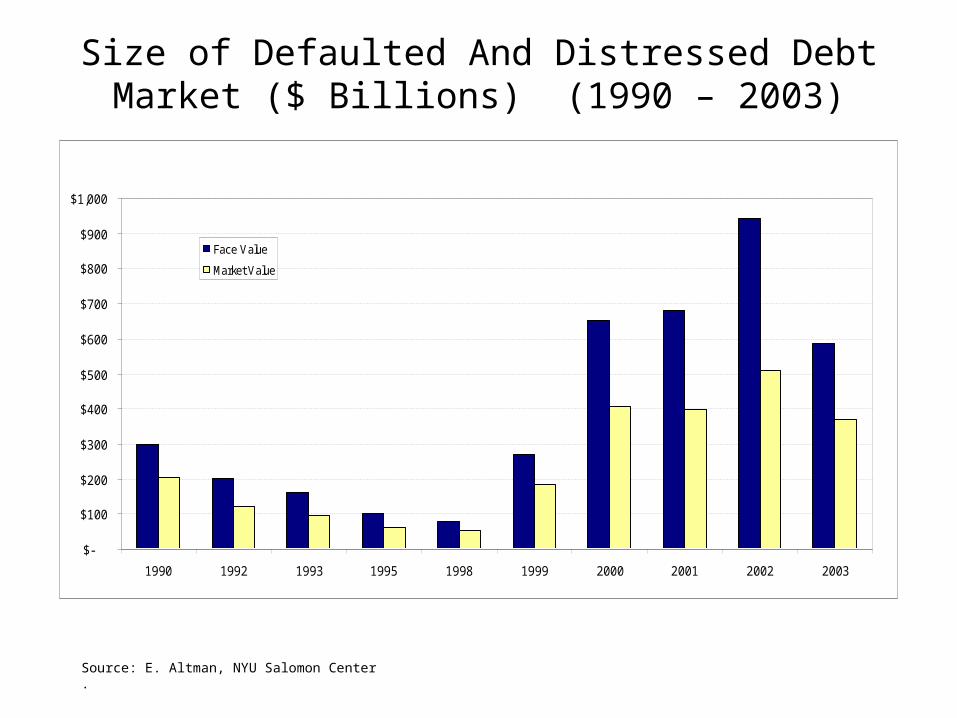
Source: E. Altman, NYU Salomon Center .
9/15/2002
$-
$100
$200
$300
$400
$500
$600
$700
$800
$900
$1,000
1990 1992 1993 1995 1998 1999 2000 2001 2002 2003
Face Value
Market Value
Size of Defaulted And Distressed Debt Market ($ Billions) (1990 – 2003)
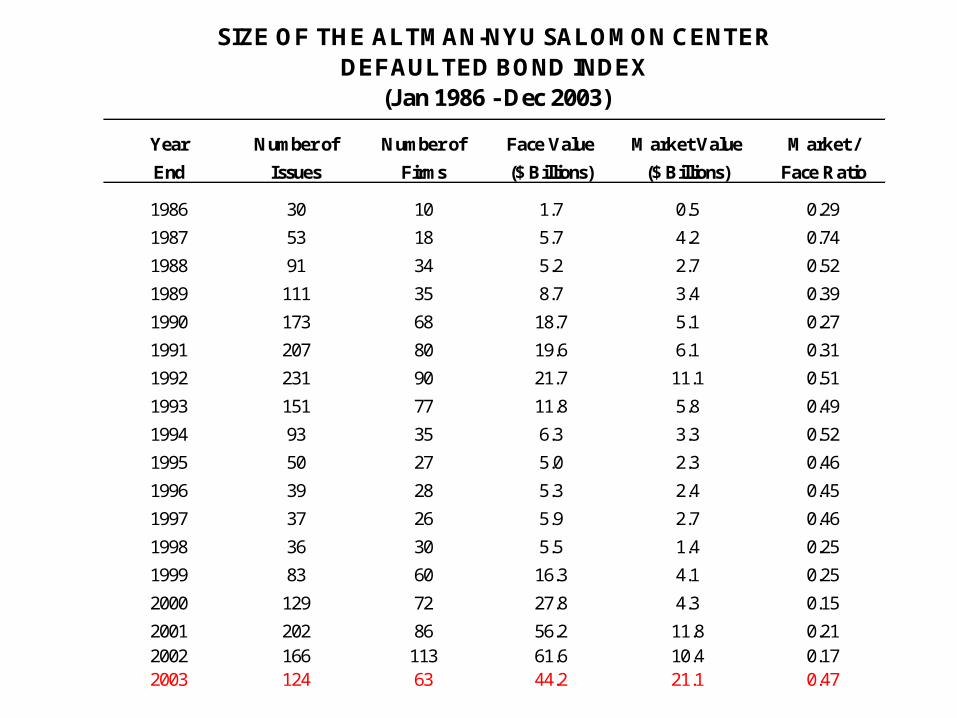
SIZE OF THE ALTMAN-NYU SALOMON CENTERDEFAULTED BOND INDEX
(Jan 1986 - Dec 2003)
Year Number of Number of Face Value Market Value Market /
End Issues Firms ($ Billions) ($ Billions) Face Ratio
1986 30 10 1.7 0.5 0.29
1987 53 18 5.7 4.2 0.74
1988 91 34 5.2 2.7 0.52
1989 111 35 8.7 3.4 0.39
1990 173 68 18.7 5.1 0.27
1991 207 80 19.6 6.1 0.31
1992 231 90 21.7 11.1 0.51
1993 151 77 11.8 5.8 0.49
1994 93 35 6.3 3.3 0.52
1995 50 27 5.0 2.3 0.46
1996 39 28 5.3 2.4 0.45
1997 37 26 5.9 2.7 0.46
1998 36 30 5.5 1.4 0.25
1999 83 60 16.3 4.1 0.25
2000 129 72 27.8 4.3 0.15
2001 202 86 56.2 11.8 0.212002 166 113 61.6 10.4 0.172003 124 63 44.2 21.1 0.47
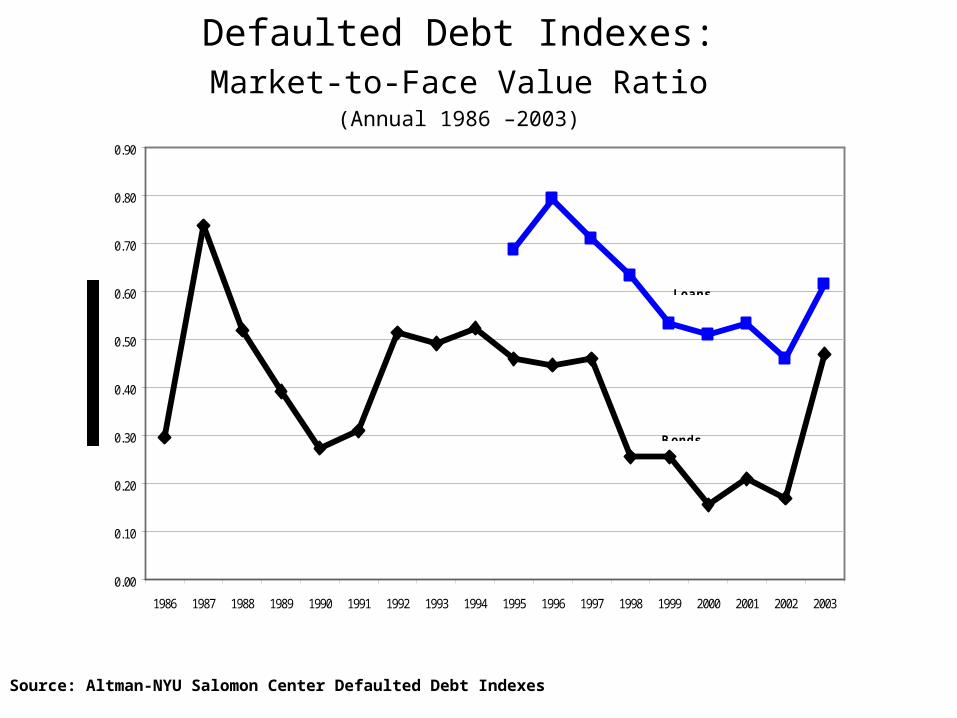
Defaulted Debt Indexes:Market-to-Face Value Ratio
(Annual 1986 –2003)
Source: Altman-NYU Salomon Center Defaulted Debt Indexes
0.00
0.10
0.20
0.30
0.40
0.50
0.60
0.70
0.80
0.90
1986 1987 1988 1989 1990 1991 1992 1993 1994 1995 1996 1997 1998 1999 2000 2001 2002 2003
Loans
Bonds
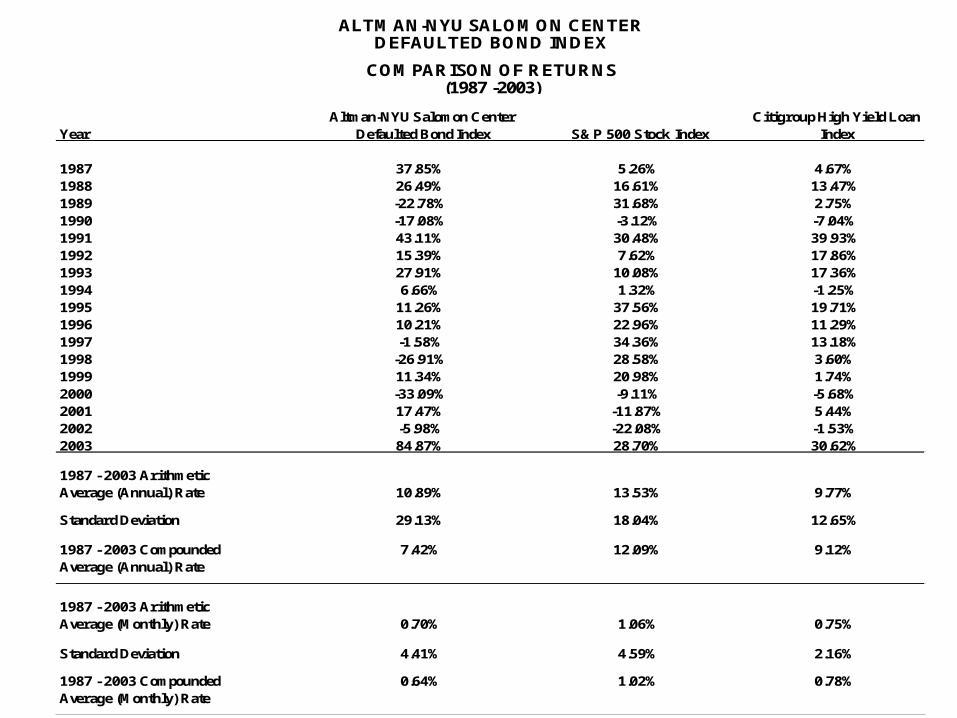
YearAltman-NYU Salomon Center
Defaulted Bond Index S&P 500 Stock IndexCitigroup High Yield Loan
Index
1987 37.85% 5.26% 4.67%1988 26.49% 16.61% 13.47%1989 -22.78% 31.68% 2.75%1990 -17.08% -3.12% -7.04%1991 43.11% 30.48% 39.93%1992 15.39% 7.62% 17.86%1993 27.91% 10.08% 17.36%1994 6.66% 1.32% -1.25%1995 11.26% 37.56% 19.71%1996 10.21% 22.96% 11.29%1997 -1.58% 34.36% 13.18%1998 -26.91% 28.58% 3.60%1999 11.34% 20.98% 1.74%2000 -33.09% -9.11% -5.68%2001 17.47% -11.87% 5.44%2002 -5.98% -22.08% -1.53%2003 84.87% 28.70% 30.62%
1987 - 2003 ArithmeticAverage (Annual) Rate 10.89% 13.53% 9.77%
Standard Deviation 29.13% 18.04% 12.65%
1987 - 2003 Compounded 7.42% 12.09% 9.12%Average (Annual) Rate
1987 - 2003 ArithmeticAverage (Monthly) Rate 0.70% 1.06% 0.75%
Standard Deviation 4.41% 4.59% 2.16%
1987 - 2003 Compounded 0.64% 1.02% 0.78%Average (Monthly) Rate
(1987 -2003)
ALTMAN-NYU SALOMON CENTERDEFAULTED BOND INDEX
COMPARISON OF RETURNS
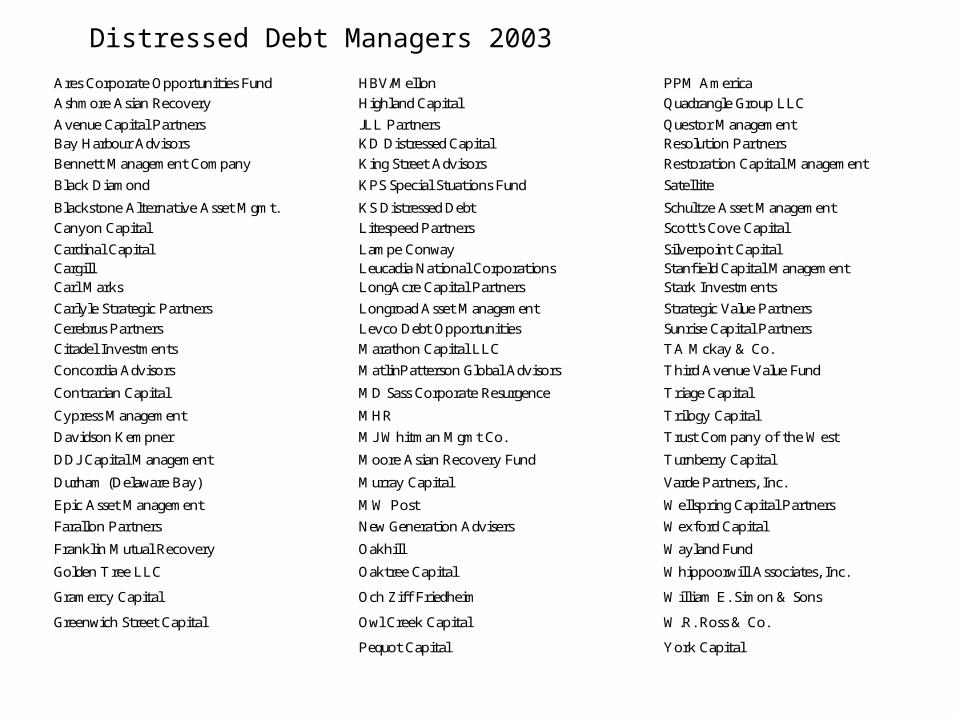
Distressed Debt Managers 2003Ares Corporate Opportunities Fund HBV/Mellon PPM America
Ashmore Asian Recovery Highland Capital Quadrangle Group LLC
Avenue Capital Partners JLL Partners Questor ManagementBay Harbour Advisors KD Distressed Capital Resolution Partners
Bennett Management Company King Street Advisors Restoration Capital Management
Black Diamond KPS Special Stuations Fund Satellite
Blackstone Alternative Asset Mgmt. KS Distressed Debt Schultze Asset Management
Canyon Capital Litespeed Partners Scott 's Cove Capital
Cardinal Capital Lampe Conway Silverpoint CapitalCargill Leucadia National Corporations Stanfield Capital ManagementCarl Marks LongAcre Capital Partners Stark Investments
Carlyle Strategic Partners Longroad Asset Management Strategic Value Partners
Cerebrus Partners Levco Debt Opportunities Sunrise Capital Partners
Citadel Investments Marathon Capital LLC TA Mckay & Co.
Concordia Advisors MatlinPatterson Global Advisors Third Avenue Value Fund
Contrarian Capital MD Sass Corporate Resurgence Triage Capital
Cypress Management MHR Trilogy Capital
Davidson Kempner MJ Whitman Mgmt Co. Trust Company of the West
DDJ Capital Management Moore Asian Recovery Fund Turnberry Capital
Durham (Delaware Bay) Murray Capital Varde Partners, Inc.
Epic Asset Management MW Post Wellspring Capital Partners
Farallon Partners New Generation Advisers Wexford Capital
Franklin Mutual Recovery Oakhill Wayland Fund
Golden Tree LLC Oaktree Capital Whippoorwill Associates, Inc.
Gramercy Capital Och Ziff Friedheim William E. Simon & Sons
Greenwich Street Capital Owl Creek Capital W.R. Ross & Co.
Pequot Capital York Capital

Investment Styles in Distressed Debt Investing
Forecasting Defaults and the Default Rate
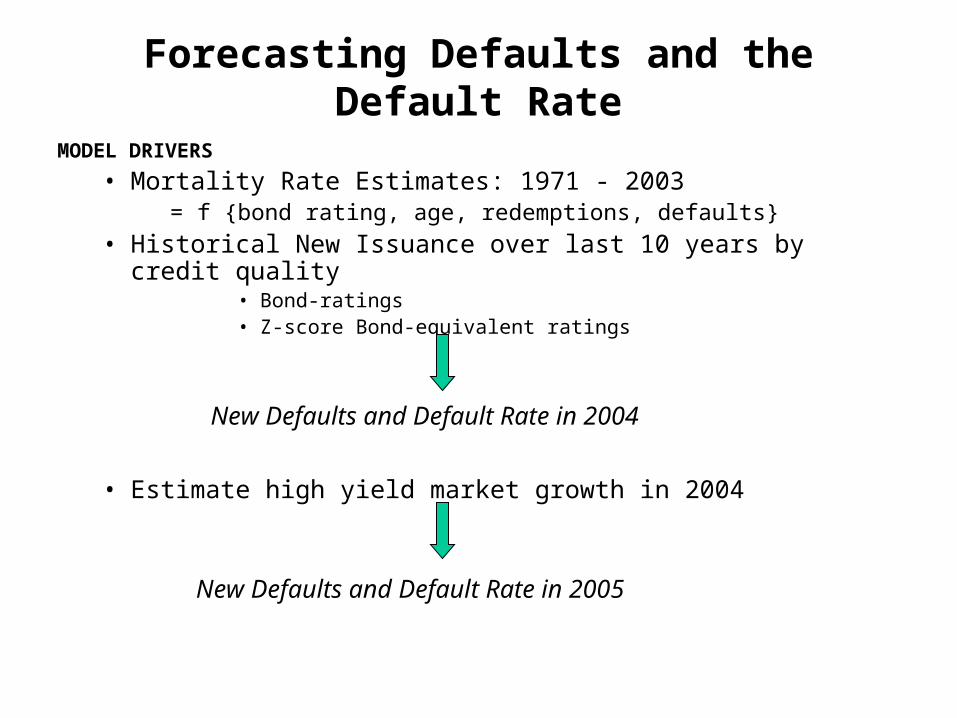
Forecasting Defaults and the Default Rate
MODEL DRIVERS
• Mortality Rate Estimates: 1971 - 2003= f {bond rating, age, redemptions, defaults}
• Historical New Issuance over last 10 years by credit quality• Bond-ratings • Z-score Bond-equivalent ratings
New Defaults and Default Rate in 2004
• Estimate high yield market growth in 2004
New Defaults and Default Rate in 2005
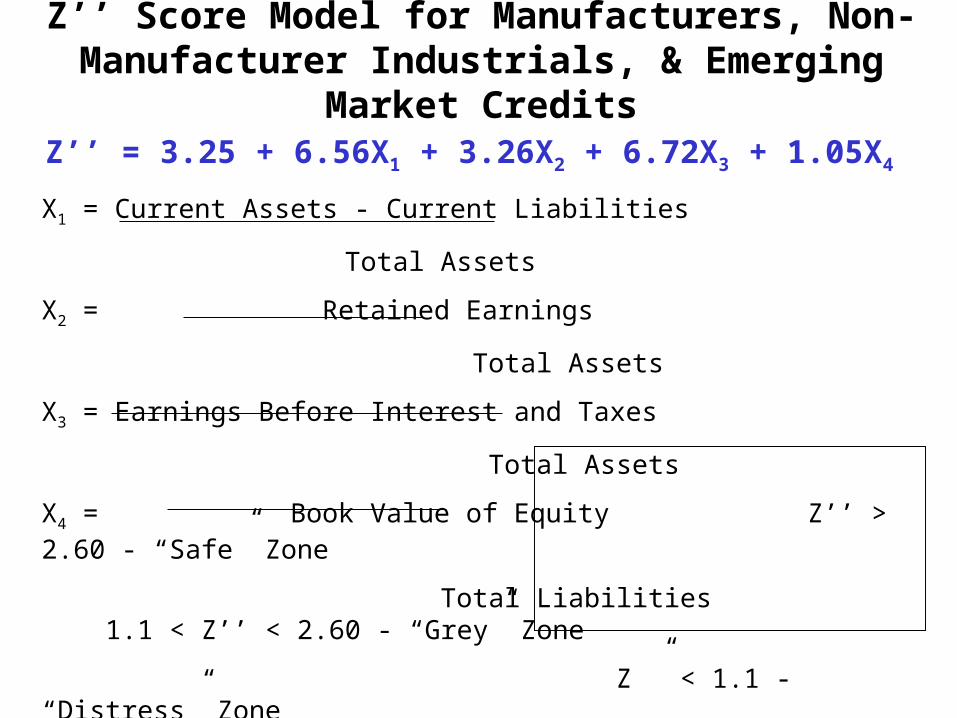
Z’’ Score Model for Manufacturers, Non-Manufacturer Industrials, & Emerging
Market CreditsZ’’ = 3.25 + 6.56X1 + 3.26X2 + 6.72X3 + 1.05X4
X1 = Current Assets - Current Liabilities
Total Assets
X2 = Retained Earnings
Total Assets
X3 = Earnings Before Interest and Taxes
Total Assets
X4 = Book Value of Equity Z’’ > 2.60 - “Safe” Zone
Total Liabilities 1.1 < Z’’ < 2.60 - “Grey” Zone
Z ” < 1.1 - “Distress” Zone
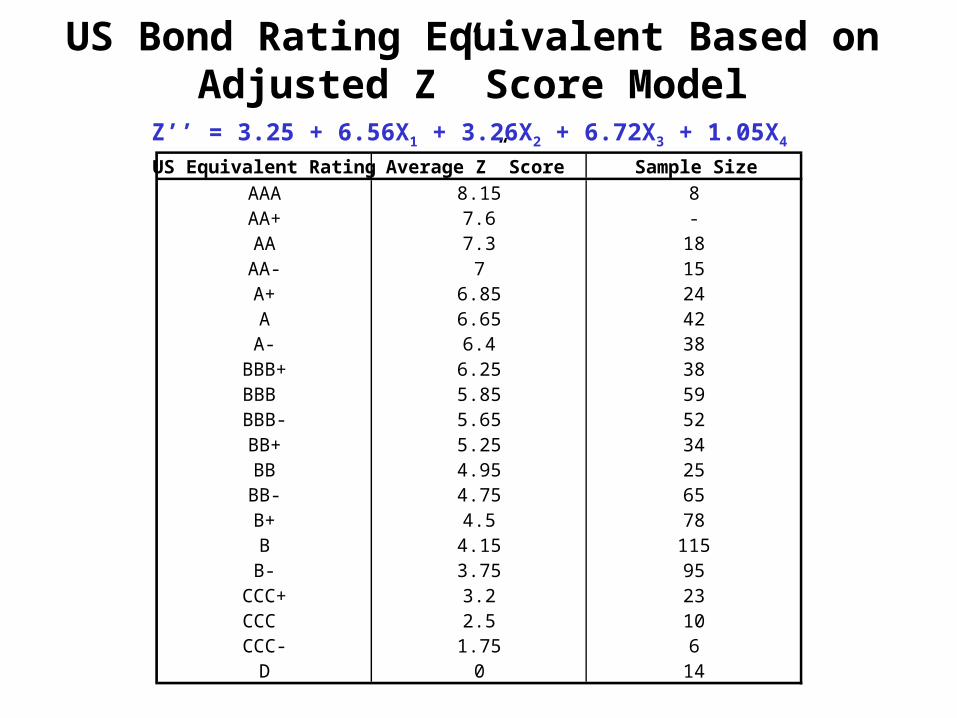
US Bond Rating Equivalent Based on Adjusted Z” Score Model
US Equivalent Rating Average Z” Score Sample Size
AAA 8.15 8AA+ 7.6 -AA 7.3 18AA- 7 15A+ 6.85 24A 6.65 42A- 6.4 38
BBB+ 6.25 38BBB 5.85 59BBB- 5.65 52BB+ 5.25 34BB 4.95 25BB- 4.75 65B+ 4.5 78B 4.15 115B- 3.75 95
CCC+ 3.2 23CCC 2.5 10CCC- 1.75 6
D 0 14
Z’’ = 3.25 + 6.56X1 + 3.26X2 + 6.72X3 + 1.05X4
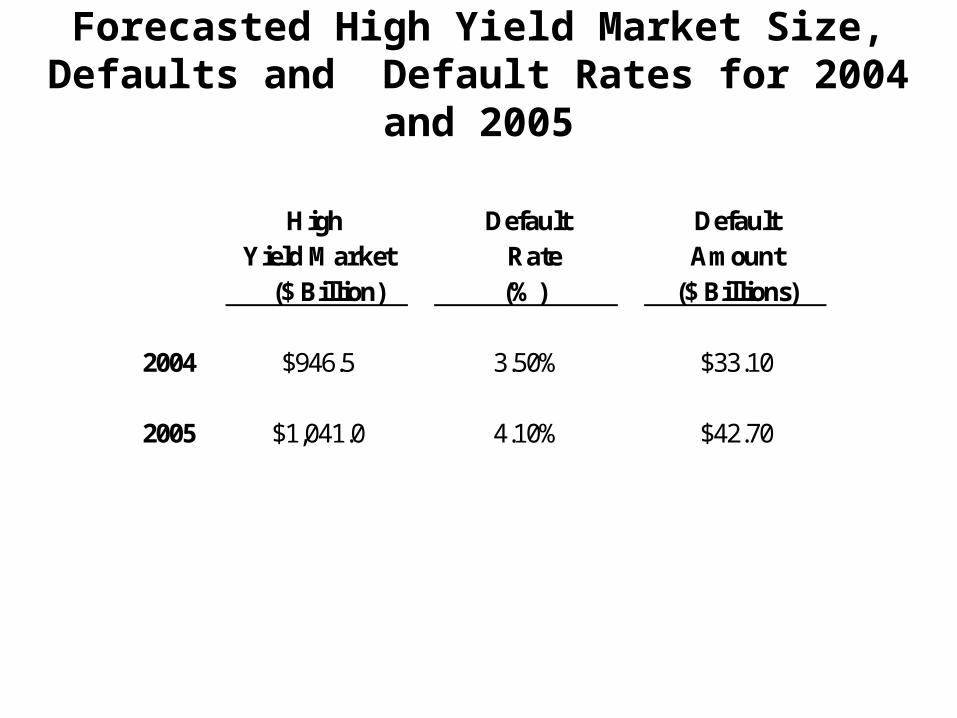
Forecasted High Yield Market Size, Defaults and Default Rates for 2004
and 2005
High Default DefaultYield Market Rate Amount
($ Billion) (%) ($ Billions)
2004 $946.5 3.50% $33.10
2005 $1,041.0 4.10% $42.70
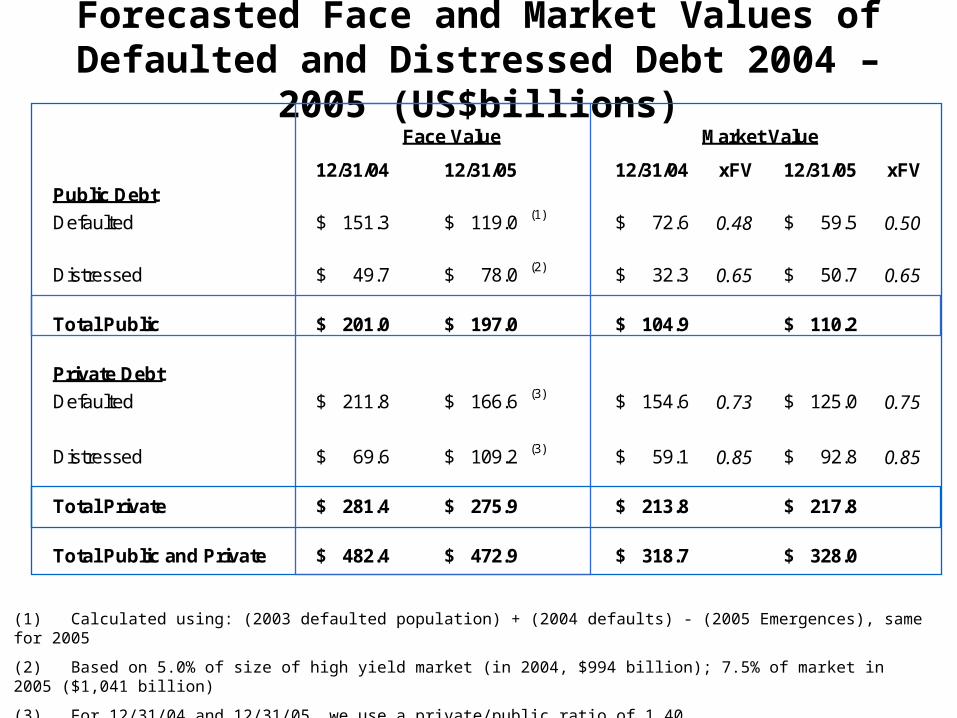
Face Value Market Value
12/31/04 12/31/05 12/31/04 xFV 12/31/05 xFVPublic Debt
Defaulted 151.3$ 119.0$ (1) 72.6$ 0.48 59.5$ 0.50
Distressed 49.7$ 78.0$ (2) 32.3$ 0.65 50.7$ 0.65
Total Public 201.0$ 197.0$ 104.9$ 110.2$
Private Debt
Defaulted 211.8$ 166.6$ (3) 154.6$ 0.73 125.0$ 0.75
Distressed 69.6$ 109.2$ (3) 59.1$ 0.85 92.8$ 0.85
Total Private 281.4$ 275.9$ 213.8$ 217.8$
Total Public and Private 482.4$ 472.9$ 318.7$ 328.0$
Forecasted Face and Market Values of Defaulted and Distressed Debt 2004 –
2005 (US$billions)
(1) Calculated using: (2003 defaulted population) + (2004 defaults) - (2005 Emergences), same for 2005
(2) Based on 5.0% of size of high yield market (in 2004, $994 billion); 7.5% of market in 2005 ($1,041 billion)
(3) For 12/31/04 and 12/31/05, we use a private/public ratio of 1.40.
Source: Edward Altman, NYU Salomon Center, Stern School of Business
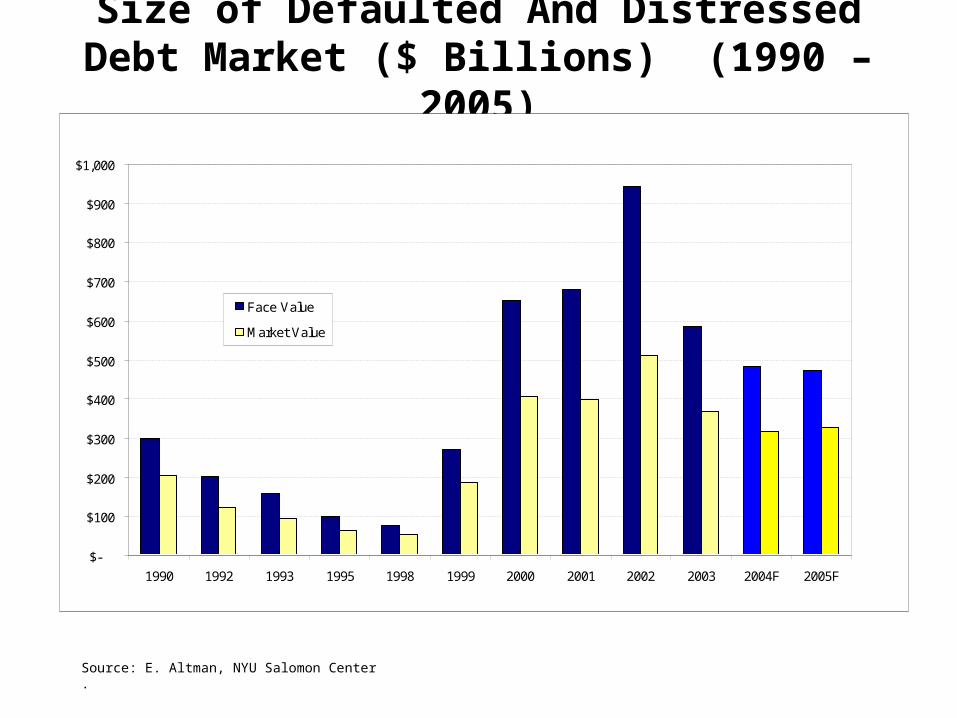
Source: E. Altman, NYU Salomon Center .
Size of Defaulted And Distressed Debt Market ($ Billions) (1990 – 2005)
$-
$100
$200
$300
$400
$500
$600
$700
$800
$900
$1,000
1990 1992 1993 1995 1998 1999 2000 2001 2002 2003 2004F 2005F
Face Value
Market Value