Download - Workshop Road Map - The Partnership
1
www.waterbalance.ca
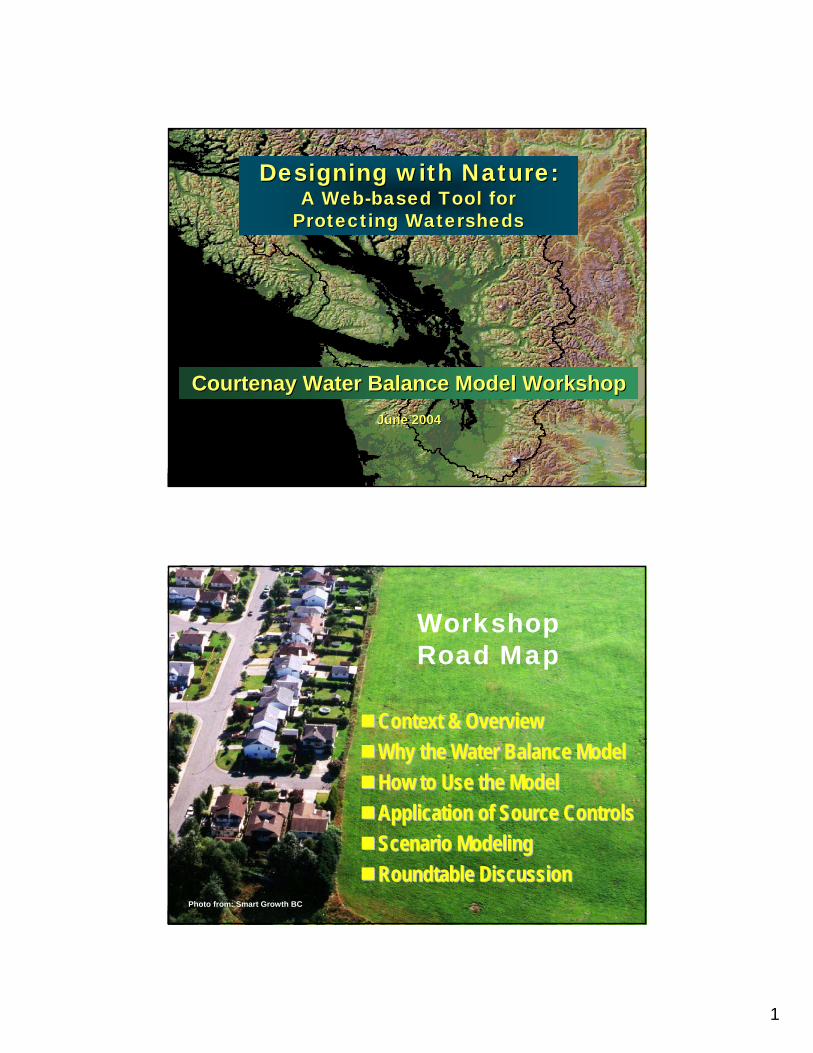
Designing with Nature:Designing with Nature:A WebA Web--based Tool for based Tool for
Protecting WatershedsProtecting Watersheds
Courtenay Water Balance Model Workshop Courtenay Water Balance Model Workshop June 2004June 2004
www.waterbalance.ca
Workshop Road Map
Context & OverviewContext & OverviewWhy the Water Balance ModelWhy the Water Balance ModelHow to Use the ModelHow to Use the ModelApplication of Source ControlsApplication of Source ControlsScenario ModelingScenario ModelingRoundtable DiscussionRoundtable Discussion
Photo from: Smart Growth BC

2
www.waterbalance.ca
Setting the Scene
www.waterbalance.ca
Implications of Climate Change:
Rainfall Volume has Increased~20% Over the Past 20 Years

3
www.waterbalance.cawww.waterbalance.ca
• Public Domain• Web-based• Interactive• Decision Support
www.waterbalance.ca
Inter-Governmental Partnership: Steering Committee and Development Team
Project TeamKSA Consultants LtdLanarc Consultants LtdCH2M HILL Canada Ltd
Focus GroupCity of ChilliwackCity of SurreyDistrict of North VancouverGreater Vancouver Regional District
Co-ChairsBC Ministry of Agriculture, Food & Fisheries
Environment Canada

4
www.waterbalance.ca
Inter-Governmental Partnership: History
Formed in 2002 as a result of a GVRD-sponsored project on the effectiveness of rainwater source control
Desire was to develop an internet-based, public-domain scenario modeling tool for rainwater management
www.waterbalance.ca
Inter-Governmental Partnership: Vision
To promote changes in land development practices so that:
The built environment will preserve and/or restore the natural water balance over timePerformance targets will be achieved for runoff volume and flow rate reduction

5
www.waterbalance.ca
Inter-Governmental Partnership: Key Partnerships
Real Estate Foundation of BC
Urban Development Institute
BC Water and Waste Association
www.waterbalance.ca
Inter-Governmental Partnership: Outreach & Continuing Education Program
Elected OfficialsLocal Government StaffDevelopment CommunityMunicipal Advisory CommitteesCommunity Stewardship GroupsProfessional Journals
6
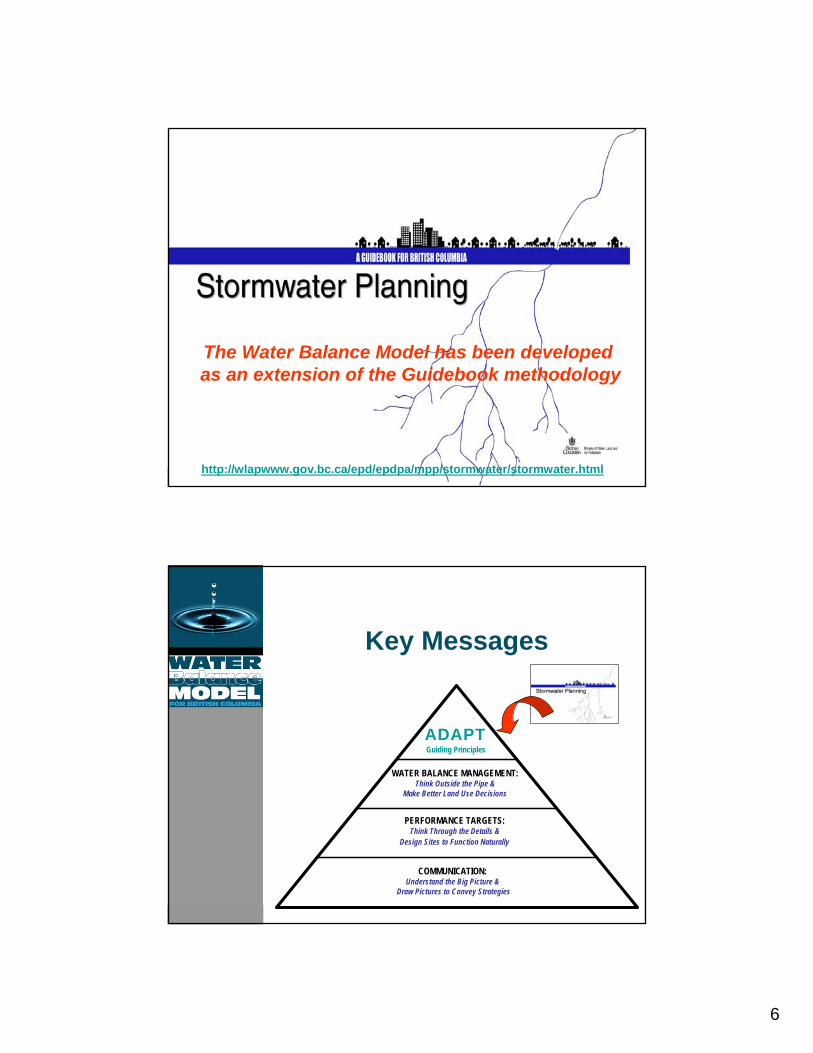
The Water Balance Model has been developed as an extension of the Guidebook methodology
http://wlapwww.gov.bc.ca/epd/epdpa/mpp/stormwater/stormwater.html
Key Messages
ADAPTGuiding Principles
PERFORMANCE TARGETS: Think Through the Details &
Design Sites to Function Naturally
COMMUNICATION: Understand the Big Picture &
Draw Pictures to Convey Strategies
WATER BALANCE MANAGEMENT:Think Outside the Pipe &
Make Better Land Use Decisions
7
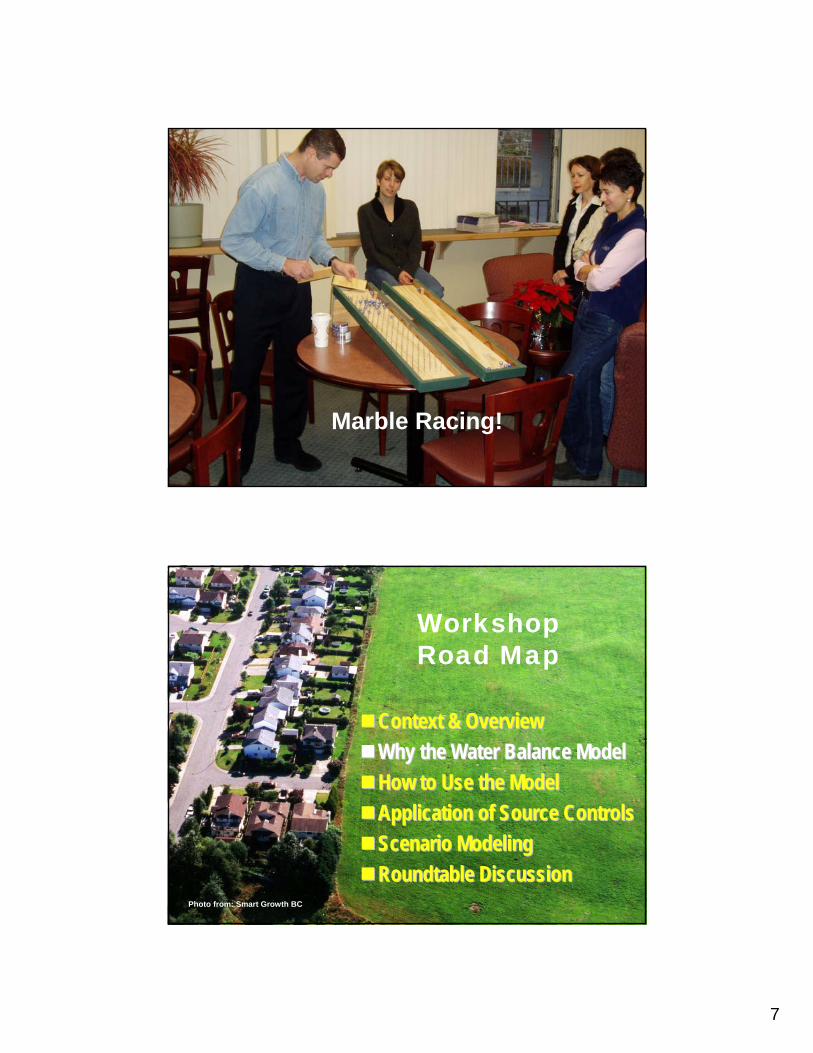
Marble Racing!
Workshop Road Map
Context & OverviewContext & OverviewWhy the Water Balance ModelWhy the Water Balance ModelHow to Use the ModelHow to Use the ModelApplication of Source ControlsApplication of Source ControlsScenario ModelingScenario ModelingRoundtable DiscussionRoundtable Discussion
Photo from: Smart Growth BC

8
Integrated Rainwater Management Planning
From TRADITIONAL toDrainage SystemsReactive (Solve Problems)Engineer-DrivenProtect PropertyPipe and ConveyUnilateral DecisionsLocal Government OwnershipExtreme Storm Focus
INTEGRATED:EcosystemsProactive (Prevent Problems)Interdisciplinary Team-DrivenProtect Property and HabitatMimic Natural ProcessesConsensus-Based DecisionsPartnerships with OthersRainwater Integrated with Land Use
What Are What Are Your Expectations For Your Expectations For
This Workshop?This Workshop?

9
Learning Outcomes: Participants will be able to….
A. WHY THE WATER BALANCE MODEL: Identify and express why we need to change the way we develop land and manage water at the site level
B. HOW TO USE THE MODEL: Use the WBM effectively to enter data and generate outputs
C. SOURCE CONTROL: Understand the capabilities of the WBM to evaluate rainwater source controls and how to achieve performance targets for volume reduction and rate control
D. SCENARIO MODELING: Apply judgment in using the WBM effectively to produce practical and achievable solutions in real-life situations
How We Will Achieve the Outcomes
• What Do You Know?• What Do You Wonder?• What Have You Learned?
Workshop is Also a Feedback Loop for
Refinements to the Model
10
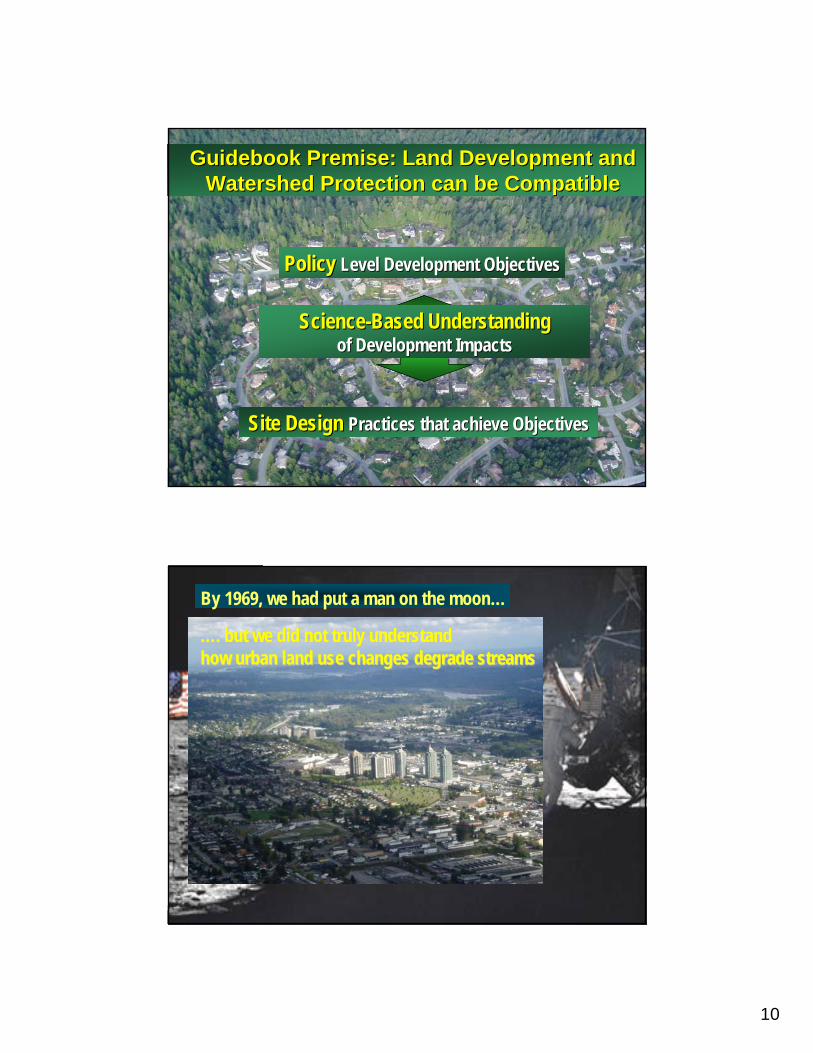
Guidebook Premise: Land Development and Guidebook Premise: Land Development and Watershed Protection can be CompatibleWatershed Protection can be Compatible
PolicyPolicy Level Development ObjectivesLevel Development Objectives
Site DesignSite Design Practices that achieve ObjectivesPractices that achieve Objectives
ScienceScience--BasedBased UnderstandingUnderstandingof Development Impactsof Development Impacts
www.waterbalance.ca
By 1969, we had put a man on the moon…
……. but we did not truly understand . but we did not truly understand how urban land use changes degrade streamshow urban land use changes degrade streams
11
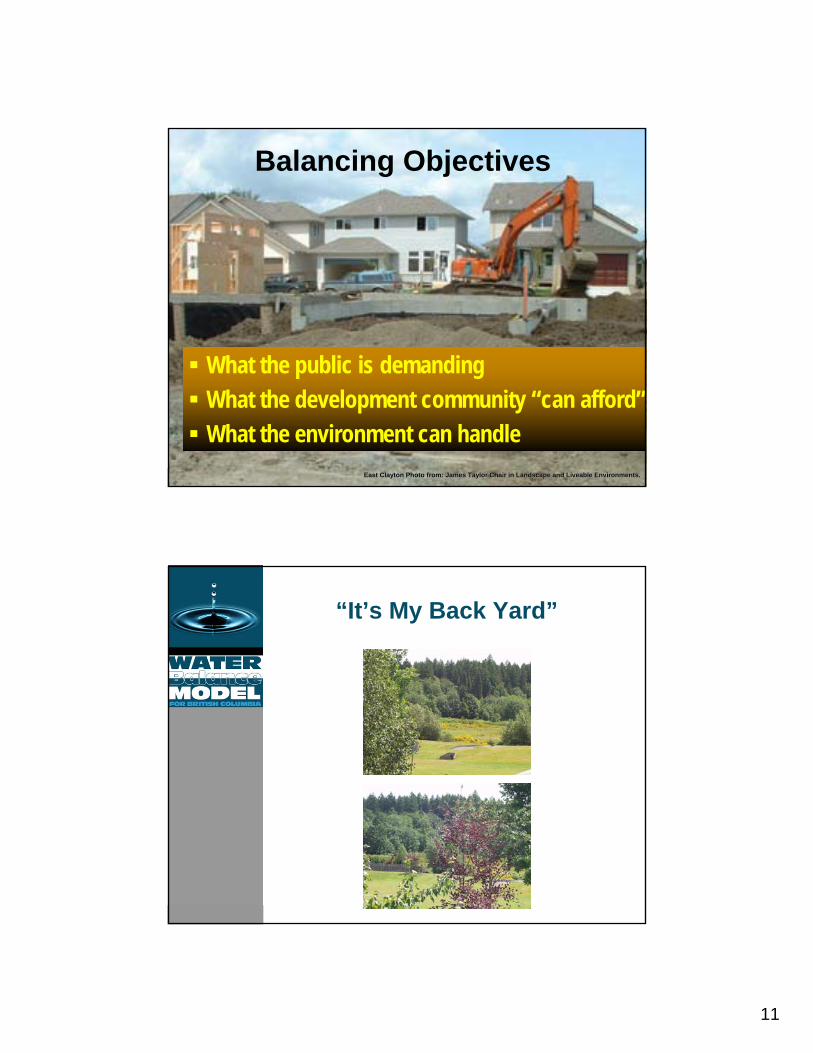
Balancing Objectives
What the public is demandingWhat the development community “can afford”What the environment can handle
East Clayton Photo from: James Taylor Chair in Landscape and LivEast Clayton Photo from: James Taylor Chair in Landscape and Liveable Environments.eable Environments.
“It’s My Back Yard”

12
BOTTOM LINE CHALLENGEUnprecedented Growth
Georgia Basin / Puget Sound Population Trends (millions)
0123456789
10
1960 1965 1970 1975 1980 1985 1990 1995 2000 2005 2010 2015 2020
Key Message: Recognize that the Built and Key Message: Recognize that the Built and Natural Environments are Connected!!Natural Environments are Connected!!
PreserveFacilitate
Avoid
Design with
Nature to…
13
www.waterbalance.ca
By 1969, we had put a man on the moon…
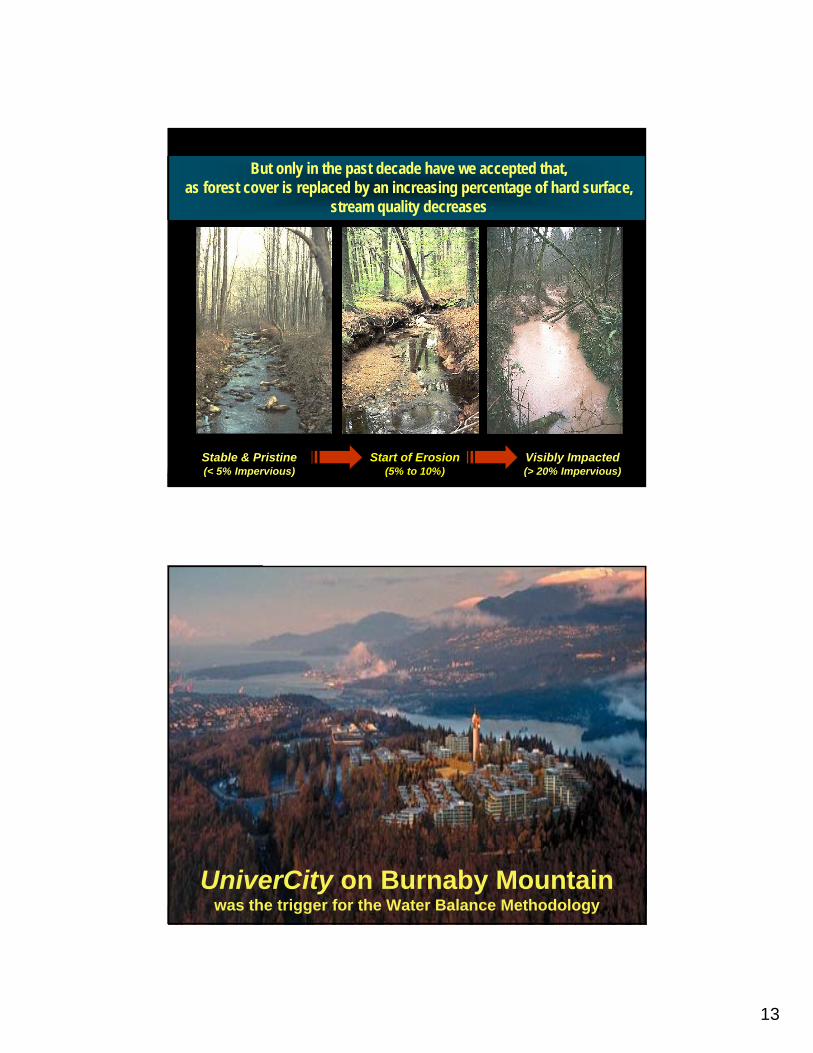
Stable & Pristine(< 5% Impervious)
Start of Erosion(5% to 10%)
Visibly Impacted(> 20% Impervious)
But only in the past decade have we accepted that,as forest cover is replaced by an increasing percentage of hard surface,
stream quality decreases
UniverCity on Burnaby Mountain was the trigger for the Water Balance Methodology
14
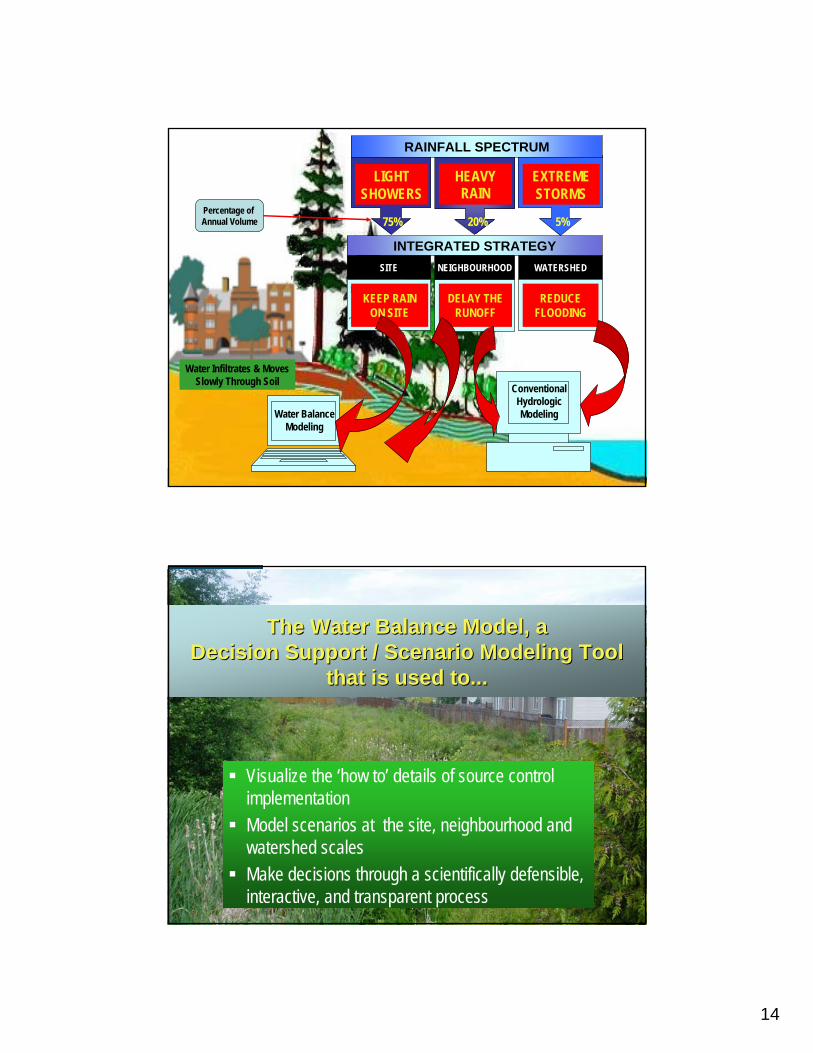
RAINFALL SPECTRUM
SITE
Infiltrate or Harvest Small Storms at the Source to Reduce
Total Runoff Volume
Provide Storage to Control the Rate of Runoff from Large Storms
WATERSHED
Ensure that the Downstream Systemcan Safely Convey
Extreme Storms
NEIGHBOURHOOD
LIGHTSHOWERS
HEAVY RAIN
EXTREME STORMS
KEEP RAIN ON SITE
DELAY THE RUNOFF
REDUCE FLOODING
ConventionalHydrologicModelingWater Balance
Modeling
INTEGRATED STRATEGY
75% 20% 5%Percentage of Annual Volume
Water Infiltrates & Moves Slowly Through Soil
The Water Balance Model, a The Water Balance Model, a Decision Support / Scenario Modeling ToolDecision Support / Scenario Modeling Tool
that is used to...that is used to...
Visualize the ‘how to’ details of source control implementationModel scenarios at the site, neighbourhood and watershed scales Make decisions through a scientifically defensible, interactive, and transparent process

15
www.waterbalance.ca
The Water Balance Model Simulates…
What Happens When Rain Falls on a SiteThe Wetting and Drying of Soil
Photo from: Wesbild
www.waterbalance.ca
Rainfall
Soil Saturation
Field Capacity
ET
Wilting Point
Runoff when soil is saturated
Infiltration rate is a function of soil moisture (limited by hydraulic conductivities)
Model tracks soil moisture fluctuation
Simple Soil Moisture Simulation (Module 3)
The hydrology engine is built around a continuous
Soil Moisture Simulation
The hydrology engine reflects the wisdom of an international Expert Panel, incorporates established soil science principles,
and provides a full accounting of the ‘water balance’
Evapotranspiration

16
Performance Target #1 - Volume
This shows what level This shows what level of volume reduction of volume reduction can be achievedcan be achieved
Having an Internet-accessible tool:
Increases opportunities to promote widespread useResults in greater need to provide training in its use
17
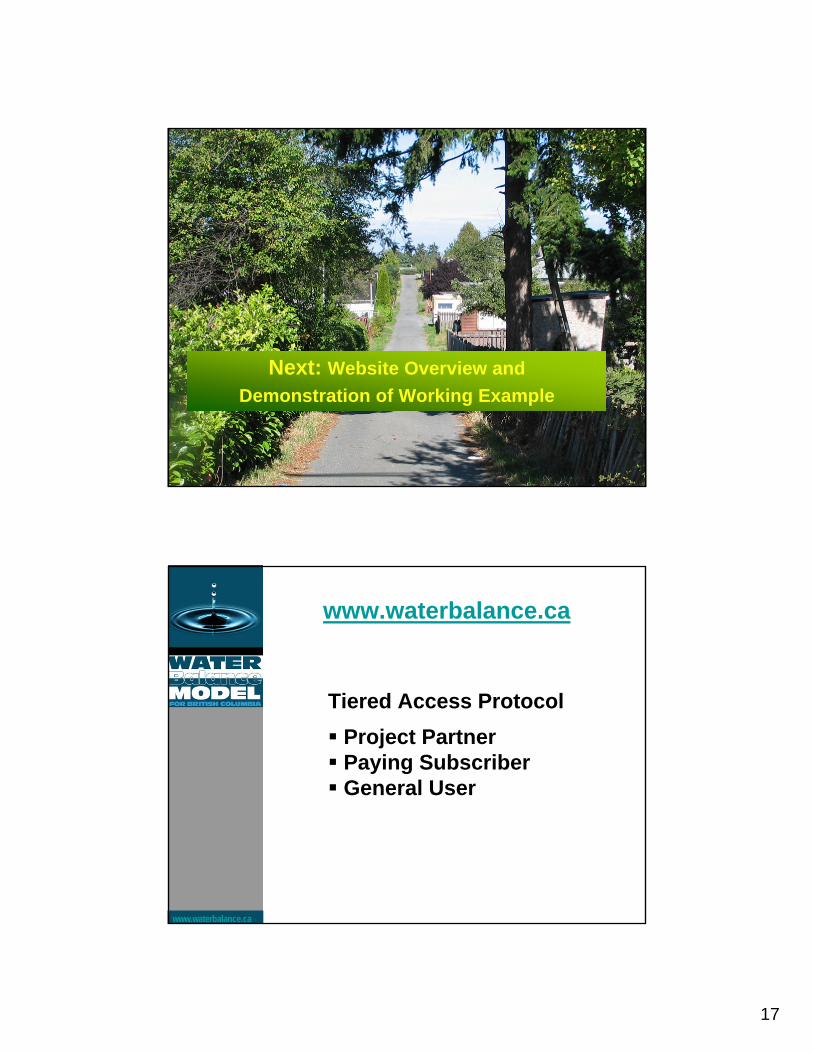
Next: Website Overview andDemonstration of Working Example
www.waterbalance.ca
Tiered Access ProtocolProject PartnerPaying SubscriberGeneral User
www.waterbalance.ca

18
www.waterbalance.ca
How the Water Balance Model will be used to make better decisions:
Local Governments -when communicating with the publicPlanners and Engineers –when setting performance targetsDevelopers and their Consultants -when testing scenarios Environmental Agencies -when monitoring watershed health
Rainfall capture required on-lot in new subdivision because of downstream agricultural
concern over impact of increased volume
City of Courtenay Experience

19
Having a Performance Target Having a Performance Target provides the starting point for provides the starting point for
Integrated SolutionsIntegrated Solutions
www.waterbalance.ca
1999 2010 2020 2030 2040 2050
0
10%
20%
30%
40%
50%
60%
70%
80%
Ann
ual R
ainf
all a
s R
unof
f (%
)
Year
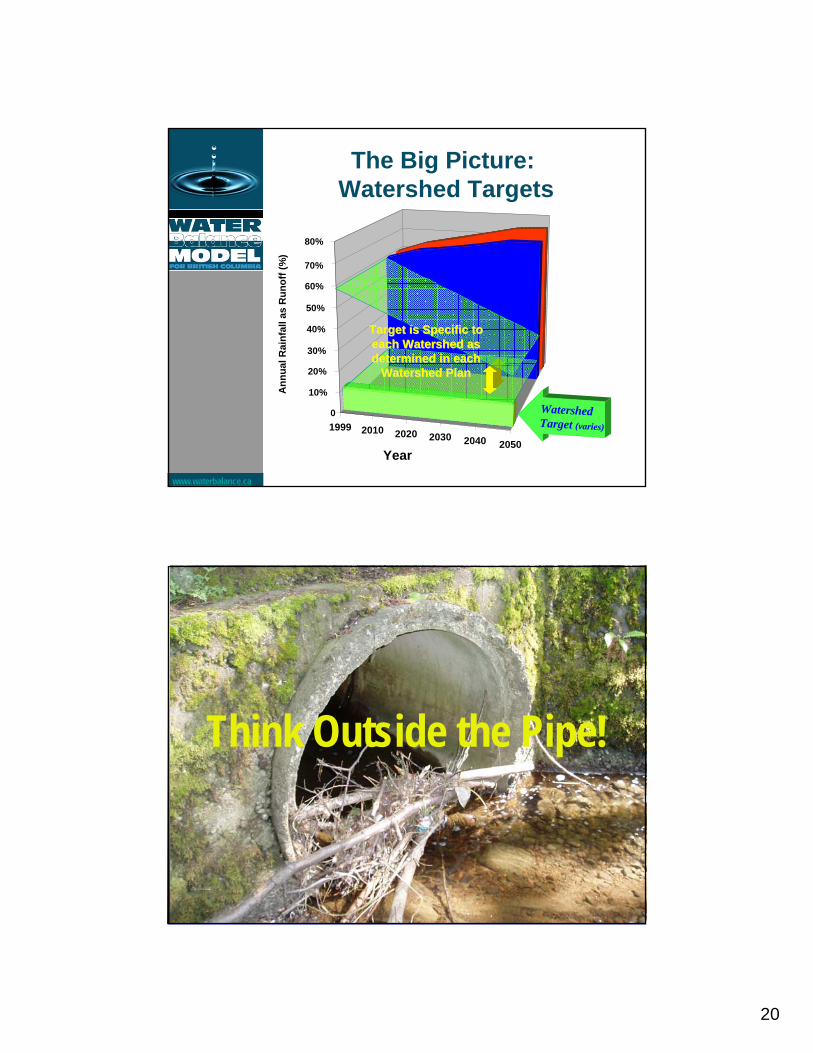
The Big Picture:Current Trends
Ideal Condition
+ Climate Change
Impacts from Growth
20
www.waterbalance.ca
1999 2010 2020 2030 2040 2050
0
Ann
ual R
ainf
all a
s R
unof
f (%
)
Year
The Big Picture:Watershed Targets
Target is Specific to Target is Specific to each Watershed as each Watershed as determined in each determined in each
Watershed PlanWatershed Plan
Watershed Target (varies)
10%
20%
30%
40%
50%
60%
70%
80%
Think Outside the Pipe!

21
Workshop Road Map
Context & OverviewContext & OverviewWhy the Water Balance ModelWhy the Water Balance ModelHow to Use the ModelHow to Use the ModelApplication of Source ControlsApplication of Source ControlsScenario ModelingScenario ModelingRoundtable DiscussionRoundtable Discussion
Photo from: Smart Growth BC
How Water Moves Through Soil

22
www.waterbalance.ca
City of Courtenay Soil Policy
Are You Comfortable Are You Comfortable Using the Internet?Using the Internet?

23
www.waterbalance.ca
Example Application to a Single Family Residential Site
www.waterbalance.ca
Key Details
Entire area is zoned RS1, each lot will have:roof leaders disconnected.roads serviced by rain gardenstopsoil depth such that runoff volume produced over a typical year is +/- 10%.
502.5 sq. m. (includes road right-of-way strip)40% rooftop16% impervious driveway44% lawn

24
www.waterbalance.ca
Existing Conditions
www.waterbalance.ca
Existing Conditions

25
www.waterbalance.ca
Scenario 1
www.waterbalance.ca
Scenario 1

26
www.waterbalance.ca
Scenario 2
www.waterbalance.ca
Scenario 2

27
www.waterbalance.ca
Scenario 2
So, Is Everyone Getting theSo, Is Everyone Getting theSame Output?Same Output?

28
74% 71%
21% 23%
4 % 6%
0
20
40
60
80
100
Pe
rce
nt
of
To
tal
An
nR
ain
fall
Less than 50% ofMAR
50% of MAR to MAR Greater than MAR
Rainfall Event Size (mm)
Typical Volume Distribution of Annual Rainfall
South Coast (Burnaby Mountain) Okanagan (Kelowna Airport)
Note: Burnaby Mountain MAR* = 70 mm Kelowna MAR* = 20 mm (*24-hour rainfall)
20%Large Storms
75%Small Storms
5%Extreme Storms
RAINFALL SPECTRUM
SITE
Infiltrate or Harvest Small Storms at the Source to Reduce
Total Runoff Volume
Provide Storage to Control the Rate of Runoff from Large Storms
WATERSHED
Ensure that the Downstream Systemcan Safely Convey
Extreme Storms
NEIGHBOURHOOD
LIGHTSHOWERS
HEAVY RAIN
EXTREME STORMS
KEEP RAIN ON SITE
DELAY THE RUNOFF
REDUCE FLOODING
INTEGRATED STRATEGY
Typical Volume Distribution of Annual RainfallBritish Columbia South Coast and Okanagan
LIGHT HEAVY EXTREME
www.waterbalance.ca
Practical Site Level Solutionsare Typically Landscape-based
29
www.waterbalance.ca
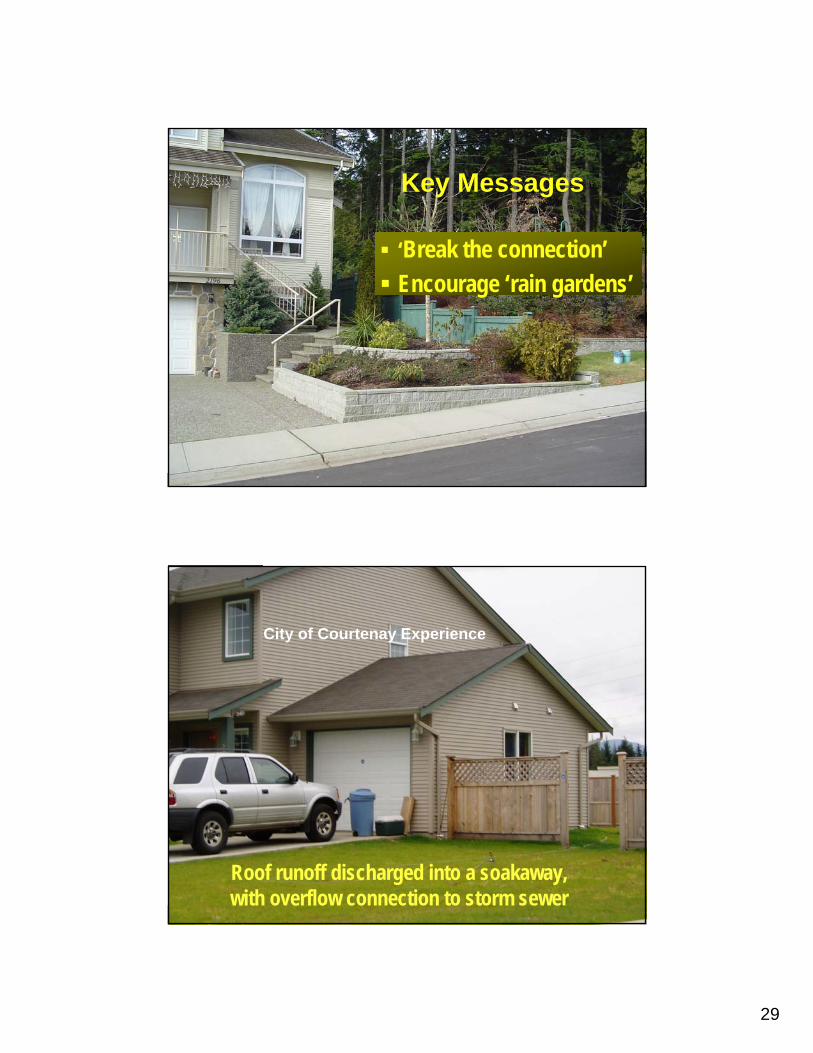
Key Messages
‘Break the connection’Encourage ‘rain gardens’
Roof runoff discharged into a soakaway, with overflow connection to storm sewer
City of Courtenay Experience

30
www.waterbalance.ca
‘Break the Connection’with a Rain Garden
Simple Infiltration + Reservoir+ Overflow
www.waterbalance.ca
‘Designing with Nature’ means…
Create a Greener CommunityAchieve a Higher Level of Stream Protection

31
www.waterbalance.ca
Workshop Road Map
Context & OverviewContext & OverviewWhy the Water Balance ModelWhy the Water Balance ModelHow to Use the ModelHow to Use the ModelApplication of Source ControlsApplication of Source ControlsScenario ModelingScenario ModelingRoundtable DiscussionRoundtable Discussion
Photo from: Smart Growth BC
WATER BALANCE MODELEXAMPLE SITE APPLICATION
HOME DEPOT PROJECT – COURTENAY, BC
Presented byIan Whitehead, P. Eng.
McElhanney Consulting Services Ltd.

32
BACKGROUND:Roughly 10 acre sitePre-development conditions:
Second growth coniferous forestGently sloping topographyThin layer of permeable surficial soilsVery little runoff during minor storm events
THE CHALLENGE:Typical big box land developer wants to develop 9.99 acres out of 10 available“Prototype” site design does not provide for preferred site source controls, such as extensive absorbent landscaping or increased soil depthsDownstream/down-gradient landowners concerned over both increased surface runoff and decreased groundwater flow
33
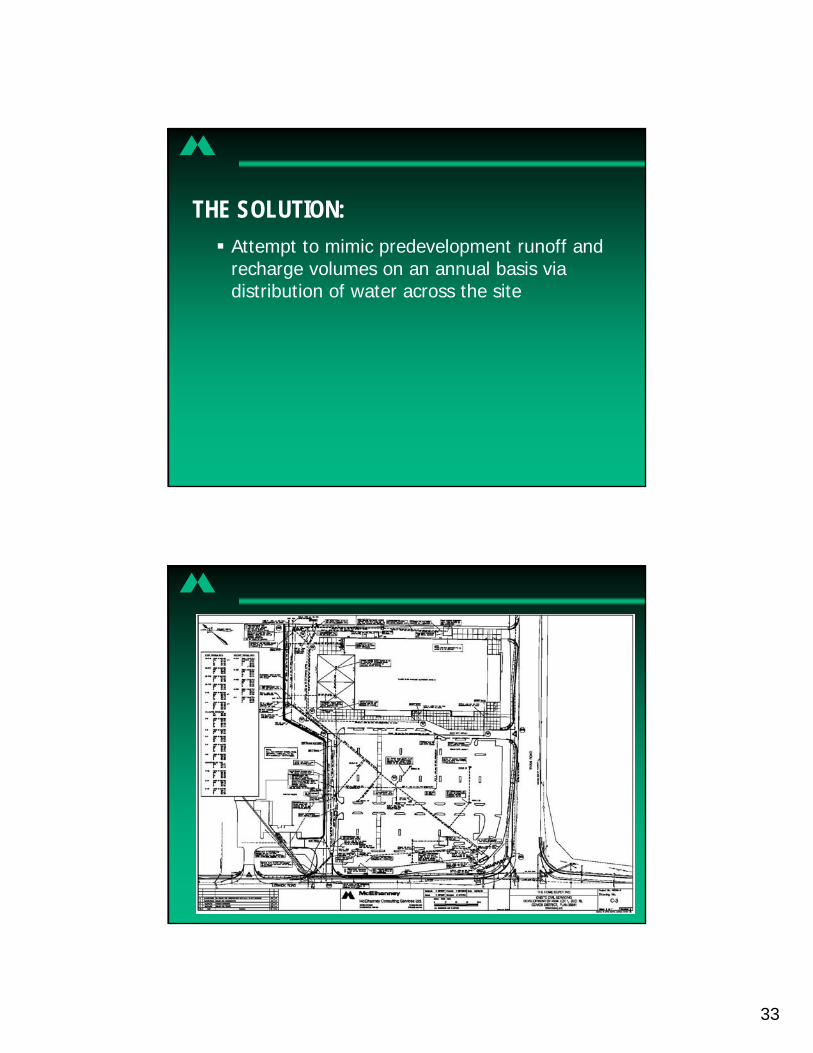
THE SOLUTION:Attempt to mimic predevelopment runoff and recharge volumes on an annual basis via distribution of water across the site
34
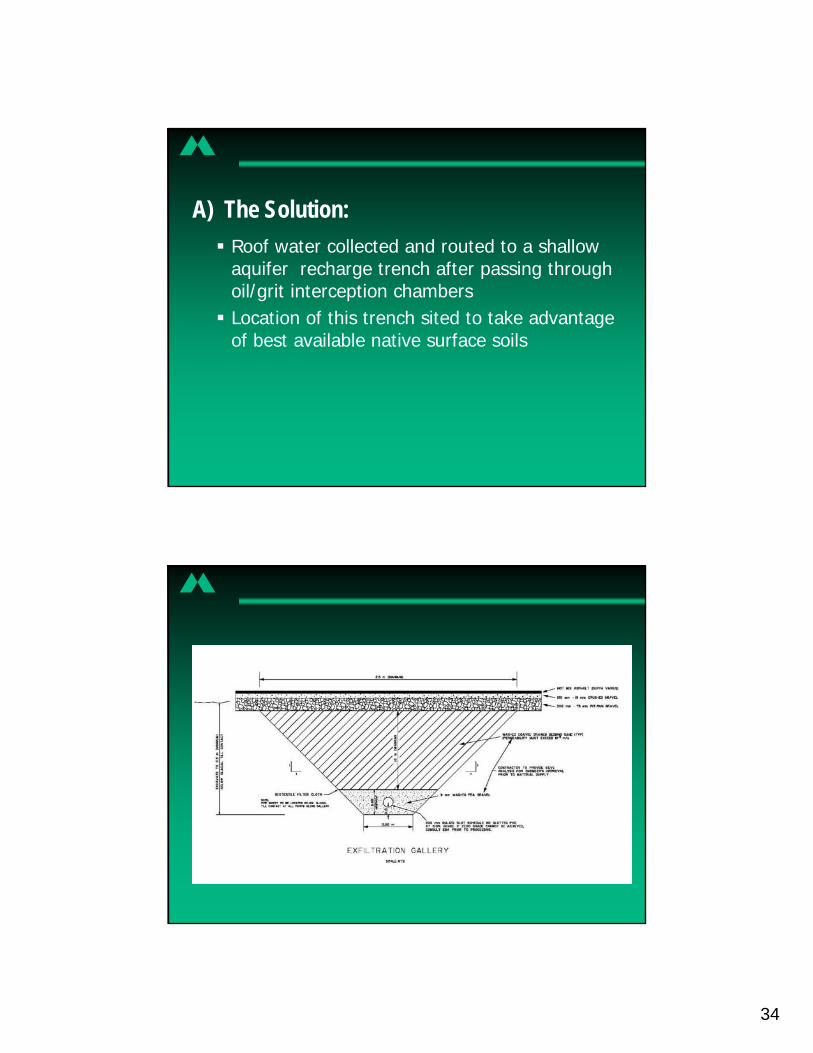
A) The Solution:Roof water collected and routed to a shallow aquifer recharge trench after passing through oil/grit interception chambersLocation of this trench sited to take advantage of best available native surface soils
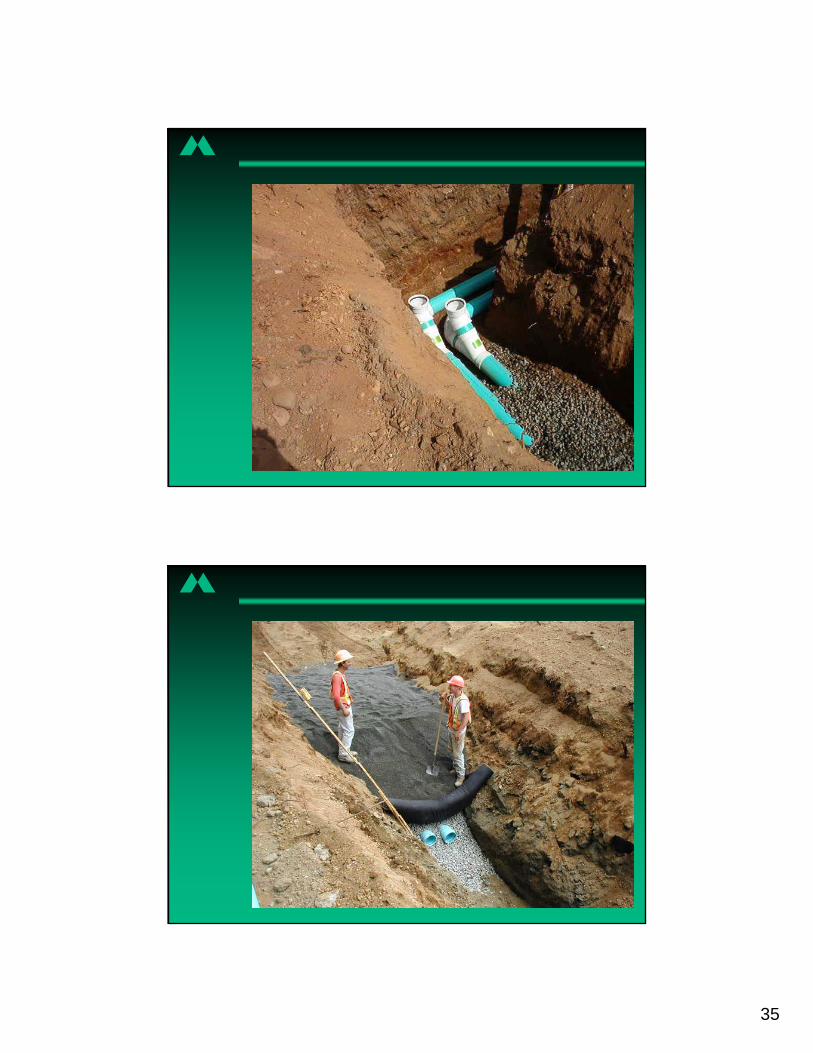
35

36
B) The Solution:In the event that this shallow aquifer recharge trench is overwhelmed, water level rises and spills into deep well exfiltration system

37
C) The Solution:Parking lot water is collected and passed through an oil/grit interception chamber (9,000 imperial gallons). This water then flows into a combined shallow/deep aquifer recharge system, similar to that designed for the roof water

38
Overflow diversion structure allows larger storms to bypass the oil/grit chamber but still be directed to the shallow/deep aquifer recharge system. This made the City very nervous as there is greater potential for groundwater contamination. However, in order that the average annual volume of site runoff was held at pre-development levels, the design was implemented.

39

40
Could have elected to pre-treat the full 2 year post development runoff through a vastly larger oil/grit chamber. Potential would exist for some hydro carbon contamination. Therefore, we elected instead for a monitoring programme. Hydrogeologist had suggested the hydrocarbon contamination potential was not a major concern
Monitoring wells were installed to depth, roughly 10 metres away from the deep recharge wells

41
D) The Solution:Bio-vegetated filtration sample c/w underlying free draining recharge media, was installed along the rear property line, receiving water from loading bay areas and access roads

42
E) The Solution:Landscaped areas were maximized c/w free draining abortive “structure soil” extending beneath them to a greater plan area
F) The Solution:Monitoring of quantities and quality of runoff (required by City)

43
THE RESULTS:Direct rapid peak runoff to the Brooklyn Creek basin was drastically reduced, as compared to typical commercial developmentAverage annual runoff is held to historic predevelopment valuesShallow and deep aquifer recharge is accommodatedHydrocarbon and grit capture prior to discharge to the receiving environment
OBSERVATION:Costs were in excess of $400,000.00 for wells/chambers and recharge facilitiesOwner not overly perturbed over these costsOwner recognized a social duty to protect the local environment (and understood their development was contingent upon applying Water Balance Model type site service control measures)

44
What is Your HandsWhat is Your Hands--On On Experience with Experience with
‘‘Rainfall Capture SystemsRainfall Capture Systems’’at the Site Scale?at the Site Scale?
Standard Sump
Exfiltration Sump
700 square foot garage
No storm connection at rear of property
Condition of permit

45
Rainwater Source Controls
Rain Gardens
Raingardens - also called Bioretention…
Absorbent Landscape
Rainwater Source Controls
Infiltration Swales
Permeable Pavement
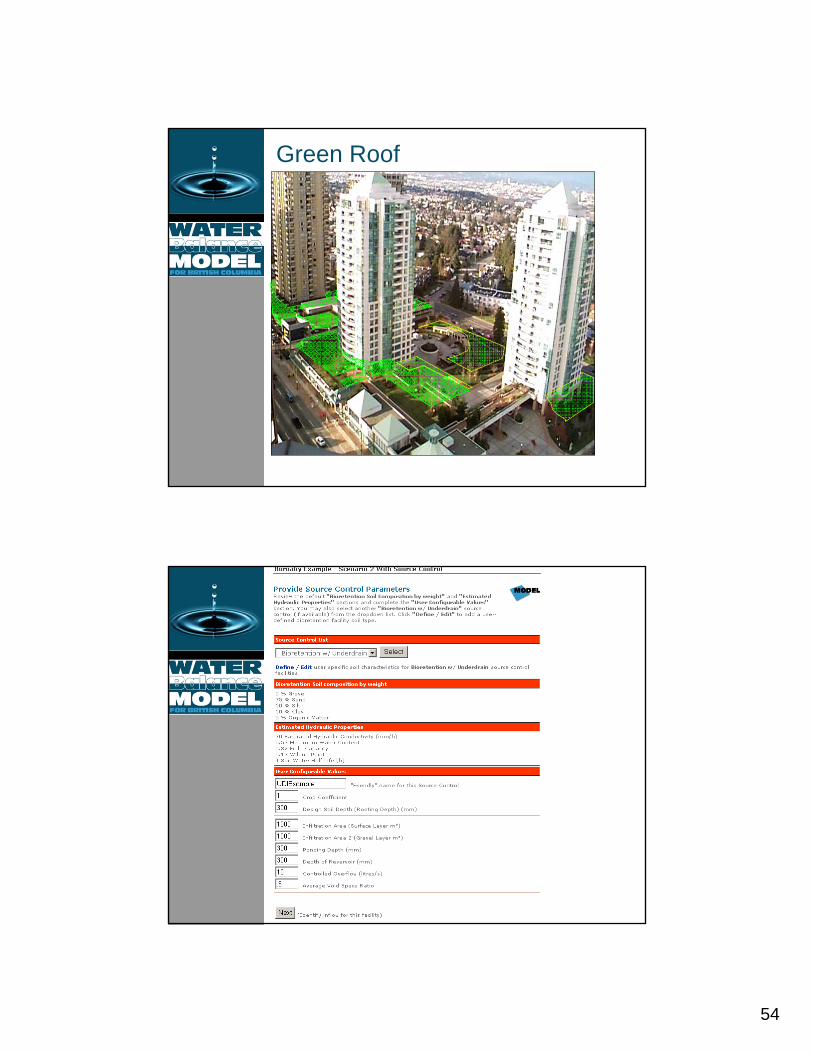
Green Roof
46
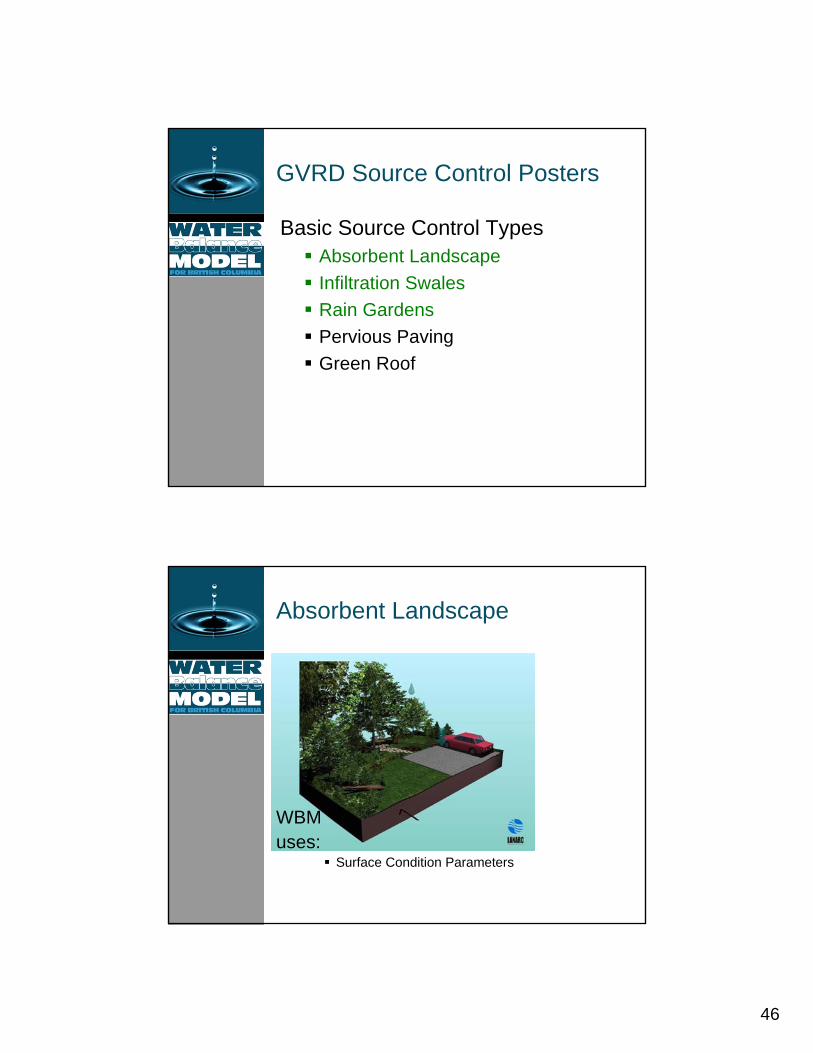
GVRD Source Control Posters
Basic Source Control TypesAbsorbent LandscapeInfiltration SwalesRain GardensPervious PavingGreen Roof
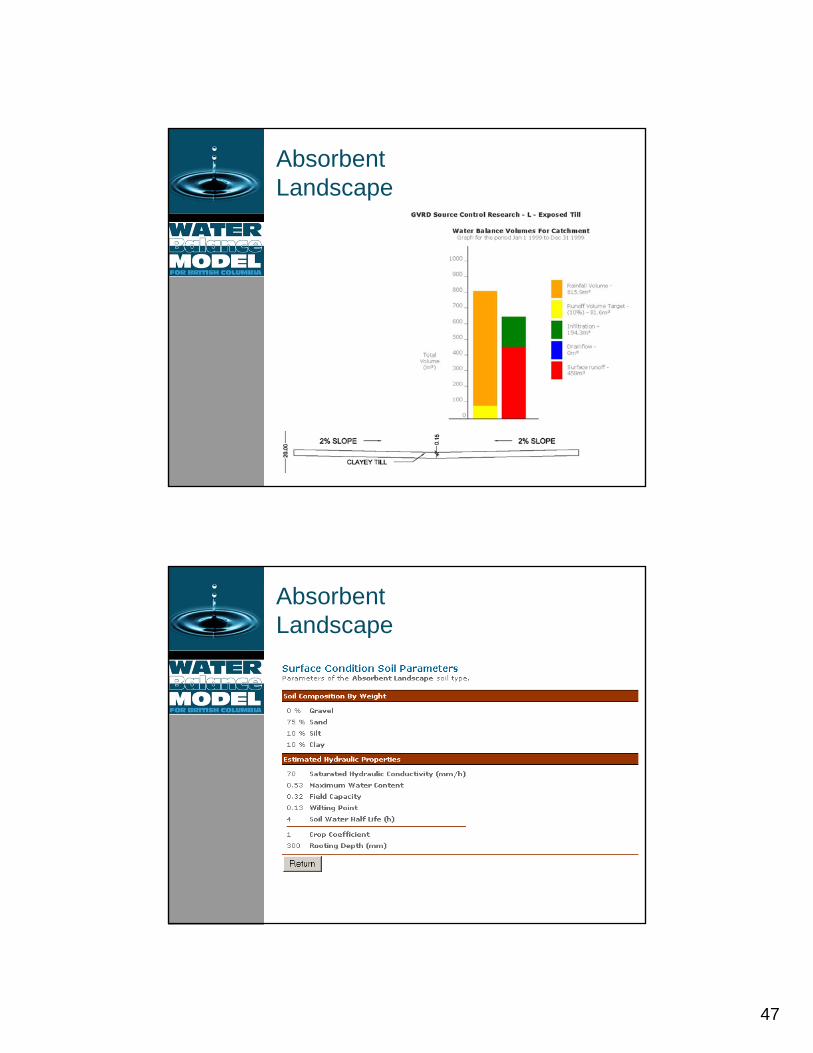
Absorbent Landscape
WBMuses:
Surface Condition Parameters
47
AbsorbentLandscape
AbsorbentLandscape

48
AbsorbentLandscape
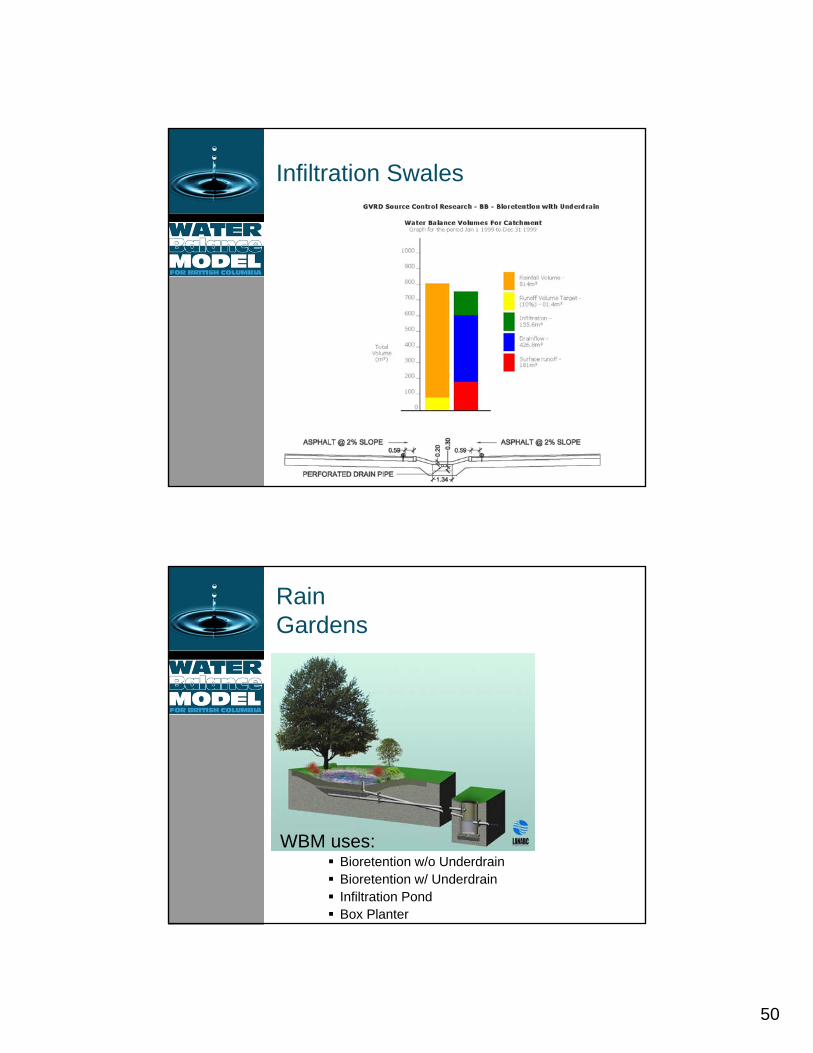
Infiltration Swales
WBM uses:Vegetated Swale w/o UnderdrainVegetated Swale w/ UnderdrainInfiltration Trench

49
Infiltration Swales
Infiltration Swales
50
Infiltration Swales
RainGardens
WBM uses:Bioretention w/o UnderdrainBioretention w/ UnderdrainInfiltration PondBox Planter

51
Simple Infiltration
Rain Garden A
Rain Garden B
Simple Infiltration + Reservoir

52
Rain Garden C
Simple Infiltration + Reservoir+ Overflow
Rain Garden C2
Simple Infiltration + Reservoir+ Overflow + Controlled Outlet

53
Controlled Outlet Detail
Pervious Paving
WBM does not currently model Pervious Paving
54
Green Roof

55
www.waterbalance.ca
Workshop Road Map
Context & OverviewContext & OverviewWhy the Water Balance ModelWhy the Water Balance ModelHow to Use the ModelHow to Use the ModelApplication of Source ControlsApplication of Source ControlsScenario ModelingScenario ModelingRoundtable DiscussionRoundtable Discussion
Photo from: Smart Growth BC

56
www.waterbalance.ca
Applying the Water Balance Model at Different Scales
SiteSubdivisionNeighbourhood
SiteSite
Watershed Watershed HealthHealth
WBMWBMBuilding sizeBuilding size
Hard surfaceHard surface
LandscapingLandscaping

57
SubdivisionSubdivision
Watershed Watershed HealthHealth
WBMWBMLot sizeLot size
Road DesignRoad DesignGreen spaceGreen spaceLandscapingLandscaping
WatershedWatershed
WBMWBMZoningZoning
Road DesignRoad Design
Green spaceGreen space
LandscapingLandscaping
‘‘FacilitiesFacilities’’Watershed Watershed
HealthHealth
58
Application of the Water Balance Model in the Millard/Piercy Watershed
Purpose
• Minimize any increases in post development stormwater run-off (ensuring stream stability and salmon survival into the future)
• Provide options for alternative stormwater source controls to achieve the above objectives
• Provide baseline stream flows to establish pre-development stream flow characteristics
• Conduct post-development water level monitoring

59
Zoning Map of Study Area
60
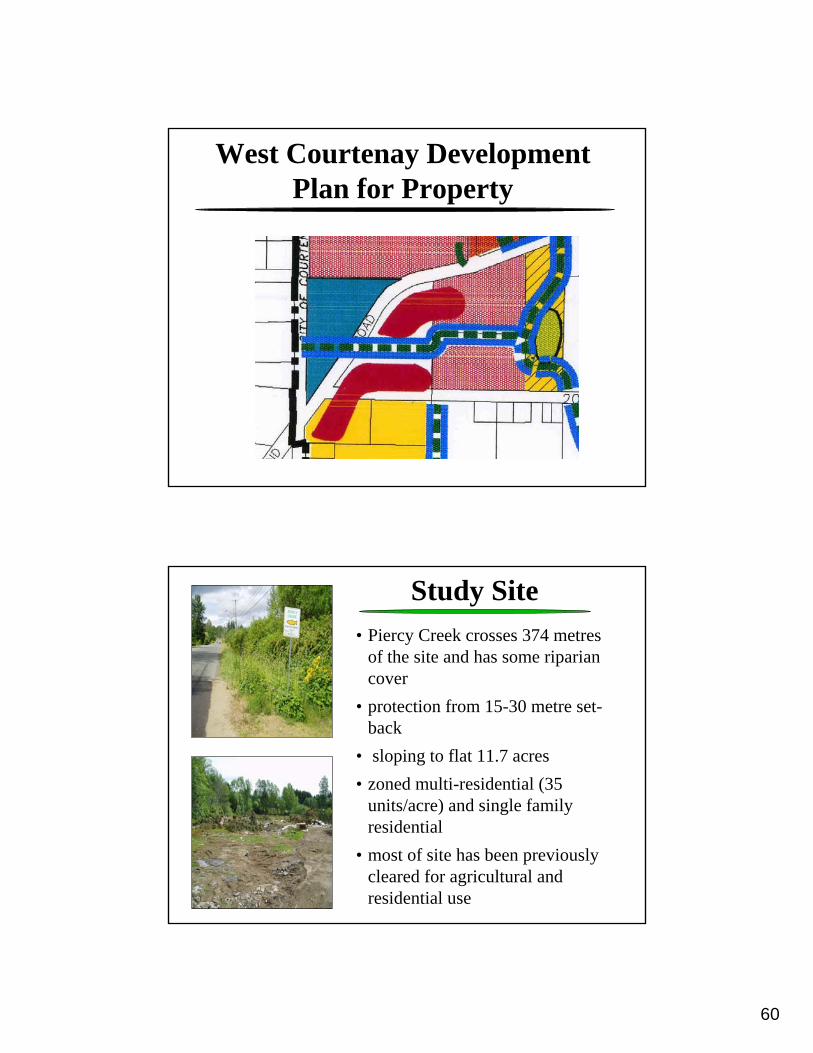
West Courtenay Development Plan for Property
Study Site• Piercy Creek crosses 374 metres
of the site and has some riparian cover
• protection from 15-30 metre set-back
• sloping to flat 11.7 acres• zoned multi-residential (35
units/acre) and single family residential
• most of site has been previously cleared for agricultural and residential use
61
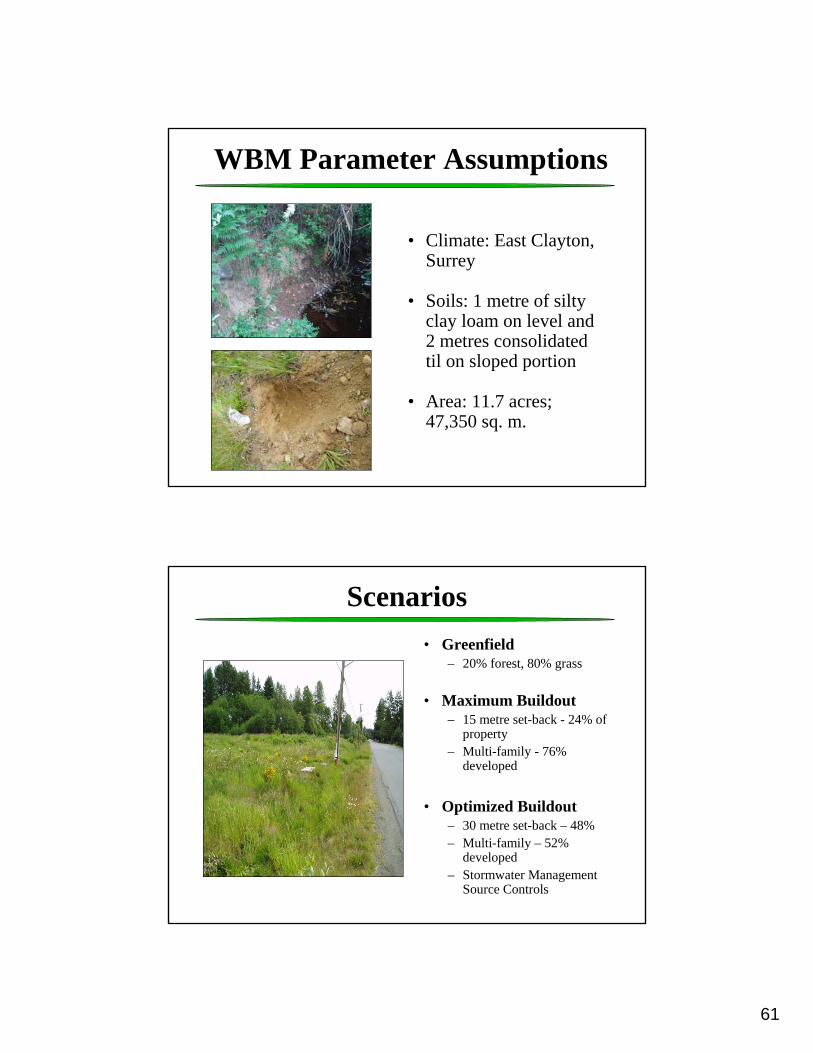
WBM Parameter Assumptions
• Climate: East Clayton, Surrey
• Soils: 1 metre of siltyclay loam on level and 2 metres consolidated til on sloped portion
• Area: 11.7 acres; 47,350 sq. m.
Scenarios• Greenfield
– 20% forest, 80% grass
• Maximum Buildout– 15 metre set-back - 24% of
property– Multi-family - 76%
developed
• Optimized Buildout– 30 metre set-back – 48%– Multi-family – 52%
developed– Stormwater Management
Source Controls
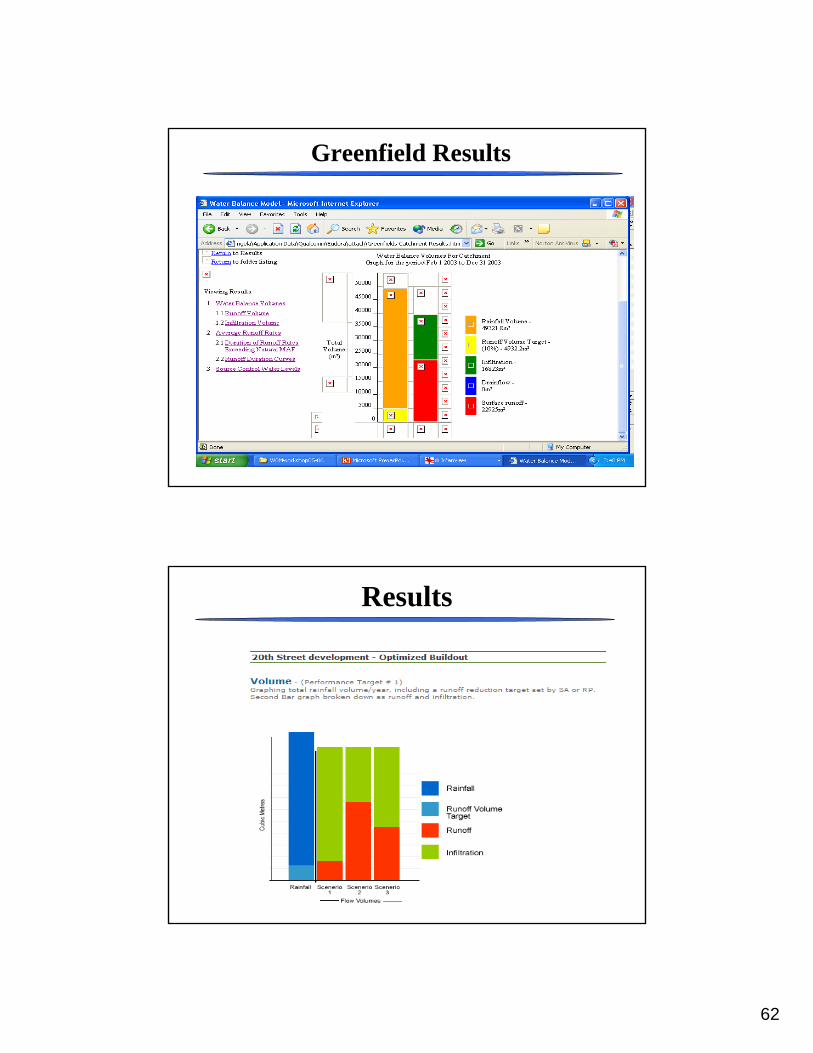
62
Greenfield Results
Results

63
Workshop Road Map
Context & OverviewContext & OverviewWhy the Water Balance ModelWhy the Water Balance ModelHow to Use the ModelHow to Use the ModelApplication of Source ControlsApplication of Source ControlsScenario ModelingScenario ModelingRoundtable DiscussionRoundtable Discussion
Photo from: Smart Growth BC
What Did You Learn from What Did You Learn from the Process?the Process?

64
The Water Balance Model is about a way of thinking
Long-Term Vision
Use of the model will become standard practice in British Columbia for land development decisions
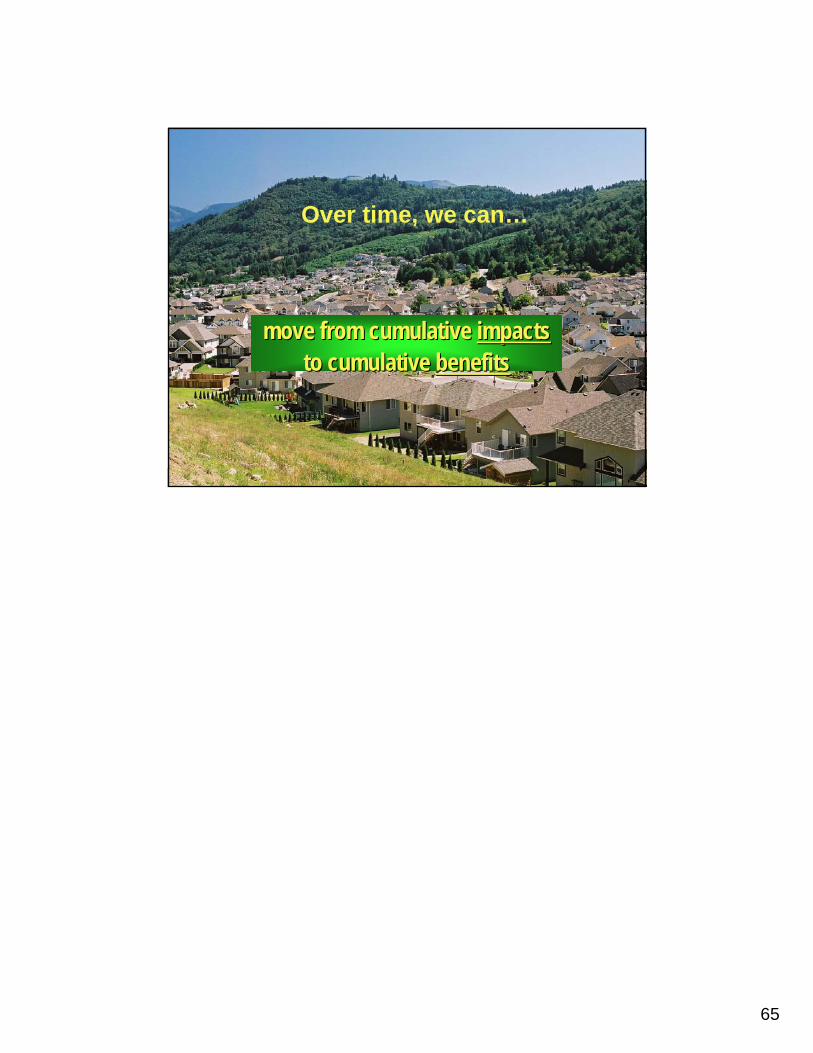
65
Over time, we can…
move from cumulative move from cumulative impactsimpactsto cumulative to cumulative benefitsbenefits


