Download - Weekly Projects Update - w/e 9th June
Weekly Waste Projects Update – week ending 9th
June 2016
Weekly Waste Projects Update: week ending 9th
June 2016 Source: AcuComm Business Database
01
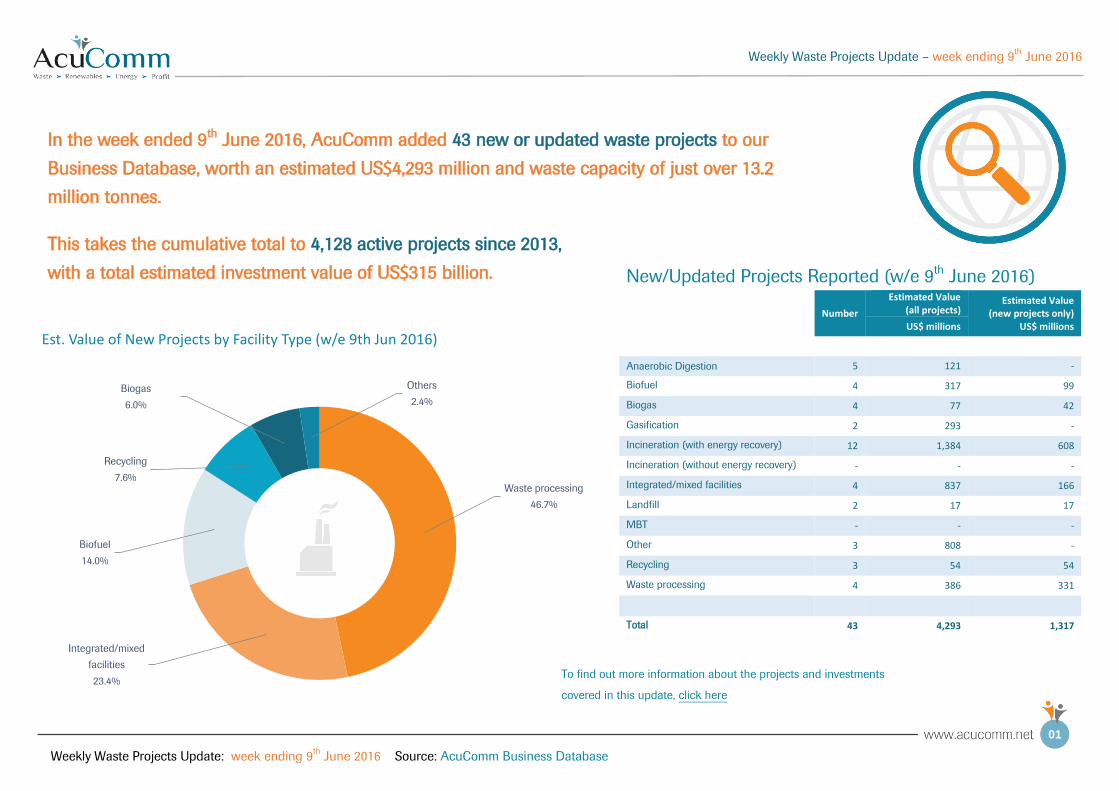
New/Updated Projects Reported (w/e 9th June 2016)
Number
Estimated Value (all projects)
Estimated Value (new projects only)
US$ millions US$ millions
Anaerobic Digestion 5 121 -
Biofuel 4 317 99
Biogas 4 77 42
Gasification 2 293 -
Incineration (with energy recovery) 12 1,384 608
Incineration (without energy recovery) - - -
Integrated/mixed facilities 4 837 166
Landfill 2 17 17
MBT - - -
Other 3 808 -
Recycling 3 54 54
Waste processing 4 386 331
Total 43 4,293 1,317
Waste processing
46.7%
Integrated/mixed
facilities
23.4%
Biofuel
14.0%
Recycling
7.6%
Biogas
6.0%
Others
2.4%
Est. Value of New Projects by Facility Type (w/e 9th Jun 2016)
In the week ended 9th June 2016, AcuComm added 43 new or updated waste projects to our
Business Database, worth an estimated US$4,293 million and waste capacity of just over 13.2
million tonnes.
This takes the cumulative total to 4,128 active projects since 2013,
with a total estimated investment value of US$315 billion.
To find out more information about the projects and investments
covered in this update, click here
Weekly Waste Projects Update – week ending 9th
June 2016
Weekly Waste Projects Update: week ending 9th
June 2016 Source: AcuComm Business Database
02
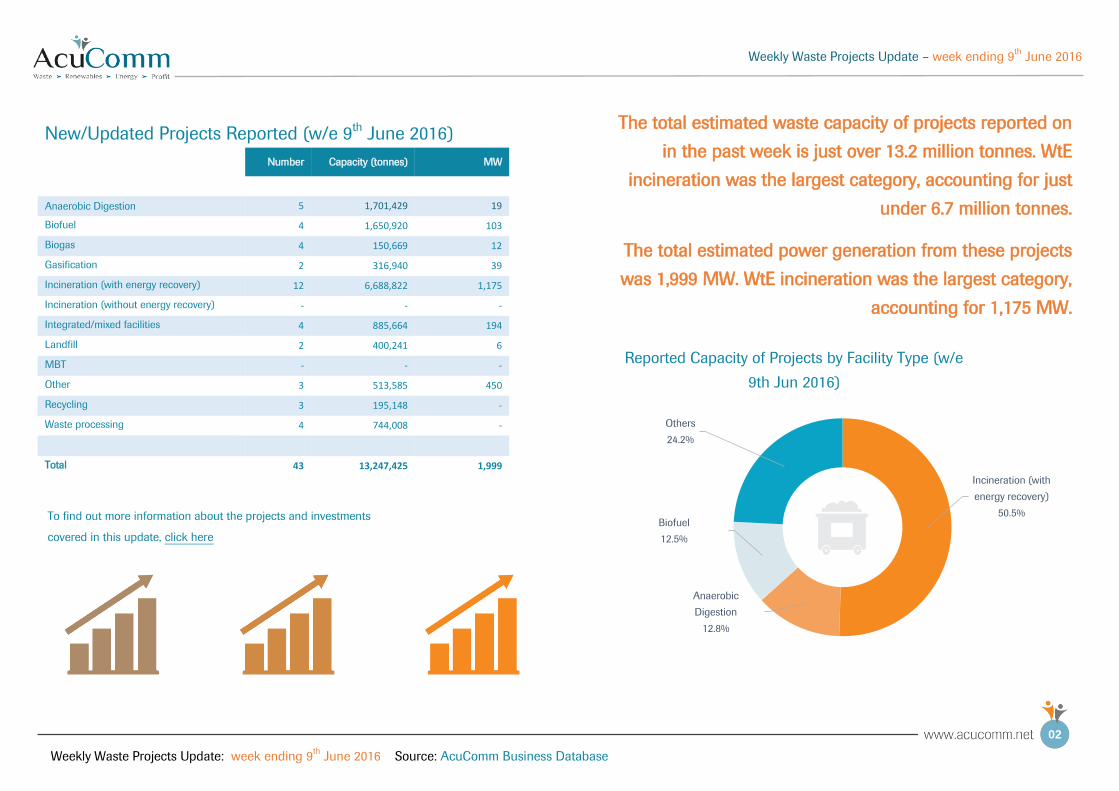
New/Updated Projects Reported (w/e 9th June 2016)
Number Capacity (tonnes) MW
Anaerobic Digestion 5 1,701,429 19
Biofuel 4 1,650,920 103
Biogas 4 150,669 12
Gasification 2 316,940 39
Incineration (with energy recovery) 12 6,688,822 1,175
Incineration (without energy recovery) - - -
Integrated/mixed facilities 4 885,664 194
Landfill 2 400,241 6
MBT - - -
Other 3 513,585 450
Recycling 3 195,148 -
Waste processing 4 744,008 -
Total 43 13,247,425 1,999
The total estimated waste capacity of projects reported on
in the past week is just over 13.2 million tonnes. WtE
incineration was the largest category, accounting for just
under 6.7 million tonnes.
The total estimated power generation from these projects
was 1,999 MW. WtE incineration was the largest category,
accounting for 1,175 MW.
Incineration (with
energy recovery)
50.5%
Anaerobic
Digestion
12.8%
Biofuel
12.5%
Others
24.2%
Reported Capacity of Projects by Facility Type (w/e
9th Jun 2016)
To find out more information about the projects and investments
covered in this update, click here
Weekly Waste Projects Update – week ending 9th
June 2016
Weekly Waste Projects Update: week ending 9th
June 2016 Source: AcuComm Business Database
03
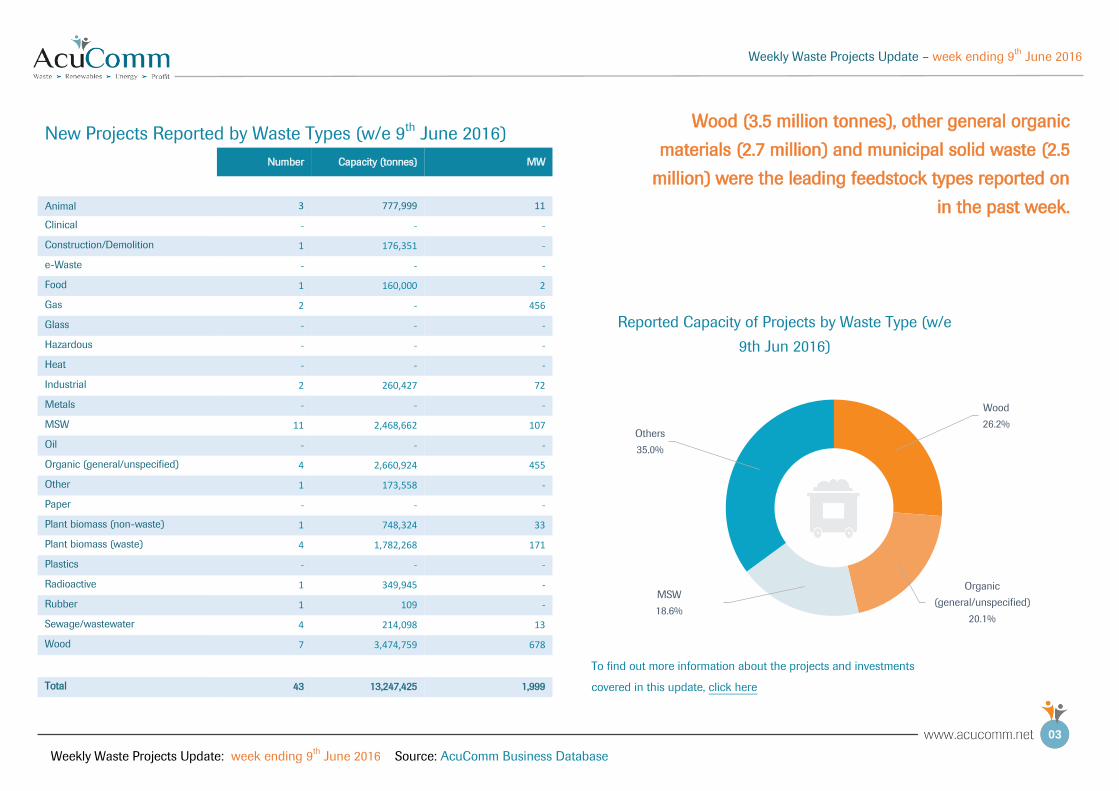
New Projects Reported by Waste Types (w/e 9th June 2016)
Number Capacity (tonnes) MW
Animal 3 777,999 11
Clinical - - -
Construction/Demolition 1 176,351 -
e-Waste - - -
Food 1 160,000 2
Gas 2 - 456
Glass - - -
Hazardous - - -
Heat - - -
Industrial 2 260,427 72
Metals - - -
MSW 11 2,468,662 107
Oil - - -
Organic (general/unspecified) 4 2,660,924 455
Other 1 173,558 -
Paper - - -
Plant biomass (non-waste) 1 748,324 33
Plant biomass (waste) 4 1,782,268 171
Plastics - - -
Radioactive 1 349,945 -
Rubber 1 109 -
Sewage/wastewater 4 214,098 13
Wood 7 3,474,759 678
Total 43 13,247,425 1,999
Wood (3.5 million tonnes), other general organic
materials (2.7 million) and municipal solid waste (2.5
million) were the leading feedstock types reported on
in the past week.
Wood
26.2%
Organic
(general/unspecified)
20.1%
MSW
18.6%
Others
35.0%
Reported Capacity of Projects by Waste Type (w/e
9th Jun 2016)
To find out more information about the projects and investments
covered in this update, click here
Weekly Waste Projects Update – week ending 9th
June 2016
Weekly Waste Projects Update: week ending 9th
June 2016 Source: AcuComm Business Database
04
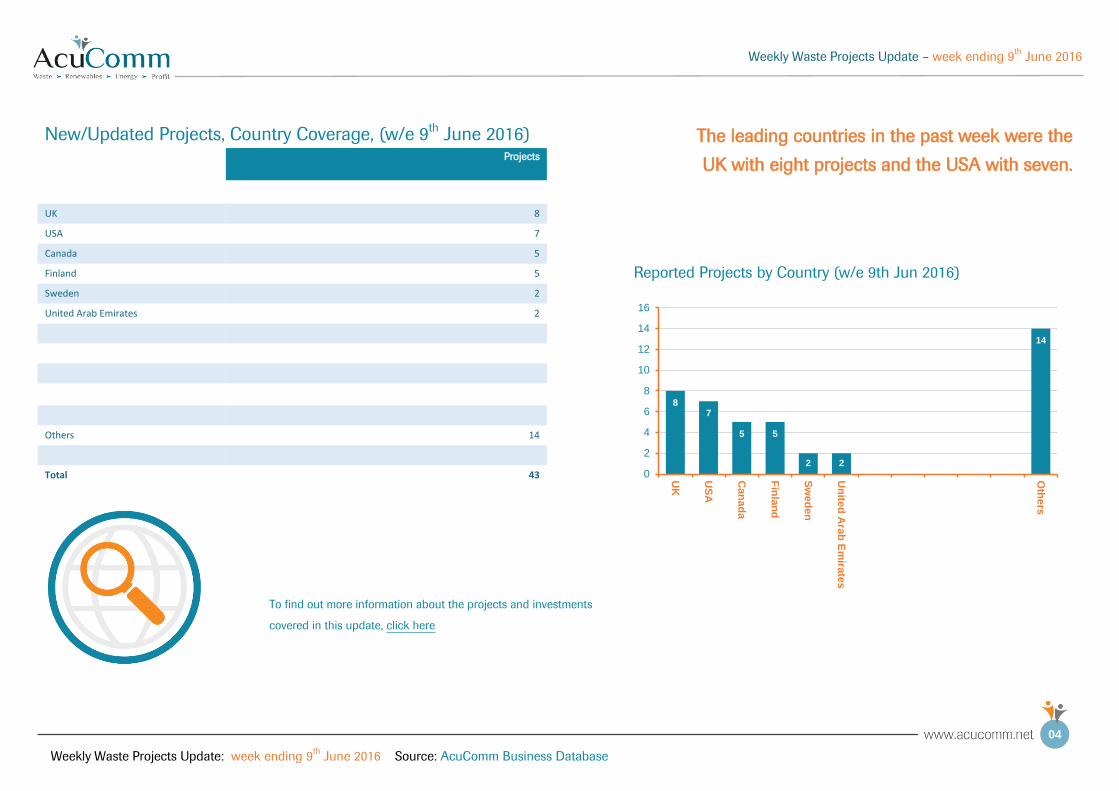
New/Updated Projects, Country Coverage, (w/e 9th June 2016)
Projects
UK 8
USA 7
Canada 5
Finland 5
Sweden 2
United Arab Emirates 2
Others 14
Total 43
The leading countries in the past week were the
UK with eight projects and the USA with seven.
87
5 5
2 2 0 0 0 0 0
14
0
2
4
6
8
10
12
14
16
UK
US
A
Can
ad
a
Fin
lan
d
Sw
ed
en
Un
ited
Ara
b E
mira
tes
Oth
ers
Reported Projects by Country (w/e 9th Jun 2016)
To find out more information about the projects and investments
covered in this update, click here
Weekly Waste Projects Update – week ending 9th
June 2016
Weekly Waste Projects Update: week ending 9th
June 2016 Source: AcuComm Business Database
05
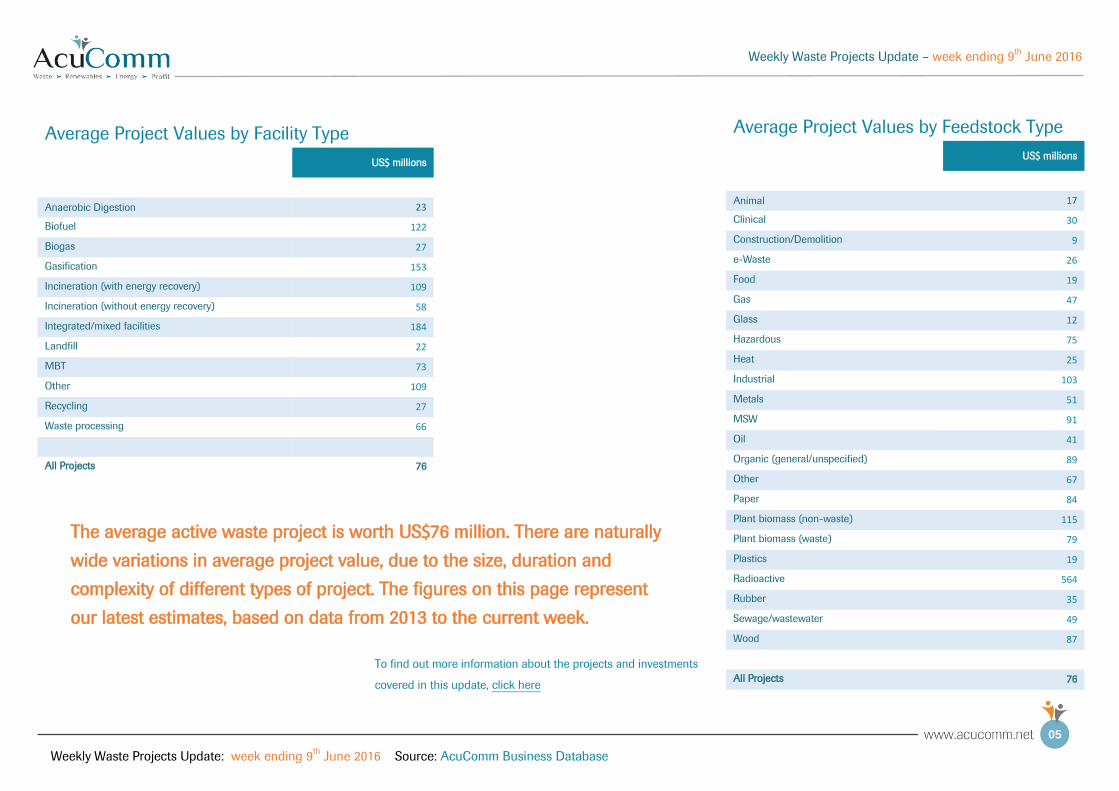
Average Project Values by Facility Type
US$ millions
Anaerobic Digestion 23
Biofuel 122
Biogas 27
Gasification 153
Incineration (with energy recovery) 109
Incineration (without energy recovery) 58
Integrated/mixed facilities 184
Landfill 22
MBT 73
Other 109
Recycling 27
Waste processing 66
All Projects 76
Average Project Values by Feedstock Type
US$ millions
Animal 17
Clinical 30
Construction/Demolition 9
e-Waste 26
Food 19
Gas 47
Glass 12
Hazardous 75
Heat 25
Industrial 103
Metals 51
MSW 91
Oil 41
Organic (general/unspecified) 89
Other 67
Paper 84
Plant biomass (non-waste) 115
Plant biomass (waste) 79
Plastics 19
Radioactive 564
Rubber 35
Sewage/wastewater 49
Wood 87
All Projects 76
The average active waste project is worth US$76 million. There are naturally
wide variations in average project value, due to the size, duration and
complexity of different types of project. The figures on this page represent
our latest estimates, based on data from 2013 to the current week.
To find out more information about the projects and investments
covered in this update, click here
Weekly Waste Projects Update – week ending 9th
June 2016
Weekly Waste Projects Update: week ending 9th
June 2016 Source: AcuComm Business Database
06
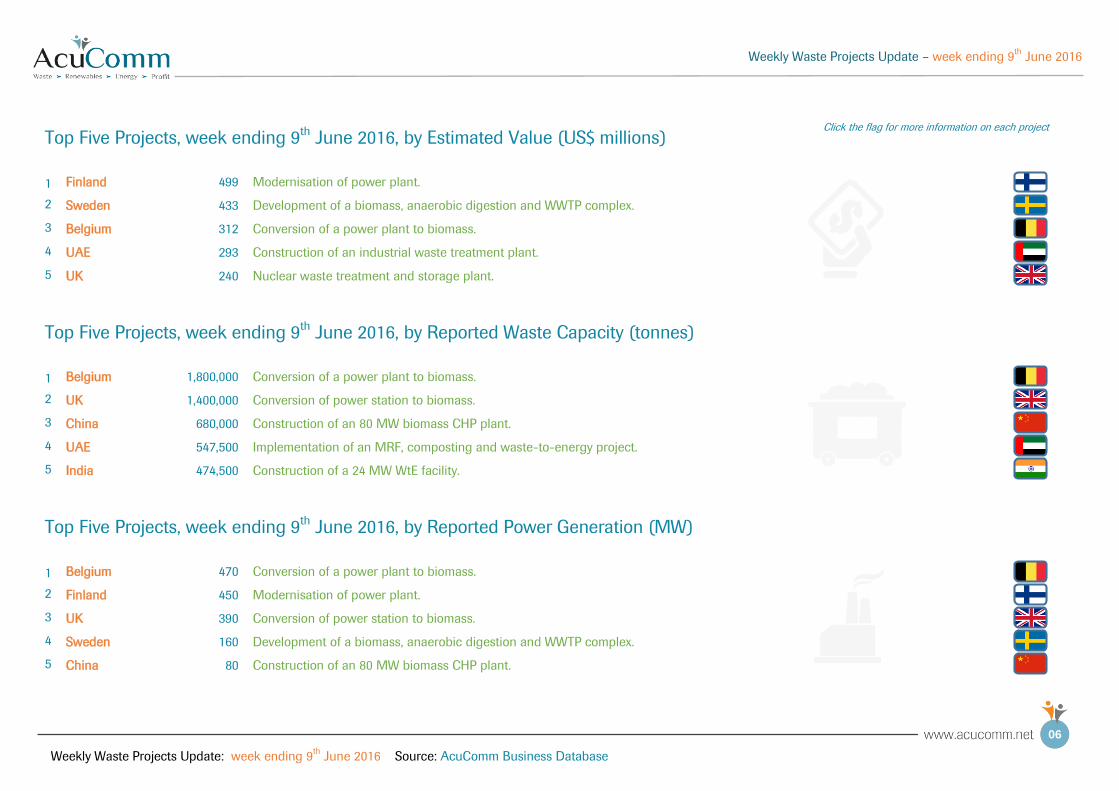
Top Five Projects, week ending 9th June 2016, by Estimated Value (US$ millions) Click the flag for more information on each project
1 Finland 499 Modernisation of power plant.
2 Sweden 433 Development of a biomass, anaerobic digestion and WWTP complex.
3 Belgium 312 Conversion of a power plant to biomass.
4 UAE 293 Construction of an industrial waste treatment plant.
5 UK 240 Nuclear waste treatment and storage plant.
Top Five Projects, week ending 9th June 2016, by Reported Waste Capacity (tonnes)
1 Belgium 1,800,000 Conversion of a power plant to biomass.
2 UK 1,400,000 Conversion of power station to biomass.
3 China 680,000 Construction of an 80 MW biomass CHP plant.
4 UAE 547,500 Implementation of an MRF, composting and waste-to-energy project.
5 India 474,500 Construction of a 24 MW WtE facility.
Top Five Projects, week ending 9th June 2016, by Reported Power Generation (MW)
1 Belgium 470 Conversion of a power plant to biomass.
2 Finland 450 Modernisation of power plant.
3 UK 390 Conversion of power station to biomass.
4 Sweden 160 Development of a biomass, anaerobic digestion and WWTP complex.
5 China 80 Construction of an 80 MW biomass CHP plant.
Weekly Waste Projects Update – week ending 9th
June 2016
Weekly Waste Projects Update: week ending 9th
June 2016 Source: AcuComm Business Database
07