Download - UTILISATION OF GIS TECHNOLOGY FOR TOURISM …

European Scientific Journal January 2013 edition vol.9, No.3 ISSN: 1857 – 7881 (Print) e - ISSN 1857- 7431
92
UTILISATION OF GIS TECHNOLOGY FOR TOURISM MANAGEMENT IN VICTORIA ISLAND LAGOS
Ofobruku Sylvester Abomeh Tourism And Hospitality Services Keffi, Nasarawa State.
Onabanjo Bankole Nuga Tourism And Hospitality Services
Iheabunike Okafor Blessing C. National Institute For Hospitality And Tourism, Abuja
Abstract This study covers tourism destinations which include beach, Museums, Parks and resorts,
hotels, restaurants, clubs, bars, cinemas and fitness centres, as well as complementing tourism
destination Services which includes police post, clinics and hospital in Victoria Island Lagos
and how the utilisation of GIS technology can be use to improved tourism management. Also
to model accessibility to these points of interest mentioned above using Geographic
information system analytical tools and functions. Geographic coordinates of the location of
all bars, clubs, restaurants, cinema, fitness centre, hospital, clinic, police post and various
tourists destination have been picked with their corresponding attributes to build a database
using Arc Map 9.3 software package Geo database. Analyses to aid decision for management
and future planning was carried out using the spatial statistical tools in the GIS application
used for this study. The analysis included central Feature analysis which was used to model
area central to Tourism Facilities, Tourism services and Tourisms Destinations in Victoria
Island.
Keywords: Gis, Tourism, Planning, Management
Introduction
The basic Geographic information system investigation question of location is of
utmost importance for any decision to be made. Location of services of interest in urban
centres is equally important in making choices for residents and visitors. Many a time choice
making can be difficult because of standard and preference individuals have. Noting the

European Scientific Journal January 2013 edition vol.9, No.3 ISSN: 1857 – 7881 (Print) e - ISSN 1857- 7431
93
dynamic nature, taste, preference and set standards urban dwellers posses, it is important to
apply newer technologies in meeting such needs. In general when visitors are visiting tourism
sites information about the location and of related services is important during and before
such trips are made. when a visitor is on his way to a destination, he may want to know the
shortest route to reach the destination of interest and also check for nearest facility within a
specified distance or time to his or her current location.
Victoria Island falls within UTM coordinates easting’s 544508.976 and northing’s
711902.649 at the first corner, easting’s 549937.305 and northing’s 711449.416 at the second
corner, easting’s 549768.483 and northing’s 709816.022 at the third corner and easting’s
545674.062 and nothing’s 709763.115 metres. It was originally surrounded by water
bordered by the Atlantic Ocean on the South, the mouth of the Lagos Lagoon on the West,
and the Five Cowries, town and Island lie within the boundaries of Eti-Osa Local
Government area of Lagos state.
Fig 1: Diagram showing the location of the Study Area
European Scientific Journal January 2013 edition vol.9, No.3 ISSN: 1857 – 7881 (Print) e - ISSN 1857- 7431
94
Research questions The following research questions guided the study:
1. How can tourist or resident access the location of places of interest saving cost, and travel
time?
2. What is the distribution pattern of places of interest in the study area?
3. How can GIS technology be used to enhance tourism management?
4. What are the benefits of the use of GIS in tourism management?
Literature Review The “organized collection of computer hardware, software, geographic data and
personnel design to efficiently capture, store, update, manipulate, analyse, and display all
forms of geographically referenced information” is called Geographic Information System
(ESRI, 1990). With its capabilities for business mapping, geospatial analysis and its
contribution to decision making, GIS is a valuable tool applicable in the discipline of tourism.
Geographic Information Systems (GIS) and tourism share a common characteristic that is,
both cut cross the boundaries of disciplines and application areas. GIS has been applied in
many disciplines including geography, forestry, urban planning, and environmental studies.
Similarly, tourism has been a subject of interests to geographers, economists, business,
environmental planners, anthropologists, and archaeologists. As such, the potential for GIS
applications in tourism is significant. GIS operates on two data elements, which are spatial
and attribute data. Spatial data or geographic data refers to a known location on the earth
surface which is defined by coordinates and the attribute by place names, address and post
codes (Jovanic, 2008).
GIS is now recognized widely as a valuable tool for managing, analysing, and
displaying large volumes of diverse data pertinent to many local and regional planning
activities. Its use in tourism planning and management becomes imperative. Tourism is all
about the activities of persons away from their familiar environments of the home and work
place for a while and the facilities and services provided to enable them meet their felt needs
both in transit and at the destination area. (Dantata, 2005). Tourism is also defined by
United Nation in 1988 as a form of recreation which implies leaving home for another place,
whether near or far. To buttress these definitions, Tourism can be defined as the temporary
movement from home to unusual place for business, recreate, sightsee, visit or points of
interest whether near or far. The place of interest can vary from person to person. A hotel, a
night club, a restaurant a park can be a place of interest to a person and to another it may be
historic sites, conservation sites and other outdoor places within a city or urban centre.

European Scientific Journal January 2013 edition vol.9, No.3 ISSN: 1857 – 7881 (Print) e - ISSN 1857- 7431
95
Tourism is an activity highly dependent on environmental resources. It is also a phenomenon,
which in the event of a lack of planning and management will erode its environmental base.
Tourism management can be enhanced by GIS technology. GIS provide a toolbox of
techniques and technologies of wide applicability for the achievement of sustainable tourism
management. Attribute information on the various tourism facilities collected from different
sources can be linked to their respective spatial features. According to (Caldera de Ugarte et
al, 1997) they identified that GIS can be applied in two aspects, firstly for the public and
secondly for the management. The public focuses on the tourist or visitors to new cities while
management focuses on Tourism management process. The public can access tourism
information through the use of web based interactive map where tourist can have access to
view location of tourism site, roads networks, and other ancillary tourism facilities like
hospital, police station etc before visiting, here the interactive map shows road network, street
names and places of interest within the city for tourists. The second aspect focuses on
management needs for forecasting, planning and mitigating impacts caused by tourist
activities in areas where these activities are concentrated especially around residential
neighbourhoods and other centres.
Methodology The case study approach was used in this study to gain in-depth understanding of the
subject; the case study approach is employed when the researcher has little control over
events or when the focus is on phenomenon within a real life context (Osuala, 2005). Since
this study sought to thorough investigate, rich in details about the utilization of GIS
technology in tourism management in Victoria Island a case study research design was
considered the most appropriate. Therefore a case study research design was used for this
study because as Omale (2012) suggests, a case study is an intensive study geared towards a
thorough understanding of a given phenomenon, that provide a thorough, in-depth,
comprehensive and well ordered information and this is what this study intended to achieve.
Spatial database is the central force of GIS technology. Kufoniyi (1998) described GIS data
modelling as process by which the real world entities and their interrelationship are analyzed
and modelled in such a way that maximum benefit are derived while utilizing a minimum
number of data.Reality refers to phenomena as they actually exist, including all aspects which
may or may not be perceived by individuals. The view of reality is the mental abstraction of
reality for a particular application (user requirements) or group of applications (Kufoniyi,
1998).

European Scientific Journal January 2013 edition vol.9, No.3 ISSN: 1857 – 7881 (Print) e - ISSN 1857- 7431
96
Database Design Information Users and Their Information Needs: The information users are the
categories of people within the public that will need to access the database that will be
designed and implemented. For this study the following users have been identified and their
needs:
• The tourists and residents or public.
• The government agency in charge of Tourism.
• Emergency service providers.
• Law enforcement agencies.
The user’s requirement here guided on the type of information needed to build the
database.
Conceptual Design This involves defining the entities which are the view of reality relevant to the study.
• The road networks are represented as line features.
• The Tourists Destinations in Victoria Island which included Beaches, Museums, Art
Gallery, Parks and Tourist Resorts are represented as points.
• The Tourists Facilities in Victoria Island which included hotels, restaurants, bars,
cinemas, clubs and fitness centres are represented as points.
• The Services Victoria Island which include hospitals, clinic and police post are
represented as points.
Logical Design It involves transmitting or translation of the conceptual schema into logical schema. It
also involves selecting implementation software. Here the entities identified become relations
with attributes. Table 1.0: Facilities Entity and its Attributes
FIELD DESCRIPTION F_ID Facility identifier.
F_NAME Facility name. F_TYPE Facility type.
F_STREET Facility street location. F_ADDRESS Facility full address. F_PRODUCT Facility products.
Hardware The hardware used for this study included a Scanner, Printer, Desktops personal
computer, and GPS device. The scanner was used to convert the analogue map of Victoria
Island into digital, the printer was used to print out hard copies of maps and technical reports,
the personal computer was used to drive various software applications used and the GPS
device was used to capture point coordinates.

European Scientific Journal January 2013 edition vol.9, No.3 ISSN: 1857 – 7881 (Print) e - ISSN 1857- 7431
97
Software The software used in executing this study included ESRI ArcGIS 9.3 with extensions
including, Network analyst and spatial statistic analyst. All the extensions were used to
perform analysis. Other software application used included, Microsoft excel, and Microsoft
word
Data Acquisition The data used for this project were acquired primarily and secondarily. The primary
data were acquired through field survey using GPS devices to acquire point data in terms of
coordinates of points where Hotels, Clubs, Restaurant, Bars, Museums, Art Gallery, Parks,
Beaches, Cinemas, Resorts, Hospitals, clinics, police posts and Fitness Centres are located in
Victoria Island. The data captured where grouped into different categories which included
Facilities, Services, and Tourists Destinations. Then each facility, services, and tourist’s
destination were given different unique identifiers. The secondary data used for this project
was an existing road map of Victoria Island which was converted to digital form and Geo
referenced using coordinate’s of known points. The reference system used is “UTM”
Universal Traverse Mercator and a Projection of Zone 31N.
Physical Design The software used to execute and drive the database is ESRI ArcGIS9.3 desktop Geo
database.
Database Creation The point coordinates of hotels, hospitals, clinics, bars, clubs, restaurants, museums
beach, art gallery, police post and resorts were collected using GPS device, the data were
downloaded into excel spread sheet and were sorted respectively. The point coordinates is
grouped as Facilities, Services, and Tourism destinations and a feature class each and their
corresponding attribute fields is created in the ArcGIS 9.3 Geo database using the Arc
Catalog, to store the point data and their corresponding attributes. In inputting, the point data
into ArcGis 9.3 software application Geo database, the edit mode is turned on and the feature
class attribute table is opened. Each point is selected using the select tool and its
corresponding attribute is added into the Database. The hotels, restaurant, clubs, bars,
cinemas and fitness centres were grouped as Facilities because they compliment Tourists
destinations and given different unique identifiers in the Facilities feature class. The process
is also applied to the Services feature class and the Tourists Destination feature class. For the
purpose of analysis, the Facility feature class is broken down into separate feature class or
layer in the Geo database.

European Scientific Journal January 2013 edition vol.9, No.3 ISSN: 1857 – 7881 (Print) e - ISSN 1857- 7431
98
Table 1.2: Unique identifiers for Facility relation FACILITY UNIQUE IDENTIFIER( F_ID)
Hotel 0205 Restaurants 0206
Bars 0207 Club 0208
Cinemas 0209 Fitness centre 0204
The beach, parks, resorts, art gallery, and museums were group as Tourists destination
because they are the Tourists attraction in Victoria Island and given different unique
identifiers to normalize the database. The feature class was also broken into different layer
while still retaining the properties of the tourists’ destination feature class. They were all
stored in the Geo database. Table 1.3: Unique identifier Tourists destinations
TOURISTS DESTINATIONS UNIQUE IDENTIFIER( TD_ID) Beach 0305 Parks 0306
Resorts 0307 Art gallery 0308 Museum 0309
The police post, clinics and hospital were grouped as Services because they provide
services to the Facilities and Tourists Destinations in Victoria Island and were given different
unique identifiers in the Geo database. For analysis purpose they were also separated into
different layers but still retained the properties of the service feature class in the Geo
database. The reason for doing this is to use thematic layers to run analysis instead of using a
whole group called Facilities. The group theme of Facilities will function effectively in
database queries. Table 1.4: unique identifiers for Services
SERVICES UNIQUE IDENTIFIER( S_ID) Clinic 0405
Hospital 0406 Police post 0407
For analysis, address locators is used to Geo code the addresses of all features
identified for this project. The address locator is created in the Geo database using the US
street reference system which made use of house number to left, house number from left,
house number from right, and house number to right. All this additional field were attached to
each feature class. Also the street type and full address were also attached to the feature class.
The address locator created will enable address to be queried in the database. Therefore for
each point data acquired the opposite house number was taking into consideration and their
addresses were collected.

European Scientific Journal January 2013 edition vol.9, No.3 ISSN: 1857 – 7881 (Print) e - ISSN 1857- 7431
99
Data Security In a verge to properly manage the database created various security measures were
put in place to ensure the security of the information the database stores. On these note
backups has been created. This will ensure for data recovery should in case of unforeseen
occurrence with the database management system. Also various security measures such as
authorization and authentication will be given to users of the database to curb unauthorised
users.
Data Integrity This was done to ensure that the data value existing in the database base is accurate.
Therefore key integrity entailed that to any given relation there should be a Unique identifier,
entity integrity, domain integrity entailed that to every given attribute of a relation there is a
set of allowable permissible values and referential integrity were ensured and maintained for
the proper running of the database.
Analysis And Information Presentation Network Analysis
Achieving the objectives of this study network analysis is carried out to determine the
routes from points on the network to Tourist’s destinations, Facilities and Services. The
network analysis tool is a vital component of ESRI ArcGIS 9.3 geographic information
system software employed in this project. It is used in analysing transportation line to
determine shortest and fastest routes within a network. A simulation of route was carried out
on how tourists can move from Hotels to Tourists destinations and Restaurants in Victoria
Island. The first analysis here is to simulate the optimal route a Tourist will take when
moving within a network. The criteria’s used in building this network included additional
attribute fields such as “road length in METERS, SPEEDLIMIT and DRIVETIME”. The
drive time calculated by dividing the road length in meters by the speed limit and by 60
which represents minutes. This attributes were incorporated to the network that was built for
this project.
Drive Time = length in meters / speed limits / 60.
In simulating a route for Tourists, possible places in which a tourist may want to visit
were added has network location, for example it is evident that Tourists will want to move
from their hotel rooms to restaurants or to the tourist destination and also visit various point
of interest within Victoria Island. For easy data loading to the various points on the network
where Facilities exists, Tourist destinations exist and Services existed, those points were Geo
coded using address locator in the Geo database using US Street referencing system.

European Scientific Journal January 2013 edition vol.9, No.3 ISSN: 1857 – 7881 (Print) e - ISSN 1857- 7431
100
In simulating the route, the network analyst tool is initialized and new route is
selected. Then various stops where selected to simulate the tourist’s movement around the
Victoria Island. The stops are loaded using the address locator.
In the figure below a stop at Ajose Adeogun is selected and added has a network
location, this stop is the location of “MR BIGGS” restaurant on the network. Using the
address locator another location is added to the network depicting a hotel facility named
“ORIENTALS”, where tourists can decide to go within the network.
FIG. 2.0: Address locator used to add stops on the network
Two other locations within the network are also added using the address locator
making the number of stops within the network to be four. The first stop is a
“RESTAURANT” at Ajose Adeogun Street, the second stop is a “HOTEL” at Ozumba
Mbadiwe Avenue, the third stop is a “HOTEL” at Tony Anegbode Street and the last location
is a “CLUB” at Adetokunbo Ademola Street.

European Scientific Journal January 2013 edition vol.9, No.3 ISSN: 1857 – 7881 (Print) e - ISSN 1857- 7431
101
FIG. 3: All stops for best route analysis
When all the locations were added, it is necessary to right click on the Route layer on
the table of content and select, “ properties” to make adjustment to the desired setting needed
to run the analysis, afterwards the solve button is clicked for the system to run the route
analysis. The result displayed will show directions, distance and time it will take tourists to
move around points of interest within the network. For the purpose of this analysis, the
setting used is as follows: impedance used were minutes attributes, direction distance units
were kilometres.
Table 2.0: Criteria used for route analysis
CRITERION UNIT
Impedance Minutes
Direction distance unit Kilometres

European Scientific Journal January 2013 edition vol.9, No.3 ISSN: 1857 – 7881 (Print) e - ISSN 1857- 7431
102
FIG. 4: Result alternative route analysis Ajose Adeogun to Adetokunbo Ademola
FIG.5: Route analysis Ajose Adeogun to Adetokunbo Ademola
The result displayed shows that to move along all the four locations selected on this
network which is between Ajose Adegoun and Adetokunbo Ademola, it will take Tourists
6.724439 minutes which has been approximated to 7 minutes to cover a distance of 7.5
kilometers while driving assuming no traffic on the road. The same route is selected to
simulate and compare the route when there is a barrier at different point on the network.

European Scientific Journal January 2013 edition vol.9, No.3 ISSN: 1857 – 7881 (Print) e - ISSN 1857- 7431
103
Table 3: Result of Route Analysis ROUTES DISTANC
E DRIV
E TIME
Difference in
distance
Difference in
drivetime
Ajose Adeogun to adetokunbo Ademola(Best Route)
7.5 kilometres
7 minute
s
3 kilometr
es
3 minutes
Ajose Adeogun to Adetokunbo Ademola (alternative Route)
10.5 kilometres
10 minute
s Ajose Adeogun to Bishop Oluwole
(Best Route) 5.8
kilometres 7
minutes
2.5 kilometr
es
Same Drive time
Ajose Adeogun to Bishop Oluwole (alternative Route)
8.3 kilometres
7 minute
s Kofo Abayomi to Ahmadu Bello
(Best Route) 4.1
kilometres 3
minutes
3.4 kilometr
es
1 Minute
Kofo Abayomi to Ahmadu Bello (alternative Route)
7.5 kilometres
4 minute
s
The analysis shows that the route, if there is barrier it is longer while without barrier it
is shorter. The alternative route is longer. It means the barriers made the route 3 minute
longer than the usual to reach the same destination. But for Ajose Adeogun to Bishop
Oluwole, the analysis shows that the alternative route has the same drive time as the best
route but with a longer Distance. This was due to the speed limit assigned to the route which
is 50/kmh. Also Kofo Abayomi route shows that the best route is one minute faster than the
alternative.
The second analysis performed using ArcGIS 9.3 network analyst is the Service area
analysis. This is used to determine coverage area a particular Service or Facility within the
study area can serve by specifying parameters which can be in terms of Time or Meters
attribute created as impedance while the network was built. To set additional properties, the
Service area layer on the table of content is right clicked on and the properties layer is
selected and necessary parameters will be set, For the purpose of this analysis, the impedance
unit used is “the Minute attributes and the impedance minutes specified is 5 minutes”. For the
direction, “away from facility is selected” and the accumulation attributes used are Meters
and Minutes. The location of the Service facility was added using the address locator. The
Service used is a Hospital named Reddignton and it is located at Kofo Abayomi Street,
Victoria Island. The hospital location is used to analyse coverage area it can serve within the
network should in case of emergencies arising within Facilities and Tourists Destinations
within the network.
European Scientific Journal January 2013 edition vol.9, No.3 ISSN: 1857 – 7881 (Print) e - ISSN 1857- 7431
104
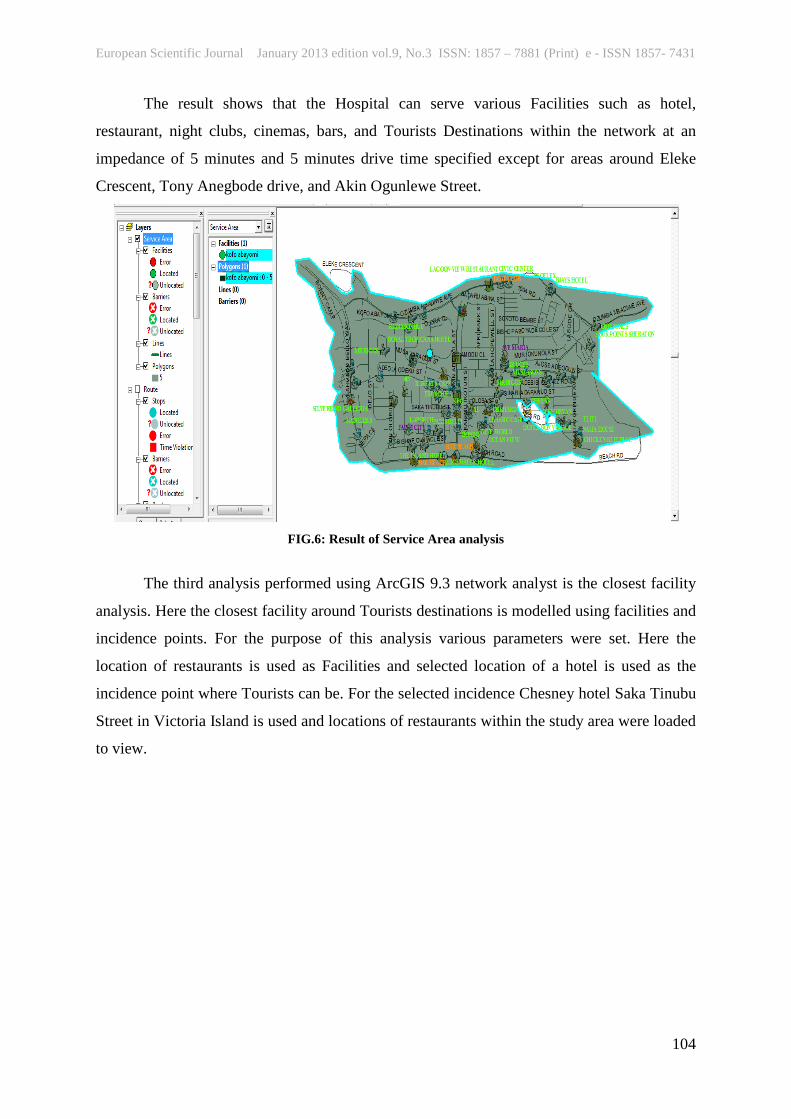
The result shows that the Hospital can serve various Facilities such as hotel,
restaurant, night clubs, cinemas, bars, and Tourists Destinations within the network at an
impedance of 5 minutes and 5 minutes drive time specified except for areas around Eleke
Crescent, Tony Anegbode drive, and Akin Ogunlewe Street.
FIG.6: Result of Service Area analysis
The third analysis performed using ArcGIS 9.3 network analyst is the closest facility
analysis. Here the closest facility around Tourists destinations is modelled using facilities and
incidence points. For the purpose of this analysis various parameters were set. Here the
location of restaurants is used as Facilities and selected location of a hotel is used as the
incidence point where Tourists can be. For the selected incidence Chesney hotel Saka Tinubu
Street in Victoria Island is used and locations of restaurants within the study area were loaded
to view.

European Scientific Journal January 2013 edition vol.9, No.3 ISSN: 1857 – 7881 (Print) e - ISSN 1857- 7431
105
FIG. 7: Locations of restaurants in Victoria Island
FIG.8: The selected incident point “CHESNEY HOTEL” using address locator
For the execution of the analysis, the criteria’s to use is set by right clicking on closet
facility layer in the table of content and selecting “properties”. Therefore, impedance is set to
minutes, default cut off value is set to 5 minutes and number of facilities to find is set to 4
and the travel is set to “Incident to Facilities”. The result showed that there were 4 restaurants
within 5 minutes drive time from “CHESNEY HOTEL” located at Saka Tinubu Street. The
restaurant’s name were “CHAOPHYRA” located at Saka Tinubu Street, “CHINAVILLE”

European Scientific Journal January 2013 edition vol.9, No.3 ISSN: 1857 – 7881 (Print) e - ISSN 1857- 7431
106
located at Akin Adesola Street, “FRENCHIES” located at Akin Adesola Street and
“BONZO” located at Akin Adesola Street in Victoria Island. When the result of the analysis
displayed it was observed that “CHAOPHYRA” is the closest facility to “CHESNEY
HOTEL” with a distance of 25.6005 meters and a drive time less than a minute.
FIG.9: Result closest facility analysis
The fourth analysis performed using ArcGIS 9.3 network analyst is the Origin and
Destination cost matrix analysis. Here the address locators is used to find addresses and
added as Origins and Destinations. For the Analysis, a selected location of hotels on the
network is used. The locations and names of the selected hotels used as Origins included
“RADISSION BLU” located at Ozumba Mbadiwe Avenue and “LAPORCH” located at
Olugbosi close respectively. For the Destinations, selected Tourists destinations were loaded
using the address locator. The selected Tourists Destinations is “DIDI MUSEUM” located at
Akin Adesola Street and “EKO ATLANTIC RESORT” located at Ahmadu Bello Way. The
necessary analysis settings were made. Impedance was set to “minutes”, “default cut off
values” was set to “8 minutes” and “Destinations to find” “All”

European Scientific Journal January 2013 edition vol.9, No.3 ISSN: 1857 – 7881 (Print) e - ISSN 1857- 7431
107
FIG.10: Selected Origins and Destinations
FIG.11: Origin and Destination (OD) Cost Analysis
FIG.12: attribute table of Origin and Destination (OD) cost Analysis

European Scientific Journal January 2013 edition vol.9, No.3 ISSN: 1857 – 7881 (Print) e - ISSN 1857- 7431
108
Spatial Statistical Analysis Another analysis performed using the spatial statistical tool box is central feature
analysis. This is used to determine central places within a distribution. To model and
determine area central to Facilities layer, Service layer, and Tourists Destinations layer in
Victoria Island, the central feature analysis is used. Here measuring geographic distributions
is selected from the spatial statistic tool box and central feature tool was double clicked on.
To analyse the central feature for Facilities, the Facilities layer is used as the Input feature
class and the distance method used was Manhattan distance was used. The same process was
applied to the Service and Tourists Destination in Victoria Island.
FIG. 13: Central feature for Facilities Layer
The result of the analysis showed that the point central to the Facilities layer is located
on Olosa Street in Victoria Island. Also for the Service layer the result showed that the point
central to Services is located on Eletu Ogabi Street in Victoria Island and the point central to
Tourists Destination is located on Ahmadu Bello Way respectively.
European Scientific Journal January 2013 edition vol.9, No.3 ISSN: 1857 – 7881 (Print) e - ISSN 1857- 7431
109
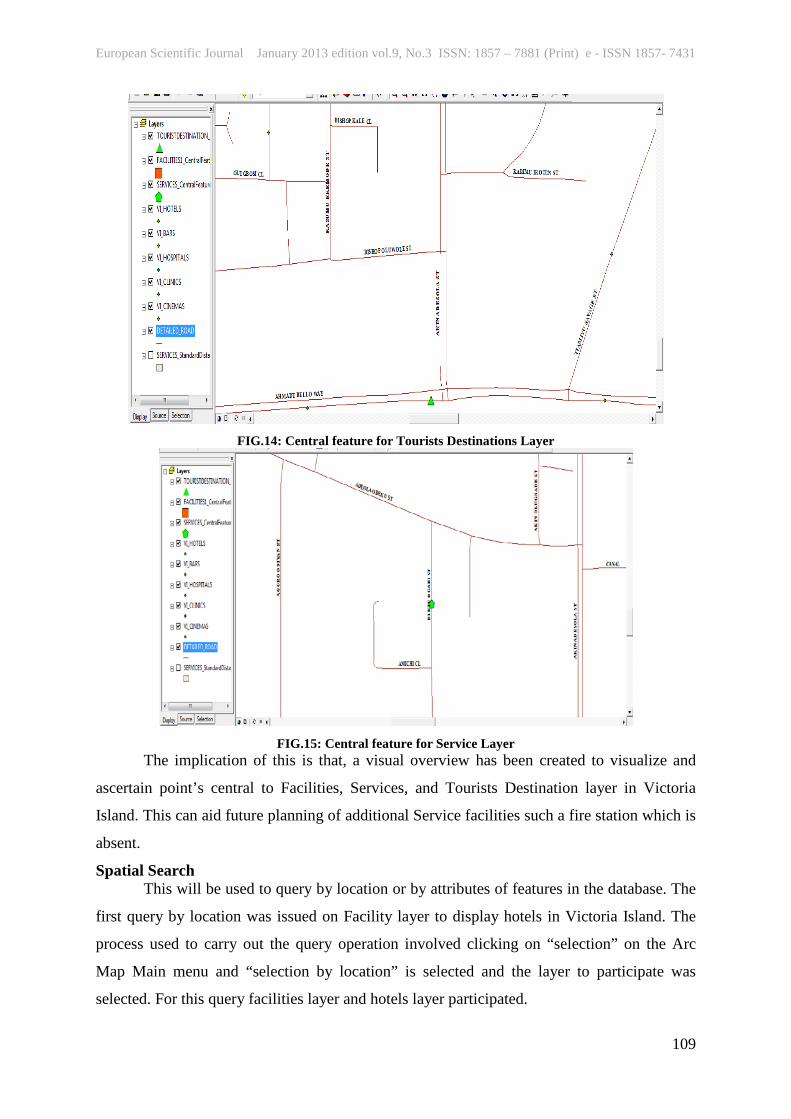
FIG.14: Central feature for Tourists Destinations Layer
FIG.15: Central feature for Service Layer
The implication of this is that, a visual overview has been created to visualize and
ascertain point’s central to Facilities, Services, and Tourists Destination layer in Victoria
Island. This can aid future planning of additional Service facilities such a fire station which is
absent.
Spatial Search This will be used to query by location or by attributes of features in the database. The
first query by location was issued on Facility layer to display hotels in Victoria Island. The
process used to carry out the query operation involved clicking on “selection” on the Arc
Map Main menu and “selection by location” is selected and the layer to participate was
selected. For this query facilities layer and hotels layer participated.

European Scientific Journal January 2013 edition vol.9, No.3 ISSN: 1857 – 7881 (Print) e - ISSN 1857- 7431
110
Fig.16: Result of Query by location for Restaurants in Facilities layer
Querying by attributes, the selection tab on the Arc Map main menu is clicked and
then selection by attribute. The layer to participate is Facilities.
Fig.17: Result of Query by attributes for in Restaurants Named Mr BIGGS.
Using multiple attribute selection queries two or more attributes can be queried at the
same time. To query for Facilities whose product is fast food and Type is Restaurant.
The Syntax for the query is Select* from FACILITIES
Where F_ PRODUCT = “FAST FOOD” and F_TYPE =”Restaurant”;

European Scientific Journal January 2013 edition vol.9, No.3 ISSN: 1857 – 7881 (Print) e - ISSN 1857- 7431
111
Fig. 18: Result of Query by Attributes for Selecting Restaurant whose product are fast food Querying for Facilities where product is Drinks and identifier is 208, the query issued
is Select* from Facilities where F_ PRODT = “DRINKS” and F_ ID = 208;
Fig.19: Result of Query by Attributes for Selecting Facilities whose product is Drinks
Spatial Distribution Analysis
This is used to analyse pattern of distribution of feature. This has been used to analyse
the distribution of Facilities, Services and Tourist Destinations in Victoria Island using Arc
Map 9.3. This analysis is carried out using average nearest neighbour to ascertain the spatial
distribution of Hotels, Restaurants, Bars, Nightclubs, and Cinema in Victoria Island. For the
analysis, the distance method specified is Manhattan distance.

European Scientific Journal January 2013 edition vol.9, No.3 ISSN: 1857 – 7881 (Print) e - ISSN 1857- 7431
112
The result of the analysis showed that Hotels, Restaurants, Night clubs, Bars, and
Cinema in Victoria Island are clustered. The result of this analysis is suitable for planning
purpose.
Fig.20: Result showing distribution Pattern of Hotels, Restaurants, Night clubs, Bars, and Cinema in
Victoria Island Thematic Maps Deliverables This displays various theme Maps generated in the course of the study.

European Scientific Journal January 2013 edition vol.9, No.3 ISSN: 1857 – 7881 (Print) e - ISSN 1857- 7431
113

European Scientific Journal January 2013 edition vol.9, No.3 ISSN: 1857 – 7881 (Print) e - ISSN 1857- 7431
114
European Scientific Journal January 2013 edition vol.9, No.3 ISSN: 1857 – 7881 (Print) e - ISSN 1857- 7431
115
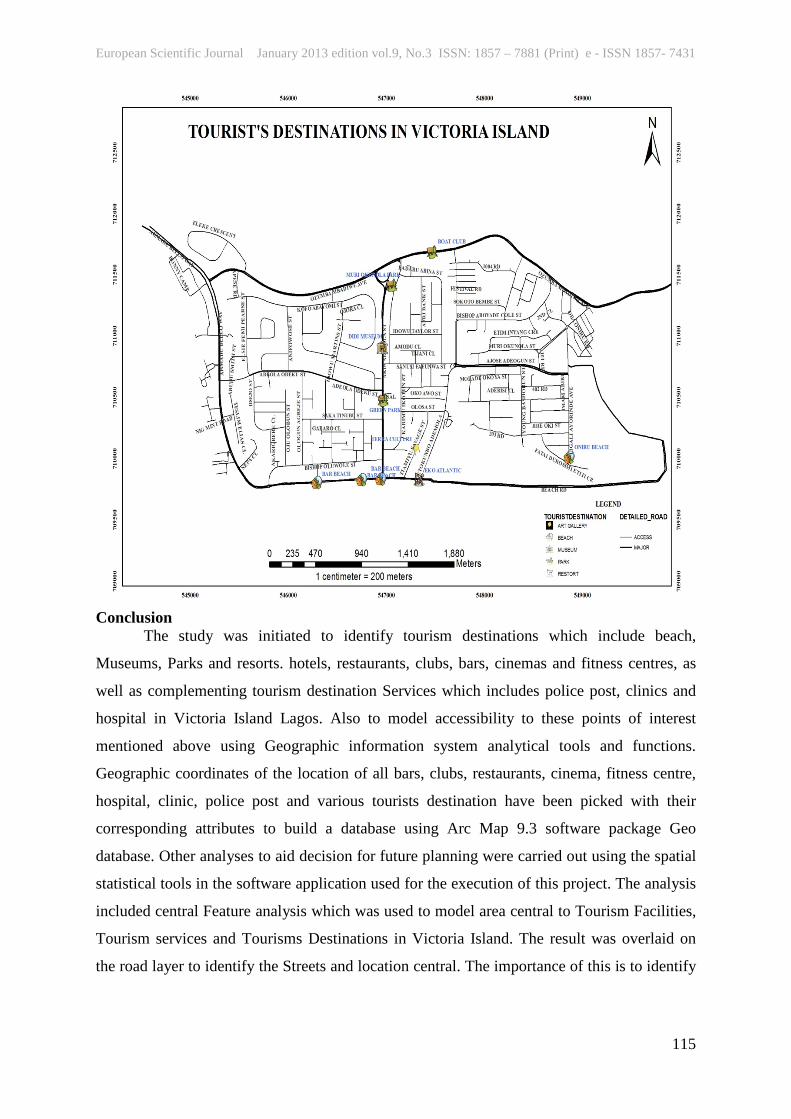
Conclusion
The study was initiated to identify tourism destinations which include beach,
Museums, Parks and resorts. hotels, restaurants, clubs, bars, cinemas and fitness centres, as
well as complementing tourism destination Services which includes police post, clinics and
hospital in Victoria Island Lagos. Also to model accessibility to these points of interest
mentioned above using Geographic information system analytical tools and functions.
Geographic coordinates of the location of all bars, clubs, restaurants, cinema, fitness centre,
hospital, clinic, police post and various tourists destination have been picked with their
corresponding attributes to build a database using Arc Map 9.3 software package Geo
database. Other analyses to aid decision for future planning were carried out using the spatial
statistical tools in the software application used for the execution of this project. The analysis
included central Feature analysis which was used to model area central to Tourism Facilities,
Tourism services and Tourisms Destinations in Victoria Island. The result was overlaid on
the road layer to identify the Streets and location central. The importance of this is to identify

European Scientific Journal January 2013 edition vol.9, No.3 ISSN: 1857 – 7881 (Print) e - ISSN 1857- 7431
116
central area where services such as a Fire station can be located for maximum coverage and
efficiency.
This research has been able to demonstrate the dynamic capabilities of Geographic
Information System application in Mapping, Analysis, and Modelling of Geographic
phenomenon. This tool will aid tourism planning authorities, tourists, and Government
Agencies to visualize, plan, and access various Tourists Destinations, Facilities and Services
in Victoria Island. It will enable Tourism authority plan for security, enable government
official have electronic record of the location and products offered by each Tourism
Destination, and Facilities such as hotels, restaurants, clubs, cinemas, fitness centre and bars
in Victoria Island and there by enable Tourists have an overview of Victoria Island as to the
Tourism resources and facilities it has to offer. This will also aid resident’s social night life
and will increase tourist’s ability to make choice using the network analyst function of
ArcGIS 9.3 application software which helps in ascertaining shortest route, nearest facilities
from their current location.
Recommendation Geographic Information System has proven to be useful in analysing scenarios and its
database capabilities has made it interactive to users. It enables all forms of queries and
manipulation to be made according to data stored in it. Applying it to tourism is beneficial, in
that it will enable informed decision making for tourists, tourism planning authorities and
government. In the course of the research observations were made and one of such is the fact
that there is no fire service station in Victoria Island considering the economic resource and
tourism resources it holds should in case of disaster associated with fire. Therefore, the use of
spatial statistical analyst deployed in Geographic Information System software application
can be used to site a fire station in locations that will be central and within 3-5 minutes drive
time around Victoria Island network is important. For other researcher’s that will undertake
this study, focus should be on the types of services Hotels, Restaurants, and Clubs offers in
terms of their opening hours, prices, and ratings in terms of their status. Then incorporate
such information to build the database and also develop customized application that can be
deployed via the web.
References:
Arrowsmith, C. & Ntuwah, W. (2002): “Mapping Potential for tourist Segments” Journal of
The Mapping Science institute, Vol 31, no 1, pp 55-61.
Chen, R.J.C (2007) “Geographic information System (GIS) application in retailtourism and

European Scientific Journal January 2013 edition vol.9, No.3 ISSN: 1857 – 7881 (Print) e - ISSN 1857- 7431
117
Teaching curriculum” Journal of Retailing and Consumer Service vol. 14, no. 4, pp. 289-295.
Dantata M.A.(2005): Introduction to Tourism in Nigeria. Abuja Trade post
Dickmann, F. (2005): “Effectiveness and Efficiency of tourism maps in the world wide Web
And then potential for mobile map services”, in Map-based Mobile services. Theories
methods and Implementations, L .Mes, A. Zipf, & T. Reichenbacher, eds, Springer. Berlin,
Heidelberg, pp. 45-56.
Elliot- White, M. & Finn, M. (1998): Growing in Sophistication: “The application of
Geographic Information System in post Modern Marketing” Journal of Travel and Tourism
Marketing, Vol. 7 no.1, pp. 65-84.
Erkin, E. & Usul, N. (2005):“Site Selection for New Tourism Types in Bodrum Pennisula”,
In Twenty- fifth Annual ESRI User Conference.- ESRI.
Farsari, y. & Pratocos, p. (2004): “GIS Application in Planning and management of Tourism”
In a companion to Tourism A.A Lew, C.M. Hall, & A.M. Williams eds., Blackwell
Publishing. Malden, Mass, pp. 596-607.
Jiang, B., and Yao, X., (2006) “LBS, Location-based Services and Geographic information
system in Perspective”, Comput Environ Urban Syst (2006),
doi:10.1016/j.compenvurbsys.2006.02.003
Johanness Luberichs (2009): “Geographic Information System and Tourist consumer
research” Faculty of Earth and life sciences vrije universiteit Amsterdam, email:
Johanness Luberichs (2009): “Geographic Information System supported segmentation study
of visitors to Majorca Island” Faculty of Earth and life sciences vrije universiteit Amsterdam,
email: [email protected] .
Kitiyar, P. & Datta, D. (2007): “Tourist Sites Need Attention in Maharashtra: Shore RS and
GIS – An Ultimate tool to Explore and develop Beaches as New Tourist Spots”, in Map
World forum.
Kumar, P. & Datta, D. (2007): “Finding Different Suitable Sites for specific Tourism Purpose
Using Geospatial Techniques”, in Map world forum.-.Larbig, C., Kampf, R, & Keller, F.
(2004): Graudundner destinationsbenchmarking. Der Einsatz eines Geographischen
informationsysytem (GIS) als Planungs- und managementnstrument in tourischen
Zielgebieten”, Tourismus Journal, Vol. 8, no.1 pp. 77-86.
Maguire, D.J. (2005): “Tools and Techniques: Introduction”, in GIS, Spatial Analysis and
Modelling, D.J. Maguire, M. Batts, & M.F. Goodchild, eds., ESRI Press. Redlands, pp 63-66.
McAdam, D. (1999). The value and scope of Geographical Information Systems in tourism

European Scientific Journal January 2013 edition vol.9, No.3 ISSN: 1857 – 7881 (Print) e - ISSN 1857- 7431
118
Management. Journal of Sustainable Tourism, 7, 77-92.
Mill, R. C. & Morrison, A. M. (1985). The Tourism System. An Introductory Text. London:
Prentice- Hall International.
Mitchell, A. (2005). The ESRI Guide to GIS Analysis. Volume 2: Spatial Measurement &
Statistics. (vols. 2) Redlands: ESRI Press.
Monmonier, M. (1996). Eins zu einer Million. Die Tricks und Lügen der Kartographen.
Basel, Boston, Berlin: Birkhäuser Verlag.
Myatt, G. J. (2007). Making Sense of Data. A Practical Guide to Exploratory Data Analysis
And Data Mining. Hoboken: John Wileys & Sons Inc.
O'Looney, J. (2004). GIS and Enlightened Location-Based Tourism: An Innovation Whose
Time Has Come. In The Twenty-Fourth Annual ESRI User Conference ESRI.
Omale, I. (2012). Problems of Social Science Research in Nigeria and Suggested Solutions
Keffi-Nigeria. Published by AMD design & communication. Osuala, E.C. (2005).
Introduction To Research Methodology.
Nigeria. Africana First Publishers Limited.
O'Sullivan, D. (2004). Too Much of the Wrong Kind of Data. Implications for the Practice of
Micro- Scale Spatial Modeling. In M.F.Goodchild & D. G. Janelle (Eds.), Spatially
Integrated Social Science (pp. 95-108). Oxford: Oxford University Press
O'Sullivan, D. & Unwin, D. J. (2003). Geographic Information Analysis. Hoboken, New
Jersey: John Wiley & Sons, Inc.
Openshaw.S. & Alvanides, S. (1996). Designing Zoning Systems for representation of socio-
Economic data. [On-line] Available: http://www.geog.leeds.ac.uk/software/zdes/. Retrieved
on Feb./19/2008.
Ord, J. K. & Getis, A. (1995). Local Spatial Autocorrelation Statistics: Distributional Issues
And Application. Geographical Analysis, 27, 287-306.
Richardo Cuberous, Caldera de Ugarte, etal, (1997) “An application of Geographic
Information Technologies’ for Tourism planning”, in Twentieth ESRI User Conference. -
ESRI
Verka Jovanovic (2008): “The application of Geographic information system and its
Components in Tourism” Yugoslav Journal of Operations Research Vol. 18 pp 261-272.


