The Synergies of Hedge Funds and Reinsurance
Eric Andersen
May 13th
, 2013
Advisor: Dwight Jaffee
Department of Economics
University of California, Berkeley

i
Acknowledgements
I would like to convey my sincerest gratitude to Dr. Dwight Jaffee, my advisor, whose support
and assistance were crucial to this project’s development and execution. I also want to thank
Angus Hildreth for providing critical feedback and insightful input on my statistical methods and
analyses. Credit goes to my Deutsche Bank colleagues for introducing me to and stoking my
curiosity in a truly fascinating, but infrequently studied, field. Lastly, I am thankful to the UC
Berkeley Department of Economics for providing me the opportunity to engage this project.

ii
Abstract
Bermuda-based alternative asset focused reinsurance has grown in popularity over the
last decade as a joint venture for hedge funds and insurers to pursue superior returns coupled
with insignificant increases in systematic risk. Seeking to provide permanent capital to hedge
funds and superlative investment returns to insurers, alternative asset focused reinsurers claim to
outpace traditional reinsurers by providing exceptional yields with little to no correlation risk.
Data examining stock price and asset returns of 33 reinsurers from 2000 through 2012 lends little
credence to support such claims. Rather, analyses show that, despite a positive relationship
between firms’ gross returns and alternative asset management domiciled in Bermuda, exposure
to alternative investments not only fails to mitigate market risk, but also may actually eliminate
any exceptional returns asset managers would have otherwise produced by maintaining a
traditional investment strategy.

iii
Table of Contents
Acknowledgements .......................................................................................................................... i
Abstract ........................................................................................................................................... ii
Table of Contents ........................................................................................................................... iii
Section I: Introduction ...................................................................................................................... 1
Section II: Industry Milieu ................................................................................................................ 4
Insurance ..................................................................................................................................... 4
Hedge Funds ............................................................................................................................... 5
Alternative Asset Focused Reinsurance ...................................................................................... 9
Section III: Methodology ................................................................................................................ 11
Data Sources ............................................................................................................................. 11
Models....................................................................................................................................... 12
Section IV: Results ......................................................................................................................... 16
Hypothesis 1.............................................................................................................................. 16
Hypotheses 2 and 3 ................................................................................................................... 18
Section V: Conclusion .................................................................................................................. 21
Section VI: Appendices ................................................................................................................ 23
Section VII: Bibliography ............................................................................................................. 29

1
Section I: Introduction
Traditional insurance industry pitches to institutional and retail investors frequently focus
on the low correlation of insurance returns with market returns. Over the last decade, Bermuda-
based reinsurance companies have trended toward partnering with alternative asset managers.
The relationship between the two is symbiotic: the reinsurance company gets access to top-tier,
high-yielding asset management and the hedge funds receive access to a permanent base of
capital. The interaction of hedge funds and reinsurers produces alternative asset focused
reinsurers, which provide their insurance operations as a stable platform that asset managers can
leverage to achieve large returns in non-traditional investments. Some investors protest that
alternative asset focused reinsurers provide returns less stable than those of insurers primarily
exposed to traditional stocks and bonds. To placate investor concerns, alternative asset focused
firms pitch that outsourcing the management of their investment portfolios to hedge fund
managers enable them to achieve high yield returns with limited correlation with the market.
However, the veracity of such claims is uncertain. Pitches reliant on scant data and generalist
language to support the logic of a “low beta, high alpha” investment thesis risk the trust,
goodwill, and support of institutional and retail investors. Until the conceptual foundation of
their investment theses can be backed by robust statistical analysis, alternative asset focused
reinsurers operating from any locality, Bermuda or otherwise, are effectively convincing
investors to trust hundreds of millions of dollars to that which amounts to untested hypotheses.
In this paper, I investigated those hypotheses as their authors present them and under
their authors’ framework of assumptions. Specifically, I aimed to test three hypotheses. The
first claim is that operating in Bermuda and investing in alternative assets are positively related
to reinsurers’ returns. Stated explicitly, hypothesis one is as follows:

2
Hypothesis 1: Ceteris paribus, reinsurers’ gross returns are the function of a positive
relationship with Bermuda incorporation, a positive relationship with exposure to
alternative asset investments, and a positive relationship with an interaction term.
The second claim posits that reinsurers that invest in alternative assets produce returns with less
market correlation risk1 than reinsurers that invest in stocks and bonds. The second hypothesis is
stated explicitly as follows:
Hypothesis 2: Ceteris paribus, reinsurers’ betas are negatively related to exposure to
alternative asset investments.
The third claim I investigated argues that reinsurers exposed to alternative asset investments
produce exceptional returns2 superior to those produced by reinsurers focused on traditional
equities and fixed income securities. I explicitly state the final hypothesis as the following:
Hypothesis 3: Ceteris paribus, reinsurers’ alphas are positively related to exposure to
alternative asset investments.
Using publicly-available equity prices and financial statements data to conduct a battery of
regression analyses on each hypothesis, I found mixed results. The data support hypothesis 1 by
showing alternative asset exposure in Bermuda may benefit firms’ returns. However, after
adjusting returns for risk, data show that alternative asset exposure aggravates returns’ market
correlation risk and hinders asset managers from producing alpha.
Before explaining my research methodology, I provide background on the financial
institutions examined in this paper. With a comprehensive understanding of the forces that shape
insurers and hedge fund managers, the motivations behind their venturing jointly into the
1 Correlation risk is measured by beta of the Black-Jensen (1972) Capital Asset Pricing Model (CAPM).
2 Exceptionality is measured by the Black-Jensen CAPM’s alpha coefficient.

3
alternative asset focused reinsurance space are apparent, and my analyses’ results can more
logically inform the implications of a potentially-faulty investment thesis.

4
Section II: Industry Milieu
Insurance
The insurance and reinsurance3 industry’s capital structure is unique compared to those of
other financial institutions. Specifically, insurance companies have two sources of leverage to
fund their operations and boost the returns of their investment portfolios: debt and float.
Although debt, typically acquired by issuing corporate bonds or by opening a revolving line of
credit, does not distinguish insurance financing from that of other industries, float is a feature
available only to insurers. Insurers operate on a collect-now, pay-later model: policy holders pay
insurers a set amount (i.e., a premium) at the beginning of the insurance contract period in
expectation that the insurers will cover policy holders’ unexpected losses and expenses as they
occur. During the period after insurance premiums are collected and before claims are paid, the
premium revenue an insurer holds is called “float” (Nissim, 2010). Insurers pay no interest to
policy holders in return for holding the float during this interim period. Any administrative costs
incurred holding the float are minimal. Insurers can, and do, add float to their investment
portfolios4, investing the float as they wish. By supplementing the assets that an insurer invests
while simultaneously remaining a liability to be paid out later, float acts like leverage. However,
float remains distinct from debt in that the former does not oblige the holder to pay interest to the
provider. In this respect, float is effectively, as Warren Buffet calls it, “free money,” leveraging
an investment portfolio without incurring any interest expense while it is used.
3 For the purposes of this paper, I grouped the insurance and reinsurance industries together and use the terms
“insurance” and “reinsurance” interchangeably. Although analyzing each industry would be interesting, such an
analysis lies outside the scope of this paper and is left open for future research endeavors. 4 The American insurance industry is regulated at the statewide level. Regulations on capital adequacy and capital
requirement vary state by state. Depending on locality, the amount of float an insurer must hold in reserve changes.
5
Hedge Funds
“Hedge fund”5 is a broadly defined term of varying meaning and no statutory definition.
Academic, regulatory, and industry literature provide more than a dozen different interpretations
on hedge fund structure, investment strategy, and regulatory schema.6 Agreed upon by most
sources, the term “hedge fund” describes an investment vehicle with set of common
characteristics. First, hedge funds are private investment partnerships that are generally not
available to retail investors. Hedge funds predominantly draw high net worth individuals,
pension funds, funds of hedge funds, and other institutional investors (Mirsky & Cowell, The
evolution of an industry: 2012 KPMG/AIMA Global Hedge Fund Survey, 2012). Most hedge
funds allow their investors to redeem their investments periodically while typically limiting
investors to a pre-determined number of redemptions per year (Ackermann, McEnally, &
Ravenscraft, 1999). Second, hedge funds are actively managed and compensate investment
managers predominantly on the basis of performance rather than solely as a fixed percentage of
assets under management (AUM). Third, hedge funds are secretive by nature and rely on light
regulatory burdens to avoid disclosing investment strategies. Fourth, hedge funds typically
supplement their traditional investment portfolios of stocks and fixed income maturities with
assets in non-traditional (i.e., alternative) investment classes (e.g., derivatives, credit swaps,
private equity, and others). In summary, hedge funds are performance fee based, actively
managed investment partnerships that are available to only sophisticated, exclusive investors
who maintain control over the deployment of their invested assets; take significant positions in
5 The term “hedge fund” and “alternative asset manager” are used interchangeably throughout this paper.
6 See (Ang, Gorovyy, & van Inwegen, 2011), (Mirsky & Cowell, The value of the hedge fund industry to investors,
markets, and the broader economy, 2012), (Lo, Risk Management for Hedge Funds: Introduction and Overview,
2001), and (Vaughan, 2003).

6
alternative asset investments; and face little regulatory pressures that force them to reveal their
proprietary investment models.
A characteristic particular to hedge funds is the tendency to invest in alternative assets as
well as traditional assets. “Alternative asset investments” is a catch-all concept that includes all
types of assets and investments that do not fall under the scope of traditional assets and
investments. Traditional assets conventionally include those in publicly-listed equity securities
(i.e., stocks, ETFs, mutual funds, and index funds) and fixed income securities. Traditional
assets share a set of common characteristics that distinguish them from alternative assets. First,
traditional assets are liquid; they can be easily converted to cash at any time (Tobin, 1958).
Second, they are transparent, and investors can easily perform due diligence at minimal cost and
effort (Robert W. Baird & Co, 2010). In other words, accurately assessing the values and risk of
traditional assets is simple and inexpensive. Third, they are not derivatives and do not derive
their values from the value of underlying assets (United States Treasury, 2013). Lastly,
investment opportunities in traditional assets are typically open to all classes of investors:
institutional, accredited, and non-accredited (Lerner, Schoar, & Wang, 2008).
In contrast, alternative assets include7 derivatives, such as options, futures, and credit
swaps; commodities; precious metals; real estate; and distressed debt as well as investments in
private equity, hedge funds, and venture capital. Compared to traditional assets, alternative
assets are typically less liquid than traditional investments. They require more time or are more
costly to liquidate, particularly under market conditions of economic stress (Robert W. Baird &
Co, 2010). Many alternative investment opportunities are exclusive, open only to a small class
of investors like major institutional investors and high net worth accredited investors. A popular
7 See (Robert W. Baird & Co, 2010), (Skidmore, 2010), (Collimore, 2013), (Lerner, Schoar, & Wang, 2008), and
(Lo, 2001).

7
outlet for portfolio diversification, alternative investments typically feature low correlation risk;
however, they also vary considerably in performance, according to Lerner (2008). While many
hedge fund managers are particularly adept at dealing with the benefits and costs of alternative
assets, all hedge fund managers face the risk of operating under an extraordinarily volatile
business model.
Although hedge funds are attractive investment vehicles that can take profitable
advantage of investment opportunities otherwise unavailable to the public at large, their business
model is fundamentally unstable, at risk of “blowing up” in any given market downturn. More
specifically, hedge fund instability is a function of the interacting effects of investor confidence
and redemption/liquidation risk (Taussig, 2010). When a given hedge fund produces low or
lower-than-expected returns, its investors feel compelled to redeem their investments. While
investor confidence poses comparatively little risk to traditional asset managers investing in
highly liquid traditional asset classes on behalf of a large base of non-accredited, accredited, and
institutional investors, investor redemptions create a burdensome cost for hedge fund managers
investing in illiquid alternative asset classes (Agarwal, Daniel, & Naik, 2009).8 At the onset of
the financial crisis in the latter half of 2008, a mass trend of investors redeeming their
investments cost global hedge fund industry to lose 25%9 of total AUM in less than six months.
High liquidation costs diminish hedge fund returns and, in turn, trigger a domino effect of further
redemptions, additional transaction costs, and continually shrinking returns. Overall, while the
hedge fund business model does well during periods of positive market conditions when hedge
funds can generate high returns, it is particularly susceptible to failure during market downturns
8 The OECD estimates hedge funds face transactions costs approximate to 25% of total investment return (Kelly,
2013). 9 The 25% reduction amounted to roughly $500 billion (Kelly, 2013).

8
when the low returns hedge funds produce are compounded by the high costs of liquidating
assets at the behest of investor redemptions.
To surmount the instability of the traditional hedge fund structure, alternative asset
managers pursue permanent capital bases which grow and shrink at predictable intervals which
investment managers can accommodate far easier than sudden investor flights. Most typical
consumer, financial, industrial, or technology companies that need access to permanent capital
can satisfy their capital needs by issuing equity on the stock market or acquire leverage, but
neither option provides an effective solution for hedge fund managers. In regard to the former,
while initial public offerings are a very effective way to access a broad base of permanent
capital, most stock exchanges and securities regulation authorities necessitate that publicly-listed
corporations adhered to strict financial disclosure requirements as well as a level of financial
transparency to which most alternative asset managers are averse (Taussig, 2010). In other
words, equity capital is incompatible with the secretive nature of the hedge fund industry which
relies maintaining proprietary investment strategies in order to edge out competitors. In regard
to the latter source of permanent capital, credit lines do not have strict public disclosure
requirements, magnify gains and losses, and are compatible with the needs of hedge funds.
Although debt leverage has been and continues to a be popular funding avenue for hedge fund
managers, the most recent financial crisis highlighted the risk management issues hedge funds
face in regard to deleveraging costs, particularly those incurred involuntarily (Dai & Sundaresan,
2012).10
Expected hedge fund performance heavily depends not only on the success of asset
management strategies but also on managers successfully handling credit line closures in the
10
Prime brokers contract to provide funding under the condition a hedge fund does not fall below a specified trigger,
typically connected to AUM or net asset value. If the trigger conditions are met, whether by fund underperformance
or mass investor redemptions, then the broker can terminate funding by closing the hedge fund’s line of credit.

9
event of underperformance or in the instance of mass redemptions. Involuntary deleveraging
costs, like investor redemptions, exacerbate the instability of the hedge fund business model.
Alternative Asset Focused Reinsurance
Fortunately, there exists a viable, stable base of permanent capital that suits hedge funds’
needs nearly perfectly: float. First, float is reliable. Policy holders are contractually obligated to
pay premiums at specified intervals or risk losing coverage, a prospect that compels policy
holders to pay premiums regardless of macroeconomic conditions. Second, changes in float are
predictable and can be hedged. Assuming the insurance team can accurately monitor the average
rate at which they are generating premiums and the average rate at which they pay claims and
expenses, then the asset management team can accurately gauge the rate at which they should
expect AUM to increase or decrease and can take hedging positions to protect the fund’s
performance. Third, float requires minimal disclosure. Compared to other public investment
vehicles, reinsurers, both traditional and alternative asset focused, are required to disclose very
little in terms of how they invest their assets. Even more, if a reinsurer contracts its asset
management to a hedge fund, the hedge fund is required to disclose no more information than it
would if it were investing solely the funds of high net worth individuals.
Both alternative asset managers and reinsurers are keenly aware of the opportunities the
other offers. Simply, the relationship between alternative asset managers and reinsurers is
symbiotic: alternative asset managers seek from reinsurers a safe, disclosure-minimizing
permanent base of capital, and reinsurers seek from hedge funds high returns with low
correlation risk (Davidoff, 2012). The relationship’s logical conclusion is alternative asset
focused reinsurers: firms that unite insurance and hedge fund teams to yield investment returns
superior to those of traditional reinsurers and less prone to collapse than traditional hedge funds.

10
Although the alternative asset focused reinsurance industry has grown more popular over the
past decade,11
it is not a new concept (The Insurance Insider, 2005). Berkshire Hathaway has
been perhaps the market’s most charismatic hedge fund-reinsurance hybrid since Warren Buffet
acquired control of it in 1964 (Taussig, 2010). Today’s alternative asset focused reinsurers flock
to Bermuda. In Bermuda, reinsurers are lightly regulated: they face low capital and capital
adequacy requirements; they are required to disclose next to nothing regarding their investment
activities; and, since Bermuda has a 0% corporate income tax rate, their earnings are not taxed
(KPMG International, 2013).
11
Of the 33 firms in my sample, seventeen of them are less than ten years old.

11
Section III: Methodology
Data Sources
The data in the paper focuses on quarterly and annual returns from the first quarter of
2000 through the fourth quarter of 2012 as well as asset allocations and firms’ countries of
incorporation. The primary data sources were Compustat,12
Morningstar, company 10K’s, and
the Federal Reserve Bank of St. Louis. Compustat provided total asset, net income, and stock
price data for the companies and index in my model. Morningstar provided asset allocation
figures for corporations that were active as of April 2013, but not on those that were acquired or
dissolved before Q4 of 2012.13
I collected asset allocation data on the remaining firms from their
most recent 10K reports. The Federal Reserve Bank of St. Louis provided the interest rates on
90 day Treasury Bonds, which I used as a proxy for the risk-free rate.
I composed my sample of 33 firms from a wide variety of publicly listed insurers.14
I
originally wanted to include private companies in my analysis since many private insurers in
Bermuda are closely involved with American hedge funds. However, given the secretive nature
of the private firms and lax reporting requirements, I decided to restrict my sample to public
companies after I found that collecting data on private firms was costly and inefficient and
frequently provided only unaudited financial data. While my sample is smaller than I prefer, I
hope that the data being publicly-available and transparent makes the data set both reliable and
independently verifiable.
12
Compustat access furnished by Wharton Research Data Services 13
Firms no longer operating under an active ticker symbol at the end of the last quarter included FSR, IPCR, ORH,
and TRH 14
A full list of ticker symbols and associated summary statistics are in Appendices A and B.

12
To measure returns, I analyzed two metrics: stock market price returns (ROR) and return
on assets (ROA).15
Although the former is the standard metric used in capital asset pricing
model analyses, I found the latter also interesting since it gauges a firm’s performance invariant
to its leverage. Throughout my paper, I will provide two sets of results: one calculated using
ROR and the other calculated using ROA.
Models
At its onset, analyzing the returns of Bermuda-based alternative asset focused reinsurers
faced many obstacles. The primary difficulty was separating the portion of each firm’s return
that was generated by alternative asset investments from the portion of return that was generated
by traditional investments. Publicly-available financial statements did not provide these data for
all 33 firms in my sample. Fortunately, percent exposure to alternative asset investments,
calculated as the percent of total assets invested in alternative asset investments, was available
via Morningstar as well as via each firm’s most recent 10K report. Rather than directly
evaluating firms based on the percent of total income generated by either investment class, I used
percent exposure16
as a proxy to evaluate the level to which a firm was “alternative asset
focused.” Using this process, I conducted two sets of linear regression tests.
The first set of analyses models each firm’s return as a function of Bermuda-based
operations,17
exposure to alternative asset investments, and an interaction term. This relationship
is tested as a cross-section across all the insurers. Formatted as an equation, Model 1 is as
follows:
( ) ( ) ( ) ( ) ( ) (1)
15
ROA equals net income divided by total assets. 16
I used percent exposure as calculated in each firm’s most recent 10K. 17
I assumed country of operation is the incorporation jurisdiction on the cover page of each firm’s most recent 10K.
13
In (1), is the average return for each insurer averaged from the year 2000 through 2012;
is a dummy variable that takes the value 1 for firms incorporated in Bermuda and 0
for those operating elsewhere, and is the percent of total assets invested in alternative
investments. To ascertain the total effect of Bermuda in Model 1, I took the discrete difference
of (1) with respect to 18 in the following:
( )
( ) (1a)
Also, to be thorough, I created two additional models, Model 2 and Model 3, which measured the
effect of Bermuda incorporation and exposure separately. They are as follows:
( ) ( ) (2)
( ) ( ) (3)
Worth noting is that Models 1, 2, and 3 measure reinsurers’ gross returns. Since the returns of
Models 1, 2, and 3 are not adjusted for market correlation risk, they must be considered with
regard to the second set of analyses.
The second set of analyses evaluated how insurers’ returns vary in risk and exceptionality
as a function of exposure to alternative assets. I tested risk and exceptionality separately as a two
part analysis. In the first step, I adopted the Black-Jensen capital asset pricing model (CAPM) to
measure beta and alpha of each firm. An adaptation of the original Sharpe-Lintner19
CAPM, the
Black-Fisher CAPM shows the expected return on the security i is a function of the expected
return the market portfolio M, the expected risk-free rate,20
and a constant:
18
I would like to note that taking the partial derivative with respect to a dummy variable like is
unorthodox since is not a continuous variable. The derivation in equation (1a) measures marginal effect
on the dependent variable for a discrete change in the dummy variable from 0 to 1. To distinguish this
differentiation from a traditional partial derivative, I denoted equation (1a) with rather than the canon . 19
The traditional CAPM was proposed separately by Sharpe (1964) and Lintner (1965) 20
As a proxy for the return of the market portfolio, I used the return of the Standard and Poor’s 500 Composite
Index; for the risk-free rate, the return on 90 Day United States Treasury Bills.

14
( ) ( ) ( ( ) ( )) (4)
To evaluate systematic risk of the security i with the market portfolio, I rearranged equation (4):
( ) ( ) ( ( ) ( )) (5)
I estimated the alpha and beta coefficients for each of the 33 insurers based on time series
regressions over the full sample from the year 2000 through the year 2012. The original Sharpe-
Lintner CAPM equation assumes the strong-form efficient markets hypothesis which, by
assuming securities are fairly priced, effectively denies asset managers the ability to generate
alpha (i.e., alpha strictly assumed to be zero) (Fama, 1970). Jensen (1968) proposes and Black,
Jensen, & Scholes (1972) confirm that relaxing Fama’s efficient markets assumption, inherent in
the Sharpe-Lintner CAPM, more accurately models risk adjusted returns for both individual
firms and multi-security portfolios. By relaxing this assumption and permitting for a non-zero
alpha, Lo (2004) posits that CAPM more accurately evaluates the performance of alternative
asset managers. Considering that alternative investments, by definition, execute in market
conditions fundamentally dissimilar to those of the fixed income and equity markets (e.g.,
limited liquidity, costly investor due diligence, and/or exclusive investor bases), assuming the
strong-form efficient markets hypothesis makes the Sharpe-Lintner CAPM ill-suited to evaluate
hypothesis 3. The Black-Jensen CAPM does not require the assumption that all investors are
rational and acknowledges the potential for exceptional returns beyond those predicted by a
given level of risk. In effect, using the Black-Jensen CAPM lets my analysis consider insurers’
returns after accepting alternative asset managers’ claims to produce exceptional returns as
given.21
21
In Appendix E, I also provide the results for hypothesis 2 assuming the efficient markets hypothesis. Comparing
to Appendix E to Table 2, the Sharpe-Lintner results effectively mirror the Black-Jensen results.

15
In a second stage regression analysis, I separately regressed each firm’s betas and each
firm’s alpha, which were estimated in the time series regression (5), against the firm’s percent
exposure to alternative asset investments:
( ) (6)
( ) (7)
With these final two equations, I evaluated hypotheses 2 and 3.

16
Section IV: Results
Hypothesis 1
Table 122
Table 1 provides the regression estimates and matching notation for equations (1), (2),
and (3) under Models 1, 2, and 3, respectively. Analyzing each firm’s returns averaged over the
years 2000 through 2012, I considered monthly (N = 156), quarterly (N = 52), and annual (N =
13) ROR data. Unfortunately, monthly ROA data was not available, so I analyzed only quarterly
and annual ROA.
At first glance, ROR data appears mostly insignificant; however, by interpreting the
results of ROA data, I hope to offer insight that suggests there may be more to the price return
data than meets the eye. In Table 1, we observe for Model 1 (i.e., equation (1)) that annual ROA
is higher ( = 0.056, p = 0.11123
) for Bermuda-based reinsurers exposed to alternative assets than
for traditional, non-Bermudan reinsurers. In equation (1a), by taking the discrete difference of
Model 1 with respect to we observe the cumulative effect of operating in Bermuda is
positive for any firm with greater than zero percent exposure to alternatives ( = -0.002, =
0.056).
Considering Model 2 (i.e., equation (2)) in Table 1, we recognize that operating in
Bermuda exhibits a positive relationship with both annual ( = 0.012, p = 0.035) and quarterly
22
P-values less than 0.20 and greater than 0.10 (i.e., 0.10 < p < 0.20) are highlighted yellow, those less than 0.10
and greater than 0.05 (i.e., 0.05 < p < 0.10) are highlighted orange, and those less than 0.05 (i.e., p < 0.05) are
highlighted red. 23
= -0.002, p = 0.855; = -0.027, p = 0.129
ω p-value τ p-value ϴ p-value R2 ω 1 p-value R
2 τ 1 p-value R2
ROR Month -0.003 0.820 0.023 0.337 -0.025 0.606 0.092 -0.010 0.162 0.062 0.024 0.223 0.047
ROR Quarter -0.034 0.671 0.088 0.548 -0.100 0.731 0.075 -0.063 0.160 0.063 0.110 0.359 0.027
ROR Annual -0.203 0.612 0.375 0.609 1.748 0.235 0.102 0.081 0.729 0.004 0.668 0.270 0.039
ROA Quarter 0.002 0.515 -0.006 0.175 0.008 0.362 0.254 0.004 0.009 0.202 -0.007 0.084 0.093
ROA Annual -0.002 0.855 -0.027 0.129 0.056 0.111 0.226 0.012 0.035 0.135 -0.021 0.163 0.062
Return Type
Model 3Model 1 Model 2

17
( = 0.004, p = 0.009) ROA; however, the results of Model 1 show Model 2’s relationship is
overstated. The regression coefficient on in Model 2 disappears in Model 1, which
demonstrates that Model 2 fails to account for the correlation between and .
In short, the results suggest for firms seeking higher ROA that while operating from Bermuda is
beneficial, operating in Bermuda and investing in alternative assets is even more productive. In
Model 3 on both an annual ( = -0.021, p = 0.163) and a quarterly ( = -0.007, p = 0.084) basis,
we observe a negative relationship between and ROA, which, considered with regard
to Model 1, suggests that firms seeking alternative asset exposure are rewarded only when doing
so from a base of operations in Bermuda.
After considering the observed relationships in ROA data, we realize that the ROR
regression estimates in Table 1 may offer a more compelling story regarding the relationship
between ROR and the independent variables in Models 1, 2, and 3 than their respective p-values
suggest. Unfortunately, the small sample size (N = 33) provides to the price returns regressions
insufficient statistical power to yield significant results. Avoiding the urge to assume for ROR
the relationships we observed for ROA, we consider in Table 1 only the ROR regression
estimates with statistically significant p-values. Equation 2 (i.e., Model 2 in Table 1) hints at a
negative relationship between and ROR on a monthly ( = -0.010, p = 0.162) and a
quarterly ( = -0.063, p = 0.160) basis; but the data’s collinear nature, which I inferred from the
ROA analyses, robs Model 1 of sufficient statistical power to observe any interaction effect of
and . As a result, despite the temptation to infer the interaction effect on
ROR from the observed effect on ROA, the ROR analyses provide unsatisfying results that only
show a tendency for investors to dislike reinsurers operating in Bermuda, regardless of
alternative asset exposure.

18
In regard to hypothesis 1, the cross-section analyses tell two stories: one about firms’
performance and one about how investors receive that performance. The first story, drawn from
the ROA analyses, confirms hypothesis 1: reinsurers generate higher gross returns while
operating in Bermuda with alternative asset exposure. Although firms operating in Bermuda
generally observe higher net incomes, a fact potentially the result of Bermuda’s non-existent
corporate tax rate, those also exposed to alternative assets see net incomes even greater.
However, the second story shows that equity investors are not impressed: although Bermudan
insurers can achieve higher ROA with more exposure to alternative assets, their stock trades at a
discount relative to the stock of insurers based elsewhere. Explanation for the observed
relationships estimated in Table 1 may be offered in Table 2, to which we now turn, and the
ensuing analyses of hypotheses 2 and 3.
Hypotheses 2 and 3
Table 224
*25
24
P-values less than 0.20 and greater than 0.10 (i.e., 0.10 < p < 0.20) are highlighted yellow, those less than 0.10
and greater than 0.05 (i.e., 0.05 < p < 0.10) are highlighted orange, and those less than 0.05 (i.e., p < 0.05) are
highlighted red. 25
As significance requirements increase, sample size decreases. Empty boxes indicate a sample size too small to
compute regression coefficients. Since statistically significant regression estimates for alpha were too few in
DV γ 1 p-value γ 0 p-value R2 γ 1 p-value γ 0 p-value R
2
ROR Annual β 0.618 0.763 1.189 0.071 0.003 0.373 0.426 0.753 0.000 0.054
ROR Quarter β 1.463 0.538 0.875 0.243 0.012 0.925 0.021 0.650 0.000 0.211
ROA Annual β -1.174 0.147 1.422 0.000 0.067 -0.625 0.153 1.304 0.000 0.150
ROA Quarter β -0.966 0.366 1.082 0.003 0.026 -0.226 0.613 1.121 0.000 0.019
DV ϕ 1 p-value ϕ 0 p-value R2 ϕ 1 p-value ϕ 0 p-value R
2
ROR Annual α 0.755 0.209 0.028 0.881 0.050 -* - - - -
ROR Quarter α 0.115 0.348 0.019 0.614 0.028 - - - - -
ROA Annual α -0.021 0.223 0.009 0.099 0.048 -0.029 0.277 0.011 0.320 0.117
ROA Quarter α -0.006 0.268 0.004 0.016 0.039 -0.016 0.149 0.006 0.068 0.142
Significance Level All p-values p-value < 0.05
Return Type
Return Type

19
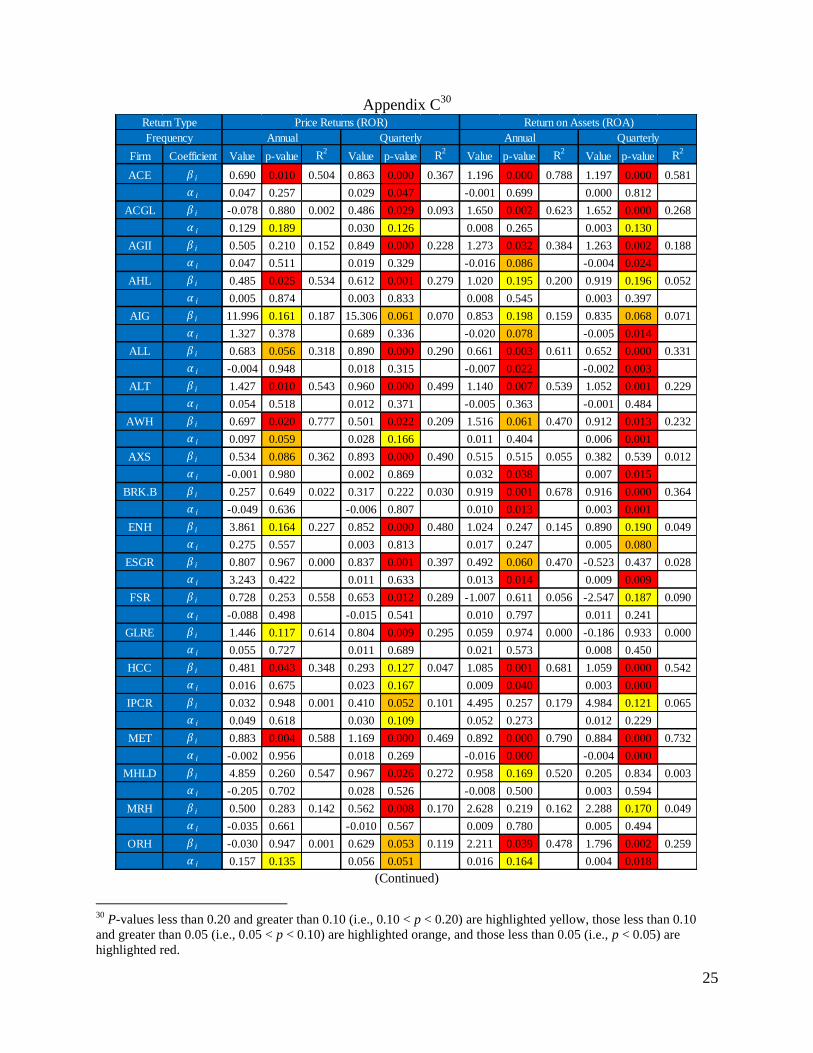
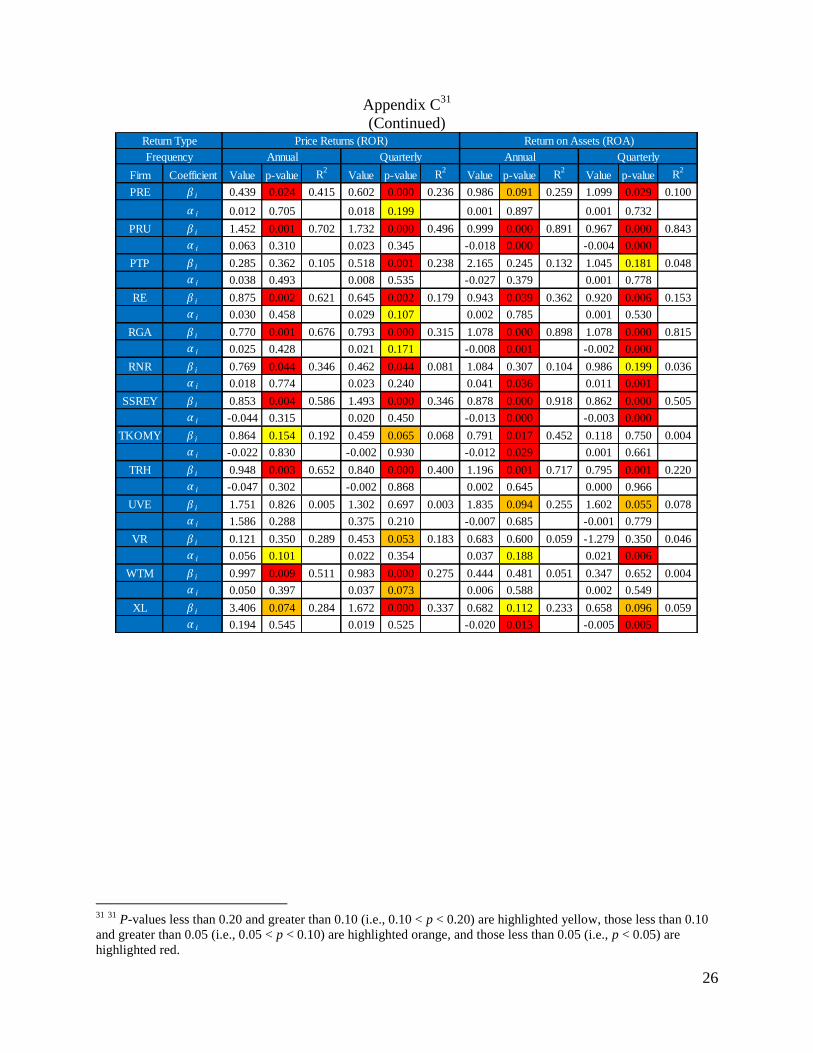
Table 2 provides the regression estimates and matching notation for equations (6) and (7).
My regression analyzed the determinants of each firm’s betas and alphas26
in terms of alternative
asset exposure. The regression of equation (6) estimated the relationship between beta and
alternative asset exposure, and the regression of equation (7) estimated the relationship between
alpha and alternative asset exposure.
Table 2 presents the regression results of the Black-Jensen CAPM coefficients according
to increasing sampling frequency (i.e., by year and by quarter). In other words, the “annual”
rows contain the observed relationship between a CAPM coefficient (i.e., either beta or alpha),
calculated using annual returns, and alternative asset exposure. The “quarter” rows contain the
observed relationship between a CAPM coefficient (i.e., either beta or alpha), calculated using
annual returns, and alternative asset exposure.
In stark contrast to hypothesis 2, alternative asset exposure does not mitigate the riskiness
of stock price returns; rather, increasing exposure to alternative assets increases a reinsurance
stock’s market correlation risk. Considering only ROR betas with p-values less than 0.05, there
is a significant, positive relationship ( = 0.925, p = 0.021, N = 25) between quarterly ROR
market correlation risk and exposure to alternative assets. Although the relationship falls in
significance when I expand the sample to include betas of all p-values (N = 33), its magnitude
grows. In short, alternative asset exposure increases the riskiness of a firm’s stock price returns,
a fact which makes the regression results of Model 1 (i.e., equation (1)) much less impressive.
ROA data tells a different, but equally disappointing story. First, there is no evidence of
alternative asset exposure mitigating ROA risk on a quarterly level, and there is only a vestige of
number to analyze, I decided to avoid speculating on their relationship with exposure and did not discuss them in
this paper. 26
See Appendix C for a full list of each firm’s Black-Jensen CAPM coefficients estimated by equation (5).

20
risk mitigation effect on annual betas. Both when restricting the sample to only annual betas
with p-values less than 0.05 ( = -0.625, p = 0.021, R2 = 0.150, N = 15) and when considering
the entire sample of 33 firms ( = -1.174, p = 0.174, R2 = 0.067), alternative asset exposure
exhibits only a marginally significant, negative relationship that explains only a small portion of
the variation observed in beta.27
Second, the data suggest that any alpha a reinsurer may be able
to generate is quickly eliminated as insurers increase their exposure to alternative assets.
Restricting the sample to only quarterly alphas significant at the 0.05 level, we observe a
negative relationship ( = -0.016, p = 0.149; = 0.006, p = 0.068; N = 16). We observe the
same relationship ( = -0.006, p = 0.268; = 0.004, p = 0.016), albeit with lesser statistical
significance, when we consider all alphas. Tackling both hypotheses 2 and 3 together, the ROA
data explain that alternative asset exposure not only has little to no effect on mitigating riskiness,
but also eliminates any exceptional returns that asset managers produce.
27
The regression results in Appendix E used the estimated Sharpe-Lintner CAPM regression coefficients, listed for
each firm in Appendix D, and show that the observed Black-Jensen CAPM relationships in equation (6), both for
price return and ROA, hold when we assume the efficient markets hypothesis inherent in the Sharpe-Lintner CAPM.
21
Section V: Conclusion
In short, given the data, alternative asset focused reinsurers’ claims to generate superior
returns with little additional correlation risk have yet to be realized. Although there may be
some truth to producing greater ROA by investing in alternatives and operating out of Bermuda,
adjusting those returns for correlation risk highlights that those greater returns are neither
exceptional beyond those produced by traditional reinsurers nor worth the additional risk they
incur. Equity returns are also disappointing: Bermudan reinsurers are penalized for their country
of operation, and their returns grow more risky as alternative asset exposure increases. Stopping
short of labeling alternative asset reinsurers’ claims as disproven, I propose that there is
insufficient data to support their hypotheses. In fact, I wish to clarify further on why my analysis
is not the death knell of Bermuda-based alternative asset focused reinsurance.
Although the data analyses do not speak well of non-traditional reinsurers, they focus on
a relatively immature industry over an extraordinarily difficult period of time. The insurance
industry was particularly hard hit during the 2008 financial crisis which witnessed giants, like
AIG, previously considered too-big-to-fail nearing collapse. Apart from causing
uncharacteristically large swings in equity prices and net income figures reflected in my data set,
the numerous financial crises28
throughout my time period instigated unprecedented changes in
the benchmark and risk-free rates that played key roles in my analyses. In other words, the
alternative asset focused reinsurance space warrants reexamination in the future within the scope
of a longer sampling period, when the major effects of one-time events will wield less undue
influence on the sample. Ideally, this future data set will yield results of greater statistical power
that can either corroborate or refute my findings from the current data set.
28
Crises include the dot-com bust, the Great Recession, and the ongoing European debt crisis.

22
There exist additional, very interesting factors that can supplement future research efforts
but were not analyzed in the course of my paper. First, differentiating between property and
casualty (i.e., P&C) insurance and catastrophe (i.e., CAT) insurance would provide insight on the
role business lines play with generating float and the resulting effect on the efficacy of
alternative asset management. P&C insurance pays less expensive claims on a more frequent
basis to a larger base of policyholders relative to CAT insurance. In effect, P&C float has a
shorter lifespan than CAT float but is generated at a faster rate and may be substantially more
dependable and stable. Studying the implications for alternative asset managers would yield
informative results. Second, future research should examine how the effects of alternative asset
exposure vary across the reinsurance and insurance industries. Although I grouped the industries
together for the sake of simplicity, splitting and analyzing the data between the less risk-prone
reinsurance and more risk-prone insurance industries may yield a more satisfying data set.
Lastly, including private reinsurers in the sample would provide additional statistical power to
ROA data. Unfortunately, collecting data on private firms, both those based in Bermuda and
those based elsewhere, is an elusive goal29
which requires to achieve more sources than I have
currently have at my disposal. With these considerations, I eagerly await further contributions to
such an exciting field of research.
29
Also, private data should be considered with caution as it may be less reliable if it has not been thoroughly audited
and verified by an independent source.

23
Section VI: Appendices Appendix A
*Note: For illustrative purposes, I averaged the annualized return for 90 day Treasury Bills
quoted on a quarterly basis. However, regressions were calculated using listwise elimination, so
only the annualized return quoted on an annual basis was factored into the regression.
Return Type
Frequency
Firm Mean Std Deviation N Mean Std Deviation N
Rf 0.020 0.019 52* 0.004 0.004 52
RM 0.035 0.191 13 0.008 0.089 52
ACE 0.069 0.186 12 0.033 0.129 51
ACGL 0.143 0.307 12 0.034 0.143 51
AGII 0.067 0.254 12 0.023 0.160 51
AHL 0.035 0.115 9 0.011 0.098 35
AIG 1.462 5.261 12 0.676 5.196 51
ALL 0.018 0.232 12 0.021 0.149 51
ALTE 0.104 0.370 11 0.022 0.120 45
AWH 0.116 0.172 6 0.033 0.108 25
AXS 0.030 0.159 9 0.014 0.108 37
BRK.B -0.031 0.338 12 -0.002 0.164 51
ENH 0.488 1.450 10 0.018 0.104 39
ESGR 3.263 7.912 6 0.016 0.136 23
FSR -0.092 0.264 4 -0.013 0.130 21
GLRE 0.087 0.448 5 0.014 0.154 22
HCC 0.036 0.150 12 0.027 0.122 51
IPCR 0.070 0.230 8 0.031 0.117 38
MET 0.022 0.226 12 0.022 0.155 50
MHLD 0.394 0.630 4 0.040 0.207 18
MRH 0.006 0.227 10 0.001 0.113 40
ORH 0.181 0.210 7 0.061 0.164 32
PRE 0.031 0.131 12 0.021 0.112 51
PRU 0.113 0.337 11 0.036 0.221 43
PTP 0.068 0.153 10 0.018 0.089 40
RE 0.054 0.209 12 0.032 0.137 51
RGA 0.048 0.179 12 0.024 0.127 51
RNR 0.041 0.249 12 0.027 0.146 51
SSREY -0.020 0.212 12 0.022 0.228 51
TKOMY 0.001 0.369 12 0.002 0.158 51
TRH -0.032 0.228 11 0.001 0.122 48
UVE 1.619 4.684 12 0.378 2.090 51
VR 0.060 0.055 5 0.023 0.113 21
WTM 0.075 0.262 12 0.040 0.169 51
XL 0.244 1.207 12 0.021 0.258 51
Price Returns (ROR)
Annual Quarterly

24
Appendix B
*Note: For illustrative purposes, I averaged the annualized return for 90 day Treasury Bills
quoted on a quarterly basis. However, regressions were calculated using listwise elimination, so
only the annualized return quoted on an annual basis was factored into the regression.
Return Type
Frequency
Firm Mean Std Deviation N Mean Std Deviation N
Rf 0.020 0.019 52* 0.004 0.004 52
RM 0.022 0.008 12 0.005 0.002 48
ACE 0.022 0.013 13 0.006 0.005 51
ACGL 0.032 0.023 13 0.009 0.011 51
AGII 0.007 0.027 13 0.002 0.010 51
AHL 0.030 0.034 10 0.008 0.016 38
AIG 0.005 0.039 13 0.001 0.013 52
ALL 0.014 0.012 13 0.004 0.004 51
ALTE 0.017 0.020 13 0.005 0.008 47
AWH 0.038 0.030 8 0.012 0.008 30
AXS 0.051 0.034 10 0.011 0.014 38
BRK.B 0.032 0.012 13 0.008 0.005 51
ENH 0.038 0.040 11 0.010 0.015 41
ESGR 0.034 0.016 8 0.010 0.013 28
FSR 0.020 0.093 7 0.004 0.029 24
GLRE 0.038 0.085 7 0.010 0.036 25
HCC 0.032 0.011 13 0.008 0.004 51
IPCR 0.055 0.118 9 0.013 0.057 38
MET 0.006 0.004 13 0.001 0.002 51
MHLD 0.013 0.010 5 0.004 0.008 20
MRH 0.039 0.100 11 0.012 0.039 44
ORH 0.031 0.025 10 0.008 0.009 36
PRE 0.025 0.028 13 0.007 0.013 51
PRU 0.004 0.003 13 0.001 0.001 46
PTP 0.002 0.095 13 0.007 0.019 42
RE 0.025 0.021 13 0.007 0.009 51
RGA 0.014 0.004 13 0.004 0.002 51
RNR 0.064 0.051 13 0.016 0.020 51
SSREY 0.009 0.008 13 0.002 0.004 36
TKOMY 0.010 0.009 12 0.004 0.007 30
TRH 0.023 0.013 11 0.005 0.006 48
UVE 0.018 0.053 13 0.005 0.022 51
VR 0.058 0.054 7 0.017 0.021 25
WTM 0.029 0.038 13 0.007 0.021 51
XL 0.001 0.024 13 0.001 0.011 51
Return on Assets (ROA)
Annual Quarterly
25
Appendix C30
(Continued)
30
P-values less than 0.20 and greater than 0.10 (i.e., 0.10 < p < 0.20) are highlighted yellow, those less than 0.10
and greater than 0.05 (i.e., 0.05 < p < 0.10) are highlighted orange, and those less than 0.05 (i.e., p < 0.05) are
highlighted red.
Firm Coefficient Value p-value R2
Value p-value R2
Value p-value R2
Value p-value R2
ACE β i 0.690 0.010 0.504 0.863 0.000 0.367 1.196 0.000 0.788 1.197 0.000 0.581
α i 0.047 0.257 0.029 0.047 -0.001 0.699 0.000 0.812
ACGL β i -0.078 0.880 0.002 0.486 0.029 0.093 1.650 0.002 0.623 1.652 0.000 0.268
α i 0.129 0.189 0.030 0.126 0.008 0.265 0.003 0.130
AGII β i 0.505 0.210 0.152 0.849 0.000 0.228 1.273 0.032 0.384 1.263 0.002 0.188
α i 0.047 0.511 0.019 0.329 -0.016 0.086 -0.004 0.024
AHL β i 0.485 0.025 0.534 0.612 0.001 0.279 1.020 0.195 0.200 0.919 0.196 0.052
α i 0.005 0.874 0.003 0.833 0.008 0.545 0.003 0.397
AIG β i 11.996 0.161 0.187 15.306 0.061 0.070 0.853 0.198 0.159 0.835 0.068 0.071
α i 1.327 0.378 0.689 0.336 -0.020 0.078 -0.005 0.014
ALL β i 0.683 0.056 0.318 0.890 0.000 0.290 0.661 0.003 0.611 0.652 0.000 0.331
α i -0.004 0.948 0.018 0.315 -0.007 0.022 -0.002 0.003
ALT β i 1.427 0.010 0.543 0.960 0.000 0.499 1.140 0.007 0.539 1.052 0.001 0.229
α i 0.054 0.518 0.012 0.371 -0.005 0.363 -0.001 0.484
AWH β i 0.697 0.020 0.777 0.501 0.022 0.209 1.516 0.061 0.470 0.912 0.013 0.232
α i 0.097 0.059 0.028 0.166 0.011 0.404 0.006 0.001
AXS β i 0.534 0.086 0.362 0.893 0.000 0.490 0.515 0.515 0.055 0.382 0.539 0.012
α i -0.001 0.980 0.002 0.869 0.032 0.038 0.007 0.015
BRK.B β i 0.257 0.649 0.022 0.317 0.222 0.030 0.919 0.001 0.678 0.916 0.000 0.364
α i -0.049 0.636 -0.006 0.807 0.010 0.013 0.003 0.001
ENH β i 3.861 0.164 0.227 0.852 0.000 0.480 1.024 0.247 0.145 0.890 0.190 0.049
α i 0.275 0.557 0.003 0.813 0.017 0.247 0.005 0.080
ESGR β i 0.807 0.967 0.000 0.837 0.001 0.397 0.492 0.060 0.470 -0.523 0.437 0.028
α i 3.243 0.422 0.011 0.633 0.013 0.014 0.009 0.009
FSR β i 0.728 0.253 0.558 0.653 0.012 0.289 -1.007 0.611 0.056 -2.547 0.187 0.090
α i -0.088 0.498 -0.015 0.541 0.010 0.797 0.011 0.241
GLRE β i 1.446 0.117 0.614 0.804 0.009 0.295 0.059 0.974 0.000 -0.186 0.933 0.000
α i 0.055 0.727 0.011 0.689 0.021 0.573 0.008 0.450
HCC β i 0.481 0.043 0.348 0.293 0.127 0.047 1.085 0.001 0.681 1.059 0.000 0.542
α i 0.016 0.675 0.023 0.167 0.009 0.040 0.003 0.000
IPCR β i 0.032 0.948 0.001 0.410 0.052 0.101 4.495 0.257 0.179 4.984 0.121 0.065
α i 0.049 0.618 0.030 0.109 0.052 0.273 0.012 0.229
MET β i 0.883 0.004 0.588 1.169 0.000 0.469 0.892 0.000 0.790 0.884 0.000 0.732
α i -0.002 0.956 0.018 0.269 -0.016 0.000 -0.004 0.000
MHLD β i 4.859 0.260 0.547 0.967 0.026 0.272 0.958 0.169 0.520 0.205 0.834 0.003
α i -0.205 0.702 0.028 0.526 -0.008 0.500 0.003 0.594
MRH β i 0.500 0.283 0.142 0.562 0.008 0.170 2.628 0.219 0.162 2.288 0.170 0.049
α i -0.035 0.661 -0.010 0.567 0.009 0.780 0.005 0.494
ORH β i -0.030 0.947 0.001 0.629 0.053 0.119 2.211 0.039 0.478 1.796 0.002 0.259
α i 0.157 0.135 0.056 0.051 0.016 0.164 0.004 0.018
Return Type
Frequency Annual Quarterly
Price Returns (ROR)
Annual Quarterly
Return on Assets (ROA)
26
Appendix C31
(Continued)
31
31
P-values less than 0.20 and greater than 0.10 (i.e., 0.10 < p < 0.20) are highlighted yellow, those less than 0.10
and greater than 0.05 (i.e., 0.05 < p < 0.10) are highlighted orange, and those less than 0.05 (i.e., p < 0.05) are
highlighted red.
Firm Coefficient Value p-value R2
Value p-value R2
Value p-value R2
Value p-value R2
PRE β i 0.439 0.024 0.415 0.602 0.000 0.236 0.986 0.091 0.259 1.099 0.029 0.100
α i 0.012 0.705 0.018 0.199 0.001 0.897 0.001 0.732
PRU β i 1.452 0.001 0.702 1.732 0.000 0.496 0.999 0.000 0.891 0.967 0.000 0.843
α i 0.063 0.310 0.023 0.345 -0.018 0.000 -0.004 0.000
PTP β i 0.285 0.362 0.105 0.518 0.001 0.238 2.165 0.245 0.132 1.045 0.181 0.048
α i 0.038 0.493 0.008 0.535 -0.027 0.379 0.001 0.778
RE β i 0.875 0.002 0.621 0.645 0.002 0.179 0.943 0.039 0.362 0.920 0.006 0.153
α i 0.030 0.458 0.029 0.107 0.002 0.785 0.001 0.530
RGA β i 0.770 0.001 0.676 0.793 0.000 0.315 1.078 0.000 0.898 1.078 0.000 0.815
α i 0.025 0.428 0.021 0.171 -0.008 0.001 -0.002 0.000
RNR β i 0.769 0.044 0.346 0.462 0.044 0.081 1.084 0.307 0.104 0.986 0.199 0.036
α i 0.018 0.774 0.023 0.240 0.041 0.036 0.011 0.001
SSREY β i 0.853 0.004 0.586 1.493 0.000 0.346 0.878 0.000 0.918 0.862 0.000 0.505
α i -0.044 0.315 0.020 0.450 -0.013 0.000 -0.003 0.000
TKOMY β i 0.864 0.154 0.192 0.459 0.065 0.068 0.791 0.017 0.452 0.118 0.750 0.004
α i -0.022 0.830 -0.002 0.930 -0.012 0.029 0.001 0.661
TRH β i 0.948 0.003 0.652 0.840 0.000 0.400 1.196 0.001 0.717 0.795 0.001 0.220
α i -0.047 0.302 -0.002 0.868 0.002 0.645 0.000 0.966
UVE β i 1.751 0.826 0.005 1.302 0.697 0.003 1.835 0.094 0.255 1.602 0.055 0.078
α i 1.586 0.288 0.375 0.210 -0.007 0.685 -0.001 0.779
VR β i 0.121 0.350 0.289 0.453 0.053 0.183 0.683 0.600 0.059 -1.279 0.350 0.046
α i 0.056 0.101 0.022 0.354 0.037 0.188 0.021 0.006
WTM β i 0.997 0.009 0.511 0.983 0.000 0.275 0.444 0.481 0.051 0.347 0.652 0.004
α i 0.050 0.397 0.037 0.073 0.006 0.588 0.002 0.549
XL β i 3.406 0.074 0.284 1.672 0.000 0.337 0.682 0.112 0.233 0.658 0.096 0.059
α i 0.194 0.545 0.019 0.525 -0.020 0.013 -0.005 0.005
Return Type
Frequency Annual Quarterly
Price Returns (ROR)
Annual Quarterly
Return on Assets (ROA)

27
Appendix D32
32
32
P-values less than 0.20 and greater than 0.10 (i.e., 0.10 < p < 0.20) are highlighted yellow, those less than 0.10
and greater than 0.05 (i.e., 0.05 < p < 0.10) are highlighted orange, and those less than 0.05 (i.e., p < 0.05) are
highlighted red.
Firm Coefficient Value p-value R2
Value p-value R2
Value p-value R2
Value p-value R2
ACE β i 0.704 0.009 0.482 0.859 0.000 0.346 1.184 0.000 0.786 1.191 0.000 0.586
ACGL β i -0.039 0.942 0.001 0.482 0.033 0.088 1.729 0.001 0.621 1.758 0.000 0.289
AGII β i 0.519 0.185 0.154 0.846 0.000 0.224 1.113 0.072 0.264 1.108 0.008 0.141
AHL β i 0.490 0.015 0.546 0.615 0.001 0.281 1.173 0.107 0.263 1.132 0.090 0.085
AIG β i 12.394 0.143 0.185 15.204 0.063 0.068 0.652 0.362 0.076 0.640 0.176 0.039
ALL β i 0.682 0.045 0.318 0.888 0.000 0.284 0.587 0.016 0.424 0.578 0.000 0.248
ALT β i 1.465 0.006 0.549 0.971 0.000 0.502 1.087 0.007 0.500 0.994 0.001 0.221
AWH β i 0.746 0.041 0.598 0.519 0.020 0.207 1.707 0.027 0.525 1.513 0.000 0.397
AXS β i 0.533 0.063 0.368 0.896 0.000 0.495 1.149 0.230 0.155 0.906 0.157 0.060
BRK.B β i 0.243 0.654 0.019 0.318 0.216 0.030 1.018 0.002 0.584 1.027 0.000 0.365
ENH β i 4.307 0.098 0.275 0.858 0.000 0.489 1.328 0.132 0.212 1.337 0.043 0.109
ESGR β i 2.445 0.896 0.004 0.842 0.001 0.398 0.727 0.058 0.424 0.586 0.347 0.038
FSR β i 0.739 0.186 0.494 0.649 0.011 0.282 -0.833 0.622 0.043 -0.894 0.493 0.024
GLRE β i 1.471 0.065 0.613 0.807 0.007 0.295 0.421 0.795 0.012 0.942 0.561 0.016
HCC β i 0.486 0.033 0.349 0.289 0.135 0.044 1.176 0.001 0.624 1.170 0.000 0.509
IPCR β i -0.027 0.952 0.001 0.370 0.082 0.080 2.732 0.446 0.074 3.901 0.207 0.043
MET β i 0.882 0.002 0.588 1.168 0.000 0.462 0.734 0.040 0.330 0.723 0.000 0.316
MHLD β i 3.714 0.089 0.673 0.995 0.020 0.281 0.626 0.097 0.539 0.680 0.105 0.166
MRH β i 0.443 0.294 0.121 0.545 0.009 0.164 2.799 0.153 0.193 2.675 0.088 0.073
ORH β i -0.154 0.770 0.015 0.625 0.065 0.105 1.657 0.092 0.314 1.634 0.006 0.199
PRE β i 0.442 0.017 0.415 0.599 0.000 0.229 0.998 0.069 0.269 1.128 0.022 0.107
PRU β i 1.497 0.001 0.692 1.748 0.000 0.496 0.823 0.032 0.355 0.669 0.000 0.278
PTP β i 0.347 0.239 0.150 0.531 0.001 0.249 1.898 0.292 0.100 1.115 0.128 0.060
RE β i 0.884 0.002 0.613 0.641 0.002 0.170 0.962 0.026 0.375 0.955 0.004 0.166
RGA β i 0.777 0.001 0.666 0.790 0.000 0.305 0.994 0.000 0.723 1.002 0.000 0.691
RNR β i 0.774 0.034 0.348 0.458 0.046 0.077 1.486 0.238 0.124 1.432 0.090 0.060
SSREY β i 0.840 0.004 0.553 1.490 0.000 0.342 0.745 0.013 0.441 0.565 0.003 0.248
TKOMY β i 0.857 0.137 0.189 0.459 0.063 0.068 0.675 0.068 0.272 0.199 0.529 0.015
TRH β i 0.950 0.002 0.624 0.841 0.000 0.400 1.198 0.001 0.713 0.797 0.001 0.226
UVE β i 2.227 0.782 0.007 1.247 0.711 0.003 1.766 0.087 0.243 1.563 0.055 0.076
VR β i 0.146 0.411 0.174 0.456 0.050 0.179 1.325 0.336 0.154 1.755 0.122 0.115
WTM β i 1.012 0.007 0.500 0.977 0.000 0.260 0.500 0.406 0.064 0.427 0.572 0.007
XL β i 3.464 0.061 0.284 1.669 0.000 0.335 0.486 0.362 0.076 0.463 0.267 0.026
Return Type
Frequency Annual Quarterly
Price Returns (ROR)
Annual Quarterly
Return on Assets (ROA)

28
Appendix E33
33
33
P-values less than 0.20 and greater than 0.10 (i.e., 0.10 < p < 0.20) are highlighted yellow, those less than 0.10
and greater than 0.05 (i.e., 0.05 < p < 0.10) are highlighted orange, and those less than 0.05 (i.e., p < 0.05) are
highlighted red.
Return Frequency DV γ 1 p-value γ 0 p-value R2 γ 1 p-value γ 0 p-value R
2
ROR Annual β 1.081 0.605 1.134 0.089 0.009 0.366 0.435 0.758 0.000 0.048
ROR Quarterly β 1.442 0.542 0.875 0.240 0.012 0.916 0.023 0.654 0.000 0.205
ROA Annual β -1.068 0.080 1.374 0.000 0.096 -0.605 0.259 1.223 0.000 0.114
ROA Quarterly β -1.229 0.084 1.385 0.000 0.093 -0.819 0.103 1.253 0.000 0.167
Significance Level All p-values p-value < 0.05

29
Section VII: Bibliography
Ackermann, C., McEnally, R., & Ravenscraft, D. (1999, June). The Performance of Hedge
Funds: Risk, Return, and Incentives. The Journal of Finance, 54(3), 833-874.
Agarwal, V., Daniel, N. D., & Naik, N. Y. (2009, October). Role of Managerial Incentives and
Discretion in Hedge Fund Performance. The Journal of Finance, 64(5), 2221-2256.
Ang, A., Gorovyy, S., & van Inwegen, G. B. (2011, February 6). Hedge fund Leverage. Journal
of Financial Economics, 102(1), 102-126.
Black, F., Jensen, M. C., & Scholes, M. (1972). The Capital Asset Pricing Model: Some
Empirical Tests. Westport: Praeger Publishers Inc.
Collimore, T. (2013). Alternative Investments for Individual Investors: A Starting Point for
Discussions with Your Financial Advisor. New York: CFA Institue. Retrieved from CFA
Institute.
Dai, J., & Sundaresan, S. (2012, March 21). Risk Management Framework for Hedge Funds:
Role of Funding and Redemption Options on Leverage. Working Paper Series, 1-38.
Davidoff, S. M. (2012, September 4). With Lax Regulation, a Risky Industry Flourishes
Offshore. Retrieved from The New York Times: Dealbook:
http://dealbook.nytimes.com/2012/09/04/with-lax-regulation-a-risky-industry-flourishes-
offshore/
Fama, E. F. (1970, May). Efficient Capital Markets: A Review of Theory and Empirical Work.
The Journal of Finance, 25(2), 383-417.
Federal Reserve Bank of St. Louis. (2013, May 2). 3-Month Treasury Bill: Secondary Market
Rate. Retrieved from Economic Research: Federal Reserve Bank of St. Louis:
http://research.stlouisfed.org/fred2/series/TB3MS/downloaddata?cid=116

30
Jensen, M. C. (1968). The Performance of Mutual Funds in the Period 1945-1964. The Journal
of Finance, 23(2), 389-416.
Kelly, D. (2013). Private Equity, Hedge Funds & Investment Vehicles in the US. Los Angeles:
IBISWorld Inc.
KPMG International. (2013, May 8). Corporate tax rates table. Retrieved from KPMG:
http://www.kpmg.com/global/en/services/tax/tax-tools-and-resources/pages/corporate-
tax-rates-table.aspx
Lerner, J., Schoar, A., & Wang, J. (2008, September). Secrets of the Academy: The Drivers of
University Endowment Success. National Bureau of Economic Research.
Lintner, J. (1965, February). The Valuation of Risk Assets and the Selection of Risky
Investments in Stock Portfolios and Capital Budgets. The Review of Economics and
Statistics, 47(1), 13-57.
Lo, A. W. (2001). Risk Management for Hedge Funds: Introduction and Overview. Financial
Analysts Journal, 16-33.
Lo, A. W. (2004). The Adaptive Markets Hypothesis: Market Efficiency from an Evolutionary
Perspective. Journal of Portfolio Management.
Mirsky, R., & Cowell, A. (2012). The evolution of an industry: 2012 KPMG/AIMA Global
Hedge Fund Survey. London: KPMG International.
Mirsky, R., & Cowell, A. (2012). The value of the hedge fund industry to investors, markets, and
the broader economy. Imperial College, Centre for Hedge Fund Research. London:
KPMG International.

31
Nissim, D. (2010). Analysis and Valuation of Insurance Companies. Columbia Business School,
Center for Excellence in Accounting and Security Analysis. New York: Columbia
University in the City of New York.
Robert W. Baird & Co. (2010). Demystifying the Role of Alternative Investments in a Diversified
Investment Portfolio. Milwaukee: Robert W. Baird & Co. Incorporated.
Sharpe, W. F. (1964, September). Capital Asset Prices: A Theory of Market Equilibrium under
Conditions of Risk. The Journal of Finance, 19(3), 425-422.
Skidmore, G. H. (2010). Alternative Asset Classes: An Introduction. Greenwich: Belray Asset
Management.
Taussig, J. K. (2010). A Tale of Two Capital Structures. Zürich, Switzerland: Taussig Capital
AG.
The Insurance Insider. (2005, January 10). Hedge funds strengthen reinsurance roots. Insider
Quarterly, pp. 20-21.
Tobin, J. (1958). Liquidity Preference as Behavior Towards Risk. Review of Economic Studies,
65-86.
United States Treasury. (2013, May 7). Derivatives. Retrieved from Office of the Comptroller of
the Currency: http://www.occ.gov/topics/capital-markets/financial-
markets/trading/derivatives/index-derivatives.html
Vaughan, D. A. (2003). Selected Definitions of "Hedge Fund". Roundtable on Hedge Funds (p.
3). Washington, DC: U.S. Securities and Exchange Commission.


