
THE EWING
PUBLIC SCHOOLS
The Ewing Public Schools
Public Presentation of the
Spring 2019 NJSLA Results
Presented by
Dr. Danita Ishibashi
Assistant Superintendent
September 23, 2019

THE EWING
PUBLIC SCHOOLS
Public Presentation of the Formal
Report on ESSA
September 23, 2019

THE EWING
PUBLIC SCHOOLS
The ESSA categorizes schools as:
Comprehensive Support and Improvement (CSI)
Targeted Support and Improvement (TSI)
Non-Categorized
Accountability Metric

THE EWING
PUBLIC SCHOOLS What Is Our Status?
All Ewing Public
Schools Are
Non-Categorized

THE EWING
PUBLIC SCHOOLS
Spring 2019 was the first (1th) administration of the New Jersey Student Learning Assessment (NJSLA) New Spring 2019 Science assessment in Grades 4, 8 and 11 the New Jersey Science Learning Assessment (NJSLA) replacing the New Jersey Biology Competency Test (NJBCT) in Grades 9-12
NJSLA Assessment

THE EWING
PUBLIC SCHOOLS
New Jersey Student Learning Assessment (NJSLA)
Administered to:
all grade 3-8 students in ELA and Math
All students enrolled in Algebra I, Geometry, Algebra II, English 9, English 10
and English 11
What Is NJSLA?

THE EWING
PUBLIC SCHOOLS
Antheil 3
Lore 4
Parkway 5
Fisher Middle 79
Ewing High 21
Total 112
Decreased since 2015
Spring 2015 191
Spring 2018 117
Increase Fisher Middle
Spring 2018 40
Spring 2019 79
Ewing 2019 ‘Refusal to Test’

THE EWING
PUBLIC SCHOOLS
Single administration
spring -Grades 3-8
end of each semester Grades
9-11 (Fall and Spring) Technology-based
Math by Grade Level (3-8) and
End of Course: Algebra 1,
Geometry, Algebra II
ELA by Grade Level 3-8 and End
of Course (English 9, 10 and 11)
Based on NJSLS
First administration
Science Grades 5, 8
and 11 computer
based administration
aligned to NGSS
(NJSLA-S)
Shorter testing time
(grade level and
content specific, 15-
30 minutes)

THE EWING
PUBLIC SCHOOLS
1. Meet the minimum requirement of courses in ELA, Math, Science, Social Studies, Financial Literacy, Performing/Practical Arts, Physical Education and World Language
AND
2. Demonstrate competency in ELA and Math on a
State assessment (or alternative assessment)
How Does NJSLA Impact High
School Graduation Requirements?

THE EWING
PUBLIC SCHOOLS
PARCC/NJSLA is one of multiple assessments which can be used to demonstrate competency and meet the graduation requirement in ELA and Math for the class of 2020 - 22 (current Grade 10-12 students)
How Does NJSLA Impact High
School Graduation Requirements?

THE EWING
PUBLIC SCHOOLS
Recently, (June 2019), the Department of Education has clarified the specific pathways to meet the State assessment requirements for the class of 2020, 2021 and 2022 and committed to provide fair notice to students and educators for the class of 2023 and beyond.
How Does NJSLA Impact High
School Graduation Requirements?

THE EWING
PUBLIC SCHOOLS
Class of:
2020 – current 12th grade
2021 – current 11th grade
2022 – current 10th grade
Can meet graduation assessment requirements through any of these three pathways:
1. Achieving passing scores on high-level PARCC assessments;
2. Achieving certain scores on alternative assessments such as the SAT, ACT, or Accuplacer; or
3. The submission by the district of a student portfolio through the Department’s portfolio appeals process.
How Does NJSLA Impact High
School Graduation Requirements?


Graduation Requirements: Classes 2020 – 2022
PARCC • PARCC EOC Algebra I and ELA 10
Substitute Assessments
• Any of the following: SAT, ACT/ACT PLAN, Accuplacer, ASVAB-AFQT, PSAT, ACT Aspire
• Another EOC PARCC assessment (ELA 9, ELA 11, Geometry, or Algebra II)
Portfolio Appeal
• Submitted by the district on behalf of the student.
Students in these classes have limited opportunities to participate in PARCC assessments and some may have already taken subjects tested by PARCC. As such, to meet graduation requirements, students are able to meet various scores on PARCC assessments , substitute assessments or via the portfolio appeal process.
PARCC • PARCC EOC Algebra I and ELA 10
Substitute Assessments
• Any of the following: SAT, ACT/ACT PLAN, Accuplacer, ASVAB-AFQT, PSAT, ACT Aspire
• Another EOC PARCC assessment (ELA 9, ELA 11, Geometry, or Algebra II)
Portfolio Appeal
• Submitted by the district on behalf of the student.
PARCC • PARCC EOC Algebra I and ELA 10
Substitute Assessments
• Any of the following: SAT, ACT/ACT PLAN, Accuplacer, ASVAB-AFQT, PSAT, ACT Aspire
• Another EOC PARCC assessment (ELA 9, ELA 11, Geometry, or Algebra II)
Portfolio Appeal
• Submitted by the district on behalf of the student.
NJSLA • NJSLA EOC Algebra I, Geometry, Algebra II and ELA 9, ELA 10, ELA 11
Substitute Assessments
• Any of the following: SAT, ACT/ACT PLAN, Accuplacer, ASVAB-AFQT, PSAT, ACT Aspire
Portfolio Appeal
• Submitted by the district on behalf of the student.

THE EWING
PUBLIC SCHOOLS
PARCC SAT (Prior to March 2016)
ACT Accuplacer PSAT (Prior to October
2016)
ACT Aspire
ASVAB-AFQT
NJ DOE Portfolio Appeal
ELA Grade 9 >= 750 (Level 4) or Grade 10 >= 750 (Level 4) or Grade 11 >= 725 (Level 3)
400 Critical Reading
16 6 Write Placer
4
Write Placer ESL
40 Critical Reading PSAT10
Reading or PSAT/NMS
QT Reading**
* >=22
422 31 Composite
Meet criteria
How Does PARCC/NJSLA Impact High
School Graduation Requirements?
** SAT - new scoring criterion after March 2016
*** PSAT taken October 2016

THE EWING
PUBLIC SCHOOLS
PARCC SAT (Prior to March 2016)
ACT Accuplacer PSAT (Prior to October
2016)
ACT Aspire
ASVAB-AFQT
NJ DOE Portfolio Appeal
Math Algebra I >= 750 (Level 4) or Geometry >= 725 (Level 4) or Algebra II >= 725 (Level 3)
400 Critical Reading
16 76 Elementary
Algebra
40 Critical Reading PSAT10 Math or PSAT/NMSQT Math ***
>=22
422 31 Meet criteria
How Does PARCC/NJSLA Impact High
School Graduation Requirements?
** SAT - new scoring criterion after March 2016
*** PSAT taken October 2016

THE EWING
PUBLIC SCHOOLS
Overview of the PARCC Data

THE EWING
PUBLIC SCHOOLS
Meet/Exceed the District percentage of students at a Level 4+5
2019 Math Performance
Building Grade District Score School Score
Parkway 3 53 53
Parkway 4 38 46
Lore 3 53 61
Lore 4 38 41
Lore 5 38 43
Anthiel 5 38 42

THE EWING
PUBLIC SCHOOLS
Grade levels which exceed the DISTRICT
percentage of students at a Level 4+5
2019 ELA Performance
Building Grade District Score School Score
Lore 3 38 54
Lore 5 45 51
Antheil 4 45 47
Antheil 5 45 48

THE EWING
PUBLIC SCHOOLS
Grade levels which meet/exceed the STATE
percentage of students at a Level 4+5
2019 Math Performance
Building Grade STATE Score School Score
Lore 3 51 61

THE EWING
PUBLIC SCHOOLS
Grade levels which meet/exceed the STATE
percentage of students at a Level 4+5
2019 ELA Performance
Building Grade STATE Score School Score
Lore 3 50 54

THE EWING
PUBLIC SCHOOLS
2019 ELA Total Population
Comparison %
Grade Level Level 4+5 2018
Level 4+5 2019
Difference
3 39 38 -1
4 41 45 +4
5 45 45 -
6 45 37 -8
7 52 41 -11
8 43 49 +6
9 42 38 -4
10 31 37 +6
11 25 38 +13

THE EWING
PUBLIC SCHOOLS ELA Total Population
Comparison %
Grade Level Level 4+5 2018 Level 4+5 2019 Difference
3 39 38 -1
4 41 45 +4
5 45 45 -

THE EWING
PUBLIC SCHOOLS ELA Total Population
Comparison %
Grade Level Level 4+5 2018 Level 4+5 2019 Difference
6 45 37 -8
7 52 41 -11
8 43 49 +6

THE EWING
PUBLIC SCHOOLS ELA Total Population
Comparison %
Grade Level Level 4+5 2018 Level 4+5 2019 Difference
9 42 38 -4
10 31 37 +6
11 25 38 +13

THE EWING
PUBLIC SCHOOLS Math Total Population
Comparison %
Grade Level Level 4+5 2018 Level 4+5 2019 Difference
3 48 53 +7
4 40 38 -2
5 41 38 -3
6 33 25 -8
7 41 38 -3
8 24 25 +1
Algebra I 35 21 -14
Geometry 16 13 -3
Algebra II 12 30 +18

THE EWING
PUBLIC SCHOOLS District Math Total
Population Comparison %
Grade Level Level 4+5
2018 Level 4+5
2019 Difference
3 46 53 +7
4 40 38 -2
5 41 38 -3

THE EWING
PUBLIC SCHOOLS District Math Total
Population Comparison %
Grade Level Level 4+5
2018 Level 4+5
2019 Difference
6 33 25 -8
7 41 38 -3
8 24 25 +1

THE EWING
PUBLIC SCHOOLS District Math Total
Population Comparison %
Grade Level Level 4+5 2018 Level 4+5 2019 Difference
Algebra I 35 21 -14
Geometry 16 13 -3
Algebra II 12 30 +18

THE EWING
PUBLIC SCHOOLS “Apples to Apples” PARCC
ELA Comparison %
Grade 2018 2019 Difference
3-4 39 45 +6
4-5 41 45 +4

THE EWING
PUBLIC SCHOOLS “Apples to Apples” PARCC
ELA Comparison %
Grade 2018 2019 Difference
5-6 45 37 -8
6-7 45 41 -4
7-8 52 49 -3

THE EWING
PUBLIC SCHOOLS “Apples to Apples” PARCC
ELA Comparison %
Grade 2018 2019 Difference
8-9 43 38 -5
9-10 42 37 -5
10-11 31 38 +7

THE EWING
PUBLIC SCHOOLS “Apples to Apples” PARCC
Math Comparison %
Grade 2018 2019 Difference
3-4 46 38 -8
4-5 40 38 -2

THE EWING
PUBLIC SCHOOLS “Apples to Apples” PARCC
Math Comparison %
Grade 2018 2019 Difference
5-6 41 25 -16
6-7 33 38 +5
7-8 41 25 -16

THE EWING
PUBLIC SCHOOLS “Apples to Apples” PARCC
Math Comparison %
Grade 2018 2019 Difference
Algebra I 35 21 -14
Geometry 16 13 -3
Algebra II 12 30 +18

Dynamic Learning Maps (DLM)
ELA Grade Emerging Approaching
Target At Target Advanced
At Target or Advanced
3 22% 22% 56% 0% 56%
4 0% 50% 50% 0% 50%
5 0% 50% 50% 0% 50%
6 29% 14% 14% 43% 57%
7 0% 0% 100% 0% 100%
8 0% 50% 25% 25% 50%
11 0% 0% 75% 25% 100%

2018-2019 Dynamic Learning Maps (DLM)
Math Grade
Emerging Approaching
Target At Target Advanced
At Target or Advanced
3 25% 38% 0% 38% 38%
4 0% 0% 100% 0% 100%
5 50% 0% 25% 25% 50%
6 29% 14% 14% 43% 57%
7 100% 0% 0% 0% 0%
8 25% 25% 25% 25% 50%
11 13% 75% 13% 0% 13%

2018-2019 ACCESS data
Grade Overall Score -
K
Overall Score -
1
Overall Score -
2
Overall Score -
3
Overall Score -
4
Overall Score -
5
Overall Score -
6
Overall Score -
7
Overall Score -
8
Overall Score -
9
Overall Score -
10
Overall Score -
11
Overall Score -
12
Entering 38% 0% 6% 3% 0% 38% 0% 0% 0% 33% 10% 50% 0%
Emerging 31% 29% 25% 13% 0% 13% 0% 14% 29% 17% 30% 17% 50%
Developing 23% 47% 44% 47% 30% 38% 67% 43% 43% 50% 50% 33% 50%
Expanding 8% 18% 25% 30% 70% 13% 33% 43% 29% 0% 10% 0% 0%
Bridging 0% 6% 0% 7% 0% 0% 0% 0% 0% 0% 0% 0% 0%
Reaching 0% 0% 0% 0% 0% 0% 0% 0% 0% 0% 0% 0% 0%

39
Spring 2017-2019 NJSLA Performance by Subgroup
K-5 ELA
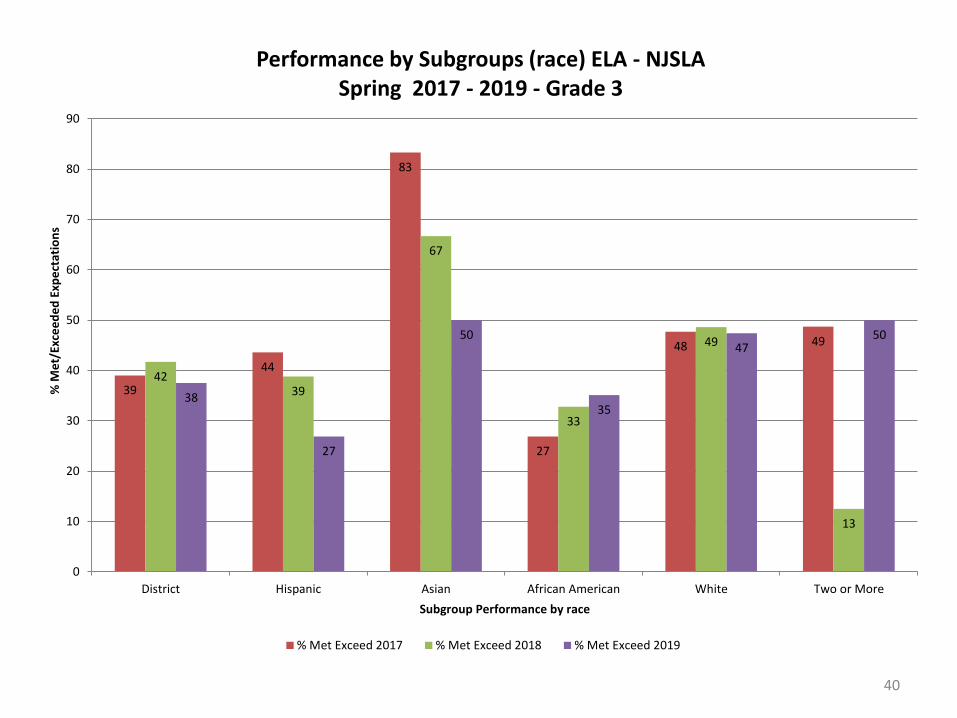
40
39
44
83
27
48 49
42 39
67
33
49
13
38
27
50
35
47 50
0
10
20
30
40
50
60
70
80
90
District Hispanic Asian African American White Two or More
% M
et/
Exce
ed
ed
Exp
ect
atio
ns
Subgroup Performance by race
Performance by Subgroups (race) ELA - NJSLA Spring 2017 - 2019 - Grade 3
% Met Exceed 2017 % Met Exceed 2018 % Met Exceed 2019

41
39 37
69
34
50
38
42
49
80
31
52
46 45
39
60
36
63
50
0
10
20
30
40
50
60
70
80
90
District Hispanic Asian African American White Two or More
% M
et/
Exce
ed
ed
Exp
ect
atio
ns
Subgroup Performance by race
Performance by Subgroups (race) ELA - NJSLA Spring 2017 - 2019 - Grade 4
% Met Exceed 2017 % Met Exceed 2018 % Met Exceed 2019
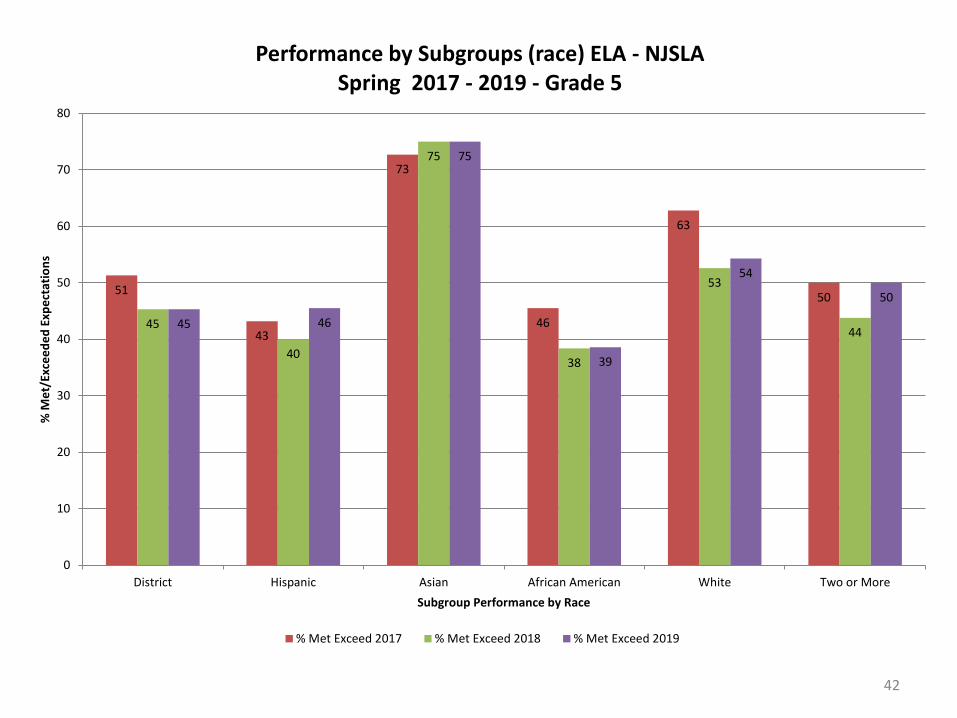
42
51
43
73
46
63
50
45
40
75
38
53
44 45 46
75
39
54
50
0
10
20
30
40
50
60
70
80
District Hispanic Asian African American White Two or More
% M
et/
Exce
ed
ed
Exp
ect
atio
ns
Subgroup Performance by Race
Performance by Subgroups (race) ELA - NJSLA Spring 2017 - 2019 - Grade 5
% Met Exceed 2017 % Met Exceed 2018 % Met Exceed 2019

43
Spring 2017 - 2019 NJSLA
Performance by Subgroup
K-5 Math

44
50
44
100
33
67
63
48
43
58
38
68
25
53
46
94
41
68
88
0
10
20
30
40
50
60
70
80
90
100
District Hispanic Asian African American White Two or More
% M
et/
Exce
ed
ed
Exp
ect
atio
ns
Subgroup Performance by Race
Performance by subgroups (race) Math - NJSLA Spring 2017 - 2019 - Grade 3
% Met Exceed 2017 % Met Exceed 2018 % Met Exceed 2019

45
34 33
59
26
41
31
40 43
80
24
60
50
38
28
50
29
60
25
0
10
20
30
40
50
60
70
80
90
District Hispanic Asian African American White Two or More
Performance by Subgroups (race) Math - NJSLA Spring 2017 - 2019 -Grade 4
% Met Exceed 2017 % Met Exceed 2018 % Met Exceed 2019

46
33
37
33
22
46
42 41
46
63
28
51 53
38 39
88
24
60
33
0
10
20
30
40
50
60
70
80
90
District Hispanic Asian African American White Two or More
% M
et/
Exce
ed
ed
Exp
ect
atio
ns
Subgroup Performance by Race
Performance by subgroups (race) Math – NJSLA Spring 2017 - 2019 - Grade 5
% Met Exceed 2017 % Met Exceed 2018 % Met Exceed 2019
47
Spring 2017 - 2019 NJSLA
Performance by Subgroup
Middle School ELA

48
31
18 20
26
48
25
45
20
64
43
62
30
37
45
62
26
46
36
0
10
20
30
40
50
60
70
80
90
District Hispanic Asian African American White Two or More
% M
et/
Exce
ed
ed
Ecp
ect
atio
ns
Subgrop Perfromance by Race
Performance by subgroups (race) ELA - NJSLA Spring 2017 - 2019 - Grade 6
% Met Exceed 2017 % Met Exceed 2018 % Met Exceed 2019

49
39
28
56
33
60
29
53
47
86
48
62
33
41
36
73
39
45
20
0
10
20
30
40
50
60
70
80
90
District Hispanic Asian African American White Two or More
% M
et/
Exce
ed
ed
Exp
ect
atio
ns
Subgroup Performance by Race
Performance by Subgroups (race) ELA - NJSLA Spring 2017 - 2019 - Grade 7
% Met Exceed 2017 % Met Exceed 2018 % Met Exceed 2019

50
32
22
46
22
55
0
43
34
63
36
60 60
49
38
75
44
63
50
0
10
20
30
40
50
60
70
80
District Hispanic Asian African American White Two or More
% M
et/
Exce
ed
ed
Exp
ect
atio
ans
Subgroup Performnce by Race
Performance by Subgroups (race) ELA - NJSLA Spring 2017 - 2019 - Grade 8
% Met Exceed 2017 % Met Exceed 2018 % Met Exceed 2019

51
Spring 2017 - 2019 NJSLA
Performance by Subgroup
Middle School Math

52
32
28
60
20
49
25
33
37
71
19
42
70
25 25
39
19
33
29
0
10
20
30
40
50
60
70
80
District Hispanic Asian African American White Two or More
% M
et/
Exce
ed
ed
Exp
ect
atio
ns
Subgroup Performanc by Race
Performance by Subgroups (race) Math - NJSLA Spring 2017 - 2019 – Grade 6
% Met Exceed 2017 % Met Exceed 2018 % Met Exceed 2019

53
33 31
56
16
60
43
24
30
56
32
63
0
38
33
73
24
62
50
0
10
20
30
40
50
60
70
80
District Hispanic Asian African American White Two or More
% M
et/
Exce
ee
d E
xpe
ctat
ion
s
Subgroup Performance by race
Performance by Subgroups (race) Math – NJSLA Spring 2017 - 2019 - Grade 7
% Met Exceed 2017 % Met Exceed 2018 % Met Exceed 2019

54
28 31
33
21
43
33
24 21
75
18
35 33
25
15
50
19
45
50
0
10
20
30
40
50
60
70
80
District Hispanic Asian African American White Two or More
% M
et/
Exce
ed
ed
Exp
ect
atio
ns
Subgrop Performance by race
Performance by Subgroups by (race) Math – NJSLA Spring 2017 - 2019 - Grade 8
% Met Exceed 2017 % Met Exceed 2018 % Met Exceed 2019

2018-2019 NJSLA - ELA
Performance by Subgroup
Grade level - Elementary Schools

56
38
27
50
35
47 50
24
16
44
21
29
0
54
44
33
53
65
50
33
20
75
29
43
60
0
10
20
30
40
50
60
70
80
90
District Hispanic Asian African American White Two or More
% M
et/
Exce
ed
ed
Exp
ect
atio
ns
Sub groups by Building
Spring 2019 - Grade 3 Sub group comparison
% Met Exceed 2019 District % Met Exceed 2019 Antheil % Met Exceed 2019 Lore % Met Exceed 2019 Parkway

57
45
39
60
36
63
50 47
52
63
37
61
20
42
29
100
28
61
100
46
29
0
43
69
100
0
10
20
30
40
50
60
70
80
90
100
District Hispanic Asian African American White Two or More
% M
et/
Exce
ed
ed
Exp
ect
atio
ns
Spring 2019 - Grade 4 Sub group comparison
% Met Exceed 2019 % Met Exceed 2019 Antheil % Met Exceed 2019 Lore % Met Exceed 2019 Parkway

58
45 48
50
60
47 50
0
51 50
100
40
66
38
34 33
0
29
36
100
0
10
20
30
40
50
60
70
80
90
100
District Hispanic Asian African American White Two or More
% M
et/
Exce
ed
Exp
ect
atio
ns
Spring 2019 - Grade 5 Sub group comparison
% Met Exceed 2019 % Met Exceed 2019 Antheil % Met Exceed 2019 Lore % Met Exceed 2019 Parkway

2018-2019 NJSLA - Math Performance by Subgroup
Grade level - Elementary Schools
59

60
53
46
94
41
68
88
44
30
89
32
63
0
61
67
100
48
73
100
53
44
100
44
71
100
0
10
20
30
40
50
60
70
80
90
100
District Hispanic Asian African American White Two or More
% M
et/
Exce
ed
ed
Exp
ect
atio
ns
Sub groups by Building
Spring 2019 - Grade 3 Sub group comparison
% Met Exceed 2019 District % Met Exceed 2019 Antheil % Met Exceed 2019 Lore % Met Exceed 2019 Parkway

61
38
28
50
29
60
25
29 30
38
23
42
0
41
18
100
23
71
100
46
36
100
43
63
0 0
10
20
30
40
50
60
70
80
90
100
District Hispanic Asian African American White Two or More
% M
et/
Exce
ed
ed
Exp
ect
atio
ns
Spring 2019 - Grade 4 Sub group comparison
% Met Exceed 2019 % Met Exceed 2019 Antheil % Met Exceed 2019 Lore % Met Exceed 2019 Parkway

62
38 39
88
24
60
33
43 44
80
33
58
0
43
25
100
20
75
38
25
42
0
19
28
33
0
10
20
30
40
50
60
70
80
90
100
District Hispanic Asian African American White Two or More
% M
et/
Exce
ed
Exp
ect
atio
ns
Spring 2019 - Grade 5 Sub group comparison
% Met Exceed 2019 % Met Exceed 2019 Antheil % Met Exceed 2019 Lore % Met Exceed 2019 Parkway

Spring 2017 - 2019 NJSLA - Math Performance by Subgroup
High School
63

21% 24%
69%
13%
53%
0%
35% 33%
55%
23%
56%
38%
21%
12%
57%
24%
54%
20%
0%
10%
20%
30%
40%
50%
60%
70%
80%
90%
District Hispanic Asian African American White Two or More
% M
et/
Exce
ed
ed
Exp
ect
atio
ns
subgroup Performance by Race
Performance by subgroups (race) Math - Algebra I
% Met Exceed SY 2017 % Met Exceed SY 2018 % Met Exceed SY 2019

10% 10%
36%
4%
14% 12%
9%
22%
6%
21%
27%
13%
100%
8%
48%
2%
12%
22%
32%
42%
52%
62%
72%
82%
92%
District Hispanic Asian African American White Two or More
% M
et/
Exce
ed
ed
Exe
ctat
ion
s
Subgroup Performance by Race
Performance by subgroups (race) Math - Algebra II
% Met Exceed SY 2017 % Met Exceed SY 2018 % Met Exceed SY 2019

19%
15%
60%
12%
26%
38%
16%
13%
70%
6%
44%
0%
13%
48%
3% 7%
79%
0% 0%
10%
20%
30%
40%
50%
60%
70%
80%
90%
District Hispanic Asian African American White Two or More
% M
et/
Exce
ed
ed
Exp
ect
atio
ns
Subgroup Performance by Race
Performance by subgroups (race) Math - Geometry
% Met Exceed SY 2017 % Met Exceed SY 2018 % Met Exceed SY 2019

Spring 2017 - 2019 NJSLA - English Performance by Subgroup
High School
67

36%
24%
69%
13%
53%
0%
42%
32%
75%
32%
62%
100%
38%
2% 8%
3% 6% 5% 0%
10%
20%
30%
40%
50%
60%
70%
80%
90%
100%
District Hispanic Asian African American White Two or More
% M
et/
Exce
ed
ed
Exp
ect
aitn
s
Subgroup Performance by Race
Performance by subgroups (race) English - 9
% Met Exceed SY 2017 % Met Exceed SY 2018 % Met Exceed SY 2019

43%
10%
36%
4%
14%
0
31%
24%
64%
18%
56%
50%
37%
28%
62%
26%
53%
0% 0%
10%
20%
30%
40%
50%
60%
70%
80%
90%
District Hispanic Asian African American White Two or More
% M
et/
Exce
ed
ed
Exp
ect
atio
ns
Subgroup Performance by Race
Performance by subgroups (race) English - 10
% Met Exceed SY 2017 % Met Exceed SY 2018 % Met Exceed Spring 2019

22%
15%
60%
12%
26%
38%
25%
21%
29%
23%
30%
25%
38%
17%
71%
30%
60%
50%
0%
10%
20%
30%
40%
50%
60%
70%
80%
90%
District Hispanic Asian African American White Two or More
% M
et/
Exce
ed
ed
Exp
ect
ato
ns
Subgroup Performance by Race
Performance by subgroups (race) English - 11
% Met Exceed SY 2017 % Met Exceed SY 2018 % Met Exceed Spring 2019

2018-2019 High School Math Performance
Performance Distribution by Student %
Algebra I Level 1 Level 2 Level 3 Level 4 Level 5 Total 4+5
Fall 2018 8% 4% 20% 64% 4% 68%
Spring 2019 13% 47% 26% 15% 0% 15%
SY 2019 12% 42% 25% 21% 0% 21%
Performance Distribution by Student % (4+5)
Geometry Level 1 Level 2 Level 3 Level 4 Level 5 Total 4+5
Fall 2018 2% 22% 33% 41% 2% 43%
Spring 2019 22% 41% 30% 6% 1% 7%
SY 2019 19% 38% 31% 12% 1% 13%
Performance Distribution by Student % (4+5)
Algebra II Level 1 Level 2 Level 3 Level 4 Level 5 Total 4+5
Fall 2018 48% 22% 15% 15% 0% 15%
Spring 2019 29% 17% 19% 33% 1% 34%
SY 2019 37% 19% 17% 26% 1% 27%

2018-2019 High School English Performance
Performance Distribution by Student % (4+5)
English 9 Level 1 Level 2 Level 3 Level 4 Level 5 Total 4+5
Fall 2018 8% 5% 33% 41% 14% 54%
Spring 2019 18% 22% 33% 26% 1% 27%
SY 2019 14% 15% 33% 32% 6% 38%
Performance Distribution by Student % (4+5)
English 10 Level 1 Level 2 Level 3 Level 4 Level 5 Total 4+5
Fall 2018 9% 26% 23% 32% 11% 43%
Spring 2019 26% 19% 22% 23% 10% 33%
SY 2019 19% 22% 22% 26% 11% 37%
Performance Distribution by Student % (4+5)
English 11 Level 1 Level 2 Level 3 Level 4 Level 5 Total 4+5
Fall 2018 13% 20% 24% 30% 14% 44%
Spring 2019 29% 29% 20% 23% 0% 23%
SY 2019 17% 22% 23% 28% 10% 38%

THE EWING
PUBLIC SCHOOLS
District Overview by Building

THE EWING
PUBLIC SCHOOLS Antheil Elementary School
Areas of Encouragement
Grades (4-5) in ELA
meets/exceeded the
percentage of students
achieving a Level 4/5
Grade 5 in Math
meets/exceeded the
percentage of students
achieving a Level 4/5 at the
district level
Grade 4-5 met/exceeded
expectations in Written
Expression and Conventions
Focus Area
Grades 3 Literacy
(Reading, Information text,
Vocabulary and Writing
expression)
Grade 4- Literacy
(Reading, Information text
and Vocabulary)
Grade 3 Math (Reasoning)
Grade 5 Math

THE EWING
PUBLIC SCHOOLS Lore Elementary School
Areas of Encouragement
Grade 3 ELA exceeded the district
and state percentage of students
achieving Level 4/5
Grades 3 Math exceeded the district
and state percentage of students
achieving Level 4/5
Grade 5 ELA exceeded the district
percentage of students achieving
Level 4/5
Grade 5 Math exceeded the district
percentage of students achieving
Level 4/5
Focus Areas
Grade 4 Literacy (Writing)
Grades 4 Math (Modeling and
Reasoning)

THE EWING
PUBLIC SCHOOLS Parkway Elementary School
Area of Encouragement
Grade 3-4 Math exceeded the
district percentage of
students achieving Level 4/5
Focus Areas
Grades 3-4 Literacy
(Information text and
Writing expression)
Grade 5 (Modeling and
application)

THE EWING
PUBLIC SCHOOLS Fisher Middle School
Areas of Encouragement
95% of students enrolled in the
eighth (8th) grade Algebra I
class achieved a 4/5 on the
Algebra I assessment
Grade 7 ELA demonstrated
significant growth in students
achieving Level 4/5
Grade 7 Math demonstrated
growth in students
achieving Level 4/5
Focus Areas
Grades 6 & 8 Math
(Modeling and application)
Grades 6 & 8 Literacy
(Information text and Writing
expression)

THE EWING
PUBLIC SCHOOLS Ewing High School
Area of Encouragement
Increase % of students
achieving Level 4/5 in Algebra II
and Algebra II (specifically –
Written expression and
conventions)
Increase % of students
achieving Level 4/5 in English
10 and English 11
Focus Areas
English II (Information text,
Vocabulary and Writing
expression)
Geometry

THE EWING
PUBLIC SCHOOLS
5 Year - SAT Data
Ewing High School
School Year School Mean Reading SAT School Mean Math SAT
2013-2014 471 458
2014-2015 460 450
2015-2016 560 505
2016-2017 534 513
2017-2018 507 488

THE EWING
PUBLIC SCHOOLS Next Steps: 2019-20
District Focus includes:
Continue professional development focused on the New Jersey
Student Learning Standards (NJSLS) in English Language Arts and
Mathematics
Continue to refine classroom assessments NJSLS in English
Language Arts and Mathematics to reflect both NJSLS and PARCC
Evidence Statements.
Refine common benchmark assessments, data analysis processes
and using data to meet student needs in all content areas
Extend the Grade 6-8 Literacy Coach to grades 4-5

THE EWING
PUBLIC SCHOOLS Next Steps: 2019-20
Building Level Focus includes:
Monitor implementing with fidelity new instructional material in
English 6-8, Math 6-8, Geometry and Algebra II.
Continue to refine common assessments for Algebra I, Geometry
and Algebra II
Monitor implementing with fidelity the writing instructional materials
at the middle school

THE EWING
PUBLIC SCHOOLS Questions?


