FAiluRE to ACtThe economic impacTOf current Investment trends InWater and WasteWater treatmentInfrastructure

This report was prepared for the American Society of Civil Engineers by Economic Development Research Group, Inc. in association with Downstream Strategies.
The report was funded by a generous grant from the ASCE Foundation.
American Society of Civil Engineers1801 Alexander Bell DriveReston, Virginia, 20191-4400World Headquarters
101 Constitution Avenue, NWSuite 375 EastWashington, DC 20001Washington Office
[email protected]/failuretoact
Economic Development Research Group, Inc.2 Oliver Street, 9th Floor Boston, MA 02109
www.edrgroup.com
Downstream Strategies295 High Street, Suite 3Morgantown, WV 26505
www.downstreamstrategies.com
Copyright © 2011 by the American Society of Civil Engineers. All Rights Reserved.

★|Contents
2 | List of Figures and Tables
3 | Preface
4 | Executive Summary
10 | Section 1 IntroductIon
13 | Section 2 overvIew of water Infrastructure
17 | Section 3 the overall water and wastewater Infrastructure Gap
24 | Section 4 reGIonal overvIew
28 | Section 5 analytIcal framework
33 | Section 6 economIc Impacts
41 | Section 7 conclusIons
43 | About the Study
45 | Endnotes
47 | References
48 | Acknowledgments
49 | About EDR Group and Downstream Strategies
Atechnicalappendixisseparatelyavailableat www.asce.org/failuretoact
Failure to act The economic impacT of current Investment trends InWaterandWasteWatertreatmentInfrastructure

2 American Society of Civil Engineers
★|Figuresandtables Figures1 WaterUseandPopulationintheUnitedStates,
1950–2005
2 U.S.PopulationServedbyPublicDrinking-WaterandbySelf-Supply,1950–2005
3 U.S.PopulationServedbyPubliclyOwnedWaterTreatmentWorks,1940–2008
4 OverallCapitalInvestmentGapforU.S.WaterInfrastructure,1956–2040
5 ExpectedWastewaterTreatmentandDrinking-WaterInfrastructureNeedsandInvestmentsintheU.S.,2011,2020and2040
6 SpendingbyFederal,State,andLocalGovernments,1956–2040
7 AnnualCapitalNeeds,1995–2040
8 U.S.PopulationGrowthbyRegion,2000–2010
9 GrossRegionalProductGrowth,2000–2010
10 PerCapita20-YearNeedsbyRegion
Tables1 AnnualCapitalGapforWaterInfrastructure
in2010,2020,and2040
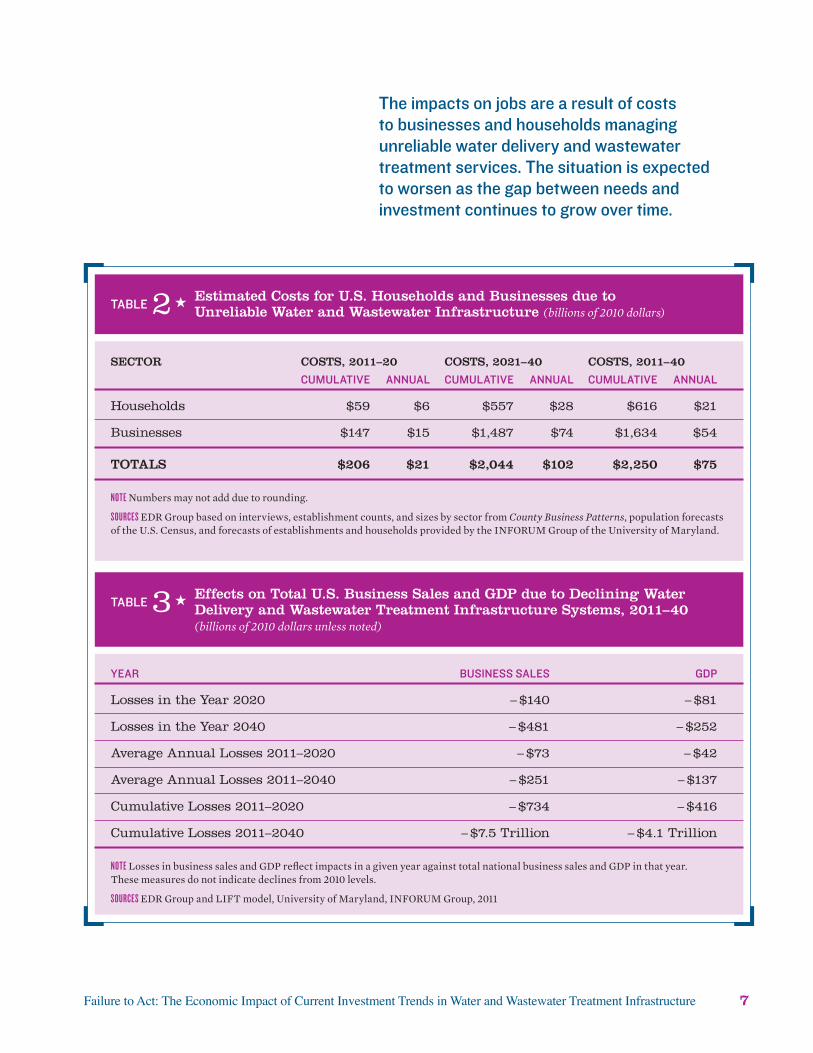
2 EstimatedCostsforU.S.HouseholdsandBusinessesduetoUnreliableWaterandWastewaterInfrastructure
3 EffectsonTotalU.S.BusinessSalesandGDPduetoDecliningWaterDeliveryandWastewaterTreatmentInfrastructureSystems,2011–40
4 TheUsefulLivesofDrinking-WaterSystemComponents
5 TheUsefulLivesofWastewaterSystemComponents
6 OverallAnnualCapitalGapforWaterInfrastructurein2010,2020,and2040
7 ChangesinU.S.CapitalSpendingbyFederal,State,andLocalGovernmentsforWaterDeliveryandWastewaterTreatment,1995–2040
8 ComparativeChangesoftheWaterandWastewaterTreatmentCapitalSpendingGapandtheU.S.Economyin2010,2020,and2040
9 RegionalConcernsRegardingBuildingNeworMaintainingtheExistingWaterInfrastructure
10 TopWater-IntensiveIndustriesintheU.S.
11 EffectsonTotalU.S.JobsandPersonalIncomeDuetoDecliningWaterDeliveryandWastewaterTreatmentInfrastructureSystems,2011–40
12 PotentialEmploymentImpactsasaConsequenceofFailingWaterandWastewaterInfrastructure,2020and2040
13 CumulativeLossesofU.S.Exports
14 PotentialU.S.ExportReductionsby2040
15 ComparisonofPotentialScenarios

Failure to Act: The Economic Impact of Current Investment Trends in Water and Wastewater Treatment Infrastructure 3
ThepurposeoftheFailure to ActreportseriesistoprovideanobjectiveanalysisoftheeconomicimplicationsfortheUnitedStatesofitscontinuedunderinvestmentininfrastructure.Thefourreportsintheserieswillassesstheimplicationsofthepresenttrendsininfrastructureinvest-mentfortheproductivityofindustries,nationalcompetitiveness,andthecostsforhouseholds.
Everyfouryears,theAmericanSocietyofCivilEngineers(ASCE)publishesThe Report Card for America’s Infrastructure,whichgradesthecurrentstateof15nationalinfrastructurecategoriesonascaleofAthroughF.ASCE’s2009Report Cardgavethenation’swastewateranddrinking-waterinfrastructureaD–.ThepresentreportanswersthequestionofhowtheconditionoftheU.S.infrastructuresystemaffectseco-nomicperformance.Inotherwords,howdoesaD–affectAmerica’seconomicfuture?
Thefocusofthisreportisonthepipes,treatmentplants,pumpingstations,andotherinfrastructurethatmakeupthenation’spublicdrinking-waterandwastewatersystems.Mostpublicwaterandwastewatersystemsareownedandoperatedbylocalorregionalgovernmentagencies.Drinking-watersystemsmayalsobe
★|PreFaCe
privatelyownedandoperatedundercontractwithpublicagencies.InaccordancewiththedefinitionsusedbytheU.S.EnvironmentalProtectionAgency(EPA),inthepagesthatfollowweconsiderbothtypesofsystemstobe“public.”Moreover,thisreportanalyzestwotypesofinfrastructureneeds:
1. buildingnewinfrastructuretoserviceincreasingpopulationsandexpandedeconomicactivity;and
2. maintainingorrebuildingexistinginfrastruc-turethatneedsrepairorreplacement.
ThisisthesecondreportinASCE’sFailure to Actseries.Thefirstreport,Failure to Act: The Economic Impact of Current Investment Trends in Surface Transportation Infrastructure,encompasseshighways,bridges,rail,andtransit.Subsequentreportswilladdressenergytrans-mission,aswellasairportsandmarineports.
4 American Society of Civil Engineers
eXeCutiVesummarY
Ofalltheinfrastructuretypes,wateristhemostfundamentaltolife,andisirreplaceablefordrinking,cooking,andbathing.Farmsinmanyregionscannotgrowcropswithoutirriga-tion.Governmentoffices,hospitals,restaurants,hotels,andothercommercialestablishmentscannotoperatewithoutcleanwater.Moreover,manyindustries—foodandchemicalmanufac-turingandpowerplants,forexample—couldnotoperatewithoutthecleanwaterthatisacom-ponentoffinishedproductsorthatisusedforindustrialprocessesorcooling.Drinking-watersystemscollectsourcewaterfromriversandlakes,removepollutants,anddistributesafewater.Wastewatersystemscollectusedwaterandsewage,removecontaminants,anddis-chargecleanwaterbackintothenation’sriversandlakesforfutureuse.Wetweatherinvest-ments,suchassanitaryseweroverflows,preventvarioustypesofpollutantslikesewage,heavymetals,orfertilizerfromlawnsfromeverreach-ingthewaterways.
However,thedeliveryofwaterintheUnitedStatesisdecentralizedandstrained.Nearly170,000publicdrinking-watersystemsarelocatedacrosstheU.S.Ofthesesystems,54,000arecommunitywatersystemsthatcollectivelyservemorethan264millionpeople.Theremain-ing114,000arenon-communitywatersystems,suchasthoseforcampgroundsandschools.Significantly,morethanhalfofpublicdrinking-watersystemsservefewerthan500people.
AstheU.S.populationhasincreased,thepercentageservedbypublicwatersystemshasalsoincreased.Eachyearnewwaterlinesareconstructedtoconnectmoredistantdwellerstocentralizedsystems,continuingtoadduserstoagingsystems.Althoughnewpipesarebeingaddedtoexpandserviceareas,drinking-water
systemsdegradeovertime,withtheusefullifeofcomponentpartsrangingfrom15to95years.
Particularlyinthecountry’soldercities,muchofthedrinking-waterinfrastructureisoldandinneedofreplacement.Failuresindrinking-waterinfrastructurecanresultinwaterdisruptions,impedimentstoemergencyresponse,anddam-agetoothertypesofessentialinfrastructure.Inextremesituationscausedbyfailinginfrastruc-tureordrought,watershortagesmayresultinunsanitaryconditions,increasingthelikelihoodofpublichealthissues.
TheUnitedStateshasfarfewerpublicwaste-watersystemsthandrinking-watersystems—approximately14,780wastewatertreatmentfacilitiesand19,739wastewaterpipesystemsasof2008.1In2002,98percentofpubliclyownedtreatmentsystemsweremunicipallyowned.2Althoughaccesstocentralizedtreat-mentsystemsiswidespread,theconditionofmanyofthesesystemsisalsopoor,withagingpipesandinadequatecapacityleadingtothedischargeofanestimated900billiongallonsofuntreatedsewageeachyear.3
TheEPAestimatedthecostofthecapitalinvestmentthatisrequiredtomaintainandupgradedrinking-waterandwastewatertreatmentsystemsacrosstheU.S.in2010as$91billion.However,only$36billionofthis$91billionneededwasfunded,leavingacapitalfundinggapofnearly$55billion.
WaterinfrastructureintheUnitedStatesisclearlyaging,andinvestmentisnotabletokeepupwiththeneed.Thisstudy’sfindingsindicatethatinvestmentneedswillcontinuetoescalate.AsshowninTable1,ifcurrenttrendspersist,theinvestmentrequiredwillamountto$126billionby2020,andtheanticipatedcapitalfundinggapwillbe$84billion.Moreover,by2040,theneeds

Failure to Act: The Economic Impact of Current Investment Trends in Water and Wastewater Treatment Infrastructure 5
forcapitalinvestmentwillamountto$195billionandthefundinggapwillhaveescalatedto$144billion,unlessstrategiestoaddressthegapareimplementedintheinterveningyearstoalterthesetrends.
effects on expensesEvenwithincreasedconservationandcost-effectivedevelopmentofotherefficiencymethods,thegrowinggapbetweencapitalneedstomain-taindrinking-waterandwastewatertreatmentinfrastructureandinvestmentstomeetthoseneedswilllikelyresultinunreliablewaterserviceandinadequatewastewatertreatment.
Becausecapitalspendinghasnotbeenkeepingpacewithneeds,theresultinggapwillonlywidenthrough2040.Asaresult,pipeswillleak,theconstructionofthenewfacilitiesrequiredtomeetstringentenvironmentalstandardswillbedelayed,addressingthegapwillbecomeincreas-inglymoreexpensive,andwaterswillbepolluted.
Thisanalysisassumesthatthemountingcoststobusinessesandhouseholdswilltaketheformof:
★ Doingnothingandlivingwithwatershortages,andhigherrates(rationingthroughpriceincreases);ormajoroutlaysbybusinessesandhouseholds,includingexpendituresincurredbymovingtowhereinfrastructureisstillreliable,purchasingand
installingequipmenttoconservewaterorrecyclewater,andincreasingrelianceonself-suppliedwaterand/orwastewatertreatment(i.e.,installingindividualwellsandsepticwastesystemswhenmunicipalfacilitiesandservicesarenotavailableoptions),and
★ Incurringincreasedmedicalcoststoaddressincreasesinwater-borneillnessesduetounreliabledeliveryandwastewatertreatmentservices.
Theseresponsestofailingpublicinfrastructurewillvarybylocation,householdcharacteristics,andsizeandtypeofbusiness.Expendituresduetomoving,orfrominstallingandoperatingnewcapitalequipmentfor“self-supply,”areestimatedforhouseholds,commercialestablishments,andmanufacturers.Thesecostsareestimatedat$35,000perhouseholdand$500,000to$1mil-lionforbusinesses,dependingonsizeandwaterrequirement,andareamortizedover20years.Althoughtheseexpendituresarebasedonthecostsassociatedwithself-supply,thecostsareusedtorepresentoutlaysbysomehouseholdsandbusinessesinresponsetounreliablewaterdeliveryandwastewatertreatmentservices.Thisstudydoesnotassumethatcompaniesorhouseholdsmoveoutsideofthemultistateregionwheretheyarenowlocated.However,movement
Year Spending need gap
2010 36.4 91.2 54.8
2020 41.5 125.9 84.4
2040 51.7 195.4 143.7
sourCesNeedscalculatedfromEPA(1997a,1997b,2001,2003,2005,2008,2009,2010).SpendingcalculatedfromCBO(2010)andUSCB(2011a,2011b).
Table 1★ annual capital Gap for Water infrastructure in 2010, 2020, and 2040 (billions of 2010 dollars)

6 American Society of Civil Engineers
acrossregionalboundariesandrelocationofbusinessesoutsideoftheU.S.iscertainlyaresponsethatmaybetriggeredbydecreasingreliabilityofpublicwaterandsewersystems.Householdsandbusinessesthatdonotself-supplyareassumedtoabsorbthehighercoststhatareaconsequenceofdisruptionsinwaterdeliveryandwastewatertreatmentduetoworseninginfrastructure.Theassumptionforthiscategoryisthatthesehouseholdsandbusinesseswillpaythe$84billionassociatedwiththe2020capitalgap($144billionby2040)intermsofhigherratecostsoverandabovethebaselineprojectedratesforwaterandwastewatertreatment.
Water-borneillnesseswillexactapriceinadditionalhouseholdmedicalexpendituresandlaborproductivityduetosicktimeused.TheEPAandtheCentersforDiseaseControlandPreventionhavetrackedthe30-yearincidenceofwater-borneillnessesacrosstheU.S.,categorizedthetypeofillnesses,anddevelopedamonetaryburdenforthosecases.Thatburdenisdistrib-utedpartiallytohouseholds(29percent),asout-of-pocketfeesfordoctororemergencyroomvisits,andotherillness-relatedexpensesleavinglessforahouseholdtospendonotherpurchases,andmainlytoemployers(71percent),duetolostlaborproductivityresultingfromabsentee-ism.Themonetaryburdenfromcontaminationaffectingthepublic-provisionsystemsoverthehistoricalintervalwas$255million.
overall Summary of costsThesumofestimatedexpensestohouseholdsandbusinessesduetounreliablewaterdeliv-eryandwastewatertreatmentisshowninTable2.By2020,thetotalcoststobusinessesduetounreliableinfrastructurewillbe$147billionwhilethatnumberwillbe$59billionforhouse-holds.Thetotalimpactofincreasedcostsanddropinincomewillreducethestandardoflivingforfamiliesbyalmost$900peryearby2020.
effects on the national economyBy2020,thepredicteddeficitforsustainingwaterdeliveryandwastewatertreatment
infrastructurewillbe$84billion.Thismayleadto$206billioninincreasedcostsforbusinessesandhouseholdsbetweennowand2020.Inaworstcasescenario,theU.S.willlosenearly700,000jobsby2020.Unlesstheinfrastructuredeficitisaddressedby2040,1.4millionjobswillbeatriskinadditiontowhatisotherwiseanticipatedforthatyear.
Theimpactsoftheseinfrastructure-relatedjoblosseswillbespreadthroughouttheeconomyinlow-wage,middle-wageandhigh-wagejobs.In2020,almost500,000jobswillbethreatenedinsectorsthathavebeentraditionalemployersofpeoplewithoutextensiveformaleducationsorofentry-levelworkers.4Conversely,ingener-allyacceptedhigh-endsectorsoftheeconomy,184,000jobswillbeatrisk.5
Theimpactsonjobsarearesultofcoststobusinessesandhouseholdsmanagingunreliablewaterdeliveryandwastewatertreatmentservices.AsshowninTable3,betweennowand2020,thecumulativelossinbusinesssaleswillbe$734billionandthecumulativelosstothenation’seconomywillbe$416billioninGDP.Impactsareexpectedtocontinuetoworsen.Intheyear2040alone,theimpactwillbe$481billioninlostbusinesssalesand$252billioninlostGDP.6Moreover,thesituationisexpectedtoworsenasthegapbetweenneedsandinvest-mentcontinuestogrowovertime.AverageannuallossesinGDPareestimatedtobe$42billionfrom2011to2020and$185millionfrom2021to2040.7
The role of Sustainable practicesInalllikelihood,businessesandhouseholdswillbeforcedtoadjusttounreliablewaterdeliveryandwastewatertreatmentservicebystrengtheningsustainablepracticesemployedinproductionanddailywateruse.ThesolutionsalreadybeingputforwardandimplementedintheUnitedStatesandabroadincludevoluntarylimitationsorimposedregulationsgoverningthedemandforwater,aswellastechnologies
Failure to Act: The Economic Impact of Current Investment Trends in Water and Wastewater Treatment Infrastructure 7
Year buSineSS SaleS gdp
Losses in the Year 2020 – $140 – $81
Losses in the Year 2040 – $481 – $252
Average Annual Losses 2011–2020 – $73 – $42
Average Annual Losses 2011–2040 – $251 – $137
Cumulative Losses 2011–2020 – $734 – $416
Cumulative Losses 2011–2040 – $7.5 Trillion – $4.1 Trillion
noteLossesinbusinesssalesandGDPreflectimpactsinagivenyearagainsttotalnationalbusinesssalesandGDPinthatyear.Thesemeasuresdonotindicatedeclinesfrom2010levels.
sourCesEDRGroupandLIFTmodel,UniversityofMaryland,INFORUMGroup,2011
Table 3★ effects on total u.S. Business Sales and GDP due to Declining Water Delivery and Wastewater treatment infrastructure Systems, 2011–40 (billions of 2010 dollars unless noted)
Sector coStS, 2011–20 coStS, 2021–40 coStS, 2011–40
cumulaTive annual cumulaTive annual cumulaTive annual
Households $59 $6 $557 $28 $616 $21
Businesses $147 $15 $1,487 $74 $1,634 $54
totalS $206 $21 $2,044 $102 $2,250 $75
noteNumbersmaynotaddduetorounding.
sourCesEDRGroupbasedoninterviews,establishmentcounts,andsizesbysectorfromCounty Business Patterns,populationforecastsoftheU.S.Census,andforecastsofestablishmentsandhouseholdsprovidedbytheINFORUMGroupoftheUniversityofMaryland.
Table 2★ estimated costs for u.S. Households and Businesses due to unreliable Water and Wastewater infrastructure (billions of 2010 dollars)
The impacts on jobs are a result of costs to businesses and households managing unreliable water delivery and wastewater treatment services. The situation is expected to worsen as the gap between needs and investment continues to grow over time.

8 American Society of Civil Engineers
thatrecyclewaterforindustrialandresidentialpurposes(e.g.,usingrecycledshowerwaterforwateringlawns).Thesetypesofpolicieshavereducedthedemandforwaterandwastewater,and,thereforehavelessenedtheimpactsonexistinginfrastructure.ThemostrecentCleanWatershedsNeedsSurvey(EPA2010)incor-poratesnewtechnologiesandapproacheshighlightedforwastewaterandstormwater:advancedtreatment,reclaimedwastewater,andgreeninfrastructure.Incontrast,themostrecentDrinkingWaterNeedsSurvey(EPA2009)doesnotincludenewtechnologiesandapproaches,suchasseparatepotableandnonpotablewaterandincreasingefficiencies.
Americanbusinessesandhouseholdshavebeenusingwatermoreefficiently,andtheycancontinuetoimprovetheirefficiencyduringthecomingdecades.AsshowninFigure1,thoughtheU.S.populationhascontinuedtogrowsteadilysincethemid-1970s,totalwater
usehasbeenlevel.Overall,U.S.percapitawaterusepeakedinthemid-1970s,withcurrentlevelsbeingthelowestsincethe1950s.Thistrendisduetoincreasesintheefficiencyofindustrialandagriculturalwateruseandisreflectedinanincreaseintheeconomicproductivityofwater.Thesetrendsinindustrialwaterusecanbeexplainedbyanumberoffactors.Forexample,severalwater-intensiveindustries,suchasprimarymetalmanufacturingandpaperman-ufacturing,havedeclinedintheU.S.,therebyreducingwaterwithdrawals.Otherindustrieshavefacedmorestringentwaterqualitystan-dardsundertheCleanWaterAct,whichmayhaveledtotheimplementationoftechnologiesorpracticesthatsavewater.8
Nationally,wateruseinthehomehasremainedstablesincethe1980s.Efficiencyandconservationeffortshavereducedpercapitahouseholdconsumptioninsomestatesandregions.Domesticwaterusehasbecomemore
Figure 1★ Water use and Population in the united States, 1950–2005
nTotalWithdrawals(billionsofgallonsperday)nPopulation(millions)
0
50
100
150
200
250
300
350
400
450
2005200019951990198519801975197019651960195519500
50
100
150
200
250
300
350
sourCeU.S.GeologicalSurvey.
Wit
HD
ra
Wa
lS
Po
Pu
la
tio
n

Failure to Act: The Economic Impact of Current Investment Trends in Water and Wastewater Treatment Infrastructure 9
efficientthroughtheuseofnewtechnologiessuchaswater-efficienttoiletsthatuseone-thirdofthewaterofoldertoilets.Inaddition,newtechnologiesandapproachesmayreducefuturewaterinfrastructureneeds.Forexample,manycitieshaverecentlyadoptedgreeninfrastructureapproachestowetweatheroverflowmanage-ment.Greenroofs,grassyswales,andraingardens,forexample,areusedtocaptureandreuseraintomimicnaturalwatersystems.Suchtechniquesoftenprovidefinancialsavingstocommunities.
Nevertheless,demandmanagementandsustainablepracticescannotsolvetheproblemalone.Theseeffortsarecounteredbyincreasingpopulationsinhotandaridregionsofthecountry—includingtheSouthwest,RockyMountains,andFarWest—wherethereisgreaterdomesticdemandforoutdoorwateruse.9
Inthisstudy,asecondscenariowasrun,whichassumedthattherewouldbeageneraladjustmentbybusinessesandhouseholdsasthecapitalgapworsened.Inthisscenario,negativeeconomicimpactsmountforabout25years—roughly2011–35,thoughataslowerpacethantheearlierscenario—andthenabateasincreasingnumbersofhouseholdsandbusinessesadjusttotherealityofdeficientinfra-structure,includingnetlossesof538,000jobsby2020and615,000jobsby2040.Inthisscenario,joblossespeakat800,000to830,000intheyears2030–32.
Inaddition,GDPwouldbeexpectedtofallby$65billionin2020and$115billionin2040.ThelowestpointsinthedeclineinGDPwouldbein2029–38,whenlosseswouldexceed$120bil-lionannually.After-taxpersonalincomelossesunderthisscenarioare$87billionin2020and$141billionin2040,whichrepresentsareboundfrom$156billionto$160billioninannuallossesintheyears2030–34.
The objectives and limits of This StudyThepurposeofthisstudyislimitedtopresentingtheeconomicconsequencesofthecontinuingunderinvestmentinAmerica’swater,wastewater,
andwetweathermanagementsystems.Itdoesnotaddresstheavailabilityorshortagesofwaterasanaturalresourceorthecostofdevelopingandharnessingnewwatersupplies.Joiningwaterdeliveryandwastewatertreatmentinfra-structurewiththecostsofdevelopingnewwatersuppliesisanappropriateandimportantsubjectforamoreextensivefollow-upstudy.Thisreportassumesthatthecurrentregulatoryenviron-mentwillremaininplaceandnochangestocurrentregulationswilloccur.Finally,thisworkisnotintendedtoproposeorimplyprescriptivepolicychanges.However,manyorganizationsandinterestgroups,includingASCE,continuetoengagewithpolicymakersatalllevelsofgovernmenttoseeksolutionstothenation’sinfrastructureproblems.
conclusionWell-maintainedpublicdrinkingwaterandwastewaterinfrastructureiscriticalforpublichealth,strongbusinesses,andcleanriversandaquifers.UptothismomentAmericanhouseholdsandbusinesseshaveneverhadtocontemplatehowmuchtheyarewillingtopayforwaterifitbecomeshardtoobtain.
Thisreportdocumentsthatcapitalspendinghasnotbeenkeepingpacewithneedsforwaterinfrastructure,andifthesetrendscontinue,theresultinggapwillonlywidenthrough2040.Asaresult,pipeswillleak,newfacilitiesrequiredtomeetstringentenvironmentalgoalswillbedelayed,O&Mwillbecomemoreexpen-sive,andwaterswillbepolluted.
Therearemultiplewaystopartiallyoffsetthesenegativeconsequences.Possiblepreventivemeasuresincludespendingmoreonexistingtechnologies,investingtodevelopnewtechnolo-giesandthenimplementingthem,andchangingpatternsinwhereandhowwelive.Allthesesolutionsinvolvecosts.Separatelyorincombi-nation,thesesolutionswillrequireactionsonnational,regional,orprivatelevels,andwillnotoccurautomatically.

10 American Society of Civil Engineers
introduCtion
the analysis presented in this report illustrates how
deficiencies in water delivery, wastewater treatment, and wet
weather management infrastructure affect the u.S. economy
and will continue to do so in the future. the report seeks
to highlight not only how deficient water systems impose
costs on households and businesses but also how these costs
affect the productivity and competitiveness of industries,
along with the well-being of households.
1
Thereportincludesthefollowingtopics:
★ anoverviewofwaterdeliveryandwaste-watertreatmentinfrastructure,
★ waterdemandbyregionandthesegmen-tationofconsumers,
★ theshortfallininfrastructureinvestment,★ theregionalimplicationsofthisshortfall,★ anoverviewofthemethodologyemployedtoassesseconomicperformance,and
★ theimplicationsoftheshortfallininfrastructureinvestmentfornationaleconomicperformance.
Thefinalsectionsincludeconclusions,adis-cussionofopportunitiesforfutureresearch,thesourcesandmethodologyused,andacknowledgments.
Thebasisfortheeconomicanalysisisdoc-umentationprovidedbytheEPAinstudiesanddatabasesdevelopedfrom1995through2010;researchbyindustrygroups,suchastheAmericanWaterWorksAssociationandtheNationalAssociationofWaterCompanies;andscholarshipbyandinterviewswithengi-neersandotherexpertsonwaterandsewers.Theneedtomaintaintheexistingwater

Failure to Act: The Economic Impact of Current Investment Trends in Water and Wastewater Treatment Infrastructure 11
delivery,wastewatertreatment,andrelatedsystemshavesignificantimplicationsforindus-trycompetitivenessandperformance,andalsothestandardsoflivingofhouseholds.
1.1 The objectives and limits of this StudyThepurposeofthisstudyislimitedtopresentingtheeconomicconsequencesofacontinuingtrendofunderinvestmentinAmerica’swaterandwastewatersystems.Itdoesnotaddresstheavailabilityorshortagesofwaterasanaturalresource,orthecostofdevelopingandharnessingnewwatersupplies,anditisnotintendedtopro-poseorimplyprescriptivepolicychanges.
Waterandwastewatercapitalspendingbyfederal,state,andlocalgovernmentshasincreasedconsistentlysince1956.Itisdifficulttopredictfuturelevelsofcapitalspendingbecauseawiderangeoffactorswillexertaninfluenceoverthecomingdecades.Spendingwillbeimpactedbythedegreetowhichinfra-structureactuallyfails,orispredictedtofail,inthenearfuture.Inaddition,capitalspendingwillrisetomeetrequirementsfromnewlawsandregulations.Regionalgrowthdifferencesinfuturepopulationandeconomicactivitywillalsoimpacttheallocationoffuturecapitalspending.Additionally,fundingtrendsarestronglyinflu-encedbypoliticalwill.Withoutattemptingtomodelthenumerouscomplicatedfactorslistedabove,alinearprojectionbasedonhistoricaldataprovidesareasonablelong-termtrendthatisconsistentwithpastpatterns.
Themostimportantchallengeinassessingtheeconomicconsequencesofunreliablewaterandwastewaterserviceisthateconomicdataandtoolstomanipulatethosedataarenotread-ilyavailable.Giventhislimitedinformation,assumptionsarerequiredtoweightheresponsesofbusinessesandhouseholdswhenfacedwith
deterioratingwaterandsewerserviceduetofailinginfrastructure.
Alternativesfacedbyconsuminghouseholdsandbusinessesarenotfeasibleonanationallevel.Oneormoreofthesealternativesmaybeviableforindividualcompaniesorhouseholds,dependingonthelocationandscaleofservicesneeded.Thesealternativesare,however,unre-alisticasleverstoaltersystemcapacityandreliabilityissuesnationwide.Today,alternativesaresummarizedby:
★ Adoptingfurthersustainablepracticesthroughchangesinactivityprocesses,orinstallationofnewequipment;10
★ Doingnothing—andlivingwithwaterdeliv-erydisruptionsandincreasedincidenceofcontaminationduetounreliabledeliveryandwastewatertreatmentservicesandhigherrates(rationingthroughpriceincreases);
★ Significantlyincreasingrelianceon“self-supply”forwatersupplyand/orwastewatertreatment(i.e.,buildingindividualwellsandsepticwastesystemswhenmunicipalfacilitiesandservicesarenotavailableoptions);and
★ Movingtowherewaterandwastewaterservicesarenothinderedbyfailinginfra-structure,ormovetoanareawhereself-supplyispermittedandpracticable;
Theeffectivenessoftheseresponsestofailingpublicinfrastructurewillvarybylocation,size,andtypeofbusiness.Forexample,privatewellandsepticinstallationsarenotverylikelytooccurincities,duetoenvironmentalandregula-toryfactors.Moreover,watersupplyconditionsvarywidelybylocation.Forexample,inmostofCaliforniaitisvirtuallyimpossibletoself-supply

12 American Society of Civil Engineers
water,butitispossibletoself-supplywastewatertreatment.Inadditiontotoday’stechnology,conservationcanaddressaportionofthesupplyproblem,butbyitselfitisnotasocietalsolutiontothebroaderproblemofagingandthedecliningperformanceofmunicipalinfrastructure.
Alltheseoptions,however,generateaddedcostsforhouseholdsandbusinessestablish-ments.Forthepurposesofthisstudy,thecostofself-supplyisestimatedforhouseholds,commercialestablishments,andmanufacturers,andisusedasabasistoestimatetherangeofaddedcoststhatmightbeincurredbyanyoftheseotheralternatives.
Householdsandbusinessesthatwouldorcouldnotself-supply(ormove,orobtainwater-conservingequipment)areassumedtoabsorbthehighercoststhatareaconsequenceofdisruptionsinwaterdeliveryandwastewatertreatmentduetoworseninginfrastructure.Thesecostsareassumedtobethesizeofthecapitalfundinggap,whichunderpresentinvest-menttrendsisexpectedtoreach$144billionby2040,unlessitisaddressedearlier.Theunderlyingassumptionforthiscostisthatthepricesofwaterandwastewatertreatmentwillincreaseasservicesneedtoberationedtostretchtheeffectivenessoftheinfrastructureinovercomingthecapitalgap.Usingthegaptoreflecthighercostsreflectstheconceptofrationingbyprice.
Summarydataandexpertinterviewswereusedtoconstructnationalandmultistateregionalestimatesofcosts.KeysourcesincludeanalysesconductedbytheEPAandotherresearchtoestimatethecapitalfundinggapanddemandbysectorandregion;theAmericanWaterWorksAssociation’s2010WaterandWastewaterRateSurvey,whichisasamplingofutilitydatabysizeanduserclass;andinterviewstobroadlyapproximatethecapitalandoperationsandmaintenancecostsofprivatesystems.
Asthisstudyislimitedtotheeconomiccon-sequencesofcurrentinvestmenttrends,itdoesnotincludethepotentialeconomicimpactsandbenefitsofconstructiontoclosethegapbetweentrendsandidentifiedneeds.Ananalysisthatincludestheeconomicimpactsofconstructionandhownewinvestmentwillaffecteconomicperformancewillvarydependingonthemixofsolutionsthatareimplemented.
in addition to today’s technology, conservation can address a portion of the supply problem, but by itself it is not a societal solution to the broader problem of aging and the declining performance of municipal infrastructure.

Failure to Act: The Economic Impact of Current Investment Trends in Water and Wastewater Treatment Infrastructure 13
oVerVieWoFWaterinFrastruCture
2.1 drinking-Water
nearly 170,000 public drinking-water systems are found
across the united States. of these, 54,000 are community water
systems that collectively serve more than 264 million people.
community water systems are those that serve more than 25
people a day, all year round. the remaining 114,000 systems
are non-community water systems, such as those for camp-
grounds and schools. only 43 percent of community water
systems are publicly owned; 33 percent are private, and the
balance are maintained by entities whose primary purpose
is something other than water provision.11
2
AsshowninFigure2,thenumberofpeoplewhosupplytheirownwaterusingdomesticwellsandspringshasremainedsteadysince1965.However,asthepopulationhasincreased,thepercentageofthepopulationservedbypublicsystemshasincreased.Thisincreasewasabout3percentperfiveyearsfrom1950to1965,butsincethepubliclysuppliedpopu-lationreached80percent,theincreasehasslowedtoabout1percentperfiveyears.
Thistrendislargelyexplainedbyamigra-tiontocities—theruralpopulationwas36percentofthetotalin1950butdroppedto16percentby2010.Additionally,eachyearnew
waterlinesareconstructed,connectingmoredistantdwellerstocentralizedsystems.
Althoughnewpipesarebeingaddedtoexpandserviceareas,drinking-watersystemsdegradeovertime,withtheusefullifeofcomponentpartsrangingfrom15to95years(Table4).Especiallyinthecountry’soldercit-ies,muchofthedrinking-waterinfrastructureisoldandinneedofreplacement.Failuresindrinking-waterinfrastructurecanresultinwaterdisruptions,impedimentstoemergencyresponse,anddamagetoothertypesofinfrastructure.12Inextremesituations,watershortages,whethercausedbyfailing

14 American Society of Civil Engineers
infrastructureorbydrought,mayresultinunsanitaryconditions,leadingtopublichealthconcerns.Brokenwatermainscandamageroad-waysandstructuresandhinderfire-controlefforts.Unscheduledrepairworktoaddressemergencypipefailuresmaycauseadditionaldisruptionstotransportationandcommerce.
2.2 WastewaterTherearefewerpublicwastewatersystemsthandrinking-watersystems.In2008,14,780waste-watertreatmentfacilitiesand19,739wastewaterpipesystemswereoperationalacrosstheU.S.13
In2002,98percentofpubliclyownedtreatmentworksweremunicipallyowned.14
Althoughaccesstocentralizedtreatmentiswidespread(Figure3),theconditionofmanyofthesesystemsispoor,withagingpipesandinadequatecapacityleadingtothedischargeofanestimated900billiongallonsofuntreatedsewageeachyear.15
Beforeabout1950,itwasacommonpracticetoconstructsystemsthatdirectedwetweatherrunoffintocombinedsewersystems,mixingdischargesknownaswetweatheroverflows(WWOs)withsanitarysewage.Manyofthesecombinedsystemsarestillinusetoday.When
Figure 2★ u.S. Population Served by Public Drinking-Water and by Self-Supply, 1950–2005 (millions)
0
50
100
150
200
250
300Domestic self-supply
Public supply
200520001995199019851980197519701965196019551950
sourCesMacKichan(1951,1957);MacKichanandKammerer(1961);Murray(1968);MurrayandReeves(1972,1977);Solley,Chase,andMann(1983);Solley,Merk,andPierce(1988);Solley,Pierce,andPerlman(1993,1998);Hutsonetal.(2004);Kennyetal.(2009).
nPublicSupplynDomesticSelf-Supply
38%29%
26%22%
20%19%
19%18%
17%
16%
15%
14%

Failure to Act: The Economic Impact of Current Investment Trends in Water and Wastewater Treatment Infrastructure 15
componenT uSeFul liFe (YearS)
Reservoirs and dams 50–80
Treatment plants—concrete structures 60–70
Treatment plants—mechanical and electrical 15–25
Trunk mains 65–95
Pumping stations—concrete structures 60–70
Pumping stations—mechanical and electrical 25
Distribution 60–95
sourCeEPA(2002,table2-1).
Table 4★ the useful lives of Drinking-Water System components
componenT uSeFul liFe (YearS)
Collections 80–100
Treatment plants—concrete structures 50
Treatment plants—mechanical and electrical 15–25
Force mains 25
Pumping stations—concrete structures 50
Pumping stations-mechanical and electrical 15
Interceptors 90–100
sourCeEPA(2002,table2-1).
Table 5★ the useful lives of Wastewater System components
especially in the country’s older cities, much of the drinking-water infrastructure is old and in need of replacement. Failures in drinking-water infrastructure can result in water disruptions, impediments to emergency response, and damage to other types of infrastructure.

16 American Society of Civil Engineers
aggravatedbyheavyrainandsnowmelt,increasedrunoffoverwhelmsthesewersystem,resultinginthereleaseofthecombinedsewageandstormwaterdirectlyintostreamsthroughWWOs.Inaddition,WWOsalsoresultinthedischargeofuntreatedsewage,butduetoaging
infrastructureratherthanbydesign.Duringwetweather,WWOsallowgroundwatertoseepintopipes,potentiallycausingasystemover-load.Asmoresystemsapproachandsurpasstheireffectivelifespans(Table5),WWOeventsbecomemorecommon.
Figure 3★ u.S. Population Served by Publicly owned Water treatment Works, 1940–2008 (millions)
0
50
100
150
200
250
No discharge
Advanced
Secondary
Less than secondary
Raw2
00
82
00
62
00
42
00
22
00
01
99
81
99
61
99
41
99
21
99
01
98
81
98
61
98
41
98
21
98
01
97
81
97
61
97
41
97
21
97
01
96
81
96
61
96
41
96
21
96
01
95
81
95
61
95
41
95
21
95
01
94
81
94
61
94
41
94
21
94
0
noteInadditiontothepopulationservedbypubliclyownedtreatmentworks,thisfigurealsoshowspopulationwithrawsewagedischarges.Thisfiguredoesnotshowpopulationservedbyonsitewastewatertreatmentsystems.
sourCesEPA2010,figureES-2,whichreferencesU.S.PublicHealthServiceandEPACleanWatershedsNeedsSurveys.
nNoDischargenAdvancednSecondarynLessthanSecondarynRaw

Failure to Act: The Economic Impact of Current Investment Trends in Water and Wastewater Treatment Infrastructure 17
tHeoVerallWaterandWasteWaterinFrastruCturegaP
the 30-year capital needs for maintaining and expanding the
united States’ water delivery systems, wastewater treatment
plants, and sanitary and storm sewer systems range from approx-
imately $91 billion in 2010, to $126 billion in 2020, to $195 billion
by 2040. these estimates are considerably higher than previous
ones—because they account for escalated costs, a previous
underreporting of local needs by communities, an extension
of analysis from 20 to 30 years of needs, and a more detailed
study of the needs to address raw sewage being discharged
from combined sewage overflows.
3
TheseestimatesareprimarilydrawnfromthefollowingcalculationsoftheEPA:
★ Nationaldrinking-waterneeds(DWNs)over20years,whichtheagencyhasupdatedevery4yearsfrom1995through2007.TheDWNsarebasedonwaterqual-ityproblems,orwater-quality-relatedpublichealthproblemsthatexistedwhenthereportswerereleased,orthatwereexpectedtooccurwithinthenext20years.Forexample,theneedsidentifiedinthe2007DWNsarethoseexpectedfrom2007through2026.16
★ Nationalcleanwatershedneedsover20years,whichtheagencyhasupdatedevery
4yearsfrom1996through2008.Figure6showstheseprogressing20-yearneedestimates.The20-yearneedforagivenyearreferstotheamountrequiredforinvestmentoverthenext20years.Forexample,the2004valueindicatesthatthecapitalneedintheyears2004–23wouldtotal$200billion.17
AsdocumentedbyEPA,20-yearcapitalneedsforwaterdistributionhaveincreaseddra-maticallysince1995.Capitalstockneedsfordrinking-waterarelargelytoaddresspipes(transmissionanddistributionlines),treat-mentsystems,storage,andsource.18Thepipesthatconstitutethetransmissionanddistribu-tionnetworkcovermorethanhalftheneeds

18 American Society of Civil Engineers
fordrinking-waterinfrastructure.EPA(2002)appliesasimpleagingmodeltopipes(normaldistribution)inthe20citiesstudiedbytheAmericanWaterWorksAssociation.Accordingtothismodel,thepeakreplacementneedper-centagewilloccurbetween2030and2040.
Cleanwatershedneeds(CWNs)arebasedonwaterqualityproblems,water-quality-relatedpublichealthproblemsthatexistedonJanuary1oftheCWNs’date,orthatwereexpectedtooccurwithinthenext20years.Forexample,theneedsidentifiedinthe2008CWNsarethoseexpectedfrom2008through2027.Oftheothersectors,WWOsconstitutethelargestportionofthewastewaterandwetweatherneeds;theneedforWWOshasremainedrelativelyconstantsince1996.Incontrast,severaltypesofneedshaveincreasedconsiderably.Bothcategoriesrelatedtothetreatmentplantsthemselves—secondarytreat-mentandadvancedwastewatertreatment—haverisingneeds.Theneedsrelatedtotheconstruc-tionofnewpipesarealsorising.Theneedsforwetweatherhandlingincreaseddramaticallybetween2004and2008,likelyreflectingthenewPhase2MS4requirementsthatbegantotakeeffectacrossthecountryintheearly2000s.
3.1 capital needs, 2010–40Fordrinking-water,wastewater,andwetweathermanagement,Figure4presentspastandprojectedspendingandthecapitalgapthat
islikelytooccurshouldfuturespendingfollowthispath.AsshowninTable6,theoverallcapitalgapforwaterinfrastructure—whichincludesdrinking-water,wastewater,andwetweather—isalreadysignificant:$54.8billionin2010.IfspendingincreasesatthemodestbuthistoricallyconsistentrateshowninFigure4,thegapwillincreaseto$84.4billionby2020and$143.7bil-lionby2040(inconstant2010dollars).19
Additionalfactorsmayresultinadditionalcostsinthefuture,whicharenotconsideredinthisgapanalysis.Thesemayincludethecon-sequencesofclimatechange—watershortages,flooddamagetoinfrastructure,andinfluxesofsaltwaterinnear-coastaquifers,andalsotheneedtoconstructandoperatemoretechnologi-callyadvancedandenergy-intensivetreatmentfacilities—wastewaterrecycling,theremovalofnewlyregulatedcontaminants,anddesalination.20
Thegapanalysisforroutineoperationsandmaintenance(O&M)needsindicatesthatifO&Mspendingcontinuestoincreaseataratesimilartothepast,spendingshouldkeeppacewithneeds,andnogapshoulddevelop.Thisisanunsurprisingoutcome,giventhatO&MneedsaregenerallyfundedthroughuserfeesandrateincreasesthatareintroducedtocoverrisingO&Mcosts.ThisresultisalsoconsistentwiththeEPA’sgapanalysis,whichfoundthatconsis-tentsmallincreasesinrateswouldbegenerallysufficienttopayforincreasingO&Mneeds.21
Year Spending need gap
2010 36.4 91.2 54.8
2020 41.5 125.9 84.4
2040 51.7 195.4 143.7
sourCesNeedscalculatedfromEPA(1997a,1997b,2001,2003,2005,2008,2009,2010).SpendingcalculatedfromCBO(2010)andUSCB(2011a,2011b).ConsumerpriceindexadjustmentfromBLS(2011).
Table 6★ overall annual capital Gap for Water infrastructure in 2010, 2020, and 2040 (2010 dollars in billions)

Failure to Act: The Economic Impact of Current Investment Trends in Water and Wastewater Treatment Infrastructure 19
However,aspecialburdenwillbeplacedonhouseholdsandbusinessesincitiesthathaveexperiencedpopulationdeclinesduringthelasthalf-century.
O&Mexpendituresforbothdrinking-waterandwastewatertreatmentinfrastructurehaveincreasedsteadilyoverthelastseveraldecades,
withspendingincreasingmorerapidlyintherecentpast.TheAmericanWaterWorksAsso-ciation(AWWA)hasnamedthistheDawnoftheReplacementEra,withthewaveofincreasedspendingpredictedtolast30yearsormore.22Theearliestpipesinstalledinthelate19thcen-turyhaveanaveragelifespanofabout120years,
Figure 4★ overall capital investment Gap for u.S. Water infrastructure, 1956–2040 (billions of 2010 dollars)
0
50
100
150
200
Capital gap
Capital spending
20
40
20
37
20
34
20
31
20
28
20
25
20
22
20
19
20
16
20
13
20
10
20
07
20
04
20
01
19
98
19
95
19
92
19
89
19
86
19
83
19
80
19
77
19
74
19
71
19
68
19
65
19
62
19
59
19
56
sourCesNeedscalculatedfromEPA(1997a,1997b,2001,2003,2005,2008,2009,2010).SpendingcalculatedfromCBO(2010)andUSCB(2011a,2011b).ConsumerpriceindexadjustmentfromBLS(2011).ProjectionsbyDownstreamStrategiesandEDRGroup.
nTotalCapitalGapnTotalCapitalSpending

20 American Society of Civil Engineers
butpipesinstalledafterWorldWarIIhaveashorterlifespan—about75years.Forthisreason,severalgenerationsofpipewillreachtheendoftheirusablelifewithinacoupleofdecades.Watermainsmustbereplacedregardlessofthenumberofcurrentusers,andbecauseO&Mneedsarefulfilledbytaxpayers,asmallerpopu-lationtranslatestohigherpercapitareplacementcosts.Also,smallandruralwaterutilitieswillexperiencehigher-than-averagepercapitareplacementcostsduetotheimpactofalackofeconomiesofscale.23
Figure5showsthedifferenceinneeds,expectedinvestments,andexpectedgapsfordrinking-waterandwastewatertreatmentfor2010,2020,and2040.Totalneedsfordrinking-waterdeliveryinfrastructureareestimatedtohavebeen$35billionin2010,andescalateto$48billionby2020and$74billionby2040(allvalues
arein2010dollars).Althoughmorethanhalfofdrinking-waterneedswerefundedin2010(58percentofthetotalneed),thedollarsexpectedtobeinvestedfalltounder50percentofthetotalneedby2020andto40percentby2040.Inlook-ingatthewastewatertreatmentinfrastructure,theestimateoftotalneedin2010is$40billion,escalatingto$78billionin2020andtonearly$122billionby2040.However,in2010,lessthan30percentofwastewaterinfrastructureneedsweremet,andthisratioofinvestmenttototalneedisexpectedtofallto23percentby2020andto18percentby2040.
Overall,underpresentconsumptiontrendsandtechnologies,theU.S.willneed$126billionininvestmentforwaterandwastewatertreat-mentinfrastructureby2020,and$196billionby2040.However,basedoncurrentinvestment
Figure 5★ expected Wastewater treatment and Drinking-Water infrastructure needs and investments in the u.S., 2011, 2020 and 2040 (billions of 2010 dollars)
sourCesNeedscalculatedfromEPA(1997a,1997b,2001,2003,2005,2008,2009,2010).SpendingcalculatedfromCBO(2010)andUSCB(2011a,2011b).ConsumerpriceindexadjustmentfromBLS(2011).ProjectionsbyDownstreamStrategiesandEDRGroup.
nFundednUnfunded
0% 10% 20% 30% 40% 50% 60% 70% 80% 90% 100%
% Unfunded
a
2040
2020
2011
2040
2020
2011
WaSteWater
treatment
DrinkinG Water
$16.1 billion $42.2 billion
$20.8 billion $15.5 billion
$18.0 billion $60.0 billion
$23.5 billion $24.5 billion
$22.2 billion $99.5 billion
$29.5 billion $44.3 billion

Failure to Act: The Economic Impact of Current Investment Trends in Water and Wastewater Treatment Infrastructure 21
patterns,only33centsonthedollarwillbefundedin2020,fallingto26centsby2040.
EPAdocumentshistoricalcapitalspendingandtrendsinfour-yeartimespansforwaterdeliveryinvestments(1995–2007)andwaste-watertreatmentinfrastructure(1996–2008).Inconstant2010dollars,historicaltrendsshowfed-eral,state,andlocalgovernmentinvestmentsinwaterdeliveryrisingby64percentfrom1995to2007andinwastewatertreatmentsystemsby43percentfrom1996to2008.However,giventheagingofcurrentinfrastructurecoupledwithnationalpopulationgrowth,totalcapitalneedsincreasedby94percentfordrinking-waterand115percentforwastewatertreatmentduringthesameperiods.AsshowninTable7,thisgapisexpectedtobefurtherexacerbatedby2040.
Onatrends-extendedbasis,capitalspendingforwaterdeliveryandwastewatertreatmentinfrastructureisexpectedtocontinuallyincreasefromnowto2040.Inconstant2010value,thedataavailablefromthemid-1950sshowthatcapitalspendingforwaterdeliveryhasgrownfrom$6billionin1956,to$21billionin2007.16Similarly,capitalspendingforwaste-watertreatmentinfrastructurewas$4billionin1956and$18billionin2007.Thesetrendsimplyaninvestmentof$30billionfordrinking-waterand$22billionforwastewaterby2040.Figures6and7illustratethehistoricalandtrendsextendedextrapolationsofwaterandwastewatertreatmentinfrastructure.
Althoughcapitalinvestmentinupgradedwaterandwastewatertreatmentinfrastructureisexpectedtoincreasethrough2040,needs,
Table 7★ changes in u.S. capital Spending by Federal, State, and local Governments for Water Delivery and Wastewater treatment, 1995–2040
Year or change Spending needS
Water delivery 1995 a $13 $17
2007 a $21 $33
% change, 1995–2007 64 94
2040 b $29 $74
% change, 2007–40 40 121
Wastewater treatment 1996 a $11 $24
2008 a $15 $52
% change, 1996–2008 43 115
2040 b $22 $122
% change, 2008–40 43 136
notePercentagesmaynotcalculateduetorounding.aHistorical.bTrends-extendedprojection.
sourCesEPA1995to2008andtrendsexpendedprojectionsfrom2007(water)and2008(wastewater)through2040,calculatedbyDownstreamStrategies.

22 American Society of Civil Engineers
Figure 7★ annual capital needs, 1995–2040 (billions of 2010 dollars)
nDrinking-waternWastewaterandWetWeatherOverflows
0
20
40
60
80
100
120
140
2040203520302025202020152010200520001995
sourCesEPAto2008(water)and2009(wastewaterandwetweather),Trend-lineprojectionfrom2008(water)and2009(wastewaterandwetweather)through2040calculatedbyDownstreamStrategies.
Figure 6★ Spending by Federal, State, and local Governments, 1956–2040(billions of 2010 dollars)
nWaterDeliveryCapitalnWastewaterTreatmentCapital
0
5
10
15
20
25
30
35
204020352030202520202015201020052000199519901985198019751970196519601956
sourCesEPAto2007(water)and2008(wastewater),trend-lineprojectionfrom2007(water)and2008(wastewater)through2040calculatedbyDownstreamStrategies.

Failure to Act: The Economic Impact of Current Investment Trends in Water and Wastewater Treatment Infrastructure 23
andthereforethecapitalspendinggapisexpectedtogrowatafasterratethanspendingoverthecoming30years.
3.2 comparison of the gap to the national economyThegapbetweenexpectedcapitalneedsandexpendituresforwaterdeliveryandwastewatertreatmentinfrastructureisexpectedtogrowfasterthangrowthinemployment,income,andGDP.Thisistrue,evenbeforeaccountingformacroeconomicimpactsfromashortfallin
waterandwastewaterinfrastructureinvest-ment,nottomentiontheneedstoaddressfailinginfrastructureinsurfacetransportation,energytransmissionservices,marineports,andairports.AsshowninTable8,thewaterandwastewatertreatmentinfrastructureinvest-mentgapgrowsatfasterratesthanincomeorGDP,whetherintotalvaluesorweightedbypopulation.Thegrowthofthegapwillplaceincreasinglygreaterstrainsonhouseholdsandindustriesbetweentodayand2040.
meaSure annual value (2010 dollarS) percenT change
2010 2020 2040 2010–20 2020–40 2010–40
aGGreGate
Water infrastructure gap (billions) $54.8 $84.4 $143.7 54 70 162
U.S. GDP (billions) $14,613 $19,066 $28,453 30 49 95
Personal income (billions) $6,446 $9,236 $14,581 43 58 126
WeiGHteD
Gap per capita $177 $248 $354 40 43 100
Gap per household $464 $645 $916 39 42 97
Per capita income $20,795 $27,085 $35,913 30 33 73
Per worker income $49,655 $61,853 $84,749 25 37 71
GDP per capita $47,139 $55,911 $70,080 19 25 49
GDP per worker $112,561 $127,680 $165,380 13 30 47
note“Aggregatemeasures”aredisplayedinbillionsof2010dollars.However,“weightedmeasures”areshowninsingle2010dollarsandarenotrounded.
sourCesMoodys.comforprojectionsforemployment,GDP,andpersonalincome.PopulationandhouseholdhadareguidedbytheprojectionsoftheSocialSecurityAdministrationandwereaggregatedbytheINFORUMresearchunitoftheUniversityofMaryland.
Table 8★ comparative changes of the Water and Wastewater treatment capital Spending Gap and the u.S. economy in 2010, 2020, and 2040
24 American Society of Civil Engineers
regionaloVerVieW
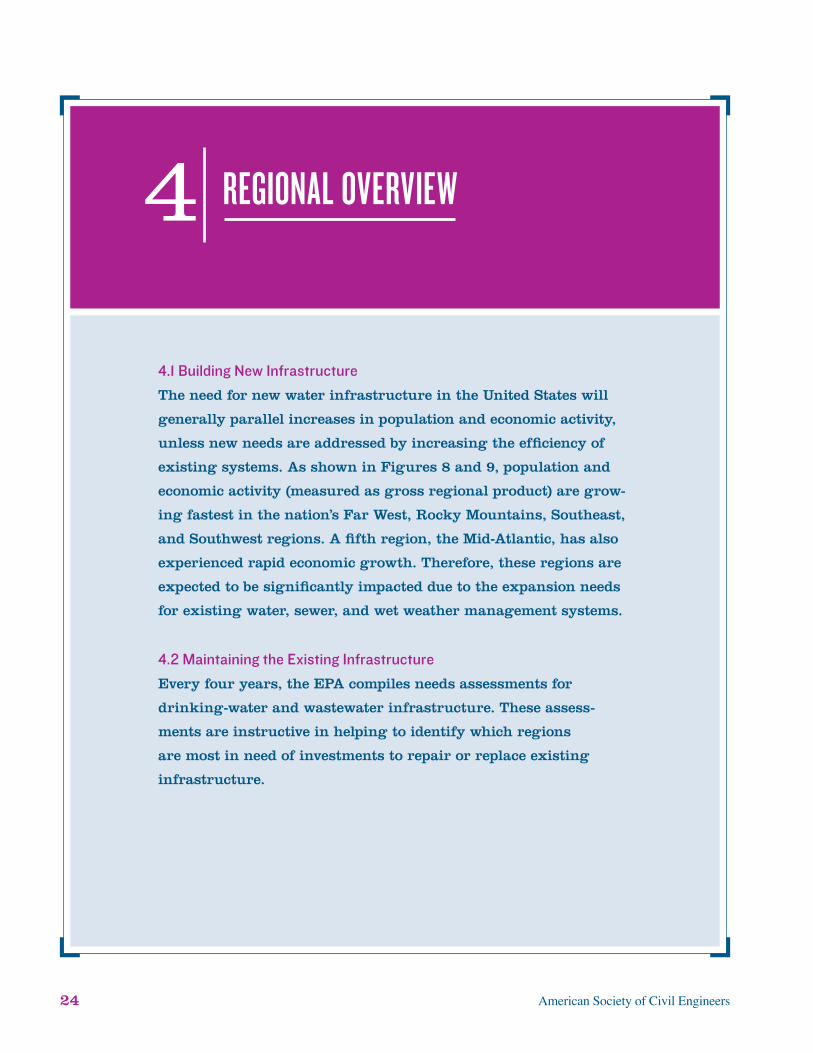
4.1 building new infrastructure
the need for new water infrastructure in the united States will
generally parallel increases in population and economic activity,
unless new needs are addressed by increasing the efficiency of
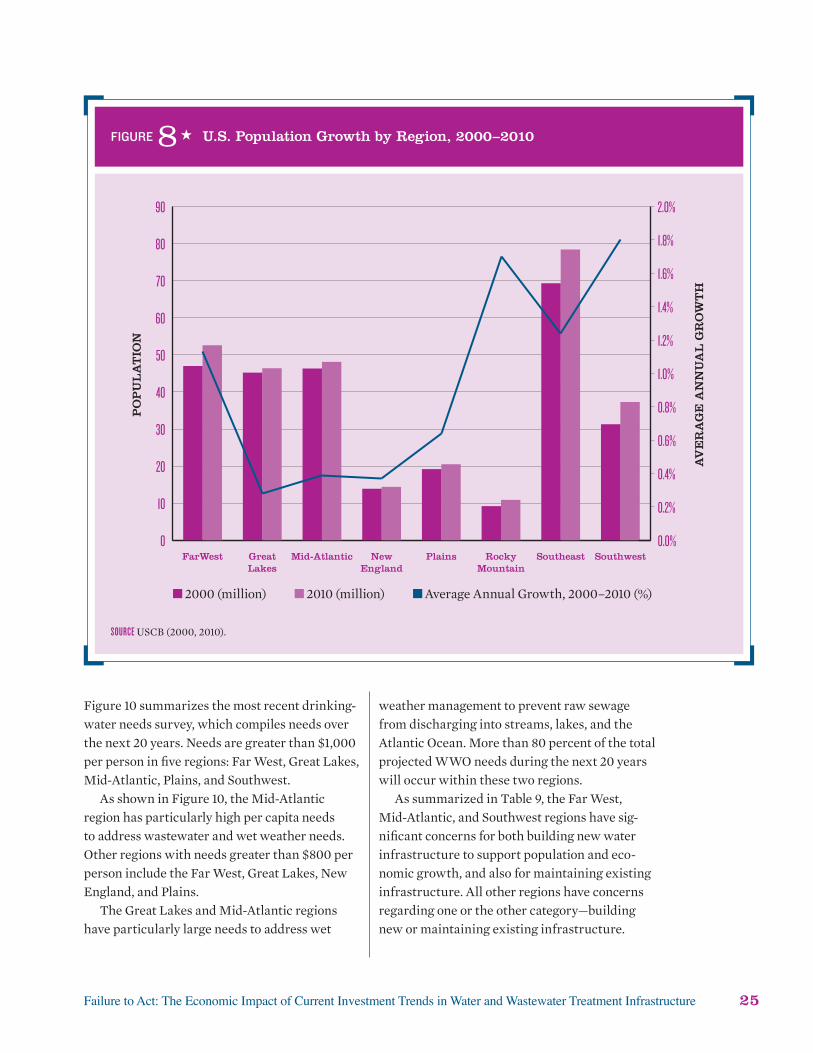
existing systems. as shown in Figures 8 and 9, population and
economic activity (measured as gross regional product) are grow-
ing fastest in the nation’s Far West, rocky mountains, Southeast,
and Southwest regions. a fifth region, the mid-atlantic, has also
experienced rapid economic growth. therefore, these regions are
expected to be significantly impacted due to the expansion needs
for existing water, sewer, and wet weather management systems.
4.2 maintaining the existing infrastructure
every four years, the ePa compiles needs assessments for
drinking-water and wastewater infrastructure. these assess-
ments are instructive in helping to identify which regions
are most in need of investments to repair or replace existing
infrastructure.
4
Failure to Act: The Economic Impact of Current Investment Trends in Water and Wastewater Treatment Infrastructure 25
Figure10summarizesthemostrecentdrinking-waterneedssurvey,whichcompilesneedsoverthenext20years.Needsaregreaterthan$1,000perpersoninfiveregions:FarWest,GreatLakes,Mid-Atlantic,Plains,andSouthwest.
AsshowninFigure10,theMid-Atlanticregionhasparticularlyhighpercapitaneedstoaddresswastewaterandwetweatherneeds.Otherregionswithneedsgreaterthan$800perpersonincludetheFarWest,GreatLakes,NewEngland,andPlains.
TheGreatLakesandMid-Atlanticregionshaveparticularlylargeneedstoaddresswet
weathermanagementtopreventrawsewagefromdischargingintostreams,lakes,andtheAtlanticOcean.Morethan80percentofthetotalprojectedWWOneedsduringthenext20yearswilloccurwithinthesetworegions.
AssummarizedinTable9,theFarWest,Mid-Atlantic,andSouthwestregionshavesig-nificantconcernsforbothbuildingnewwaterinfrastructuretosupportpopulationandeco-nomicgrowth,andalsoformaintainingexistinginfrastructure.Allotherregionshaveconcernsregardingoneortheothercategory—buildingnewormaintainingexistinginfrastructure.
Figure 8★ u.S. Population Growth by region, 2000–2010
0
10
20
30
40
50
60
70
80
90
SouthwestSoutheastRockyMountain
PlainsNewEngland
Mid-AtlanticGreatLakes
FarWest0.0%
0.2%
0.4%
0.6%
0.8%
1.0%
1.2%
1.4%
1.6%
1.8%
2.0%
sourCeUSCB(2000,2010).
n2000(million)n2010(million)nAverageAnnualGrowth,2000–2010(%)
Po
Pu
la
tio
n
av
er
aG
e a
nn
ua
l G
ro
Wt
H

26 American Society of Civil Engineers
Figure 9★ Gross regional Product Growth, 2000–2010
0.0
0.5
1.0
1.5
2.0
2.5
3.0
3.5
SouthwestSoutheastRockyMountain
PlainsNewEngland
Mid-AtlanticGreatLakes
Far West0.0%
0.5%
1.0%
1.5%
2.0%
2.5%
3.0%
sourCesGDPfromBEA(2011).ConsumerpriceindexadjustmentfromBLS(2011).
n2000(trillion)n2010(trillion)nAverageAnnualGrowth,2000–2010(%)
GD
P
av
er
aG
e a
nn
ua
l G
ro
Wt
H
population and economic activity are growing fastest in the nation’s Far West, rocky mountains, Southeast, and Southwest regions. a fifth region, the mid-atlantic, has also experienced rapid economic growth.

Failure to Act: The Economic Impact of Current Investment Trends in Water and Wastewater Treatment Infrastructure 27
Figure 10★ Per capita 20-Year needs by region
$0$200$400$600$800
$1,000$1,200$1,400$1,600$1,800
$2,000
SouthwestSoutheastRocky Mountain
PlainsNew England
Mid-AtlanticGreat Lakes
Far West
sourCesEPA(2009,2010).PopulationfromUSCB(2010).
nDrinkingWaternWastewaterandStormwaternWetWeatherOverflows
mainTaining exiSTing mainTaining exiSTing
building neW drinking-WaTer WaSTeWaTer and WeT
region inFraSTrucTure inFraSTrucTure WeaTher inFraSTrucTure
Far West X X X
Great Lakes X X
Mid-Atlantic X X X
New England X
Plains X X
Rocky Mountains X
Southeast X
Southwest X X
noteRegionsareagglomerationsofstatesandthereforeissuedfacedbyindividualstates,citiesorsubstateareasaresubsumedintheoverallregionaltotals.Forexample,buildingnewinfrastructureisidentifiedasaneedintheRockyMountainRegion.YetinmetroareaslikeDenverthegreatestexpenditurewillbeinreplacingandupdatingexistinginfrastructure.
sourCesSynthesisbyDownstreamStrategiesandEDRGroupbasedonfigures8–10andassociateddiscussion.
Table 9★ regional concerns regarding Building new or maintaining the existing Water infrastructure

28 American Society of Civil Engineers
analYtiCalFrameWorK5
5.1 The Funding gap
the first step is comparing the two alternative scenarios, to
calculate the funding gap between what would be needed to
maintain the u.S. water and sewer infrastructure and operating
systems to meet anticipated future needs, and what is expected to
be spent given current investment trends. this chapter describes
the analytical process for calculating the 2010–40 funding gap.
in summary, the gap between needs and investment in water
and sewer infrastructure is $55 billion in 2010 and is expected
to grow to $144 billion (in 2010 dollars) by 2040 if present trends
in investment and demand by households and businesses continue.
5.2 costs incurred by households and businessesThesecondstepistoidentifythecostsincurredbyhouseholdsandbusinessesdur-ingthe2010–40periodifcurrentinvestmenttrendsprevailandthenation’swaterandsewerfacilitiesdegradeinperformanceandcapacity.Ouranalysisoftheseconsequencesisbasedoncombiningthefollowingfactors:
★ Averageratesforwaterandsewerserviceandpasttrendsofratechanges;
★ Estimatesofoperationandmaintenancechargesforself-supplysystems;
★ Numberofhouseholdsdependentonpublicwatersystems;
★ Adjustmentsformultiplehouseholdsandbusinessestablishmentsonasingleparcel;
★ Numberofestablishmentsbysizeandtype(commercial, industrial)thatdonotself-supply;and
★ Estimatesforcapitalcostsforconsuminghouseholdsandbusinessestoself-supplywaterandsewerservices.
Usingthesefactorsandtherelatedassump-tions,by2020theapproximate$84billionforecastannualdeficitforsustainingwater

Failure to Act: The Economic Impact of Current Investment Trends in Water and Wastewater Treatment Infrastructure 29
deliveryandwastewatertreatmentinfra-structuremayleadto$38billionincostsforbusinessesandhouseholdsinthatyearandmorethan$200billionincumulativecostsfrom2011(Table2).Withthecontinuedgrowthofthegapto$144billionby2040,costsaccruingtobusi-nessesandhouseholdsmaybeanadditional$200billionthatyearandby2040amounttoacumulativetotalexceeding$2trillion.Keyanalysisandassumptionsarenotedbelow.
private Water and Sewer alternativesDiggingawellandinstallingasepticsystemisoneoptionforahouseholdandbusinesstorespondtoinadequateinfrastructure,althoughitisnotareasonableresponseforeverylocation(e.g.,acityoralocationwithoutwater,orplaceswherelegalregulationsprohibitsomeorallprivateoptions)orachoicethateverybusinessorhouseholdthatcoulddosowouldpick.Otherpossibleresponsesincludemovingahouseholdorbusinesstoaplacewithadequatewaterandwastewatertreatmentservices,andpurchasingandinstallingequipmentthatwillconservewater.Forthepurposeofthisstudy,weusethecustomer’sresponseofprivatizingasastand-inforallpossibleresponsesunderthepremisethatallpossibleresponsesincurcosts,
andthecostofprivatizationisareasonableproxyforotheradjustments.
Therateofannualself-supplyresponseisassumedtotracktheannualgrowthinthewaterandwastewaterinvestmentgap.Thus,asthegapworsensourscenarioshowsanincreasingnumberofbusinessesandhouseholdshedgingagainstthecostsassociatedwithdeterioratingwaterdeliveryandwastewatertreatmentandreliabilityofservices.
Self-supplycostsdifferbycountlessfactors.Somedependonlocation—includingtheprox-imityofthewatersourceandthescaleofconstructionrequiredtotapthesource—andonlocalregulations.Otherfactorsarerelatedtotheamountofwaterandthesizeofthesepticsystemsdesired.Relatedtothisisthesizeofahousingunit,includingdifferentscalesofsingle-familyhomesandmultifamilydevelopments.Forcommercialandindustrialuse,thetypeandsizeofthebusinessmustbetakenintoaccount,aswellaswhetherthebusinessphysicallystandsaloneorisinanofficebuildingorretailmall.
Wedevelopedoverarchingassumptionsaboutthecostofself-supplythroughaseriesofconsultationswithdesign-buildfirmsandcivilengineersindependentofASCE.Forcommercialandindustrialsectors,onetimecapitalcosts
Sector coStS, 2011–20 coStS, 2021–40 coStS, 2011–40
cumulaTive annual cumulaTive annual cumulaTive annual
Households $59 $6 $557 $28 $616 $21
Businesses $147 $15 $1,487 $74 $1,634 $54
totalS $206 $21 $2,044 $102 $2,250 $75
noteNumbersmaynotaddduetorounding.
sourCesEDRGroupbasedoninterviews,establishmentcounts,andsizesbysectorfromCounty Business Patterns,populationforecastsoftheU.S.Census,andforecastsofestablishmentsandhouseholdsprovidedbytheINFORUMGroupoftheUniversityofMaryland.
Table 2★ estimated costs for u.S. Households and Businesses due to unreliable Water and Wastewater infrastructure (billions of 2010 dollars)
30 American Society of Civil Engineers
rangefrom$500,000tomorethan$1.5million,thoughforthisstudysuchcostswerecappedat$1millionandwereassumedtobeatthelowerendofthescaleforallexceptthelargestbusi-nessestablishmentsintheU.S.Forhouseholds,diggingawellwasestimatedatatypicalrangeof$8,000to$10,000,andinstallingasepticsystemwasestimatedbetween$25,000and$50,000.24Privatecostsforannualoperationandmainte-nancewereestimatedbyintervieweesatrunningatabout$45,000forcommercialandindustrialuse,and$1,000forhouseholds.25
Itshouldbementionedthatnewtechnolo-giesandapproachesmayreducefuturewaterinfrastructureneeds.Forexample,manycit-ieshaverecentlyadoptedgreeninfrastructureapproachestowetweatheroverflowmanage-ment.Greenroofs,grassyswales,andraingardens,forexample,areusedtoinfiltrate,evapotranspire,andcaptureandreuseraintomimicnaturalwatersystems.Suchtechniquesoftenprovidefinancialsavingstocommunities.
average Water ratesThe2010 Water and Wastewater SurveybytheAmericanWaterWorksAssociationreportedwaterandwastewaterratesfor308waterutili-tiesand228wastewaterutilitiesbysizeofutilityandmillionsofgallonsperdayconsumedbyusers.Fiveclassesofresidentialrangesandfourclassesofcommercialandindustrialrangeswereidentified.Weaveragedtheratesandchargesforresidential,commercial,andindustrialcustom-ersnationallyandbymultistateregionaccordingtothelocationandsizeofeachutility.
number of businesses and householdsOurdataonthenumberofbusinessestablish-mentsbysizeandregionweretakenfromU.S. County Business Patternsandaggregatedbycommercialandindustrialclassifications.Themostrecentdataavailablearefor2009,andthesedatawereprojectedto2040basedonemploy-mentprojectsbysectorobtainedfromMoodys.com.HouseholdprojectionswereprovidedbytheINFORUMResearchUnitoftheUniversity
ofMarylandandwereguidedbyprojectionsfromtheSocialSecurityAdministration.
costs among industries and householdsThemostrecentnationalanalysisbysectorbasedonU.S.GeologicalSurveydatawasconductedin1995andshowsthathouseholdsaccountfor56percentofpublicwaterdemand,commercialsectorsaccountfor17percent,industrialsec-torsaccountfor12percent,andpublicusesandlossesmakeuptheremaining15percent.Tenyearslater,theanalysiswascompletedwithoutthisdegreeofdetail,butitshowsthathouseholdsdraw58percentofwaternationally,whichwassimilartothe1995findings.Ifthecostofwaterrisesduetodeficientinfrastructure,thequestionishowcostswillbespreadacrosstheeconomy.Westartedwiththebaseofdemandacrossbroadlydefinedsectors:56percenthouseholds,17percentcommercialestablishments,and12percentindustrialestablishments.Wethenmadeanassumptionthathouseholds,whicharemadeupofvoters,willinsistthatcostsbeassignedtobusinesses,followingthepatternofmanycom-munitiesthathavedualpropertytaxratesanddualutilityrates—oneforhouseholds,andoneforbusinesses.Forthisanalysis,futurecostsareallo-catedtohouseholdsat33percent,thecommercialsectorat24percent,andtheindustrialsectorat28percent.Thesignificantincreaseintheindus-trialsector’sshareisbasedonthelistofkeywaterdependentindustries,whichareallindus-trial,and28ofthetop30water-intensivesectors,includingthetop20,areindustrial.26
The incidence of Waterborne illnessesDeficienciesinthesystemsusedforthepublic-provisionofdrinkingwaterandthehandlingofwastewaterandstormwatercantriggerbacterialandviraloutbreaks.TheEPAandtheCentersforDiseaseControlandPreventionhavetrackedthe30-year27incidenceofwater-borneillnessesacrosstheU.S.,categorizedthetypeofillness,andhavedevelopedamonetaryburdenforthosecases.Basedontheannualpercentageincreaseinthecapitalspendinggapprojectedthrough

Failure to Act: The Economic Impact of Current Investment Trends in Water and Wastewater Treatment Infrastructure 31
2040,themonetaryburdenforwater-borneill-nessisestimatedtobe$413millionfor2011–20and$1.3billionfor2021–40.28Toputthesecostsinperspective,by2040theU.S.percapitacumu-lativeimpactsofwater-borneillnessesinthefaceofanincreasinginfrastructuregapareestimatedtobe$4.89andtofluctuatebetween$.11and$.21peryearfrom2011to2040.AWorldHealthOrganizationreportestimatesthatthepercapitaworldwideeffectsofwater-borneillnesseswillbe$98in2015.29
adjustments for multiple households and business establishments on Single parcelsThefindingsdiscussedabovewereadjustedtoreflectmultiplehousingunitsandbusinessestab-lishmentsonsingleparcelsbasedonnationaldata.AccordingtothedatareportedbytheU.S.CensusBureau’s“2005–2009AmericanCommunitySur-vey,”roughly128millionhousingunitsareplacedon100millionparcels.Therefore,thehouseholdimpactswerediscountedby21.5percent.
Inaddition,theU.S.EnergyInformationAdministration(EIA)calculatedthat705,000officebuildingsintheU.S.containatotalof1.6millionestablishments,anaverageof2.3perbuilding.Thisisslightlymorethantheaveragenumberofestablishmentsinothertypesofcommercialbuildings(1.7perbuilding)andretail(1.8perbuilding).Nevertheless,alargemajority(70percent)ofofficebuildingshaveonlyoneestablishment.Tobecautious,theofficeratioof2.3wasusedforthisanalysis,andcommercialestablishmentswerediscountedby56.5percent.30UsingtheEIAaverageof1.7wouldproducealowerreductionofestablish-ments(e.g.,usingthe1.7averagewouldresultinareductionrateof41percent).
The broader effects on the nation’s economyThefinalstepistocalculatehowthesecostsultimatelyaffectthenation’seconomy.First,theaddedcostsoffailingtoadequatelyinvestinwaterandsewerinfrastructurewereallocatedtoindustriesandsectorsoftheeconomybasedon
waterrelianceandusagerates.ThentheLIFT(Long-termInter-industryForecastingTool)economicmodelwasusedtocalculatehowtheseaddedhouseholdandbusinesscostswill,overtime,ultimatelyaffectexpenditurepatternsandbusinessproductivityamongindustries,leadingtochangesinthenation’scompetitivenessandeconomicgrowth.Theresultsareprovidedaslong-termchangesinjobsandincomeintheU.S.TheLIFTmodelisanationalpolicyandimpactforecastingsystemdevelopedbyINFORUM,aresearchcenterwithintheDepartmentofEconomicsattheUniversityofMaryland,CollegePark.
5.3 Water-intensive industriesThissectionexaminessectorsoftheU.S.econ-omythataremostdependentonpublicwater/wastewaterinfrastructure.Morikawaetal.(2007)lists11industrysectorsthatarehighlydependentonwaterresourcesorvulnerabletowaterrisks.Thesearenotnecessarilytheelevenmostwater-intensiveindustriesacrosstheU.S.butareindustriesthatmostrelyondependablecleanwatersupply.Thereisoverlapinthewater-intensiveandwater-dependentanalysespresented(chemicals,beverages,foodprocess-ing,butnotablycoreindustriesofautomobilemanufacturing,biotechnology/pharmaceuticalsandelectronicsareclassifiedasamongthemostwaterdependentsectorsintheU.S.economy.Thesearekeyindustrialsectorsofthenationaleconomy,andinclude:
★ Apparel★ Automobile.★ Beverage.★ Biotech/Pharmaceutical★ Chemical,★ ForestProducts,★ FoodManufacturing,★ High-technology/Electronics,★ Metal/Mining,★ Refining,and★ Utilities.

32 American Society of Civil Engineers
Ontheotherhand,Blackhurstetal.(2010)esti-matewaterwithdrawalsfor426sectorsintheU.S.economy.TheystartwithUSGSdatafrom2000,andfirstdisaggregatethepublicsupplysector.Householddeliveriesfrompublicsupplyaresubtractedfromtotalpublicsupply,andtheremainingwaterisallocatedto379economicsectorsbasedontheirshareofpurchasesfromthe“water,sewageandothersystems”sector.31Forsectorswithunreporteddata,theauthorsusecomparableratesforsimilarservicesectors.Theauthorsthenaddinself-suppliedindustrialwithdrawalsfor30sectorsinthefollowingindustries:food,textile,wood,paper,petroleum,chemical,plastic,andprimarymetals.Black-hurst’sfindingsconcludethat15ofthe20mostwater-intensivesectors,measuredbydirect
wateruseperdollarofoutput,arecomprisedofagricultural,miningorpowergenerationindus-triesand,therefore,likelyrelyonself-suppliedwaterandwastewaterservices.
Table10 illustratesthe10mostwater-intensivesectorsotherthanagricultural,mining,andelectricpowergenerationsectors,whichtogetheraccountforpreponderancelargeproportionofself-suppliedwater.Awiderangeofindustriesarewater-dependent.Thetoptwosectors,aswellasseveralothers,arewithinthechemicalindustry.Itisimportanttonotethatthisincludesestimatesofbothpubliclysuppliedandself-suppliedwater,andtherefore,doesnotprovideadirectestimateofthesectorsthatmostrelyonpublicwaterinfrastructure.
induSTrY gallonS/$ ouTpuT
Paint & coating manufacturing 123
Alkalies & chlorine manufacturing 38
Paperboard mills 36
Wineries 34
Pesticide & other agricultural chemical manufacturing 30
Synthetic dye & pigment manufacturing 27
Adhesive manufacturing 21
Industrial gas manufacturing 21
Distilleries 14
Poultry processing 14
Next 20 most intensive sectors 128
sourCeBlackhurstetal.(2010)SupplementalMaterials.Note:Theseestimatesincludeself-suppliedwaterandwaterpurchasedfromprivatewaterandsewersystems,butdonotincludewaterpurchasedfromgovernment-ownedsystems.Estimatesexcludeagricultural,mining,andelectricalpowergenerationsectors,whichareprimarilyself-supplied.
Table 10★ top Water-intensive industries in the u.S. (direct water use per dollar output)
Failure to Act: The Economic Impact of Current Investment Trends in Water and Wastewater Treatment Infrastructure 33
eConomiCimPaCts
negative impacts on the u.S. economy are a result of businesses and
households managing unreliable water delivery and wastewater
treatment services, which in turn result from a lack of investment
in the national water network. Strategies such as relocation, invest-
ing in conservation technologies, and self-supplying services can
create costs that reduce business income (and, as a consequence,
productivity and wages). costs associated with water-borne
illnesses and higher utility rates divert income from other uses.
6
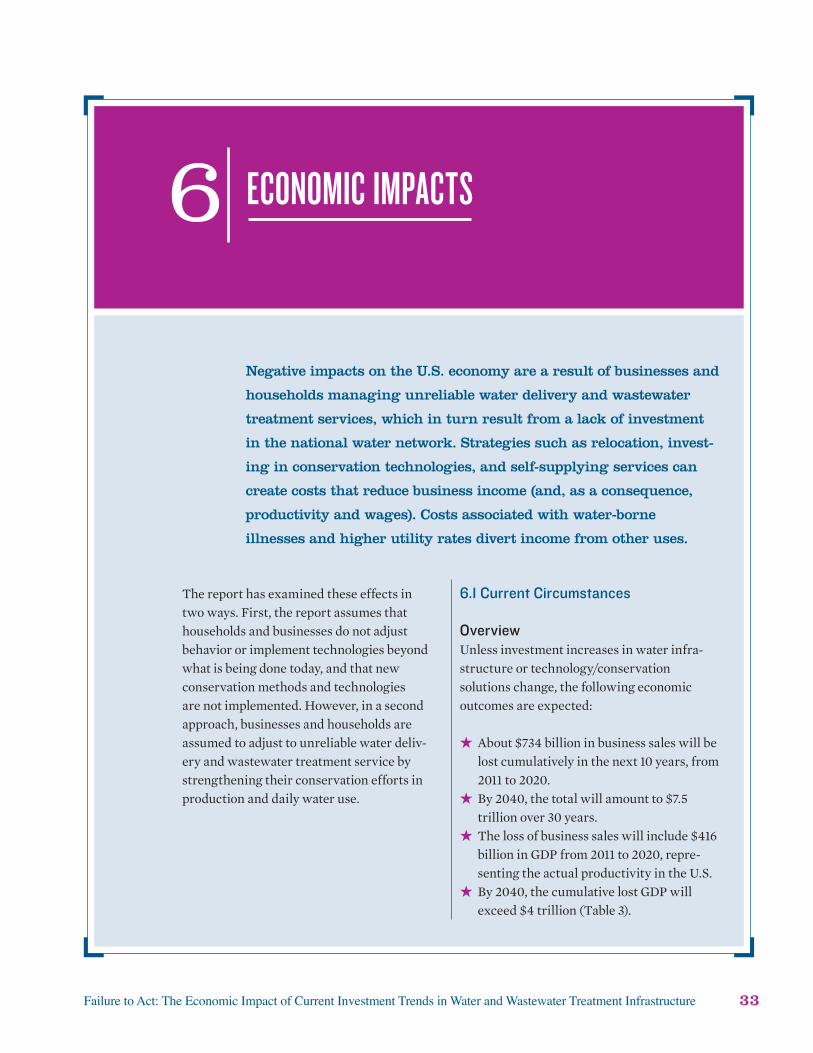
Thereporthasexaminedtheseeffectsintwoways.First,thereportassumesthathouseholdsandbusinessesdonotadjustbehaviororimplementtechnologiesbeyondwhatisbeingdonetoday,andthatnewconservationmethodsandtechnologiesarenotimplemented.However,inasecondapproach,businessesandhouseholdsareassumedtoadjusttounreliablewaterdeliv-eryandwastewatertreatmentservicebystrengtheningtheirconservationeffortsinproductionanddailywateruse.
6.1 current circumstances
overviewUnlessinvestmentincreasesinwaterinfra-structureortechnology/conservationsolutionschange,thefollowingeconomicoutcomesareexpected:
★ About$734billioninbusinesssaleswillbelostcumulativelyinthenext10years,from2011to2020.
★ By2040,thetotalwillamountto$7.5trillionover30years.
★ Thelossofbusinesssaleswillinclude$416billioninGDPfrom2011to2020,repre-sentingtheactualproductivityintheU.S.
★ By2040,thecumulativelostGDPwillexceed$4trillion(Table3).

34 American Society of Civil Engineers
diSpoSable diSpoSable diSpoSable
perSonal perSonal perSonal
JobS income income income per
(rounded (billionS oF per capiTa houSehold
Year To 100,000) 2010 dollarS) (2010 dollarS) (2010 dollarS)
Average annual losses, 2011–20 – 400,000 – $54 – $200 – $400
Average annual losses, 2021–40 – 1,200,000 – $222 – $600 – $1,500
Average annual losses, 2011–40 – 900,000 – $166 – $500 – $1,200
Cumulative losses, 2011–20 N.A. – $541 – $1,700 – $4,300
Cumulative losses, 2021–40 N.A. – $4,440 – $11,800 – $30,700
Cumulative losses, 2011-40 N.A. – $4,981 – $13,900 – $36,000
noteLossesinjobsandincomereflectimpactsinagivenyearagainsttotalnationaljobsandincomeinthatyear.Thesemeasuresdonotindicatedeclinesfrom2010levels.Totaldisposablepersonalincomeisinbillionsof2010dollars.Percapitalandperhouseholdaveragesarein2010dollarsroundedtothenearest$100.N.A.=notapplicable.
sourCesEDRGroupandLIFTmodel,UniversityofMaryland,INFORUMGroup,2011.
Table 11★ effects on total u.S. Jobs and Personal income Due to Declining Water Delivery and Wastewater treatment infrastructure Systems, 2011–40 (billions of 2010 dollars, unless noted)
Year buSineSS SaleS gdp
Losses in the Year 2020 – $140 – $81
Losses in the Year 2040 – $481 – $252
Average Annual Losses 2011–2020 – $73 – $42
Average Annual Losses 2011–2040 – $251 – $137
Cumulative Losses 2011–2020 – $734 – $416
Cumulative Losses 2011–2040 – $7.5 Trillion – $4.1 Trillion
noteLossesinbusinesssalesandGDPreflectimpactsinagivenyearagainsttotalnationalbusinesssalesandGDPinthatyear.Thesemeasuresdonotindicatedeclinesfrom2010levels.
sourCesEDRGroupandLIFTmodel,UniversityofMaryland,INFORUMGroup,2011
Table 3★ effects on total u.S. Business Sales and GDP due to Declining Water Delivery and Wastewater treatment infrastructure Systems, 2011–40 (billions of 2010 dollars unless noted)

Failure to Act: The Economic Impact of Current Investment Trends in Water and Wastewater Treatment Infrastructure 35
AsshowninTable11,theselossesinbusinesssalesandGDPwillleadtojobandpersonalincomedeclines.Onaverage,annualjobslosseswillbe367,000eachyearfromduring2011to2020,andmorethan900,000jobsannuallywouldbelostduringthe30-yearspanfrom2011to2040.Joblossesareexpectedtobe669,000by2020andreach1.4millionby2040.Overall,disposablepersonalincomewilldecreasebyatotalof$541billionfrom2011to2020,atanaver-ageof$54billionperyear,andtotalnearly$5trillionfrom2011to2040,whichisanannual
SecTor 2020 2040
Agricultural services and food products – 10,000 – 28,000
Construction – 71,000 – 151,000
Knowledge sector services (excluding medical services)a – 159,000 – 381,000
Medical services – 15,000 223,000
Mining and refining – 1,000 – 3,000
Retail trade – 199,000 – 425,000
Restaurants, bars, and hotels – 63,000 – 175,000
Technology/electronics manufacturing – 4,000 – 11,000
Transportation equipment – 6,000 – 23,000
Transportation services – 16,000 – 51,000
Utilities – 9,000 – 29,000
Wholesale trade – 32,000 – 83,000
Other services and entertainment – 36,000 – 123,000
Other manufacturing – 48,000 – 117,000
total – 669,000 – 1,377,000
aKnowledgesectorservicesgenerallyincludesthemedicalsector.However,duetothepotentialofanincreaseinwater-borneillnessesboughtonbydecayinginfrastructure,thedemandformedicalservicesmayincrease,andthereforetheimpactsaredisplayedseparately.
sourCesEDRGroupandLIFTmodel,UniversityofMaryland,INFORUMGroup,2011.
Table 12★ Potential employment impacts as a consequence of Failing Water and Wastewater infrastructure, 2020 and 2040
on average, annual jobs losses will be 367,000 each year from during 2011 to 2020, and more than 900,000 jobs annually would be lost during the 30-year span from 2011 to 2040.

36 American Society of Civil Engineers
averageof$166billionperyearinlostincomefor30years.By2020,theimpactisexpectedtobealmost$900perhouseholdintermsoflostincomeandoutofpocketexpensesforcostsassociatedwithdeficientinfrastructure.
Givencurrentlevelsofinvestment,capitalinvestmentneeds,anddemandtrends,alongwiththedeteriorationofthewaterdeliveryandwastewatertreatmentinfrastructure,thissce-nariocouldcosttheU.S.nearly700,000jobsin2020and1.4millionjobsoverwhatisotherwiseforecastfor2040.
Thethreesectorsthatwilllosethegreatestnumberofjobsareretail,restaurantsandbars,andconstruction,resultingfromacombinationoflessdisposableincome,increasedwatercosts,andtheincreasingcostsofwater-basedgoods.Inaddition,retailimpactsarelikelyduetohigherintermediate-inputprices,andlessdiscretionaryspendingbyhouseholdsbecausetheyhavehealthcostsduetocontaminatedsystems.Constructionimpactscanbetracedtoageneralincomedeclineamonghouseholdsandcorporations,andtheaddedcostsofconstructionmaterialsthatrequirewatereitherinfactoriesoronconstructionsites.Thisisinthecontextoftheoveralleconomyshowingalmost$481millionlessindustrialout-putand$300millionlessdisposablepersonalincomein2040(in2010dollars).
Theimpactsoftheseinfrastructure-relatedjoblosseswillbespreadthroughouttheeconomyinlow-wage,middle-wageandhigh-wagejobs.In2020,almost500,000jobswillbethreatenedinsectorsthathavebeentraditionalemployersofpeoplewithoutextensiveformaleducationsorentry-levelworkers.32Conversely,ingenerallyacceptedhigh-endsectorsoftheeconomy,184,000jobswillbeatrisk.33Unlesstheinfra-structuregapisaddressed,by2040itsimpactswillputatriskalmost1.2millionjobswithinbasicsectors,whilearelativelystablenetamountof192,000jobsinknowledge-basedindustriesmaybejeopardized.Inthislattergrouping,approximately415,000jobswillbethreatened;however,medicalservicesareexpectedto
growbetween2020and2040duetoincreasingoutlaystofightwater-borneillnesses.34
Althoughassigningindustriestohigheduca-tioncategoriesisageneralization,theimpactwillclearlybefeltacrosssectors.
Theimpactsonjobsarearesultofcoststobusinessesandhouseholdsmanagingunreliablewaterdeliveryandwastewatertreatmentser-vices.Betweennowand2020,thecumulativelossinbusinesssaleswillbe$734billionandthecumulativelosstothenation’seconomywillbe$416billioninGDP(Table3).Impactsareexpectedtocontinuetoworsen.Intheyear2040alone,theimpactwillbe$481billioninlostbusinesssalesand$252billioninlostGDP.35Moreover,thesituationisexpectedtoworsenasthegapbetweenneedsandinvestmentcontin-uestogrowovertime.AverageannuallossesinGDPareestimatedtobe$42billionfrom2011to2020and$185millionfrom2021to2040.
exportsBy2020,exportsarelikelytoshowalossofapproximately$6billioncomparedwithexpectedexportlevels,whichrepresentsanalmost4per-centdecreaseinbusinesssalescomparedwithestimates(seeTable13).By2040,thelossofexports,whichrepresentinternationalbusinesssales,willbeasignificantportionoftheeconomicimpactsthatstemfromthefundinggapinwaterdeliveryandwastewatertreatmentinfrastruc-ture.Exportlossesareexpectedtoincreasesteadilyfrom2011to2040.However,by2040,theleveloflostexportdollarsisexpectedtorisetoalmost$77billion,whichrepresentsapprox-imately16percentofthelosttotalnationalbusinesssales.By2040,exportswillbelostin65ofthe91tradedsectors.Incontrasttodomesticeconomicimpacts,exportlosseswillbeheavilyfeltinthetechnologyandmanufacturingsectors—includingaerospace,instruments,anddrugs—andalsointheassociatedfinanceandprofessionalservicessectors.Thisrippleeffectillustratestheincreasingrateofexportchemicalproductlossesfrom2011through2040.Table14profileslossesbysectorin2040.

Failure to Act: The Economic Impact of Current Investment Trends in Water and Wastewater Treatment Infrastructure 37
SecTor exporT dollarS loST (predicTed For 2040)
Aerospace – $10.7
Finance and insurance – $8.3
Equipment and machinery – $6.1
Wholesale trade – $5.9
Instruments – $4.7
Agricultural and food products – $4.2
Plastics and rubber products – $3.6
Chemical and drug products – $3.0
Air transportation – $2.6
Professional services – $2.2
SuBtotal – $51.5
Other sectors – $25.2
total – $76.7
noteLossesreflectimpactsinagivenyearagainsttotalnationalexportprojectionsfor2040.Thesemeasuresdonotindicatedeclinesfrom2010levels.
sourCesEDRGroupandLIFTmodel,UniversityofMaryland,INFORUMGroup,2011.
Table 14★ Potential u.S. export reductions by 2040 (billions of 2010 dollars)
cumulaTive annual average
period oF loSSeS exporT loSSeS exporT loSSeS
2011–20 – $20 – $2
2021–40 – $807 – $40
2011–40 – $828 – $28
noteLossesreflectimpactsinagivenyearagainsttotalnationalexportprojections.Thesemeasuresdonotindicatedeclinesfrom2010levels.
sourCesEDRGroupandLIFTmodel,UniversityofMaryland,INFORUMGroup,2011.
Table 13★ cumulative losses of u.S. exports (billions of 2010 dollars)

38 American Society of Civil Engineers
loSSeS adJuSTed STricT TrendS
Jobs, 2020 538,000 669,000
Jobs, 2040 615,000 1,377,000
GDP, 2020 $65 $81
GDP, 2040 $115 $252
Business sales, 2020 $115 $140
Business sales, 2040 $229 $481
Disposable personal income, 2020 $87 $106
Disposable personal income, 2040 $141 $292
annual averaGeS, 2011–20
Jobs 319,000 367,000
GDP $36 $42
Business sales $64 $73
Disposable personal income $48 $54
annual averaGeS, 2021–40
Jobs 720,000 1,195,000
GDP $111 $185
Business sales $208 $340
Disposable personal income $138 $222
sourCesEDRGroupandLIFTmodel,UniversityofMaryland,INFORUMGroup,2011.
Table 15★ comparison of Potential Scenarios (billions of 2010 dollars)
a strict “trends-extended” hypothesis shows declines that proceed much faster after 2020, as infrastructure worsens and the general approaches of households and businesses are to cut back on spending and investing due to the increasingly high cost of reliable delivery and sewer services.

Failure to Act: The Economic Impact of Current Investment Trends in Water and Wastewater Treatment Infrastructure 39
6.2 The role of Sustainable practicesItispossiblethatbusinessesandhouseholdscanpartiallyaccountforunreliablewaterdeliveryandwastewatertreatmentservicesbyincreasingtheirconservationeffortsinproductionanddailywateruse.Improvedconservationthroughchangesinbehavior,innovativeproductionmethods,andtheutilizationoftechnologyisarealisticprospectinthefaceofrisingcosts.
Inthisstudy,asecondimpactanalysisassumesthattherewouldbeageneraladjust-mentbybusinessesandhouseholdsasthecapitalgapworsened,whichwouldmeanthat:
★ Impactsshownetlossesof538,000jobsby2020and615,000by2040.Inthiscircum-stance,joblosseswouldpeakat830,000intheyears2030–32.
★ Businesssalesasameasureoftotaleconomicactivitywouldbeexpectedtofallby$115billionin2020,and$229billionby2040;intheyears2032–34,outputdeclineisforecasttodeclinebymorethan$240billionperyearunderthisscenario.
★ GDPwouldbeexpectedtofallby$65billionin2020,and$115billionin2040.ThelowestpointsinthedeclineinGDPwouldbein2029–38,whenlosseswouldexceed$120billionannually.
★ After-taxpersonalincomelossesunderthisscenariowouldbe$87billionin2020and$141billionin2040.Atitsworst,annuallossesintheyears2030–34areestimatedtorangefrom$156billionto$160billion.
Table15comparesthetwoimpactassumptions.Astrict“trends-extended”hypothesisshowsdeclinesthatproceedmuchfasterafter2020,asinfrastructureworsensandthegeneralapproachesofhouseholdsandbusinessesaretocutbackonspendingandinvestingduetotheincreasinglyhighcostofreliabledeliveryandsewerserviceswhencommoninfrastructure
isgrowingincreasinglyunreliable.“Mitigated”trendsextendedshowslightlylowerimpactsthanthestricterscenariothrough2020andaslightupswinginallmeasuresbeginninginthemid-2030sto2040ashouseholdsandbusinessesadjusttothelong-termunreliabilityofwaterdeliveryandwastewatertreatmentinfrastructure.
6.3 innovative approaches to Water delivery and Wastewater TreatmentInnovativeapproachestotomorrow’swaterinfrastructuremaynotlookthesameastoday.Today’sneworenvisionedtechnologiesandapproachesmaybecomeroutinewithadvancesinscienceandregulatoryframeworksorneeds.Inthissection,severaltypesofnewandemergingtechnologiesandapproachesaredescribedthatmayimpactdrinking-water,wastewater,andwetweathermanagementinfrastructure,andthereforeaffectthesizeofthecapitalgapoffailingtoinvestincurrentsystems.
Separate potable and nonpotable WaterAlargeportionofpublicsupplywaterisusedforwateringlawns,flushingtoilets,andwashingclothes.Theseusesdonotrequirepotablewater,butinmostlocalities,allpubliclysuppliedwateristreatedtomeetfederaldrinking-waterstandards.Itisbecomingcost-effectiveformunicipalitiestoconstructseparatelinesforpotableandnonpotableusesaswaterbecomesscarcerandtreatmentmorecostly.InTampa,forexample,customersareofferedtheoptionofhookinguptoareclaimedwatersystemforlawnirrigation.Inservicedneighborhoods,customersmustpayaconnectionfee,buttheusagefeeforreclaimedwateris40to80percentlessthanfortreatedwater,dependingonthevolumeused.
advanced Treatment of WastewaterThe“advanced”treatmentofwastewaterdenotestreatmentthatismorestringentthansecondarytreatmentorproducesasignificantreductioninbiochemicaloxygendemand,nitrogen,

40 American Society of Civil Engineers
phosphorous,ammonia,metals,orsyntheticorganiccompounds.36
TheChesapeakeBay—whichreceivespollut-antsfromMaryland,Virginia,andDelawareandfromasfarawayasPennsylvania,NewYork,andWestVirginia—providesanexampleofaregulatorydriverforadvancedwastewatertreat-ment.Thebayisimpaired,andatotalmaximumdailyloadcleanupplanhasbeendevelopedthatoutlinesreductionsinnitrogen,phosphorus,andsedimentlevelsthatmustbemetacrossthewatershedinordertoreturnthebaytohealth.Morestringentnitrogenandphosphoruslimitationsatwastewatertreatmentplantswillbecriticalinimplementingthisclean-upplanandensuringthatalgaebloomsanddeadzones,wherefishandshellfishcannotsurvive,nolongeroccur.
reclaimed WastewaterInareasofwaterscarcity,itissometimesreason-abletodivertwastewatertreatmentplanteffluentforbeneficialusessuchasirrigation,industrialuse,andthermoelectriccooling,insteadofreleas-ingtheeffluentintoriversoraquifers.Inthisway,a“new”watersourceistapped.
Initsrecentsurveys,theEPAhasdocumentedneedsamongthe50statesforbuildingdistri-butionsystemsforthisreclaimed,orrecycled,water.Suchneedswerereportedby20statesin2008,whichisupfrom15statesin2004.Basedonreportedneeds,CaliforniaandFloridaleadthenationinrecycledwatersystems,whilethelargestpercentagegrowthoverthetworeportingcyclesoccurredinTexasandNorthCarolina.37
Recycledwastewaterisbeingusedforirrigation,thermoelectriccooling,andeventorechargeaquifersthatsourcepublicwatersupplies.
green infrastructureInnaturalsystems,mostprecipitationisabsorbedorinfiltratedintotheground,whereitreplen-ishesaquifers,nourishesplants,andsupplieswatertonearbystreamsduringlowflows.Thisprocessisimportantforthelong-termmain-tenanceofdrinking-watersupplies.Greeninfrastructureprovidesseveraltechniquesthatmimicnaturalsystemsbyprovidinginfiltrationandcapturingmechanismsforwetweatherrunoff,includinggreenroofs,grassyswales,permeablepavement,andrainbarrels.
desalinationAlthougharesponsetowater-supplyshortagesandnotatypeofwaterdelivery,desalinationisimportantbecauseofthescaleofinvestmentrequiredforitsdevelopment.Desalinationremovessaltandmineralsfromseawaterorbrackishgroundwater,makingitfittodrink.Aswithotheralternativewatertechnologies,desali-nationintheU.S.ismostprevalentinFlorida,Texas,andCalifornia.Desalinationisanoldidea,butitsmodernmanifestationrequiresvastamountsofenergyandatechnologythathasnotyetbeenperfected.DesalinationofbrackishgroundwaterisoccurringinYumaandElPaso,whileexamplesofcoastaldesalinationplantsincludeMontereyBay,California,andTampaBay.
Water haulingOneextremeandlogisticallychallengingstrat-egytoaddresswaterdeficienciesindeliverysystemsandsupplyiswater-hauling,whichisthepracticeofsupplyingwatertohouseholdsandbusinessesbytruckdelivery.Althoughthispracticeispartofeverydaylifeinmanynations,intheU.S.itismostlylimitedtocasesofextremedroughtsandlargenaturaldisasters,orroutinelytofillswimmingpools.
Today’s new or envisioned technologies and approaches may become routine with advances in science and regulatory frameworks or needs.
Failure to Act: The Economic Impact of Current Investment Trends in Water and Wastewater Treatment Infrastructure 41
ConClusions7
Waterinfrastructureisdistinctinitscom-mitmenttopublicsafety.Forexample,ifthetransportationinfrastructurebreaksdown,travelwillbeslowandtheslowdownwillmeanthatbusinessesandhouseholdswillincurcosts,buttravelerswillstillbeabletogettotheirdestinations.Water,however,isvital,andifitisnotavailable,essentiallifeactivitiescannotbesustained.Althoughwatermaybeconserved,itmustbeobtain-able.Awell-maintainedpublicdrinking-waterandwastewaterinfrastructureiscriticalforpublichealth,strongbusinesses,andcleanriversandaquifers.However,asdocumentedinthisreport,capitalspendinghasnotbeenkeepingpacewithneeds,andifthesetrendscontinue,theresultinggapwillonlywidenthrough2040.Asaresult,pipeswillleak,new
facilitiesrequiredtomeetstringentenviron-mentalgoalswillbedelayed,operationsandmaintenancewillbecomemoreexpensive,andsourcesofwaterwillbecomepolluted.
Fundingtoclosethegapcancomefrommultiplesources.Federalgrantsandloanshaveplayedcrucialrolesinbuildingwaterinfrastructureoverthedecades.Despiterecentfederaldeficits,infrastructurespend-ingcanbothcreateshort-termconstructionjobsandimprovethefoundationuponwhichthenation’seconomyrests.
Yetfederalfundingisnottheonlyanswer;sincethemid-1970s,moneyfromlocalandstategovernmentshasrepresentedanincreasingpercentageofpublicdrinking-waterandwastewaterinvestment—risingtomorethan95percentinrecentyears.39
the Diamond-Water Paradox is taught in many introductory eco-
nomics courses. the paradox is that although water is much more
central to life than diamonds, diamonds are more expensive than
water.38 up to this moment, american households and businesses
have never had to contemplate how much they would be willing to
pay for water if it were to become hard to obtain. economic analy-
ses have not contemplated the impacts of exceptionally high costs
for water and wastewater treatment on the national economy.

42 American Society of Civil Engineers
Becausesomewatersystemsarenowprivatized(approximately10percentofthe170,000public-servingdrinking-watersystems),privatecapitalmaybecomeincreasinglyimportant.Butwhetherasystemisgovernmentownedorprivate,house-holdsandbusinessesstillultimatelyfootthebill;thus,settingratesatlevelssufficienttomaintainandupgradeinfrastructureiscritical.Ifratesincreasetoomuch,however,morelow-incomeresidentswouldfacefinancialhardship.
Therearemultiplewaystopreventthesenegativeconsequencesdescribedinthisreport.Possiblepreventivemeasuresincludespendingmoreonexistingtechnologies,investingtodevelopandthenimplementnewtechnologies,andchangingpatternsinwhereandhowwelive.Allthesesolutionsinvolvecosts.Separatelyorincombination,thesesolutionswillrequireactionatthenational,regional,andprivatelevels,andwillnotoccurautomatically.
7.1 opportunities for Future researchThisstudyhasexaminedtheeconomicimpli-cationsoftheUnitedStates’failuretomeetitsfutureneedsforwaterdeliveryandwastewatertreatmentinfrastructure,butthatisonlypartofthestory.Ifwewanttoassurethathouseholdsandbusinesseswillcontinuetoreceiveaccesstoaffordableandsafewaterinthefuture,thentherearealsoneedstomaintainandgrowavailableresourcessuchasdams,aquifers,andotherwatersupplysources.Threeofthenation’sfourregionswithhighpopulationgrowth—theFarWest,RockyMountain,andSouthwest—includevirtuallyallitsdesertlandsandmostofitssemiaridregions.Desertsandsemiaridregionsreceivelessthan20inchesofrainperyear,andhaveevaporationratesthatexceedpre-cipitationrates.Inthesewater-scarceregions,waterisoftendrawnfromdeepundergroundaquifersorpipedinfromwetterclimes.There-fore,oneareaoffocusforfutureresearchwillbetorefineestimatesoftheavailabilityandcosttoaccessadditionalwatersources,particularlyastechnologycontinuestodevelop.
Arelatedfocusforfutureresearchwouldbetoexaminehowclimatechangemayaffectwatersupplies.Futureclimatechangecanalterthetimingandextentofsnowandrainseasons,affectingreservoirsandexacerbatingdroughtconditionsinaridclimates.Additionally,extendedstormsmayoverextendwetweathersystemoverflowsinplace.
Athirdareaforfutureresearchwouldattempttodevelopdataonhowhouseholdsandbusinessesreacttothelossofreliablewaterservicesandthecoststoadjust.Toolsthatcouldbeemployedinastudyincludeasurveytoexaminehowbusinessesandhouseholdshavereactedtobreakdownsinwaterdeliveryandcoststhathavebeenincurredtodate.Tobemosteffective,thistypeofsurveyeffortshouldbesegmentedbyhouseholdincomeandindustrysector—thelattertoseparatewater-dependentindustriesfromotherindustries.Asecondtoolwouldbetofullydevelopanationaldatabaseofwaterandsewersystemsthatincludesahistoricalnationalprofileofwaterdeliveryandcross-tabulatedbygallonsperday,costs,geogra-phy,customermarket,andageofthesystem(orstateofgoodrepair).
Ourresearchvalidatesawidelyacceptedpremisethattheageofthewaterandwastewatertreatmentinfrastructureisamajorprobleminmaintainingreliableservice.Thedisaggregationofwaterdeliveryandtreatmentsystemsisabarriertodevelopingacomprehensivenationalstudyoftheageofpipesandtheirremainingusefullife.However,giventheaginginfrastruc-ture,particularlyintheolderurbanareasoftheNortheast,Mid-Atlantic,andMidwest,olderwatersystemsthatarenotbeingreplacedorsubstantiallyupgradedappeartobecriticalpointsforinfrastructurefailure.Inthiscontext,acomprehensivenationalstudyisneededasthefirststeptowardimplementingamethodical,preventivecapitalinvestmentplan.

Failure to Act: The Economic Impact of Current Investment Trends in Water and Wastewater Treatment Infrastructure 43
Office(CBO)andtheCensusBureauprovidekeyhistoricalpublicspendingdata,andtheCensusBureaualsoprovidesimportantdataonprivatecapitalexpendituresonwaterinfrastructure.Futuretrendsininfrastructureneedsandspend-ingarebasedonacontinuationofpasttrends,andwerevalidatedbyaliteraturereviewandexpertinterviews.
ThiseconomicanalysisisprimarilybasedontwodatasetsdevelopedbyEPA,interviewsandliterature.Keysourcesandassumptionsinclude:
★ Twenty-yearforecastsofinfrastructureneedsandfundsforwaterandwastewatertreat-mentinfrastructurepublishedbyEPA.Thelaststudywaspublishedin2007forwaterand2008forwastewater.Thedatawasprojectedonastraight-lineto2040basedontrendsoflocal,stateandfederalspendingandneedsfrom1995to2007forwaterand1996to2008forwastewater.SeeChapter3formoredetail.
★ StudiesoftheU.S.GeologicalSurveyidentifywaterdemandbyregion,andtypeofcus-tomerasmeasuredbymillionsofgallonsperday(MGD).SeeChapter4formoredetail.
★ Theaddedcoststhatwillbeincreasinglyincurredbyhouseholdsandbusinessesinfutureyears,inresponsetoincreasinglyunre-liablewaterdeliveryandwastewatertreatmentservices.Thisincludescostsassociatedwithself-supplyofservices,relocationand/orcon-servation.SeeChapter6formoredetail.
SeveraladjustmentswereappliedtoresultsoftheDrinking-waterandCleanWatershedsNeedsSurveys.ThisapproachfollowstheleadofEPA,whichmadesimilaradjustmentsinits2002gapanalysis:
★ Theneedswereadjustedtoconstant2010dollars;
Thisstudyillustratesscenariosofwhatcouldhappentothenationaleconomyifhouseholdsandbusinessesmustpayapremiumforreliablewaterdeliveryandwastewatertreatment,usingcurrenttrendsofwaterdemand,infrastructureneeds,investmentandavailableinformationaboutstrategiesthatareavailabletoguaranteereliability.Theanalysisapproachcomparesthreescenarios:
★ Theimpliedbasecaseinwhichsufficientinvestmentismadetomaintainwaterandsewerinfrastructuresystemstomeetantici-patedfutureneeds,and
★ Twoscenariosinwhichcurrentinvestmenttrendsleadtoagrowinggapbetweentheperformanceofournation’swaterandsewersystemsandanticipatedneeds.
Theselatterscenariosconsider“grossimpacts”andnot“netimpacts”ofwaterconsumers’strat-egiestocontendwithunreliablewaterdeliveryandwastewatertreatmentservices.Economicimpactsforpurchasesoftechnologiesnotyetinventedorwidelyemployed,andimpactsfrommoremoneybeingdivertedtomovingcompa-nies,diggingwellsandproducingandinstallingsepticsystemswerenotmeasuredduetothedif-ficultyofestimatingthecostsrequiredtopursuethesevariousalternatives.Oncethenatureofpotentialwaterconservationtechnologiesareexplored,aswellasbehavioralmodelingofwaterconsumers’responses,anextensionofthisanal-ysiscouldincludethosespendingeffectsaswell.
Capitalneedsandexpendituresfordrinkingwaterandwastewatertreatmentinfrastructurearebasedonfederalgovernmentdatasources.Inparticular,EPA’sdrinkingwaterneedssurveys,cleanwatershedsneedssurveys,andgapanaly-sisprovidekeyinformationaboutthescaleandtypesofneedsbystateandthegrowthintheseneedsovertime.TheU.S.CongressionalBudget
★|abouttHestudY

44 American Society of Civil Engineers
★ Underreportingacrossallsegmentsofdrink-ing-waterinfrastructurewasaddressedbyaddinganunderreportingadjustment,whichiscalculatedbymultiplyingthetotaloftheothersectorsbyafactorof0.74;40
★ Theestimatedneedforwetweathermanagementeachyearwasincreasedbyafactorof7.94,whichisthefactorcalculatedbyEPA(2002)initsgapanalysisforthislineitem;41and
★ Theunderreportingacrossallsegmentsofwastewatertreatment,sanitarysewersandcombinedseweroverflowswasaddressedbyaddinganunderreportingadjustment,whichiscalculatedbymultiplyingthetotaloftheotherwatertreatmentsectorsbyafactorof0.73.42
Theeconomicanalysisprocesshasthreesteps:1. Throughcomparisonofthetwoalterna-
tivescenarios,wecalculatetheaddedcostsincurredbyhouseholdsandbusinessesduetoincreasinglyinadequateinfrastructure.Thisisdoneonayear-by-yearbasis.
2. Thoseaddedcostsaredistributedamongsthouseholdsandvarioussectorsoftheecon-omyinaccordancewiththeirlocationandwater/sewerusepatterns.
3. Aneconomicmodelofournation’seconomyisusedtocalculatehowhouseholds’incomeandexpenditurepatterns,aswellasbusinessproductivity,isaffectedandleadtochangesinournation’scompetitivenessandeconomicgrowth.Theresultsareprovidedintermsoflong-termchangesinjobsandincomeintheU.S.ThissequencemakesuseoftheLIFTmodel,anationalpolicyandimpactforecastingsystemdevelopedbyINFORUM—aresearchcenterwithintheDepartmentofEconomicsattheUniversityofMaryland,CollegePark.
ThefourstepprocessforthreadingtheincurredcoststhroughtheLIFTmodelissummarizedbelow:1. Costs
a. Convertcostsbysectorusingaamortiza-tionrateof.05(20years)
b. Addoperationandmaintenancecostsc. Allocatecostsbybroadsegmentsacross
appropriateLIFTproductionsectorsandhouseholdsusingLIFTInput-Output(IO)coefficients.Costsbasedonestimatesofself-supplyinvestmentinlieuofdataformovingand/orconservationcosts.
2. Costsofpayinghigherpublicsystemrates.a. Convertallquantitiestopricesusingbase-
lineforecastGDPdeflatorb. Allocateincreasedpublicsectorcostsby
broadsegmentacrossappropriateLIFTproductionsectorsandhouseholdsusingLIFTIOcoefficients.
3. Computecost/priceshocksa. Foreachproductionsector,computenet
increaseincommoditypricesimpliedbycostshockscalculatedinsteps1and2.Forhouseholdsector,computenetincreaseinwaterandsewerpersonalconsumptionexpenditure(PCE)deflatorimpliedbycostincreases.ThesepriceincrementsareinputtedtotheLIFTalternativesimulationasmultiplicativeaddfactorsoncommodityandPCEprices.
4. HealthandLaborProductivityImplicationsofPoorSystemsa. Usingadditiveaddfactors,applyreal
expenditureincreasesinmedicalser-vicetoLIFTPCEservicesectors(e.g.physician,hospitals,andothermedicalservices).DeductequivalentamountfromallotherPCEspending.
a. Addcostoflostdaysdirectlytotheaggregatewageindex.Thisallocatesthecostsacrosssectorsproportionaltototalcostoflaborineachsector.Costincreasewillshowupinprices(notasadditionalemployment).

Failure to Act: The Economic Impact of Current Investment Trends in Water and Wastewater Treatment Infrastructure 45
11.EPA2002.
12.ASCE2009b.
13.EPA2010.
14.EPA2002.
15.EPA2004,ascitedbyASCE2009a.
16.Inouranalysis,wecalculatecapitalspendingseparatelyforfederal,state,andlocalgovernmentsandforprivatizedsystems.Governmentexpendituresareavailablesince1956;however,privatizedcapitalexpendituresareonlyavailablestartingin1998.Bothareprojectedintothefutureusingasimplecontinuationofpasttrends,andthesumrepresentstotalcapitalspendingfordrinking-waterinfrastructureacrosstheU.S.Drinking-watercapitalspendingbyfederal,state,andlocalgovernmentshasincreasedconsistentlysince1956.Drinking-watercapitalspendingbyprivatizedsystemsismuchsmaller,andaveragedbetween12and16percentofthetotalbetween1998and2007.Itisdifficulttopredictfuturelevelsofcapitalspendingbecauseawiderangeoffactorswillplayunpredictablerollsduringthecomingdecades.Spendingwillbeimpactedbythedegreetowhichinfrastructureactuallyfailsorispredictedtofailinthenearfuture.Inaddition,capitalspendingwillrisetomeetrequirementsfromnewlawsandregulations.Demographicchangeslikepopulationincreases,andeconomicchangeslikeexpandinglocaleconomies,willalsoimpactfuturecapitalspendinginparticularregions.
17.Thirty-yearneedsareestimatedbyfittingastraight-lineprojectionbasedonhistoricalspendingdataandneedsdatathataredocumented,andspendingand20-yearneedsdataprojectedbytheEPA.
18.The“source”categoryincludesneedsforconstructingorrehabilitatingsurfacewaterintakes,rawwaterpumpingfacilities,drilledwells,andspringcollectors.Neitherthe“storage”nor“source”categoryincludesrawwaterreservoirsordams.
19.Althoughdataonspendingareavailablefromthemid-1950s,totalneedsaredocumentedfromthemid-1990s.The“gap”is[totalneeds–totalspending].
20.Anderson2010.
21.EPA2002.
22.AWWA2001.
23.AWWA2001.
24.Capitalcostswereassumedtobeamortizedover20years.
★|endnotes1.EPA2010.
2.EPA2002.
3.EPA2004,ascitedbyASCE2009.
4.Agricultureandfoodproducts,restaurants,barsandhotels,transportationservices,retailtrade;wholesaletrade,utilities,construction,mining,andrefining,otherservicesandentertainment,andothermanufacturing.
5.Transportationequipmentmanufacturing,knowledgesectorservices,medicalservices,andtechnologyandinstrumentmanufacturing.
6.Assigningindustriestohigheducationdependentornoeducationdependentis,ofcourse,ageneralization.RetailandwholesaleoperationsincludeMBAsandcomputerprogrammers,whilehospitalsincludeorderliesandtech-nologycompaniesemployjanitors.Observationsofthediscussionaboveweremadeonthebasisofapreponderanceofoccupationsinindustriesthatdrivetheindustriesandthenatureoftheproductorservicethatisproduced.
7.“Businesssales”isbeingusedtorepresenteconomicout-put,whichisgrosseconomicactivity,includingbusinessessales,productionaddedtoinventoryordestroyed,andbudgetexpendituresfornonprofitandpublicsectororgani-zations.“GDP”or“valueadded,”aretheeconomicactivitiesthatoccurintheU.S.andisabetterindicationofdomesticproductivity.Forexample,acarassembledandsoldintheU.S.mightincludepartsmanufacturedinEuropeorAsia.Inthisexample,thecostofforeignmadepartsandthetransportationcoststotransportthosepartstotheU.S.arepartofthepriceofthecarandwouldbeincludedinthesalepriceofthecar(businesssales).However,GDPincludesonlythedomesticassembly,whateverpartsaremanufacturedintheU.S.,transportationcoststhatoriginateintheU.S.,andactivitiesassociatedwiththesale(orconsignmenttoinventory/demolition)ofthecar.
8.Kennyetal.(2009).
9.PacificInstitute(2009);USCB(2000,2010).
10.Overall,percapitawateruseisalreadydownintheU.S.Ithadpeakedinthemid-1970s,andcurrentlevelsarenowthelowestsincethe1950s.Thistrendisduetoincreasesintheefficiencyofindustrialandagriculturalwateruseandisreflectedbyanincreaseintheeconomicproductivityofwater(PacificInstitute2009).Incontrast,percapitawateruseinthehomehasremainedstablesincethe1980s(Kennyetal.2009).Efficiencyandconservationhavereducedpercapitahouseholdconsumptioninsomestatesandregions,buttheseeffortshavebeencounteredbyincreasingpopula-tionsinhotandaridregionsofthecountry—includingtheSouthwest,RockyMountains,andFarWest—wherethereisgreaterdomesticdemandforoutdoorwateruse(PacificInstitute2009;USCB2000,2010).

46 American Society of Civil Engineers
25.Verylittleinformationaboutmovingisreadilyavailableaboutcostsofbusinessrelocationbecausecostsarespecifictothetypeandsizeofeachbusiness,andmostinformationavailableconcernstatepayments,whichareoftencappedoraddressspecificportionsofcosts.Forexample,anFHWAstudyreportspaymentsandexpensesduetothedisplace-mentof68businessesinProvidence,RhodeIslandcausedbytherealignmentofI-195andtheconstructionofanewbridgeovertheProvidenceRiver.Thesebusinessesvariedinsizefromone-personproprietorshipstoa50+employeemanufacturingbusiness.Allofthebusinesseswerecatego-rizedassmallbusinessesforpurposesoftheireligibilityforreestablishmentbenefits.CostsofrelocationwithinRhodeIslandrangedfrom$1,000to$1.1millionin$2010(FederalHighwayAdministration,NationalBusinessRelocationStudy,April2002,ReportNo.FHWA-EP-02-030).Elsewhere,in2010,PerdueAgribusinessheadquartersreceived$1.74millionfromtheDelawareStrategicFundforconstructioncostsandrelocationexpensesentailedfrommovingfromMaryland(DailyTimesofSalisbury,November9,2011).
In2006,IncMagazineprofilesafactoryrelocationatanetcostof$6.5million($7.0millionin2010dollars),includingexpensesassociatedwithrelocationofpersonnelandequipment,hiringandtrainingnewworkers,andcostoflandandconstructionminusproceedsfromsaleofperviousfacility.Outofpocketexpendituresforhouseholdrelocationsarebasedondistanceandtheamountoflaborhouseholdmembersputintothemove.Actualmovingexpensesareroughly$5,000–$10,000basedonvarious“movecalculatorsontheweb”,assumingminimallaborprovidedbyhouseholdmembers,andnotfactoringothercostsofrelocation(e.g.,jobandhousingsearch,andpersonaltransportation).
26.AccordingtoU.S.GeologicalSurveystaff,“Thedifficultyinestimatinghowmuchofthe‘other’useisforpublicser-vicesarethatreportingrequirements,ifany,varyfromstatetostate.Alsotherearemanydifferencesinhowcompletelyutilitiescankeeptrackofunbilledwater.Typicalpublicusesreportedbycitiesinthesampleincludedlandscapewatering,utilityandinterdepartmentalusage,watertreat-ment,andaccounted-forlosses.Inmanycitiestheseusesrepresentedonlyasmallpercentageofthenetuse,butinafewitwasmorethan10percent.”Theseissuesmakeitdifficulttosplit“other”topublicsectoruseandlossesthatcouldbeattributedultimatelytotaxpayers.Also,lossesfromfaultypipesmayleakintothegroundandnotrequirewastewatertreatment.
27.From1971to2000forallsourcesofwater,includingdrinkingandwastewatersystems.
28.Thisaspectoftheanalysisdoesnottakeintoaccounttheincrementalagingofthepipenetworkby2020(45years)and2040(50years)comparedtothesystemasof1970(22years)
29.Hutton,GuyandHaller,Laurence,EvaluationoftheCostsandBenefitsofWaterandSanitationImprovementsattheGlobalLevelWater:SanitationandHealthProtectionoftheHumanEnvironment,WorldHealthOrganization,Geneva,2004.EDRGroupinflateddollarsfrom2000to2010value.
30.Todeterminethenumberofbuildingsfor100commer-cialestablishments,divide100by2.3;theproductis43.5.Therefore,weassume43.5buildingsforevery100commer-cialestablishments,andreducetotalestablishmentsby56.5percent.
31.Thissector,however,describespurchasesfromprivatewaterandsewagesystemsanddoesnotincludepurchasesfromgovernment-ownedsystems.
32.Agricultureandfoodproducts,restaurants,barsandhotels,transportationservices,retailtrade;wholesaletrade,utilities,construction,miningandrefining,otherservicesandentertainment,andothermanufacturing.
33.Transportationequipmentmanufacturing,knowledgesectorservices,medicalservices,andtechnologyandinstru-mentmanufacturing.
34.Assigningindustriestohigheducationdependentornoeducationdependentis,ofcourse,ageneralization.RetailandwholesaleoperationsincludeMBAsandcomputerpro-grammers,whilehospitalsincludeorderliesandtechnologycompaniesemployjanitors.Observationsofthediscussionaboveweremadeonthebasisofapreponderanceofoccupa-tionsinindustriesthatdrivetheindustriesandthenatureoftheproductorservicethatisproduced.
35.Inthisexample,thecostofforeignmadepartsandthetransportationcoststotransportthosepartstotheU.S.arepartofthepriceofthecarandwouldbeincludedinthesalepriceofthecar(businesssales).However,GDPincludesonlythedomesticassembly,whateverpartsaremanufacturedintheU.S.,transportationcoststhatoriginateintheU.S.,andactivitiesassociatedwiththesale(orconsignmenttoinventory/demolition)ofthecar.
36.EPA2010.
37.EPA2010.
38.Smith1965.
39.CBO2010.
40.EPA(1997a,2001,2005,2009).EPAexplicitlyrecognizedthattheyneededtoperformanunderreportingadjustmentfordrinking-water.Initsgapanalysis,USEPA(2002)accountedforunderreportingbyincreasingitstotalpointestimateofcapitalneedsfromthe1997CleanWatershedsNeedSurveyfrom$157.2to$274billion(in2001$).Thisincreasestheoriginalestimatebythisfactorof0.74.
41.BasedonanewUSEPA(2002)foundthatthetrueSSOneedsin1996were$92.1billionratherthanthe$11.6billioninthe1996CleanWatershedsNeedSurvey(in2001$).WeassumethattheCleanWatershedsNeedSurveysreleasedsince1996arealsounderestimatedbythisfactorof7.94.
42.Initsgapanalysis,USEPA(2002)accountedforunderre-portingbyincreasingitstotalpointestimateofcapitalneedsfromthe1996CleanWatershedsNeedSurveyfrom$224.5to$388billion(in2001$).Thisincreasestheoriginalesti-matebythisfactorof0.73.

Failure to Act: The Economic Impact of Current Investment Trends in Water and Wastewater Treatment Infrastructure 47
—.2008.Cleanwatershedsneedssurvey2004reporttoCongress.OfficeofWater.EPA-832-R-08-003.January.
—.2009.Drinking-waterinfrastructureneedssurveyandassessment:FourthreporttoCongress(2007).OfficeofWater.EPA-816-R-09-001.February.
—.2010.Cleanwatershedsneedssurvey2008reporttoCongress.EPA-832-R-10-002.
Gordon,Emily,JeremyHays,EthanPollack,DanielSanchez,andJasonWalsh,withMatthewLewis.2011.Water Works: Rebuilding Infrastructure, Creating Jobs, and Greening the Environment.WashingtonandOakland:AmericanRivers,EconomicPolicyInstitute,andPacificInstitute.www.pacinst.org/reports/water_works.pdf.
GRWS(GroundwaterReplenishmentSystem).2011.GroundwaterReplenishmentSystem.www.gwrsystem.com/home.html.
Hanak,Ellen,JayLund,ArielDinar,BrianGray,RichardHowitt,JeffreyMount,PeterMoyle,andBarton“Buzz”Thompson.2011.Managing California’s water: From conflict to reconciliation.SanFrancisco:PublicPolicyInstituteofCalifornia.
Hutton,Guy,andLaurenceHaller.2004.Evaluation of the costs and benefits of water and sanitation improvements at the global level water: Sanitation and health protection of the human environment.Geneva:WorldHealthOrganization.
Hutson,SusanS.,NancyL.Barber;JoanF.Kenny,KristinS.Linsey,DeborahS.Lumia,andMollyA.Maupin.2004.EstimateduseofwaterintheUnitedStatesin2000.U.S.GeologicalSurveyCircular1268.(RevisedFebruary2005.)
Kenny,JoanF.,NancyL.Barber,SusanS.Hutson,KristinS.Linsey,JohnK.Lovelace,andMollyA.Maupin.2009.EstimateduseofwaterintheUnitedStatesin2005.U.S.GeologicalSurveyCircular1344.
MacKichan,K.A.1951.EstimateduseofwaterintheUnitedStates,1950.U.S.GeologicalSurveyCircular115.
—.1957.EstimateduseofwaterintheUnitedStates,1955.U.S.GeologicalSurveyCircular398.
MacKichan,K.A.,andJ.C.Kammerer.1961.EstimatedUseofWaterintheUnitedStates,1960.U.S.GeologicalSurveyCircular456.
Morikawa,Mari,JasonMorrison,andPeterGleick.2007.Corporate reporting on water: A review of eleven global indus-tries.Oakland:PacificInstitute.
Murray,CharlesRichard.1968.EstimateduseofwaterintheUnitedStates,1965.U.S.GeologicalSurveyCircular556.
Murray,CharlesRichard,andE.BodetteReeves.1972.EstimateduseofwaterintheUnitedStatesin1970.U.S.GeologicalSurveyCircular676.
—.1977.EstimateduseofwaterintheUnitedStatesin1975.U.S.GeologicalSurveyCircular765.
Seager,Richard,AlexandrinaTzanova,andJenniferNakamura.2009.DroughtinthesoutheasternUnitedStates:Causes,variabilityoverthelastmillennium,andthepoten-tialforfuturehydroclimatechange.Journal of Climate22:5021-45.
Anderson,RichardF.2010.Trends in local government expenditures on public water and wastewater services and infrastructure: Past, present and future.Washington:U.S.ConferenceofMayorsandMayors’WaterCouncil.
ASCE(AmericanSocietyofCivilEngineers).2009a.2009infrastructurefactsheet,waterandenvironment,factsaboutwastewater.www.infrastructurereportcard.org/fact-sheet/wastewater.
—.2009b.2009infrastructurefactsheet,waterandenvironment,factsaboutdrinking-water.www.infrastruc-turereportcard.org/fact-sheet/drinking-water.
AWWA(AmericanWaterWorksAssociation).2001.Dawnofthereplacementera:Reinvestingindrinking-waterinfra-structure.May.
Barber,Nancy.2011a.Hydrologist,GeorgiaWaterScienceCenterOffice,U.S.GeologicalSurvey.Personalcommunica-tionwithauthorHansen.June7.
—.2011b.Hydrologist,GeorgiaWaterScienceCenterOffice,U.S.GeologicalSurvey.PersonalcommunicationwithauthorHansen.August2.
BEA(BureauofEconomicAnalysis).2011.Grossdomes-ticproductbystate:Allindustrytotal,1997–2010.U.S.DepartmentofCommerce.Datadownloadedthroughwww.bea.gov/regional/index.htm.
Blackhurst,Michael,ChrisHendrickson,andJordiSelsiVidal.2010.DirectandindirectwaterwithdrawalsforU.S.industrialsectors.Environ. Sci. Technol.44:2126-30.
BLS(BureauofLaborStatistics).2011.Consumerpriceindexhistorytable,U.S.DepartmentofLaborftp://ftp.bls.gov/pub/special.requests/cpi/cpiai.txtAccessedJuly12,2011
CBO(CongressionalBudgetOffice).2010.Publicspendingontransportationandwaterinfrastructure:Supplementaltables.www.cbo.gov/ftpdocs/119xx/doc11940/SupplementalTables.xls.
EPA(U.S.EnvironmentalProtectionAgency).1997a.Drinking-waterinfrastructureneedssurvey:FirstreporttoCongress.OfficeofWater.EPA-812-R-97-001.January.
—.1997b.1996cleanwaterneedssurveyreporttoCongress.OfficeofWater.EPA-832-R-97-003.September.
—.2001.Drinking-waterinfrastructureneedssurvey:SecondreporttoCongress(1999).OfficeofWater.EPA-816-R-01-004.February.
—.2002.Thecleanwateranddrinking-waterinfrastructuregapanalysis.OfficeofWater(4606M).EPA-816-R-02-020September.
—.2003.Cleanwatershedsneedssurvey2000reporttoCongress.OfficeofWater.EPA-832-R-03-001.August.
—.2005.Drinking-waterinfrastructureneedssurveyandassessment:ThirdreporttoCongress(2003).OfficeofWater.EPA-816-R-05-001.June.
★|reFerenCes

48 American Society of Civil Engineers
acknoWledgmenTS
EDRGroupwishestothankBrianPallasch,JaneHowell,EmilyFishkin,aswellasASCE’sCommitteeonAmerica’sInfrastructurefortheopportunitytoconductthisresearch.WewishtogratefullyacknowledgetheassistanceofJeffreyWerling,RonHorstandDougMeadoftheUniversityofMarylandEconomicsDepartment.Inadditiontopeopleinterviewed,thisanalysis,wouldnothavebeenpossiblewithouttheadviceandsupportofthefollowingpeople:
SteveAllbee,ProjectDirector,GapAnalysis,UnitedStatesEnvironmentalProtectionAgency,OfficeofWastewaterManagement
MarkBeaudry,ProjectEngineer,MeridianAssociates
TimBall,GeneralManager,Morgantown(WestVirginia)UtilityBoard
NancyBarber,Hydrologist,UnitedStatesGeologicalSurvey,GeorgiaWaterScienceCenterOffice
ErikaBerlinghof,DirectorofGovernment&IndustryRelations,NationalAssociationofWaterCompanies
HeatherCooley,Co-DirectorofWaterProgram,PacificInstitute
BillHoffman,President,H.W.(Bill)HoffmanandAssociates,LLC.
AnnaJacobson,Economist,BureauofEconomicAnalysis
DouglasKehlhem,DirectorofCorporateSiteLocation,MassEcon
JoanKenny,WaterUseSpecialist,UnitedStatesGeologicalSurvey,KansasWaterScienceCenter
RochelleMiller,Owner,AguaDulceTexasWaterDelivery
HeidiRiedel,TechnicalInformationSpecialistandTomCurtis,DeputyExecutiveDirector,AmericanWaterWorksAssociation
ElmerRonnebaum,GeneralManager,KansasRuralWaterAssociation
RobertRoscoe,GeneralManager,SacramentoSuburbanWaterDistrict
Seckler,David,UpaliAmarasinghe,DavidMolden,RadhikadeSilva,andRandolphBarker.1998.World water demand and supply, 1990 to 2025: Scenarios and issues.ResearchReport19.Colombo:InternationalWaterManagementInstitute.www.iwmi.cgiar.org/Publications/IWMI_Research_Reports/PDF/PUB019/REPORT19.PDF
Smith,Adam.The Wealth of Nations.EditedbyEdwinCannan,NewYork,1965,p.28.
Solley,WayneB.,EdithB.Chase,andWilliamB.MannIV.1983.EstimateduseofwaterintheUnitedStatesin1980.U.S.GeologicalSurveyCircular1001.
Solley,WayneB.,CharlesF.Merk,andRobertR.Pierce.1988.EstimateduseofwaterintheUnitedStatesin1985.U.S.GeologicalSurveyCircular1004.
Solley,WayneB.,RobertR.Pierce,andHowardA.Perlman.1993.EstimateduseofwaterintheUnitedStatesin1990.U.S.GeologicalSurveyCircular1081.
—.1998.EstimateduseofwaterintheUnitedStatesin1995.U.S.GeologicalSurveyCircular1200.
USCB(U.S.CensusBureau).2001.P001:Totalpopulation.2001CensusSummaryFile1.Downloadedviahttp://fact-finder2.census.gov/faces/nav/jsf/pages/index.xhtml.
—.2010.P1:Totalpopulation.2010CensusSummaryFile1.Downloadedviahttp://factfinder2.census.gov/faces/nav/jsf/pages/index.xhtmlAccessedSeptember23,2011.
—.2011a.2009Annualcapitalexpendituressurvey,tables4aand4b.Downloadedviawww.census.gov/econ/aces/xls/2009/full_report.htmlAccessedSeptember23,2011.
—.2011b.Annualcapitalexpendituressurvey(1994-2008).Downloadedviawww.census.gov/econ/aces/historic_releases_ace.htmlAccessedSeptember23,2011.

aBoUT eDR GRoUp
Economic Development Research Group, Inc. (EDR Group), is a consulting firm focusing spe-cifically on applying state-of-the-art tools and techniques for evaluating economic development performance, impacts, and opportunities. The firm was started in 1996 by a core group of economists and planners who are specialists in evaluating the impacts of transportation infrastructure, services, and technology on economic development oppor-tunities. Glen Weisbrod, the president of EDR Group, was appointed by the National Academies to chair the TRB Committee on Transportation and Economic Development.
EDR Group provides both consulting advisory services and full-scale research projects for public and private agencies throughout North America as well as in Europe, Asia, and Africa. Its work focuses on three issues:
★ Economic Impact Analysis★ Benefit/Cost Analysis★ Market/Strategy Analysis
The transportation work of EDR Group includes studies of the economic impacts of road, air, sea, and railroad modes of travel, including economic benefits, development impacts, and benefit/cost relationships. The firm’s work is organized into three areas: (1) general research on investment benefit and productivity implications; (2) planning studies, including impact, opportunities, and benefit/cost assessments; and (3) evaluation, including cost-effectiveness implications.
Senior staff at EDR Group have conducted studies from coast to coast in both the U.S. and Canada, as well as in Japan, England, Scotland, Finland, the Netherlands, India, and South Africa. EDR Group is also nationally recognized for state-of-the-art analysis products, including the Transportation Eco-nomic Development Impact System (TREDIS).
aBoUT DownsTReam sTRaTeGies
Downstream Strategies offers environmental consulting services that combine sound interdisci-plinary skills with a core belief in the importance of protecting the environment and linking economic development with natural resource stewardship. The company builds capacity for sustainability through projects in three main subject areas—water, energy, and land—via its unique toolkit, which includes geographic information systems and stake-holder involvement and participation. Within the water program, the company performs economic and policy analyses, provides expert testimony and litigation support, and conducts field monitoring. Its scientific and policy reports equip its clients with the technical expertise needed to improve and protect water resources.

World Headquarters1801 Alexander Bell DriveReston, Virginia 20191
Washington Office101 Constitution Avenue, NWSuite 375 EastWashington, DC 20001
202/789-7850202/789-7859 FAX
[email protected]/reportcard


