
HAL Id: hal-02955560https://hal.archives-ouvertes.fr/hal-02955560
Submitted on 2 Oct 2020
HAL is a multi-disciplinary open accessarchive for the deposit and dissemination of sci-entific research documents, whether they are pub-lished or not. The documents may come fromteaching and research institutions in France orabroad, or from public or private research centers.
L’archive ouverte pluridisciplinaire HAL, estdestinée au dépôt et à la diffusion de documentsscientifiques de niveau recherche, publiés ou non,émanant des établissements d’enseignement et derecherche français ou étrangers, des laboratoirespublics ou privés.
The distribution of Silicon in soil is influenced bytermite bioturbation in South Indian forest soilsPascal Jouquet, Floriane Jamoteau, Sabyasachi Majumdar, Pascal
Podwojewski, Prakash Nagabovanalli, Laurent Caner, Doris Barboni,Jean-Dominique Meunier
To cite this version:Pascal Jouquet, Floriane Jamoteau, Sabyasachi Majumdar, Pascal Podwojewski, Prakash Nagabo-vanalli, et al.. The distribution of Silicon in soil is influenced by termite bioturbation in SouthIndian forest soils. Geoderma, Elsevier, 2020, 372, pp.114362. �10.1016/j.geoderma.2020.114362�.�hal-02955560�

Si distribution is impacted by termite activity. Submitted to Geoderma
1
The distribution of Silicon in soil is influenced by termite bioturbation in South 1
Indian forest soils 2
3
Pascal Jouqueta,b,*, Floriane Jamoteaua,b,c, Sabyasachi Majumdard, Pascal Podwojewskia, 4
Prakash Nagabovanallid, Laurent Canere, Doris Barbonic, Jean-Dominique Meunierc 5
6
Adresses 7
a Sorbonne Université, UPEC, CNRS, IRD, INRA, Institut d’écologie et des sciences de 8
l’environnement, IESS-Paris, F-93143 Bondy, France 9
b Indo-French Cell for Water Science (IFCWS), Indian Institute of Science, Bangalore, 10
Karnataka, India 11
cCEREGE, CNRS, Aix-Marseille University, IRD, INRA, 13545 Aix-en-Provence, France 12
d Department of Soil Science & Agril. Chemistry. University of Agricultural Sciences. GKVK, 13
Bangalore 560 065 Karnataka, India 14
e Université de Poitiers, Institut de Chimie des Milieux et Matériaux de Poitiers, IC2MP UMR 15
7285 CNRS, 5 rue Albert Turpain, TSA51106, 86073 Poitiers cedex 9, France 16
17
18
* Corresponding author: [email protected] 19
20

Si distribution is impacted by termite activity. Submitted to Geoderma
2
ABSTRACT 21
Si is one of the most abundant element on earth and an abundant literature shows its beneficial 22
effects on plant growth and resistance. We here question the influence of termites, as key soil 23
bioturbators, on the distribution of Si in a tropical soil. The abundance and forms of Si in termite 24
mounds build by Odontotermes obesus (TM) or in the soil eroded from TM but redistributed 25
on the ground surface (EROD) were compared to those measured in the 0-5 (Ctrl0-5) and 70-26
120 cm soil layers (Ctrl70-120). Although termites use the soil from Ctrl70-120 for building their 27
mounds, we found that TM and EROD had intermediate soil physical, chemical and 28
mineralogical properties between Ctrl0-5 and Ctrl70-120. Clay content was not significantly 29
different between soil materials. However, the lower variability measured in TM than in the 30
soil suggested that termites used soil layers with higher amounts of clay fraction and with a 31
preference especially for layers enriched in 2:1 clay minerals (smectite) most likely because 32
they provide better physical properties in terms of plasticity and water retention than kaolinite. 33
Finally, phytoliths and bioavailable Si (SiCC) contents were increased in TM in comparison with 34
Ctrl70-120, suggesting an incorporation of phytoliths in termite construction through their saliva 35
and/or an increasing availability of SiCC from the minerals. In conclusion, this study highlights 36
how termites, through their feeding and building activities, impact Si distribution in tropical 37
soils. 38
39
40
Keywords: Si, clay, mineralogy, phytoliths, bioturbation, soil profile 41

Si distribution is impacted by termite activity. Submitted to Geoderma
3
1. Introduction 42
Silicon (Si) is the second most abundant element in the earth’s crust after oxygen, with 43
approximately 28 and 47% of its mass, respectively (Singer and Munns, 1999). It is not included 44
in the list of elements essential for plants but there is an abundant literature showing its 45
beneficial effects on the resistance of plants to parasites and drought (Liang et al., 2015; Datnoff 46
et al., 2001). 47
In soil Si is a major constituent of parent rock minerals (such as quartz, feldspars) and 48
of secondary minerals originated from pedogenesis, such as clay minerals and amorphous silica. 49
Biogenic amorphous silica particles can also be found in soil as plant and microorganism 50
remains, i.e., phytoliths (Cornelis and Delvaux, 2016) and diatom frustules or thecamoebian 51
tests (Sommer et al., 2006). These amorphous silica particles can play an important role in the 52
cycling of Si because they constitute a pool of highly reactive silica (Fraysse et al., 2009). Large 53
fauna like grazers can also affect the cycling of Si through the accelerating transfer of plant Si 54
to aquatic environments (Schoelynck et al., 2019) or through the increase production of 55
biogenic silica (Melzer et al., 2010). The amount and quality of the different Si pools vary also 56
with soil depth. Soil horizons are usually identified by different clay contents and minerals 57
while phytoliths are usually concentrated in the topsoil and their content rapidly decreases with 58
depth (Alexandre et al., 1997). The pool of Si extracted by 0.01 M CaCl2 (SiCC) is used to 59
estimate the Si immediately available for plants (Haysom and Chapman, 1975). The distribution 60
of SiCC along soil profile may increase with depth and be associated with the clay fraction 61
(Vandevenne et al., 2015). Another pool considered bioavailable for plant is the pool of Si 62
adsorbed on the surface of minerals estimated by 0.05 M acetic acid extraction (SiAA) (Sauer et 63
al., 2006). SiAA seems to be controlled by oxides and clay minerals and may also increase with 64
depth (Cornelis et al., 2011 PLSO; Vandevenne et al., 2015). Surprisingly and despite their 65
importance in the cycling of nutrients, the impact of soil macrofauna on Si dynamic has been 66
poorly documented, with the exception of a recent article focusing on earthworms (Georgiadis 67

Si distribution is impacted by termite activity. Submitted to Geoderma
4
et al., 2019), and there is a dearth of information on how soil macrofauna impacts clay 68
mineralogy and the availability of Si for plants. 69
Amongst the soil macrofauna, organisms from the soil engineering group (sensu Lavelle 70
et al., 1997) impact soil functioning at different spatial and temporal scales (Bottinelli et al., 71
2015). This role is played by termites in tropical dryland ecosystems, and especially by termites 72
from the fungus-growing functional group (Macrotermitinae subfamily) in Africa and Asia 73
(Jouquet et al., 2016). Termites are key decomposers of the litter in tropical environments 74
(Amadou Issoufou et al., 2019) and their building activity is associated to the redistribution of 75
soil organic matter and elements in their biomass and organo-mineral constructions. Studies 76
carried out in Africa and Asia showed that fungus-growing termites impact the distribution, the 77
type of clay minerals (kaolinite vs. smectite) and the mineralogical properties of phyllosilicates 78
(Jouquet et al., 2002, 2007). Termites are also known to impact the dynamic of Si at the profile 79
scale through the selective use of material coming from the deep soil layers within their nests, 80
then resulting in the redistribution of clay minerals and elements (Holt and Lepage, 2000; Abe 81
et al., 2012; Mujinya et al., 2010, 2011, 2013; Erens et al., 2015). However, the depth at which 82
termites fetch the clay particles remains mostly unknown and termite bioturbation and the 83
upward translocation of soil from the deeper layers to the surface are likely to be associated 84
with a redistribution of SiCC and SiAA pools in termite mounds and thereafter in the surrounding 85
soil environment with the erosion of termite mounds. 86
In Southern India, the termite species Odontotermes obesus is known to play an 87
important role in the decomposition of litter (Shanbhag and Sundararaj, 2013) and its mounds 88
are conspicuous features of the landscapes (Shanbhag et al., 2017). These mounds are especially 89
abundant in protected areas such as in the deciduous forests of the Bandipur Tiger Reserve. In 90
this environment termite mounds have specific soil physical and chemical properties (Jouquet 91
et al., 2017a) and a recent study showed that they are mainly made of soil collected between 70 92

Si distribution is impacted by termite activity. Submitted to Geoderma
5
to 120 cm depth (Jouquet et al., 2017b). The aim of this study was therefore to determine the 93
impact of O. obesus bioturbation on the distribution of Si in soil. Our hypothesis was that 94
termite feeding and building activities (i.e., the construction of mounds from material selected 95
in the deep soil layers) participate in a selective redistribution of clay minerals, phytoliths and 96
available Si (SiCC), which are thereafter redistributed to the soil surface. 97
98
Material and Methods 99
Study site 100
Soils were sampled in the Mule Hole experimental watershed (4.1 km2). This dry deciduous 101
forest is located in the Bandipur Tiger reserve in Southern India at 11°44′N and 76°26′E 102
(Chamarajanagar district, Karnataka state). The Mule Hole watershed is located in the sub-103
humid zone of the sharp climatic gradient induced by the Western Ghats. As a result of the 104
short-term variability of the South-West Monsoon, the experimental watershed is characterized 105
by rainfall ranging from 1000 to 1500 mm yr−1, usually concentrated during the monsoon from 106
June to August and from October to November. The mean annual temperature is 27°C (Braun 107
et al., 2009). The elevation of the watershed ranges from 820 to 910 m a.s.l. The relief is mostly 108
undulating with gentle slopes. The soil cover of the watershed has been mapped by Barbiero et 109
al. (2007) based on the FAO terminology (IUSS-Working-Group-WRB, 2015). Parent rocks 110
consist of peninsular gneiss intermingled with much less abundant mafic to ultramafic rocks, 111
mostly amphibolite. Soil depth is variable but ranging from 1 to 3 m in average (Barbiero et al., 112
2007; Braun et al., 2009). The main soil types are Ferralsols and Chromic Luvisols, with clay 113
mineralogy dominated by kaolinite (1:1 clay) and characterized by an accumulation of iron and 114
aluminum oxides. The soils have less than 20 g kg-1 of C in the first soil layer and < 10 g kg-1 115
below 20 cm depth. The clay content ranges from 30 to 40% and clays minerals are also 116
dominated by 1:1 clays (kaolinite) (Jouquet et al., 2016b). The vegetation is a dry deciduous 117
forest. In this environment, cathedral-shaped termite mounds are built by O. obesus (Chhotani 118

Si distribution is impacted by termite activity. Submitted to Geoderma
6
and Bose, 1979; Jouquet et al., 2016a,b, 2017a) (Figure 1). The soil of termite mounds has 119
similar clay contents but it is impoverished in C (0.54-fold) in comparison with the surrounding 120
topsoil (Jouquet et al., 2016, 2017a,b). 121
122
Soil sampling 123
Termite mounds built by O. obesus vary considerably in size (Shanbhag et al., 2017) and only 124
large mounds from 1.5 to 1.8 m high and > 0.5 m3 were considered in this study. Samples were 125
collected from the outer-wall of three termite mounds (TM) and from their periphery in a 126
distance of about 15 cm (impacted by mound erosion, EROD). Soils were also sampled in the 127
surrounding soil environment (control) in a distance > 5–10 m ahead of the mounds in taking 128
into account the gentle slope of the watershed (not impacted by mound erosion) at several soil 129
depths down to 4.0 m in three different locations (n = 39). Data were grouped according to 130
their depths (Ctrl0-5: 0–5 cm, Ctrl70-120: 70-120 cm) with the assumption that termites collect the 131
soil mainly from the 70-120 cm soil layer for building their mounds (Jouquet et al., 2017b). 132
133
Analysis of soil properties 134
The soil physical properties measured included the particle-size distribution, after destruction 135
of organic matter and dispersion with sodium hexametaphosphate (AFNOR, NFX 31 107): clay 136
(< 2 µm) and silt (2–50 µm) were obtained by pipette method and sand (50–2000 µm) by 137
sieving. To assess Soil Organic Matter (SOM) content, the C and N concentrations were 138
measured using an elemental analyzer Flash 2000 HT. The cationic exchange capacity and the 139
content of exchangeable cations (Ca, Mg, Na, K, Fe, Mn and Al) were determined at soil pH 140
by exchange with cobaltihexamine (AFNOR, NF ISO 23470). The amount of SiO2, Fe2O3 and 141
Al2O3 were measured by ICP-OES after fusion with lithium metaborate LiBO2 and subsequent 142
dissolution in a mixture of HNO3 (1 mol L-1), H2O2 (0.5 % v/v) and glycerol (10 % v / v) at the 143

Si distribution is impacted by termite activity. Submitted to Geoderma
7
CNRS Service d’Analyse des Roches et des Minéraux (SARM) (Carignan et al., 2001). All 144
these analyses were carried out on soil aggregates >2 mm that were ground before analyses to 145
homogenize the material. 146
147
Si pools and phytoliths 148
Plant available Si was measured in comparing the pools of readily soluble Si extracted by 0.01 149
M CaCl2 (SiCC, Haysom and Chapman, 1975) and the pool of adsorbed Si extracted by 0.5 M 150
acetate-acetic acid (SiAA, Korndörfer and Lepsch, 2001; Narayanaswamy and Prakash, 2009, 151
2010). Phytoliths were extracted using HCl (33%) to remove carbonates, 2/3 nitric plus 1/3 152
perchloric acid to remove organic matter. Soil clays were removed by repeated decantations, 153
and separation of biogenic silica particles from heavy minerals was achieved by densimetric 154
separation using ZnBr2 set at d = 2.3 g cm-3. The extracts were weighted and phytoliths were 155
mounted on slides for observation under optical microscope. More than 250 phytoliths were 156
counted per sample. Morphotypes with clear taxonomical identification were silica short cell 157
phytoliths (rondel, bilobate, polylobate and cross) from Poaceae (grasses), spheroid psilate and 158
decorated from woody dicotyledons (considered forest indicator phytoliths), and spheroid 159
echinate from Arecaceae (palms). Other phytoliths included bulliform flabellate, acute bulbosus 160
(silicified hair cells), and various elongate and blocky morphotypes which were mostly non-161
diagnostic (International Code for Phytolith Nomenclature, 2019). The ratio of spheroid 162
decorated versus the sum of grass silica short cells (or D/P° index) increases with the increasing 163
abundance of trees and shrubs versus grasses and is commonly used to trace the tropical 164
forest/savanna boundary (Bremond et al. 2008). On the same slides, but in a separate counting 165
session we measured the proportion of corroded vs. plain phytoliths to identify the origin of 166
phytoliths with the assumption that phytoliths at depth likely underwent prolonged dissolution 167
Si distribution is impacted by termite activity. Submitted to Geoderma
8
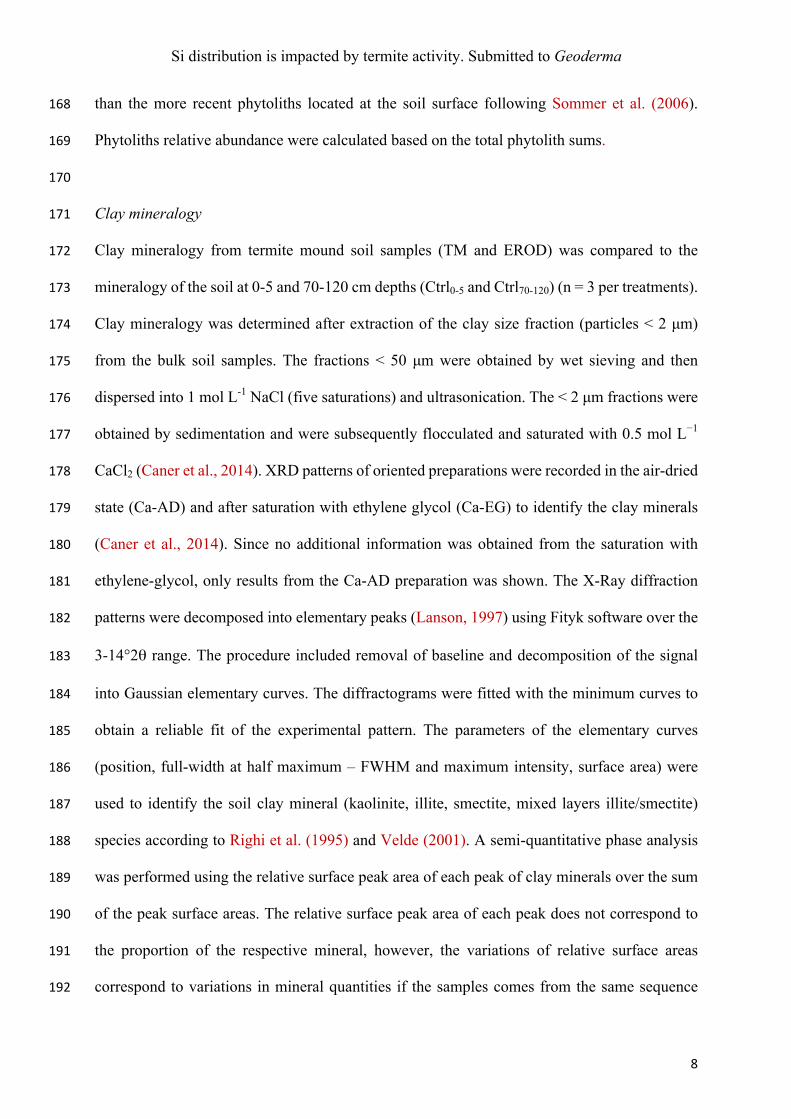
than the more recent phytoliths located at the soil surface following Sommer et al. (2006). 168
Phytoliths relative abundance were calculated based on the total phytolith sums. 169
170
Clay mineralogy 171
Clay mineralogy from termite mound soil samples (TM and EROD) was compared to the 172
mineralogy of the soil at 0-5 and 70-120 cm depths (Ctrl0-5 and Ctrl70-120) (n = 3 per treatments). 173
Clay mineralogy was determined after extraction of the clay size fraction (particles < 2 µm) 174
from the bulk soil samples. The fractions < 50 µm were obtained by wet sieving and then 175
dispersed into 1 mol L-1 NaCl (five saturations) and ultrasonication. The < 2 µm fractions were 176
obtained by sedimentation and were subsequently flocculated and saturated with 0.5 mol L−1 177
CaCl2 (Caner et al., 2014). XRD patterns of oriented preparations were recorded in the air-dried 178
state (Ca-AD) and after saturation with ethylene glycol (Ca-EG) to identify the clay minerals 179
(Caner et al., 2014). Since no additional information was obtained from the saturation with 180
ethylene-glycol, only results from the Ca-AD preparation was shown. The X-Ray diffraction 181
patterns were decomposed into elementary peaks (Lanson, 1997) using Fityk software over the 182
3-14°2θ range. The procedure included removal of baseline and decomposition of the signal 183
into Gaussian elementary curves. The diffractograms were fitted with the minimum curves to 184
obtain a reliable fit of the experimental pattern. The parameters of the elementary curves 185
(position, full-width at half maximum – FWHM and maximum intensity, surface area) were 186
used to identify the soil clay mineral (kaolinite, illite, smectite, mixed layers illite/smectite) 187
species according to Righi et al. (1995) and Velde (2001). A semi-quantitative phase analysis 188
was performed using the relative surface peak area of each peak of clay minerals over the sum 189
of the peak surface areas. The relative surface peak area of each peak does not correspond to 190
the proportion of the respective mineral, however, the variations of relative surface areas 191
correspond to variations in mineral quantities if the samples comes from the same sequence 192

Si distribution is impacted by termite activity. Submitted to Geoderma
9
(Lanson 1997). Peaks at ∼7.20 and 7.30-7.40 Å were attributed to kaolinite (K). The peak of 193
illite at ∼10 Å was decomposed into well crystallized illite (WCI) at 10.0 Å and poorly 194
crystallized illite (PCI) at 10.2-10.4 Å. The peaks at ∼15 Å in AD state that displace to ∼17 Å 195
were attributed to smectite (S) and the peaks between 10 and 15 Å in AD state that displaced 196
between 10 and 17 Å in EG were attributed to mixed layers illite/smectite with variable 197
proportion of the two components. 198
199
Statistical analyses 200
Residues were tested for normality of variance using the Shapiro–Wilk test and log10-201
transformed if required. Soil chemical and physical properties were analyzed by analysis of 202
variance (ANOVA) with treatments as independent variables. LSD tests were then performed 203
to assess differences between means. Post-hoc planned pairwise comparisons were performed 204
by Wilcoxon–Mann–Whitney U tests when parametric ANOVA were impossible to use, even 205
after data transformation. Impact of the treatments on soil variables and soil mineralogy were 206
analyzed using a principal component analysis (PCA). Correlations between variables and the 207
amount in SiCC, SiAA and phytoliths were carried out using the spearman test. 95% confidence 208
intervals associated to the percentages in phytoliths and 99% confidence intervals associated 209
with the D/P° ratios were calculated following Suchéras-Marx et al. (2019). All statistical 210
parameters were calculated using R studio and R version 3.2.1 with ade4, factoextra, 211
factoMineR and corrplot packages. Differences among treatments were declared significant at 212
the 0.05 probability level. 213
214
Results 215
Difference in soil chemical and physical properties 216
The chemical properties of the 4 soil materials are shown in Table 1 and a PCA-projection of 217
the samples from significant variables is shown in Figure 1. Soil materials were mainly 218

Si distribution is impacted by termite activity. Submitted to Geoderma
10
differentiated along the first axis while the variability within the samples was evidenced on the 219
second axis, which explained 63.0 and 18.5% of the total variability, respectively. Samples 220
varied from the soil surface (Ctrl0-5) to TM, EROD and finally Ctrl70-120. No significant 221
difference in soil particle size fractions, in pH and in exchangeable Mg2+ and K+ contents could 222
be measured between the four soil materials (P > 0.05 in all cases) (Table 1). Ctrl0-5 was 223
enriched in C and N and characterized by a greater CEC and exchangeable Ca2+ content but 224
lower exchangeable Al3+ content in comparison with the other treatments. Conversely, Ctrl70-225
120 were impoverished in C and N but enriched in exchangeable Na+, Al2O3 and Fe2O3 in 226
comparison with the other soil materials. In general, TM and EROD had intermediate properties 227
in comparison with the Ctrl0-5 and Ctrl70-120 (Figure 1) and no significant difference occurred 228
between them, with the exception of the concentration in exchangeable Mn2+ that was similar 229
in TM and Ctrl70-120 but higher than in EROD and Ctrl0-5 (P > 0.05 between them, Table 1). 230
Figure 2 shows the evolution of clay content in TM and EROD and at different soil depths. The 231
amount of clay was highly variable (e.g. from < 10 to > 50% at 150 cm depth), especially in 232
comparison with the clay content in TM and EROD. Despite this high variability, an increase 233
in clay content was measured at about 50-150 cm depth. 234
235
Si pools and phytoliths 236
Figure 3 shows that the proportion of SiO2 and the amount of SiCC were the lowest in Ctrl70-120, 237
without any significant difference between the other treatments (P > 0.05). Conversely SiAA 238
content was the highest in Ctrl70-120 and the lowest in Ctrl0-5 while TM and EROD had 239
intermediate positions. The proportion of phytoliths was low with percentages < 1%. The 240
highest value was measured in Ctrl0-5 in comparison with Ctrl70-120 and TM (P < 0.05 in both 241
cases). Conversely, the lowest value was measured in Ctrl70-120 in comparison with Ctrl0-5 and 242
EROD (P < 0.05 in both cases). TM and EROD had a similar percentage of phytoliths with 243

Si distribution is impacted by termite activity. Submitted to Geoderma
11
intermediate values in comparison with the two control soils. SiCC was not correlated with the 244
soil physical and chemical properties, with the exception of a positive correlation with 245
phytoliths (P = 0.028) and Mg2+ (P = 0.017). Conversely, SiAA was negatively correlated with 246
the amounts in C, N, the CEC and Si:Al ratio (P = 0.048, 0.048, 0.049 and 0.013, respectively) 247
but positively correlated with the total amount in Al2O3 (P = 0.013). Moreover, the amount in 248
phytoliths was positively correlated with the CEC and the amounts in C, N, Ca2+, Mg2+ and 249
SiCC (P = 0.001, 0.008, 0.008, 0.001, 0.001 and 0.028, respectively) but negatively correlated 250
to the amount in Fe3+ and Al3+ (P = 0.018 and 0.011, respectively). 251
Identification of the phytoliths shows that most of them came from grasses and woody 252
dicotyledons (trees and shrubs), with little differences in the phytolith-inferred vegetation signal 253
between Ctrl0-5 and Crtl70-120, but strong difference with TM. In TM, phytolith pool was 254
essentially coming from grasses (phytolith ratio Dicotyledons:Poaceae, D:P° < 0.7), while it 255
was coming from woody plants in the Crtl samples (D:P° > 2) (Figure 4 and see appendix A 256
for the detailed phytolith counts). A gradient of corrosion was observed from the top-soil to the 257
deeper soil layers with a dominance of non-corroded phytoliths in Ctrl0-5, a dominance of 258
corroded phytoliths in the 90-100 cm soil layer and intermediate values in the 20-40 cm soil 259
layer (Figure 5). In TM, phytoliths had intermediate proportion of corroded phytoliths than 260
between the 0-5 and 20-40 cm soil layers (Figures 5 and 6). 261
262
Variation in clay abundance and mineralogy with soil depth 263
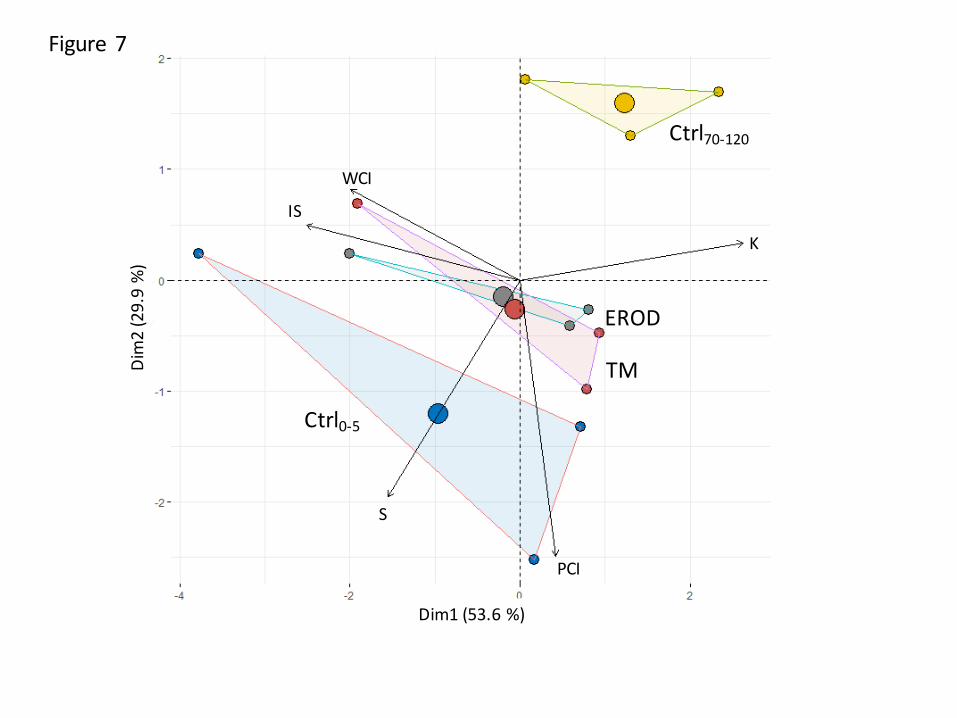
Differences in clay mineralogy between soil samples are shown in Figure 7. Soil materials were 264
mainly differentiated by the second axis, which explained 30% of the total variability. Samples 265
from the topsoil were enriched in smectite (S) and poorly crystallized illite (PCI) in comparison 266
with soil sampled below 70 cm depth that were rich in kaolinite (K). TM and EROD had the 267

Si distribution is impacted by termite activity. Submitted to Geoderma
12
same signatures and intermediate properties between those of the soils sampled in Ctrl0-5 and 268
Ctrl70-120. 269
270
Discussion 271
Bioturbation and translocation of clay 272
Bioturbation and the edification of termite mounds by fungus-growing termites is associated 273
with a translocation of soil material from the deeper soil layers to the surface. Usually evidenced 274
by an enrichment in clay particles or the presence of minerals that are less abundant than in the 275
topsoil, this process of translocation as well as the depth at which termites collect the soil remain 276
poorly quantified. In a recent study, we showed that the soil from the outer-wall of O. obesus 277
mounds mainly comes from the ~ 70 to 120 cm soil layer (Jouquet et al., 2017b). Here, measure 278
of the percentage of clay fraction in soil did not evidence a significant difference between soil 279
materials, mainly because of the high variability in clay content along the soil profile. This 280
variability in clay content was reduced in termite mound soils, showing a possible regulation 281
of the amount of clay fraction in soil by termites for strengthening cohesion between aggregate 282
and ensuring the resistance of TM, as evidenced in laboratory conditions (Jouquet et al., 2002, 283
Oberst et al., 2016) and for a better control of their habitat and resistance to predators (Jouquet 284
et al., 2006). 285
286
Si available pools 287
The 0-5 cm soil layer was enriched in SiO2 in comparison with the 70-120 cm soil layer, which 288
was enriched in Al2O3 content (see the supplementary file 1 showing the higher concentration 289
in Al2O3 at this soil depth). Phytoliths in the 70-120 cm soil layer were also less abundant and 290
more corroded than in the topsoil in a good agreement with previous observations (Alexandre 291
et al., 1997; Sommer et al., 2006). Indeed, the dynamic of phytoliths in soil results from burial, 292
illuviation and bioturbation processes and phytoliths from deeper horizons are usually less 293
Si distribution is impacted by termite activity. Submitted to Geoderma
13
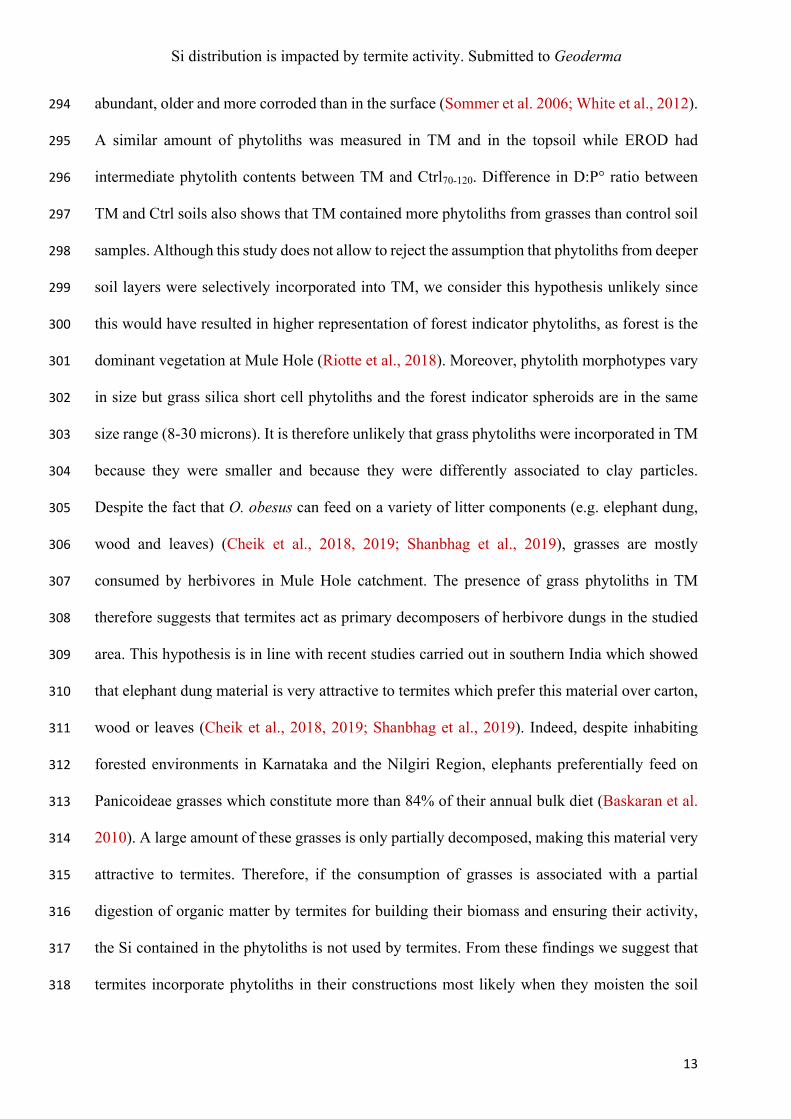
abundant, older and more corroded than in the surface (Sommer et al. 2006; White et al., 2012). 294
A similar amount of phytoliths was measured in TM and in the topsoil while EROD had 295
intermediate phytolith contents between TM and Ctrl70-120. Difference in D:P° ratio between 296
TM and Ctrl soils also shows that TM contained more phytoliths from grasses than control soil 297
samples. Although this study does not allow to reject the assumption that phytoliths from deeper 298
soil layers were selectively incorporated into TM, we consider this hypothesis unlikely since 299
this would have resulted in higher representation of forest indicator phytoliths, as forest is the 300
dominant vegetation at Mule Hole (Riotte et al., 2018). Moreover, phytolith morphotypes vary 301
in size but grass silica short cell phytoliths and the forest indicator spheroids are in the same 302
size range (8-30 microns). It is therefore unlikely that grass phytoliths were incorporated in TM 303
because they were smaller and because they were differently associated to clay particles. 304
Despite the fact that O. obesus can feed on a variety of litter components (e.g. elephant dung, 305
wood and leaves) (Cheik et al., 2018, 2019; Shanbhag et al., 2019), grasses are mostly 306
consumed by herbivores in Mule Hole catchment. The presence of grass phytoliths in TM 307
therefore suggests that termites act as primary decomposers of herbivore dungs in the studied 308
area. This hypothesis is in line with recent studies carried out in southern India which showed 309
that elephant dung material is very attractive to termites which prefer this material over carton, 310
wood or leaves (Cheik et al., 2018, 2019; Shanbhag et al., 2019). Indeed, despite inhabiting 311
forested environments in Karnataka and the Nilgiri Region, elephants preferentially feed on 312
Panicoideae grasses which constitute more than 84% of their annual bulk diet (Baskaran et al. 313
2010). A large amount of these grasses is only partially decomposed, making this material very 314
attractive to termites. Therefore, if the consumption of grasses is associated with a partial 315
digestion of organic matter by termites for building their biomass and ensuring their activity, 316
the Si contained in the phytoliths is not used by termites. From these findings we suggest that 317
termites incorporate phytoliths in their constructions most likely when they moisten the soil 318

Si distribution is impacted by termite activity. Submitted to Geoderma
14
aggregate pellets with saliva and potentially faeces. This hypothesis is consistent with the 319
presence of monosaccharides from plant origin in the epigeous nest of fungus-growing termites 320
(Sall et al., 2002) and the higher C content measured in TM in comparison with Ctrl70-120 and 321
the positive correlation between phytoliths and the C content. Moreover, since phytoliths were 322
mainly non-corroded phytoliths in TM, we even suggest that phytoliths resist to termite and 323
microbial (including Termitomyces sp.) metabolisms. 324
SiCC and SiAA were respectively higher and lower in the topsoil layer in comparison with 325
Ctrl70-120. Interestingly, despite the fact that TM was mainly built from the soil at 70-120 cm 326
depth, TM had a closer signature with the topsoil than with the deeper soil with similar amounts 327
of SiO2, SiCC and SiAA. Although this study does not allow to disentangle the mechanisms 328
associated to this change in Si pools, the positive correlation between SiAA and the amount of 329
Al2O3, but not the amount in clay, and the positive correlation between SiCC and phytoliths 330
suggest either (i) a total reorganization of the structure of soil pellets and a decrease in the 331
interactions between Si and oxides and a shift from SiAA to SiCC, (ii) a production of SiCC from 332
phytolith dissolution, and/or (iii) a selection of particles from Ctrl70-120 that were impoverished 333
in oxides (see supplementary file 2) but enriched in clay and SiCC. Another explanation could 334
be that the dissolution of 2:1 clay minerals, mainly found on the topsoil and TM, increases the 335
SiCC pool, even if this process is likely to be limited with a soil pH > 6. This explanation is in 336
line with Violette et al. (2010) who found that the dissolution of smectite provides large amount 337
of dissolved silica (i.e., 75% of the export of dissolved silica) in the study watershed. 338
339
Modification in clay mineralogy 340
The 70-120 cm soil layer was characterized by a higher percentage of clay fraction and higher 341
contents in kaolinite and Al2O3 that are characteristics of kandic horizons (Brady and Weil, 342
1999; Soil Survey Staff, 2014). The presence of the kandic horizon was confirmed with the X-343
Si distribution is impacted by termite activity. Submitted to Geoderma
15
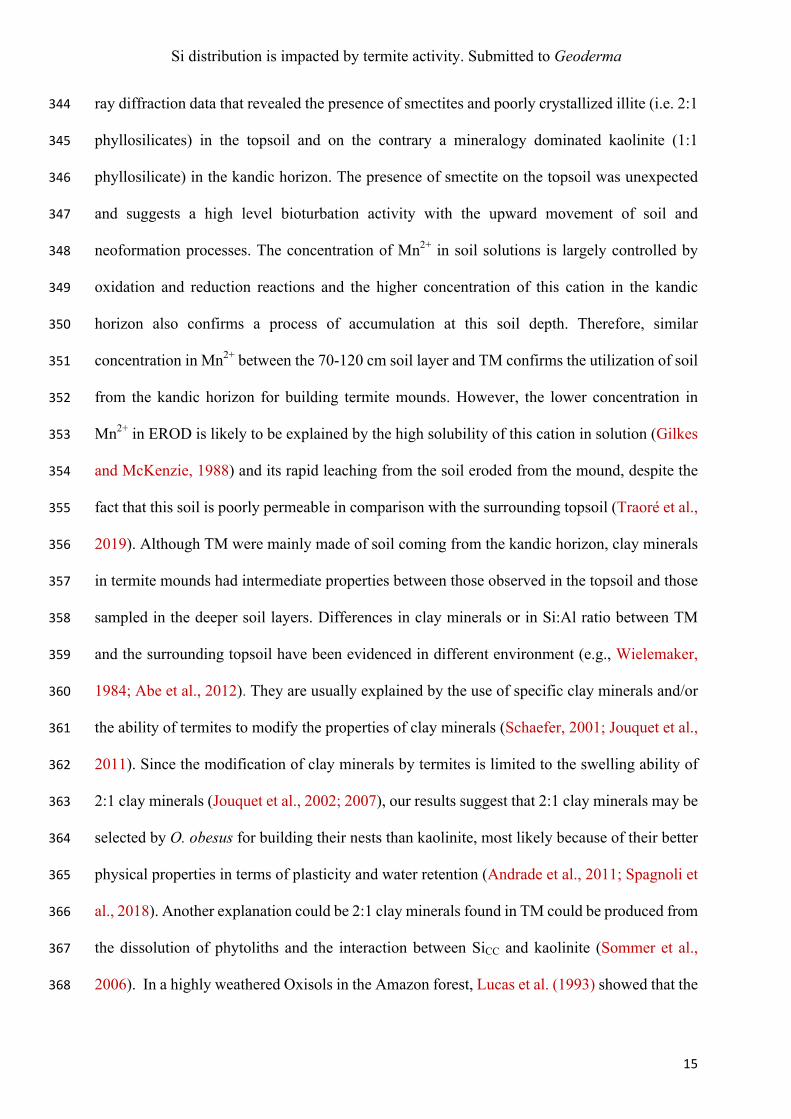
ray diffraction data that revealed the presence of smectites and poorly crystallized illite (i.e. 2:1 344
phyllosilicates) in the topsoil and on the contrary a mineralogy dominated kaolinite (1:1 345
phyllosilicate) in the kandic horizon. The presence of smectite on the topsoil was unexpected 346
and suggests a high level bioturbation activity with the upward movement of soil and 347
neoformation processes. The concentration of Mn2+ in soil solutions is largely controlled by 348
oxidation and reduction reactions and the higher concentration of this cation in the kandic 349
horizon also confirms a process of accumulation at this soil depth. Therefore, similar 350
concentration in Mn2+ between the 70-120 cm soil layer and TM confirms the utilization of soil 351
from the kandic horizon for building termite mounds. However, the lower concentration in 352
Mn2+ in EROD is likely to be explained by the high solubility of this cation in solution (Gilkes 353
and McKenzie, 1988) and its rapid leaching from the soil eroded from the mound, despite the 354
fact that this soil is poorly permeable in comparison with the surrounding topsoil (Traoré et al., 355
2019). Although TM were mainly made of soil coming from the kandic horizon, clay minerals 356
in termite mounds had intermediate properties between those observed in the topsoil and those 357
sampled in the deeper soil layers. Differences in clay minerals or in Si:Al ratio between TM 358
and the surrounding topsoil have been evidenced in different environment (e.g., Wielemaker, 359
1984; Abe et al., 2012). They are usually explained by the use of specific clay minerals and/or 360
the ability of termites to modify the properties of clay minerals (Schaefer, 2001; Jouquet et al., 361
2011). Since the modification of clay minerals by termites is limited to the swelling ability of 362
2:1 clay minerals (Jouquet et al., 2002; 2007), our results suggest that 2:1 clay minerals may be 363
selected by O. obesus for building their nests than kaolinite, most likely because of their better 364
physical properties in terms of plasticity and water retention (Andrade et al., 2011; Spagnoli et 365
al., 2018). Another explanation could be 2:1 clay minerals found in TM could be produced from 366
the dissolution of phytoliths and the interaction between SiCC and kaolinite (Sommer et al., 367
2006). In a highly weathered Oxisols in the Amazon forest, Lucas et al. (1993) showed that the 368

Si distribution is impacted by termite activity. Submitted to Geoderma
16
occurrence of kaolinite, instead of gibbsite, in the topsoil (or surface horizon) was attributed to 369
the resilication of gibbsite by the soluble silica provided by phytolith dissolution. A similar 370
process of resilication of kaolinite could be suggested for the formation of smectite in TM by 371
the biological uplift of cations and highly reactive silica from the dissolution of phytoliths. Over 372
longer period of time, the accumulation of 2:1 clay minerals in TM is likely to be important at 373
the ecosystem scale. Indeed, O. obesus mound turnover rate has been estimated to reach a soil 374
turnover of 3.1-31 mm ky-1 in the same study site (Jouquet et al., 2017). Since clay minerals 375
accumulated in termite mounds return to the surrounding soil environment after termite mound 376
degradation, further research is needed to determine if the accumulation of this material 377
contributes and/or explains the presence of 2:1 clay minerals in the topsoil. 378
379
Conclusion 380
Findings from this study show that O. obesus has a significant impact on the distribution of Si 381
in soil. First, we explained the lower variability in clay content in comparison with the high 382
variability measured along the soil profile by the need of termites to control the properties of 383
their nests, i.e., the amount of clay fraction in TM, then highlighting the importance of this 384
material for termites. The higher phytolith content in TM was unexpected but could be 385
explained by termite foraging activity (i.e., the consumption of grasses) and the excretion of 386
phytolith in termite saliva. Higher amount in SiCC was also surprising and raised the question 387
of a possible impact of termites on the interaction between Si and minerals in soil. In 388
perspective, we consider that more research is now needed to better understand the fate of the 389
phytoliths in TM. Further studies are also needed to determine if the increase in SiCC content in 390
TM contribute to explain the presence of 2:1 minerals in termite constructions (Jouquet et al., 391
2002) and the specific vegetation growing in the vicinity or on termite mounds in Africa (e.g., 392
Si distribution is impacted by termite activity. Submitted to Geoderma
17
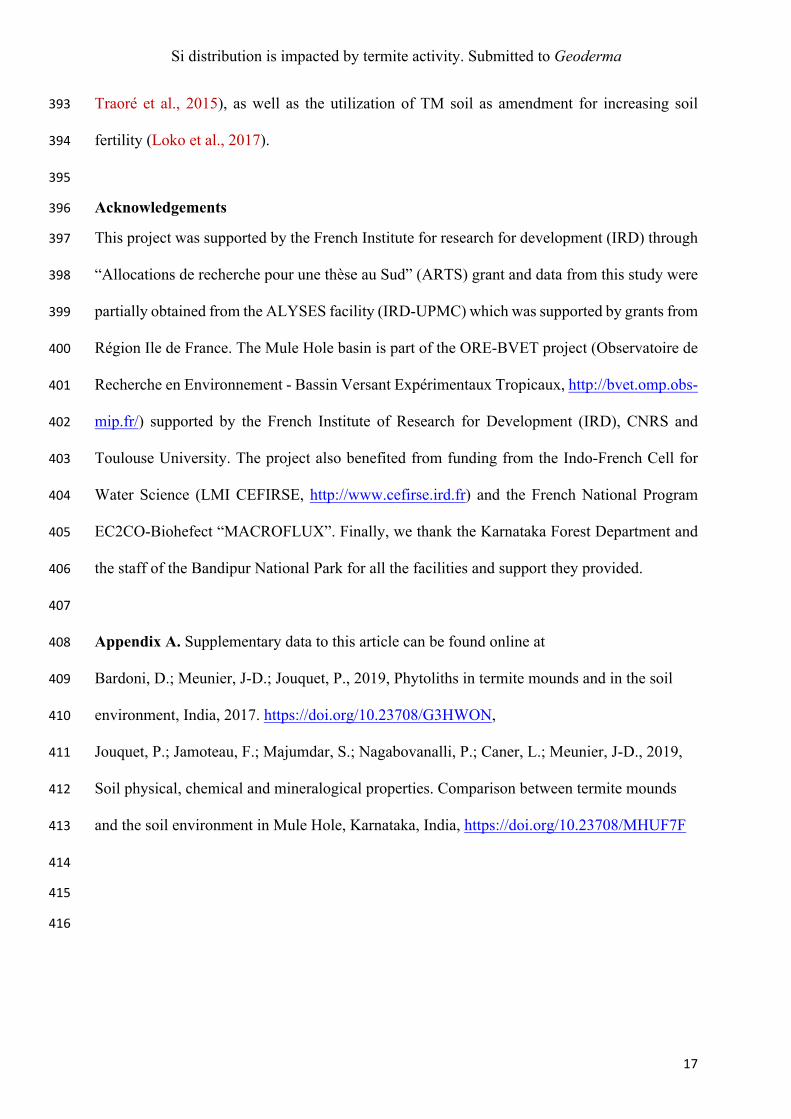
Traoré et al., 2015), as well as the utilization of TM soil as amendment for increasing soil 393
fertility (Loko et al., 2017). 394
395
Acknowledgements 396
This project was supported by the French Institute for research for development (IRD) through 397
“Allocations de recherche pour une thèse au Sud” (ARTS) grant and data from this study were 398
partially obtained from the ALYSES facility (IRD-UPMC) which was supported by grants from 399
Région Ile de France. The Mule Hole basin is part of the ORE-BVET project (Observatoire de 400
Recherche en Environnement - Bassin Versant Expérimentaux Tropicaux, http://bvet.omp.obs-401
mip.fr/) supported by the French Institute of Research for Development (IRD), CNRS and 402
Toulouse University. The project also benefited from funding from the Indo-French Cell for 403
Water Science (LMI CEFIRSE, http://www.cefirse.ird.fr) and the French National Program 404
EC2CO-Biohefect “MACROFLUX”. Finally, we thank the Karnataka Forest Department and 405
the staff of the Bandipur National Park for all the facilities and support they provided. 406
407
Appendix A. Supplementary data to this article can be found online at 408
Bardoni, D.; Meunier, J-D.; Jouquet, P., 2019, Phytoliths in termite mounds and in the soil 409
environment, India, 2017. https://doi.org/10.23708/G3HWON, 410
Jouquet, P.; Jamoteau, F.; Majumdar, S.; Nagabovanalli, P.; Caner, L.; Meunier, J-D., 2019, 411
Soil physical, chemical and mineralogical properties. Comparison between termite mounds 412
and the soil environment in Mule Hole, Karnataka, India, https://doi.org/10.23708/MHUF7F 413
414
415
416
Si distribution is impacted by termite activity. Submitted to Geoderma
18
References 417
Abe, S.S., Kotegawa, T., Onishi, T., Watanabe, Y., Wakatsuki, T., 2012. Soil particle 418
accumulation in termite (Macrotermes bellicosus) mounds and the implications for soil 419
particle dynamics. Ecol. Res. 27, 219-227. 420
Alexandre, A., Meunier, J.-D., Colin, F., Koud, J.-M., 1997. Plant impact on the 421
biogeochemical cycle of silicon and related weathering processes. Geochim. Cosmochim. 422
Ac. 61, 677–682. 423
Amadou Issoufou, A., Soumana, I., Maman, G., Konate, S., Mahamane, A., 2019. Effects of 424
termites growth on litter decomposition: a modeling approach. International Journal of 425
Recycling of Organic Waste in Agriculture, 1–7. 426
Andrade, F.A., Al-Qureshi, H.A., Hotza, D., 2011. Measuring the plasticity of clays: A review. 427
Appli. Clay Sci. 51, 1–7. 428
Barbiero, L., Parate, H. R., Descloitres, M., Bost, A., Furian, S., Kumar, M. S. M., Kumar, C., 429
Braun, J.-J., 2007. Using a structural approach to identify relationships between soil and 430
erosion in a semi-humid forested area, South India. Catena 70, 313–329. 431
Baskaran, N., Balasubramanian, M., Swaminathan, S., Desai, A.A., 2010. Feeding ecology of 432
the Asian elephant Elephas maximus Linnaeus in the Nilgiri Biosphere Reserve, southern 433
India. Journal of the Bombay Natural History Society 107, 3. 434
Bottinelli, N., Jouquet, P., Capowiez, Y., Podwojewski, P., Grimaldi, M., Peng, X., 2015. Why 435
is the influence of soil macrofauna on soil structure only considered by soil ecologists? 436
Soil Till. Res. 146, 118–124. 437
Brady, N.C., Weil, R.R., 1999. The nature and properties of soils. Twelfth Edition. Upper 438
Saddle River, New Jersey, Practice Hall, 881p. 439
Braun, J.-J., Descloitres, M., Riotte, J., Deschamps, P., Violette, A., Marechal, J. C., Sekhar, 440
M., Kumar, M.S.M., Subramanian, S., 2009. Contemporary versus long-term weathering 441
rates in Tropics: Mule Hole, South India. Geochim. Cosmochim. Ac. 73, A157. 442
Si distribution is impacted by termite activity. Submitted to Geoderma
19
Bremond, L., Alexandre, A., Peyron, O., Guiot, J., 2008. Definition of grassland biomes from 443
phytoliths in West Africa. J. Biogeogr. 35, 2039–2048. 444
Caner, L., Radtke, L.M., Vignol-Lelarge, M.L., Inda, A.V., Bortoluzzi, E.C., Mexias, A.S., 445
2014. Basalt and rhyo-dacite weathering and soil clay formation under subtropical climate 446
in southern Brazil. Geoderma 235, 100–112. 447
Carignan, J., Hild, P., Mevelle, G., Morel, J., Yeghicheyan, D., 2001. Routine analyses of trace 448
elements in geological samples using flow injection and low pressure on-line liquid 449
chromatography coupled to ICP-MS: a study of geochemical reference materials BR, DR-450
N, UB-N, AN-G and GH. Geostandards Newsletter 25, 187–198. 451
Cheik, S., Bottinelli, N., Sukumar, R., Jouquet, P., 2018. Fungus-growing termite foraging 452
activity increases water infiltration but only slightly and temporally impacts soil physical 453
properties in southern Indian woodlands. Eur. J. Soil Biol. 89, 20–24. 454
Cheik, S., Shanbhag, R., Harit, A., Bottinelli, N., Sukumar, R., Jouquet, P., 2019. Linking 455
termite feeding preferences and soil physical functioning in Southern-Indian woodlands. 456
Insects 10, 4. 457
Chhotani, O.B., Bose, G., 1979. Nesting behaviour and nests of Indian termites. Zoologiana 2, 458
16–28. 459
Cornelis, J.-T., Titeux, H., Ranger, J., Delvaux, B., 2011. Identification and distribution of the 460
readily soluble silicon pool in a temperate forest soil below three distinct tree species. 461
Plant Soil 342, 369-378. 462
Cornelis, J.T., Delvaux, B., 2016. Soil processes drive the biological silicon feedback loop. 463
Funct. Ecol. 30, 1298–1310. 464
Datnoff, L.E., Seebold, K.W., Correa-V., F.J., 2001. The use of silicon for integrated disease 465
management: reducing fungicide applications and enhancing host plant resistance. In: 466
Studies in Plant Science, Elsevier. Vol. 8, pp: 171–184. 467
Si distribution is impacted by termite activity. Submitted to Geoderma
20
Erens, H., Mujinya, B.B., Mees, F., Baert, G., Boeckx, P., Malaisse, F., Van Ranst, E., 2015. 468
The origin and implications of variations in soil-related properties within Macrotermes 469
falciger mounds. Geoderma 249–250, 40-50. 470
Fraysse, F., Pokrovsky, O.S., Schott, J., Meunier, J-D., 2009. Surface chemistry and reactivity 471
of plant phytoliths in aqueous solutions. Chem. Geol. 258, 197–206. 472
Georgiadis, A., Marhan, S., Lattacher, A., Mäder, P., Rennert, T., 2019. Do earthworms affect 473
the fractionation of silicon in soil? Pedobiol. 75, 1–7. 474
Gilkes, R.J., McKenzie, R.M., 1988. Geochemistry and Mineralogy of Manganese in Soils. In: 475
Graham R.D., Hannam R.J., Uren N.C. (eds) Manganese in Soils and Plants. 476
Developments in Plant and Soil Sciences, Vol 33. Springer, Dordrecht. 477
Haysom, M.B.C., Chapman, L.S., 1975. Some aspects of the calcium silicate trials at Mackay. 478
Proceeding 42, 117–122 479
Holt, A.J., Lepage, M., 2000. Termites and soil properties. Termites: evolution, sociality, 480
symbioses, ecology. B. Abe T., D.E., Higashi, M.. Netherlands, Kluwer Academic 481
Publishers. 18, pp: 389–407. 482
International Committee for Phytolith Taxonomy (ICPT), 2019. International Code for 483
Phytolith Nomenclature (ICPN) 2.0, Ann. Bot-London, 124, 189–199. 484
IUSS-Working-Group-WRB, 2015. World reference base for soil resources 2014, update 2015: 485
International soil classification system for naming soils and creating legends for soil 486
maps. World Soil Resources Reports No. 106, 192. 487
Jouquet, P., Mamou, L., Lepage, M., Velde, B., 2002. Effect of termites on clay minerals in 488
tropical soils: fungus-growing termites as weathering agents. Eur. J. Soil Sci. 53, 521–489
527. 490
Jouquet, P., Bottinelli, N., Lata, J-C., Mora, P., Caquineau, S., 2007. Role of the fungus-491
growing termite Pseudacanthotermes spiniger (Isoptera, Macrotermitinae) in the 492
Si distribution is impacted by termite activity. Submitted to Geoderma
21
dynamic of clay and soil organic matter content. An experimental analysis. Geoderma 493
139, 127–133. 494
Jouquet, P., Traoré, S., Choosai, C., Hartmann, C., Bignell, D., 2011. Influence of termites on 495
ecosystem functioning. Ecosystem services provided by termites. Eur. J. Soil Biol. 47, 496
215–222. 497
Jouquet, P., Bottinelli, N., Shanbhag, R.R., Bourguignon, T., Traoré, S., Abbasi, S.A., 2016. 498
Termites: the neglected soil engineers of tropical soils. Soil Sci. 181, 157–165. 499
Jouquet, P., Guilleux, N., Caner, L., Chintakunta, S., Ameline, M., Shanbhag, R.R., 2016. 500
Influence of soil pedological properties on termite mound stability. Geoderma 262, 45–501
51. 502
Jouquet, P., Airola, E., Guilleux, N., Harit, A., Chaudhary, E., Grellier, S., Riotte, J., 2017a. 503
Abundance and impact on soil properties of cathedral and lenticular termite mounds in 504
Southern Indian woodlands. Ecosystems 20, 769–780. 505
Jouquet, P., Caner, L., Bottinelli, N., Chaudhary, E., Cheik, S., Riotte, J., 2017. Where do 506
South-Indian termite mound soils come from? Appli. Soil Ecol. 117, 190–195. 507
Korndörfer, G.H., Lepsch, I., 2001. Effect of silicon on plant growth and crop yield. Studies in 508
plant science, Elsevier. 8, 133–147. 509
Lanson, B., 1997. Decomposition of experimental X-ray diffraction patterns (profile fitting): a 510
convenient way to study clay minerals. Clay Clay Miner. 45, 132–146. 511
Lavelle, P., Bignell, D., Lepage, M., 1997. Soil function in a changing world: the role of 512
invertebrate ecosystem engineers. Eur. J. Soil Biol. 33, 159–193. 513
Liang, Y., Nikolic, M., Bélanger, R., Gong, H., Song, A., 2015. Silicon in agriculture. 514
Dordrecht: Springer, 10: 978–994. 515

Si distribution is impacted by termite activity. Submitted to Geoderma
22
Loko, L.E.Y., Orobiyi, A., Agre, P., Dansi, A., Tamò, M., Roisin, Y., 2017. Farmers’ perception 516
of termites in agriculture production and their indigenous utilization in Northwest Benin. 517
J. Ethnobiol. Ethnomed. 13, 64. 518
Lucas, Y., Luizao, F. J., Chauvel, A., Rouiller, J., Nahon, D., 1993. The relation between 519
biological activity of the rain forest and mineral composition of soils. Science 260, 521–520
523. 521
Mehra, O.P., Jackson, M.L., 1960. Iron oxide removal from soils and clays by dithionite–citrate 522
systems buffered with sodium bicarbonate. Clays and Clay Minerals 7, 317–327. 523
Melzer, S.E., Knapp, A.K., Kirkman, K.P., Smith, M.D., Blair, J.M., Kelly, E.F., 2010. Fire 524
and grazing impacts on silica production and storage in grass dominated ecosystems. 525
Biogeochem. 97, 263–278. 526
Mujinya, B.B., Van Ranst, E., Verdoodt, A., Baert, G., Ngongo, L. M., 2010. Termite 527
bioturbation effects on electro-chemical properties of Ferralsols in the Upper Katanga 528
(DR Congo). Geoderma 158(3-4), 233-241. 529
Mujinya, B. B., Mees, F., Boeckx, P., Bodé, S., Baert, G., Erens, H., Delefortrie, S., Verdoodt, 530
A., Ngongo, M., Van Ranst, E., 2011. The origin of carbonates in termite mounds of the 531
Lubumbashi area, D.R. Congo. Geoderma 165(1), 95-105. 532
Mujinya, B.B., Mees, F., Erens, H., Dumon, M., Baert, G., Boeckx, P., Ngongo, M., Van Ranst, 533
E., 2013. Clay composition and properties in termite mounds of the Lubumbashi area, 534
D.R. Congo. Geoderma 192, 304-315. 535
Narayanaswamy, C., Prakash, N.B., 2009. Calibration and categorization of plant available 536
silicon in rice soils of South India. J. Plant Nut. 32, 1237–1254. 537
Narayanaswamy, C., Prakash, N.B., 2010. Evaluation of selected extractants for plant-available 538
silicon in rice soils of southern India. Commun. Soil Sci. Plan. 41, 977–989. 539
Si distribution is impacted by termite activity. Submitted to Geoderma
23
Oberst, S., Lai, J.C.S., Evans, T.A., 2016. Termites utilise clay to build structural supports and 540
so increase foraging resources. Sci. Rep-UK 6, 20990. 541
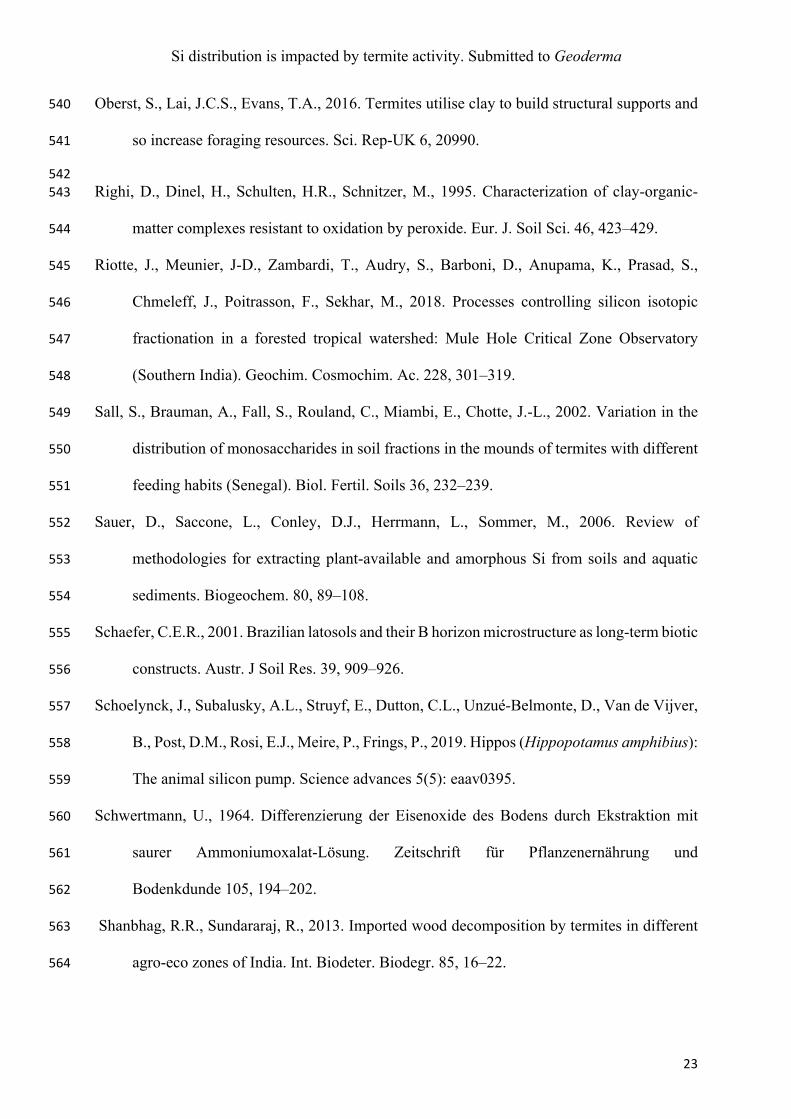
542Righi, D., Dinel, H., Schulten, H.R., Schnitzer, M., 1995. Characterization of clay-organic-543
matter complexes resistant to oxidation by peroxide. Eur. J. Soil Sci. 46, 423–429. 544
Riotte, J., Meunier, J-D., Zambardi, T., Audry, S., Barboni, D., Anupama, K., Prasad, S., 545
Chmeleff, J., Poitrasson, F., Sekhar, M., 2018. Processes controlling silicon isotopic 546
fractionation in a forested tropical watershed: Mule Hole Critical Zone Observatory 547
(Southern India). Geochim. Cosmochim. Ac. 228, 301–319. 548
Sall, S., Brauman, A., Fall, S., Rouland, C., Miambi, E., Chotte, J.-L., 2002. Variation in the 549
distribution of monosaccharides in soil fractions in the mounds of termites with different 550
feeding habits (Senegal). Biol. Fertil. Soils 36, 232–239. 551
Sauer, D., Saccone, L., Conley, D.J., Herrmann, L., Sommer, M., 2006. Review of 552
methodologies for extracting plant-available and amorphous Si from soils and aquatic 553
sediments. Biogeochem. 80, 89–108. 554
Schaefer, C.E.R., 2001. Brazilian latosols and their B horizon microstructure as long-term biotic 555
constructs. Austr. J Soil Res. 39, 909–926. 556
Schoelynck, J., Subalusky, A.L., Struyf, E., Dutton, C.L., Unzué-Belmonte, D., Van de Vijver, 557
B., Post, D.M., Rosi, E.J., Meire, P., Frings, P., 2019. Hippos (Hippopotamus amphibius): 558
The animal silicon pump. Science advances 5(5): eaav0395. 559
Schwertmann, U., 1964. Differenzierung der Eisenoxide des Bodens durch Ekstraktion mit 560
saurer Ammoniumoxalat-Lösung. Zeitschrift für Pflanzenernährung und 561
Bodenkdunde 105, 194–202. 562
Shanbhag, R.R., Sundararaj, R., 2013. Imported wood decomposition by termites in different 563
agro-eco zones of India. Int. Biodeter. Biodegr. 85, 16–22. 564

Si distribution is impacted by termite activity. Submitted to Geoderma
24
Shanbhag, R.R., Kabbaj, M., Sundararaj, R., Jouquet, P., 2017. Rainfall and soil properties 565
influence termite mound abundance and height: A case study with Odontotermes obesus 566
(Macrotermitinae) mounds in the Indian Western Ghats forests. Appli. Soil Ecol. 111, 567
33–38. 568
Shanbhag, R.R., Harit, A., Cheik, S., Chaudhary, E., Bottinelli, N., Sundararaj, R., Jouquet, P., 569
2019. Litter Quality Affects Termite Sheeting Production and Water Infiltration in the 570
Soil. Sociobiol. 66, 491–499. 571
Singer, M.J., Munns, D.N., 1999. Acidity and salinity. Soils: An Introduction. Upper Saddle 572
River, NJ, Prentice-Hall, pp. 285–296. 573
Soil Survey Staff, 2014. Keys to Soil Taxonomy - Soil Survey Staff, Twelfth Edition. US 574
Department of Agriculture, Washington D.C. 575
Sommer, M., Kaczorek, D., Kuzyakov, Y., Breuer, J., 2006. Silicon pools and fluxes in soils 576
and landscapes—a review. J. Plant Nutr. Soil Sci. 169, 310–329. 577
Spagnoli, G., Sridharan, A., Oreste, P., Bellato, D., Di Matteo, L., 2018. Statistical variability 578
of the correlation plasticity index versus liquid limit for smectite and kaolinite. Appl. Clay 579
Sci. 156, 152–159. 580
Suchéras-Marx, B., Escarguel, G., Ferreira, J., Hammer, Ø., 2019. Statistical confidence 581
intervals for relative abundances and abundance-based ratios: Simple practical solutions 582
for an old overlooked question. Mar. Micropaleontol. 151, 101751 583
Traore, S., Tigabu, M., Jouquet, P., Ouedraogo, S. J., Guinko, S., Lepage, M., 2015. Long-term 584
effects of Macrotermes termites, herbivores and annual early fire on woody undergrowth 585
community in Sudanian woodland, Burkina Faso. Flora 211: 40–50. 586
Traoré, S., Bottinelli, N., Aroui, H., Harit, A., Jouquet, P., 2019. Termite mounds impact soil 587
hydrostructural properties in southern Indian tropical forests. Pedobiol. 74, 1–6. 588

Si distribution is impacted by termite activity. Submitted to Geoderma
25
Vandevenne, F.I., Barão, L., Ronchi, B., Govers, G., Meire, P., Kelly, E. F., Struyf, E., 2015. 589
Silicon pools in human impacted soils of temperate zones. Global Biogeochem. Cy. 29, 590
1439–1450. 591
Velde, B., 2001. Clay minerals in the agricultural surface soils in the Central United States. 592
Clay Miner. 36, 277–294. 593
Violette, A., Goddéris, Y., Maréchal, J.-C., Riotte, J., Oliva, P., Kumar, M.S.M., Sekhar, M., 594
Braun, J.-J., 2010. Modelling the chemical weathering fluxes at the watershed scale in the 595
Tropics (Mule Hole, South India): Relative contribution of the smectite/kaolinite 596
assemblage versus primary minerals. Chem. Geol. 277, 42-60. 597
Wielemaker, W.G., 1984. Soil formation by termites: a study in the Kisii area, Kenya (Doctoral 598
dissertation, Wielemaker). 599

Si distribution is impacted by termite activity. Submitted to Geoderma
26
Figures and table captions 600
601
Figure 1. Biplot showing the principal components analysis (PCA) from variables describing 602
soil physical and chemical properties showed in Table 1 and significantly influenced 603
by the different treatments: control soil sampled at 0-5 and 70-120 cm depth in blue 604
and yellow, respectively, and the termite mound soil (TM, in red) or the soil eroded 605
from the mound (EROD, in grey). 606
607
Figure 2. Clay content along the soil profile, in the outer part of termite mound (TM, arbitrary 608
displayed at + 50cm depth) and in the soil eroded from TM (EROD, arbitrary 609
displayed at + 5 cm depth). The three different soil profiles are given in three different 610
soil colors. 611
612
Figure 3. Histograms showing the percentages in SiO2 and phytoliths (%), and the amounts in 613
SiCC and SiAA (ppm) in the outer part of termite mound (TM), in the soil eroded from 614
TM (EROD) and in the control soils at 0-5 and 70-120 cm depths (Ctrl0-5 and Ctrl70-615
120, respectively). Bars represent standard errors and histograms with the same letters 616
are not significantly different. 617
618
Figure 4. Abundance and diversity of phytoliths. 619
(a) Histograms showing the relative abundances of phytoliths in termite mound (TM) 620
and control samples at 0-5 (Ctrl0-5) and 70-120 (Crtl70-120) cm depths. The 621
differentiation was made into forest indicators, grasses, ND-elongate and ND-blocky 622
phytoliths. 623
(b) Ratio of spheroid decorated versus the sum of grass silica short cells (or D/P° 624
index). 625

Si distribution is impacted by termite activity. Submitted to Geoderma
27
626
Figure 5. Proportion of corroded, non-corroded and undetermined phytoliths for termite 627
mound (TM) and in the soil sampled at 0-5, 20-40 and 70-120 cm depths (Ctrl0-5 and 628
Ctrl70-120). 629
630
Figure 6. Examples of blocky and elongated non-corroded (a, b) and corroded phytoliths (c, d) 631
obtained in the microscope. The scale is given with the horizontal bar which 632
represents 40 mm. 633
634
Figure 7. Biplot showing the principal components analysis (PCA) from variables describing 635
clay mineralogy of the different soil materials. Treatments are the soil at 0-5 and 70-636
120 cm depth (in blue and yellow, respectively), the soil from termite mound (TM, 637
in red) and the soil eroded from TM (EROD, in grey). Clays are kaolinite (K), well 638
crystallized illite (WCI), poorly crystallised illite (PCI), inters-stratified (IS) and 639
smectite (S). 640
641
Supplementary file 1. Percentage in Fe2O3 and Al2O3 along the soil profile, in the outer part of 642
termite mound (TM, arbitrary displayed at + 50 cm depth) and in the soil eroded from 643
TM (EROD, arbitrary displayed at + 5 cm depth). 644
645
Supplementary file 2. Percentage of well crystallized oxides in soil (FeDCB – FeO and AlDCB – 646
AlO) extracted by the DCB (FeDCB and AlDCB) and oxalate methods (FeO and AlO) 647
(Mehra and Jackson, 1960; Schwertmann, 1964) along the soil profile, in the outer 648
part of termite mound (TM, arbitrary displayed at + 50 cm depth) and in the soil 649
eroded from TM (EROD, arbitrary displayed at + 5 cm depth). 650

Dim2(18.5%)
Dim1(63.0%)
C
N
CEC
Ca2+
Fe3+
Mn2+
Na+
Al3+
Figure1
EROD
TM
Ctrl0-5Ctrl70-120

Figure2
Soil
dept
h(c
m)
-400
-350
-300
-250
-200
-150
-100
-50
0
50
100
0 10 20 30 40 50 60
Clay (%)

64
66
68
70
72
74
76
TM EROD 0-5 70-120
SiO
2 (%
)
a aa
b
Control(cm)Control(cm)
SiA
A(p
pm)
0
20
40
60
80
100
051015202530354045
TM EROD 0-5 70-120
aa a
b
SiC
C(p
pm)
0
0.2
0.4
0.6
0.8
1
Phyt
olith
s(%
)
a
ab
bcc
a
ab
bcc
Figure3

Figure4
0 1 2 3 4
D:P°
5
TM
Ctrl0-5
Ctrl70-120

0
10
20
30
40
50
60
70
80
90
100
Nest 0-5 20-40 90-110
Corroded NonCorroded Undetermined
Figure5
TM 0-5 20-40 70-120
Soil depth (cm)

a b
c d
Figure6
EROD
TM
Ctrl0-5
Ctrl70-120
K
WCI
IS
PCI
S
Dim2(29.9%)
Dim1(53.6%)
Figure7

Supplementary file1
5 10 15 20
-400
-350
-300
-250
-200
-150
-100
-50
0
50
100
Soil
dept
h(c
m)
Al2O3 (%) Fe2O3 (%)
5 10 15 20

Soil
dept
h(c
m)
0.4 0.6 0.80.2
-200
-150
-100
-50
0
50
100
4 6 8 102
FeDCB - FeO (%) AlDCB - AlO (%)
Supplementary file2

Si distribution is impacted by termite activity. Submitted to Geoderma
28
Table 1 Major physical (contents in clay, silt and sand, in %) and chemical properties (contents in C and N in %, CEC, Ca2+, Mg2+, Na+, K+, 651
Fe3+, Mn2+ and Al3+ in cmol(+) kg-1) in the control soils at 0-5 and 70-120 cm depth (Ctrl0-5 and Ctrl 70-120, respectively) and in termite 652
mound (TM) or the soil eroded from TM (EROD). Values in parentheses are standard errors, values with the same letter are similar at P 653
= 0.05. Results from the ANOVA (F and P-values) and Wilcoxon–Mann–Whitney U (Chi2 and P-values) tests are also given. 654
655
656
C N Clay Silt Sand CEC Ca2+ Mg2+ Na+ K+ Fe3+ Mn2+ Al3+ pH (%) (cmol(+) kg-1)
TM (n = 3)
1.75b (0.38)
0.13b (0.03)
31.2 (3.87)
18.1 (0.6)
50.7 (1.8)
13.30b (0.61)
9.25b (0.60)
2.96 (0.05)
0.043b (0.002)
0.27 (0.04)
0.016ab (0.001)
0.18a (0.03)
0.09a (0.01)
6.03 (0.07)
EROD (n = 3)
1.95b (0.30)
0.14b (0.02)
29.7 (4.85)
18.9 (0.2)
51.4 (2.6)
13.80b (0.25)
9.68b (0.21)
3.22 (0.12)
0.039b (0.009)
0.40 (0.06)
0.016ab (0.002)
0.04b (0.01)
0.09a (0.01)
6.45 (0.22)
Ctrl0-5 (n = 3)
3.43a (0.29)
0.25a (0.03)
26.6 (5.14)
17.4 (0.3)
56.0 (2.9)
19.50a (0.78)
14.83a (0.92)
3.40 (0.21)
0.025b (0.003)
0.47 (0.11)
0.010b (0.003)
0.02b (0.03)
0.05b (0.01)
6.23 (0.13)
Ctrl70-120 (n = 10)
0.49c (0.27)
0.05c (0.03)
37.23 (14.87)
18.06 (2.02)
44.72 (3.17)
11.78b (1.11)
8.00b (0.89)
3.36 (0.34)
0.111a (0.01)
0.49 (0.09)
0.022a (0.002)
0.16a (0.04)
0.13a (0.01)
6.75 (0.90)
F3,15 P
15.75 <0.001
***
52.27 <0.001
***
0.80 0.511
0.05 0.986
1.74 0.202
5.84 0.007
**
6.9 0.004
**
11.36 <0.001
***
1.85 0.182
5.34 0.010
*
5.62 0.008
**
5.94 0.007
**
1.88 0.222
Chi² P
1.08 0.781
657


