
NREL is a national laboratory of the U.S. Department of Energy, Office of Energy Efficiency and Renewable Energy, operated by the Alliance for Sustainable Energy, LLC.
Technology Validation: Fuel Cell Bus Evaluations
2012 DOE Annual Merit Review
Leslie Eudy, National Renewable Energy Laboratory
May 17, 2012
Project ID# TV-008
This presentation does not contain any proprietary, confidential, or otherwise restricted information

2
Overview
Budget • Pre-FY 2011 funding
− DOE share: $1.977 M (8 yr)
• FY 2011: $300K • Planned FY 2012: $300K • Additional funding from
DOT/Federal Transit Admin.
Tech. Val. Barriers A. Lack of fuel cell vehicle
performance and durability data
C. Lack of H2 fueling infrastructure performance and availability data
D. Need for maintenance and training facilities
Partners • Fleets: Operational data, fleet
experience • Manufacturers: Vehicle specs,
data, and review • Fuel providers: Fueling data and
review
Timeline • Project started in FY03 • First-generation FCEB
evaluations completed in FY10
• Second-generation FCEB evaluations began Q4 FY09
3
Objectives – Relevance
Overall: Validate fuel cell technologies in transit applications • Analyze fuel cell electric bus (FCEB) performance and cost compared to
conventional technologies to measure progress toward commercialization • Provide “lessons learned” on implementing fuel cell systems in transit
operations to address barriers to market acceptance • Harmonize data collection efforts with other FCEB demonstrations
worldwide (in coordination with FTA and other U.S. and international partners)
2012 • Document more than 10,000 FC hours and 2x fuel economy compared to
baseline technology (diesel and natural gas buses) • Continue data collection and analysis for 2nd generation fuel cell buses at
Burbank, SunLine, AC Transit • DOT/FTA collaboration – collect data on sites for National Fuel Cell Bus
Program (NFCBP) • Conduct crosscutting analysis/comparison of FCEB status at all sites

4
Milestones
• Eight 1st gen buses operated by four transit agencies were evaluated between FY05 and FY10: o Santa Clara VTA, San Jose, CA: 3 buses o AC Transit, Oakland, CA: 3 buses o SunLine, Thousand Palms, CA: 1 bus o CTTRANSIT, Hartford, CT: 1 bus
• Evaluate 2nd generation FCEBs:
* Data included in this presentation
Transit Agency Project Location No.
buses Start-up date
SunLine Adv. Tech FCEB Thousand Palms, CA 1 May 2010 *
AC Transit ZEBA Emeryville, CA 12 June 2010 *
CTTRANSIT NFCBP: Nutmeg Hartford, CT 4 Aug 2010 *
SunLine NFCBP: AFCB Thousand Palms, CA 1 Jan 2012
SFMTA NFCBP: Bus 2010 San Francisco, CA 1 Jun 2012
Cap Metro NFCBP: Proterra Austin, TX 1 April 2012

5
Evaluation Approach
Data collection & analysis at transit sites • Follows standard protocol • Uses cost-effective process with data already collected by
agency • Includes data on baseline vehicles in same service (diesel,
CNG, diesel hybrid) • Builds database of evaluations/results
Annual FCEB status report / crosscutting analysis • Includes summary of data across all sites • Crosscutting analysis comparing FCEB results from all sites • Assesses progress and needs for continued success
Expansion of data collected and analyzed as resources allow

6
U.S. FCEB Numbers Continue to Grow
0
5
10
15
20
25
30
35
40
2005 2006 2007 2008 2009 2010 2011 2012 2013
Num
ber o
f Bus
es
Early Generation Retired Early Generation Active Next Generation Active
Data being collected on increasing number of FCEBs (includes FTA NFCBP buses)
Estimate 26 active FCEBs by the end of 2012; 28 by the end of 2013
26 Active FCEBs 28
est
imat
e

7
FCEB Design Strategies FCEB
Design Strategy Advantages Disadvantages
Fuel Cell Dominant
Charge sustaining hybrid bus – FC charges batteries
- Excellent performance - No range issues - Zero-emission
- Higher cost
Battery Dominant
Charge depleting electric bus – FC acts as a range extender
- Good performance - Smaller FC is less expensive - Zero-emission
- Still needs to be plugged in for best performance - Infrastructure for two energy sources: hydrogen and electricity
Diesel Hybrid w/ FC for accessories
Charge sustaining hybrid bus – FC handles all electric accessories and some motive power
- Excellent performance - Smaller FC is less expensive - Hybrid design is commercial product
- Need to deal with two fuels - Not zero-emission

8
FCEB OEM Partners
Bus OEM Fuel Cell System
Hybrid System
Design Strategy Energy Storage Transit Agency
Van Hool 40-ft UTC Power Siemens
ELFA Fuel cell dominant
Lithium-based batteries
AC Transit, Oakland, CA; CTTRANSIT, Hartford, CT
ElDorado 40-ft Ballard BAE
Systems Fuel cell dominant
Lithium-based batteries
SunLine, Thousand Palms, CA; Chicago Transit Authority
New Flyer 40-ft Ballard Siemens
ELFA Fuel cell dominant
Lithium-based batteries
SunLine, Thousand Palms, CA
Proterra 35-ft Hydrogenics
or Ballard Proterra
integration Battery
dominant Lithium-based
batteries Capital Metro, Austin, TX
DesignLine 35-ft Ballard DesignLine integration
Battery dominant
Lithium-based batteries
University of Ohio, Columbus
Ebus 22-ft Ballard Ebus
integration Battery
dominant Nickel cadmium University of Delaware,
Newark
EVAmerica Ballard EVAmerica integration
Battery dominant
Lithium-based batteries
BJCTA, Birmingham, AL
Daimler (Orion) Hydrogenics BAE Systems
Diesel Hybrid w/ FC BAE Systems San Francisco MTA
9
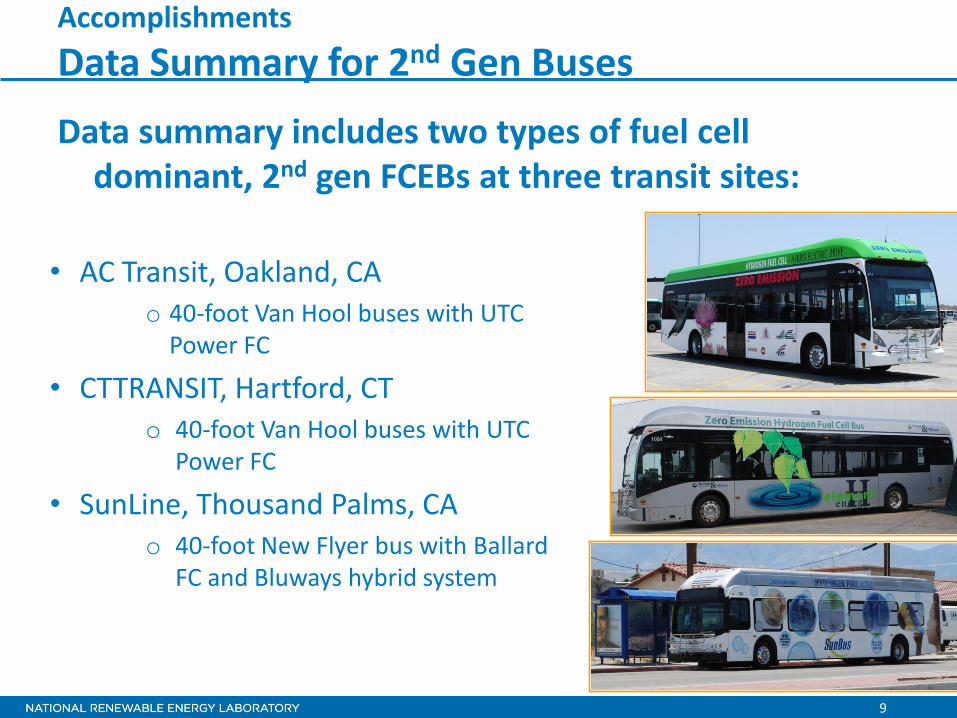
Accomplishments Data Summary for 2nd Gen Buses
Data summary includes two types of fuel cell dominant, 2nd gen FCEBs at three transit sites:
• AC Transit, Oakland, CA o 40-foot Van Hool buses with UTC
Power FC
• CTTRANSIT, Hartford, CT o 40-foot Van Hool buses with UTC
Power FC
• SunLine, Thousand Palms, CA o 40-foot New Flyer bus with Ballard
FC and Bluways hybrid system

10
Performance Targets for FCEBs
Units Commercialization Target
Bus Lifetime Years / miles 12 / 500,000
Powerplant Lifetime Years / hours 6 / 25,000
Bus Use Miles per month 3,000
Bus Availability % 90
Fuel Economy Miles per diesel gallon equivalent 8
Road call frequency (All/powerplant) Miles between road call 4,000/10,000
To meet commercialization targets, FCEBs need to meet or exceed performance of baseline conventional technology: diesel, CNG Current Performance Targets*
*All performance, cost, and durability targets summarized in draft DOE/DOT record

11
Accomplishments 2nd Gen FCEB Mileage Accumulation at 1,500 miles/month
0500
1,0001,5002,0002,5003,0003,5004,0004,5005,000
AC Transit CTTRANSIT SunLine
Mon
thly
Mile
s
FCEB Diesel CNG
3,000 mi Target
Transit agencies are increasing the number of scheduled miles per day: Buses operating as many as 19 hours/day with some weekend service

12
0
1
2
3
4
5
6
7
8
9
10
Mile
s per
die
sel g
allo
n eq
uiva
lent
ACT FCEB ACT Diesel CTT FCEB CTT Diesel CTT Hybrid SunLine FCEB SunLine CNG
Accomplishments FCEB Fuel Economy Consistently Higher than Baseline
Fuel economy is highly dependent on duty cycle: Average speed for SunLine – 13 mph; AC Transit – 9.9 mph; CTTRANSIT – 13.6 mph

13
Accomplishments 2nd Gen FCEB Designs Approach 2x Fuel Economy
• CTTRANSIT data include diesel hybrid buses in similar service as FCEBs: • FCEB – 7.78 mi/DGE • Diesel hybrid – 4.44 mpg • Standard diesel – 3.73 mpg
0
1
2
3
4
5
6
7
8
9
AC Transit CTTRANSIT SunLine
Mile
s per
die
sel g
allo
n eq
uiva
lent
FCEB Diesel Diesel hybrid CNG
1.86X
1.98X 2.0X
New FC bus designs have twice the fuel economy as diesel buses

14
Accomplishments 2nd Gen Average Availability at 53%
0 10 20 30 40 50 60 70 80 90 100
AC Transit
CTTRANSIT
SunLine
Fuel Cell Propulsion Hybrid Propulsion Battery Related
Bus Maintenance Fueling Unavailable
Availability = planned operation days compared to actual operation days
Average availability compared to conventional bus baseline • Lower numbers expected during the ‘break-in’ period for new design
Reasons for unavailability – percent of total by category • Not typically due to fuel cell issues • Bus maintenance issues include accident repair, AC system problems, materials compatibility • Hybrid issues primarily software related • Not seeing as many battery issues as in previous designs
0
10
20
30
40
50
60
70
80
90
100
AC Transit CTTRANSIT SunLine
Avai
labi
lity
%
FCEB Diesel CNG
85% Target
Newest data show increases in availability Feb 2012 = 62% overall 9 of 17 buses over 70%

15
0
5,000
10,000
15,000
20,000
25,000
30,000
35,000
AC Transit CTTRANSIT SunLine
Mile
s Bet
wee
n Ro
adca
ll
FCEB Diesel CNG
Accomplishments FC System MBRC* Increasing
• Still lower than target, but improving • Tends to vary widely by transit agency for any technology
Target for Propulsion System MBRC
Propulsion-system-only MBRC:
*MBRC = miles between roadcall

16
0
5,000
10,000
15,000
20,000
25,000
30,000
35,000
AC Transit CTTRANSIT SunLine
Mile
s Bet
wee
n Ro
adca
ll
FCEB Diesel CNG FCEB (FC only)
Accomplishments FC System MBRC* Increasing – 38% improvement
Target for Propulsion System MBRC
• Shows that most roadcalls are not due to fuel cell system issues • Newer design FCEBs still working through ‘break-in’ period
Fuel cell-system-only MBRC: FC System MBRC 38% improvement from 1st gen FCEBs – 8,158 miles
*MBRC = miles between roadcall

17
Bus fleet leaders - 3 FCPPs over 6,000 h
without repair or cell replacements
- Top FCPP now over 11,000 h
0
2,000
4,000
6,000
8,000
10,000
12,000
1 2 3 4 5 6 7 8 9 10 11 12 13 14 15 16 17 18
Tota
l FC
hour
s
Accomplishments Top Fuel Cell Powerplant Exceeds 11,000 hours
Total hours accumulated on each FC powerplant (FCPP) as of 1/31/12
Transit application provides excellent opportunity to accumulate miles/hours faster
0
2,000
4,000
6,000
8,000
10,000
12,000
FC h
ours

18
Accomplishments OEMs on a path to reduce capital cost to < $1M • Fuel costs remain higher • Operational costs still high
$0.00
$0.50
$1.00
$1.50
$2.00
$2.50
$3.00
$3.50
Total cost per mile Propulsion System Maintenance cost
per mile
Total Maintenance cost per mile
Fuel cost per mile
AC Transit FCEB
Diesel
$0.00
$0.50
$1.00
$1.50
$2.00
$2.50
$3.00
$3.50
Total cost per mile Propulsion System Maintenance cost
per mile
Total Maintenance cost per mile
Fuel cost per mile
CTTRANSIT FCEB
Diesel
$0.00
$0.50
$1.00
$1.50
$2.00
$2.50
$3.00
$3.50
Total cost per mile Propulsion System Maintenance cost
per mile
Total Maintenance cost per mile
Fuel cost per mile
SunLine FCEB
CNG
H2: $8.00/kg Diesel: $2.67/gal
H2: $6.86/kg Diesel: $3.32/gal
H2: $8.00/kg CNG: $0.90/gge
0
50
100
150
200
250
300
350
400
450
0.0
0.5
1.0
1.5
2.0
2.5
3.0
3.5
Num
ber o
f pro
duct
ion
units
Cost
per
uni
t in
Mill
ions
• Capital costs: – Still higher, but coming down – Larger quantity orders should help
Projected cost reductions with increasing units
Actual Projected
$3.2 M
<$1 M
FCEB cost
FCEB numbers 6
400
Source: FCHEA Fuel Cell Electric Bus White Paper, Mar 2011

19
Collaborations
• Transit agencies provide data on buses, fleet experience, and training, and review reports o California: AC Transit, BurbankBus, Golden Gate Transit, Santa Clara VTA,
SamTrans, SunLine, San Francisco MTA o Connecticut: CTTRANSIT o South Carolina: Central Midlands RTA, USC o Alabama: Birmingham-Jefferson County o Ohio: Ohio State University o Illinois: Chicago Transit Authority
• Manufacturers provide some data on buses and review reports o Bus OEMs: Proterra, Van Hool, New Flyer, ElDorado National o FC OEMs: Ballard, Hydrogenics, UTC Power, Nuvera o Hybrid system OEMs: BAE Systems, Bluways, GE, Van Hool
• Other organizations share information and data o National: CARB, NAVC, CTE, CALSTART o International: Various organizations from Germany, Iceland, Brazil, Canada,
China, Japan, England, Australia

20
2010 2011 2012 20131 2 3 4 1 2 3 4 1 2 3 4 1 2 3 4
AC Trans it / S F B ay Area C A 12 ZE B A Demo
S unLine / Thousand P alms C A 1 Advanced FC B Project
C ity of B urbank / B urbank C A 1 B urbank FC B
S unLine / Thousand P alms C A 1 American FC B Demo
C TTR ANS IT / Hartford C T 4 Nutmeg Hybrid FC B DemoUS C , C MR TA / C olumbia UT , C ap Metro / Aus tin
S C TX
1 Hybrid FC B Demo S ite 2
Logan Airport / B oston MA 1 MA H2 FC B
Newark / DE DE 1 Light-wt FC B
S F MTA / S an F rancisco C A 1 FC APU Hybrid
C TA / C hicago IL 1 C hicago FC B
B J C TA / B irmingham AL 1 B irmingham FC B
Ohio S tate / C olumbus OH 1 E coS aver IV Hybrid FC BUS C , C MR TA / C olumbia DC DO T / W as hington
S C DC 1 C omposite FC B
Demonstration s ites color coded by geographic area: Northern C alifornia Northeas t S outh
S outhern C alifornia S outheas t Midwes t
F uel C ell E lec tric B us E valuations for DOE and F T A
S ite/Locations S tateNo.
B uses
Future Work
May 2012

21
Future Work
• Remainder of FY 2012 o Continue data collection on 2nd generation FCEBs at AC
Transit, SunLine, and City of Burbank o Continue data collection on FCEBs developed under the
FTA program o Complete first crosscutting analysis of 2nd generation
FCEBs at all sites • FY 2013
o Analyze data and report on FCEBs at Burbank, SunLine, and AC Transit
o Explore new sites for potential data collection o Continue coordinating data collection activities with FTA o Complete annual crosscutting analysis across sites

22
Summary
Documented progress with 2nd generation FCEBs including: • Mileage accumulation at 1,500 miles/month • FCEB fuel economy consistently higher than diesel and CNG baseline • FCEB designs approach 2x fuel economy; meeting target of 8 mpdge • Average availability at 53%, most recent month up to 62% • FCPP MBRC increasing – 38% improvement over 1st generation FCEBs • Reliability data show road calls not typically due to FC system • Top fuel cell powerplant surpasses 11,000 hours
Units 2012 Status Draft Target
Bus Lifetime Years / miles 4.5 / 90,000 12 / 500,000
Powerplant Lifetime Years / hours 4 / 11,000 + 6 / 25,000
Bus Use Miles per month 1,500 3,000
Bus Availability % 62 90
Fuel Economy Miles per diesel gallon equivalent 8 8
Road call frequency Miles between road call 2,239 / 2,928 / 11,279 (All, propulsion system, FCPP)
4,000 / 10,000 (All, Powerplant)


