HAL Id: hal-02923072https://hal.archives-ouvertes.fr/hal-02923072
Submitted on 8 Oct 2020
HAL is a multi-disciplinary open accessarchive for the deposit and dissemination of sci-entific research documents, whether they are pub-lished or not. The documents may come fromteaching and research institutions in France orabroad, or from public or private research centers.
L’archive ouverte pluridisciplinaire HAL, estdestinée au dépôt et à la diffusion de documentsscientifiques de niveau recherche, publiés ou non,émanant des établissements d’enseignement et derecherche français ou étrangers, des laboratoirespublics ou privés.
Simulation of Damage Scenarios in a BituminousPavement Tested under FABAC ALT using M4-5n
Olivier Chupin, Jean Michel Piau, Armelle Chabot, Hanan Nasser, Mai LanNguyen, Yann Lefeuvre
To cite this version:Olivier Chupin, Jean Michel Piau, Armelle Chabot, Hanan Nasser, Mai Lan Nguyen, et al.. Simulationof Damage Scenarios in a Bituminous Pavement Tested under FABAC ALT using M4-5n. 6th APTconference, Université Gustave Eiffel, Apr 2022, Nantes, France. pp.389-398 in Lecture Notes in CivilEngineering (LNCE), 2020, �10.1007/978-3-030-55236-7_40�. �hal-02923072�

This is a pre-print of a contribution published in Accelerated Pavement Testing to
Transport Infrastructure Innovation - Proceedings of the 6th APT Conference. In:
Chabot A., Hornych P., Harvey J., Loria-Salazar L. (eds) Accelerated Pavement
Testing to Transport Infrastructure Innovation, Lecture Notes for Civil
Engineering, vol. 96: 389-398. Springer, Cham.
The final authenticated version is available online at: https://doi.org/10.1007/978-
3-030-55236-7_40
Simulation of Damage Scenarios in a
Bituminous Pavement Tested under FABAC
ALT using M4-5n
Olivier Chupin, Jean-Michel Piau, Armelle Chabot, Hanan Nasser, Mai Lan
Nguyen
LAMES-MAST, IFSTTAR, CS5004, 44344 Bouguenais Cedex, France
Yann Lefeuvre
COLAS, Campus scientifique et technique, 4 rue Jean Mermoz, 78772 Magny-les-Hameaux,
France
Abstract This paper presents the use of a specific layer-wise approach to analyze
the results of a FABAC accelerated loading test (ALT) carried out on a flexible
pavement with an initial flaw. The approach relies on M4-5n (Multi-particular
Model of Multilayer Materials) initially developed for the analysis of debonding
in composite materials. M4-5n was recently implemented into a mixed finite
element code. This model associated to a Winkler foundation makes it possible to
address quite easily problems related to pavements with discontinuities in 3D. The
experimental pavement is composed of two bituminous layers and includes initial
flaws (metal angles) intended to localize crack growth under repeated moving
loads. The pavement is monitored using strain gages and temperature sensors.
Moreover, a few FWD campaigns are performed at some steps of the test. The
simulations are used to infer the (unknown) pattern of cracking/debonding
developing during the first stage of the ALT. Among many patterns tested, one of
them is more likely to reflect the experimental facts and is presented hereafter.
Keywords M4-5n, debonding, cracking, FABAC device.
2
1 Introduction
Associated to different soil modeling, the Multi-particular Model of Multilayer
Material (M4) with 5n cinematic fields (n: total number of layers), known as M4-
5n (Chabot 1997), was previously proposed (Chabot et al. 2007) (Nasser and
Chabot, 2018) as an alternative to other approaches dealing with the modeling of
cracks and debonding in pavements (Buttlar et al. 2018). The main advantages of
this model are to reduce the actual dimension of the considered problem by one in
the solving process and to facilitate the geometrical description of discontinuity
areas. It also avoids stress singularities at debonding or crack edges between two
materials. The mixed formulation of M4-5n was recently developed and
implemented in a finite element code using the FreeFem++ environment (Hecht,
2012) (Nasser et al. 2018). Here, this numerical tool, named M4-FEM, is applied
to the 3D analysis of a full scale accelerated loading test (ALT) conducted on a
bituminous pavement using the FABAC device at IFSTTAR. In particular, it is
used to investigate cracking/debonding scenarios that possibly developed during
the fatigue test.
2 The FABAC ALT Test
The FABAC machines used in this study were initially designed and built to test
rigid pavements (Aunis and Balay 1998). Since then these linear traffic simulators
have been used at IFSTTAR for many other types of experiments such as bond
fatigue life of composite (concrete over asphalt) pavements (Chabot et al., 2008).
The FABAC machines are equipped with four dual tires placed along a chain in
close loop (Figure 1). The length of the loaded section is 2 m with only one semi-
axle applied at a time (maximum load of 75 kN). The loads move at a maximum
speed of 7 km/h without lateral wandering.
The main experimental facts and findings of the present ALT test are
summarized below. A detailed description of the experiment is given in (Nguyen
et al. 2019).
The pavement structure is composed of a 6cm-thick layer of high modulus
asphalt material (HMAM) covered by a 5 cm-thick base course of asphalt material
(BC) (Figure 1). A tack coat with 300 g/m² residual bitumen is applied at the
interface. The asphalt layers rest on an unbound graded aggregate subbase (UGA)
of thickness 33 cm built on the natural soil. Two metal angles are placed at the
bottom of the HMAM layer along the transversal direction and at mid-length of
the circulated area. These flaws aim at initiating and localizing crack growth in the
pavement. The structure is instrumented by means of temperature sensors (at
0, 5 and 11 cm from the pavement surface), longitudinal strain gages at the
bottom of layers 1 and 2 respectively and vertical strain gages at top of the UGA

3
layer (see Figure 1 for the gage locations). The horizontal gages are located below
the right wheel-path and the vertical ones in the longitudinal mid-plane. In
addition, FWD campaigns were planned at some steps. These were carried out by
moving the FWD plate every 10 cm along the longitudinal axis running between
the dual wheel paths of the FABAC machine.
About 1.5 million of FABAC loads of 65 kN (also named load cycles) were
applied in total at a speed equal to 3.7 km/h. In the following, the analysis of the
experimental data is limited to the first 350,000 cycles which already show
important changes in the behavior of the structure.
Fig. 1 The FABAC machine and the instrumented pavement (from Nguyen et al. 2019)
3 Main Facts Observed Between Cycles #0 and #350,000
The measurements obtained between cycles #0 and #350,000 are summarized in
Figure 2.
FWD deflection and vertical strains in UGA
Figure 2a shows the global increase of deflection measured under the FWD
plate for the campaigns performed at cycles #0 and #350,000. A large increase
of the vertical strain amplitudes (Z11 and Z12 gage measurements) in UGA is

4
also observed during this FABAC loading stage (Figure 2b). These
observations reflect a loss of bearing capacity of the pavement foundation (soil
+ UGA) which is attributed to water suction induced by a pumping effect
resulting from the quasi-uninterrupted repetition of FABAC loads. Moreover,
at cycle #350,000 two local peaks of deflection can be noticed on the FWD
profile in and .
Horizontal strains in the HMAM and BC layers
Figure 2c and Figure 2d show significant changes in the horizontal strains
recorded under the passing of the FABAC loads. In particular, a large increase
of amplitude for gage L11 and changes in shape of signals L13 and L14 (from
contraction to extension) are noticed in the course of loading.
Visual inspection of the pavement surface
A transverse crack in two pieces popping up at the pavement surface above the
metal angles is observed around cycle #1,000,000.
(a) (b)
(c) (d)
Fig. 2 Evolution of the measurements between cycle #0 and #350,000 (after Nguyen et al. 2019):
a) FWD measurements (central geophone), b) vertical strain amplitude in UGA, c) samples of
longitudinal strain profiles recorded in the asphalt layers under the passing of a FABAC load, d)
evolution of the longitudinal strain amplitude measured in the asphalt layers
5
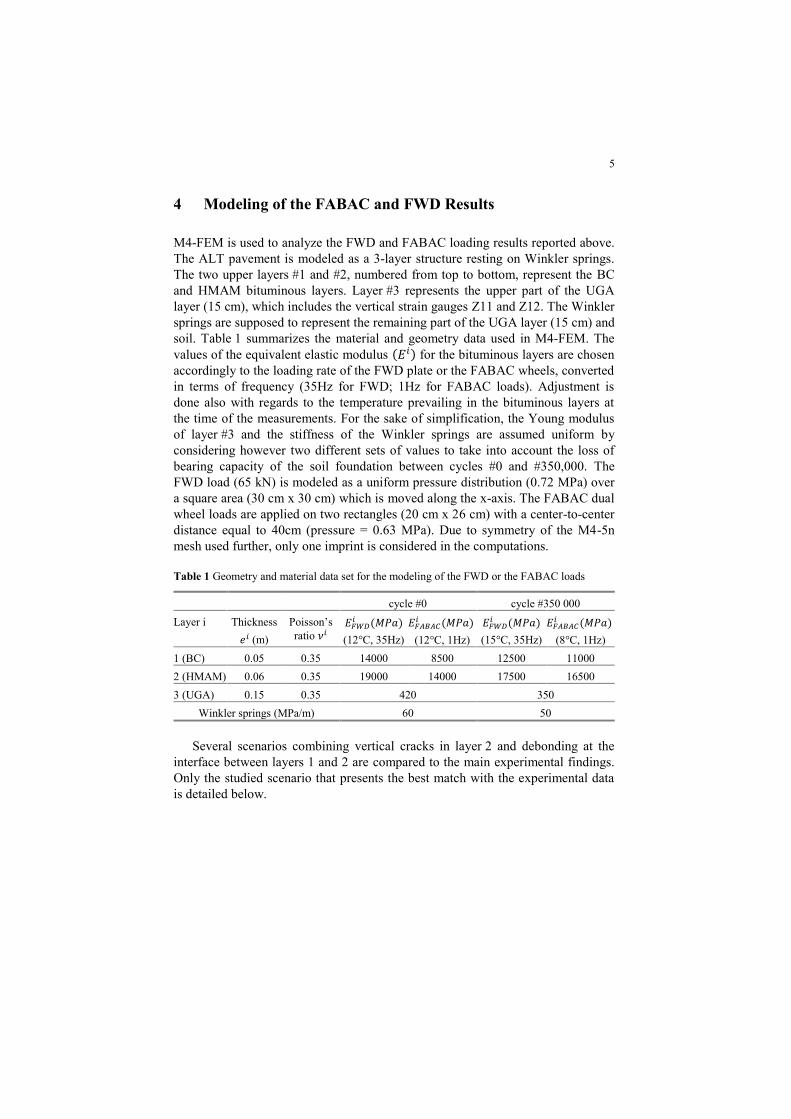
4 Modeling of the FABAC and FWD Results
M4-FEM is used to analyze the FWD and FABAC loading results reported above.
The ALT pavement is modeled as a 3-layer structure resting on Winkler springs.
The two upper layers #1 and #2, numbered from top to bottom, represent the BC
and HMAM bituminous layers. Layer #3 represents the upper part of the UGA
layer (15 cm), which includes the vertical strain gauges Z11 and Z12. The Winkler
springs are supposed to represent the remaining part of the UGA layer (15 cm) and
soil. Table 1 summarizes the material and geometry data used in M4-FEM. The
values of the equivalent elastic modulus for the bituminous layers are chosen
accordingly to the loading rate of the FWD plate or the FABAC wheels, converted
in terms of frequency (35Hz for FWD; 1Hz for FABAC loads). Adjustment is
done also with regards to the temperature prevailing in the bituminous layers at
the time of the measurements. For the sake of simplification, the Young modulus
of layer #3 and the stiffness of the Winkler springs are assumed uniform by
considering however two different sets of values to take into account the loss of
bearing capacity of the soil foundation between cycles #0 and #350,000. The
FWD load (65 kN) is modeled as a uniform pressure distribution (0.72 MPa) over
a square area (30 cm x 30 cm) which is moved along the x-axis. The FABAC dual
wheel loads are applied on two rectangles (20 cm x 26 cm) with a center-to-center
distance equal to 40cm (pressure = 0.63 MPa). Due to symmetry of the M4-5n
mesh used further, only one imprint is considered in the computations.
Table 1 Geometry and material data set for the modeling of the FWD or the FABAC loads
cycle #0 cycle #350 000
Layer i Thickness
(m)
Poisson’s
ratio
(12°C, 35Hz)
(12°C, 1Hz)
(15°C, 35Hz)
(8°C, 1Hz)
1 (BC) 0.05 0.35 14000 8500 12500 11000
2 (HMAM) 0.06 0.35 19000 14000 17500 16500
3 (UGA) 0.15 0.35 420 350
Winkler springs (MPa/m) 60 50
Several scenarios combining vertical cracks in layer 2 and debonding at the
interface between layers 1 and 2 are compared to the main experimental findings.
Only the studied scenario that presents the best match with the experimental data
is detailed below.

6
4.1 Description of the Selected Damage Scenario
Figure 3 depicts the scenario of pavement damaging that leads to a good match
between the M4-5n simulations and the experimental results (FWD + FABAC)
after 350,000 cycles. This scenario includes (i) a loss of the bearing capacity of the
UGA layer and soil, (ii) two vertical cracks in layer 2, (iii) and a debonding area at
the interface between the two asphalt layers. One of the cracks (denoted ) is
assumed to have developed vertically in plane right above the metal angles in
layer 2 (Figure 1), as expected from the experimental setup. The other crack ( , not planned initially, crosses gage L11 but is believed to have propagated not fully
parallel to plane . The debonding area ( is assumed to have initiated from the
crack tip to further develop to the right towards gage L14. One can notice that
this scenario is unsymmetrical with regards to the mid-plane of the test
section. also induces a priori a kind of non-symmetric pattern with regards to
the mid-plane.
This scenario was actually deduced from M4-5n simulations performed with
the following simplified assumptions. The loss of bearing capacity of the
pavement foundation is taken into account by decreasing the Young modulus of
the UGA layer and the stiffness of the Winkler springs (Table 1). The two cracks
are modeled as vertical areas in -planes extending over the whole thickness and
width of layer 2. The a priori oblique path of is taken into account in a
simplified way by positioning the -plane related to in when
modeling the FABAC test and in for the FWD loading. Besides, is
represented by a rectangle also extending over the whole width of the pavement
and from to .
Fig. 3 3D sketch of the damage scenario at cycle #350,000 and the related 2D M4-5n mesh
(bottom view)

7
The following sections show the comparison between the experimental results
and the M4-5n simulations that led to the proposal of this scenario among many
others studied.
4.3 Comparison between experimental and M4-5n results for the
FWD test campaigns
M4-FEM is first used to simulate the FWD campaigns performed at cycles #0 and
#350,000. The numerical value of deflection at cycle #0 is found equal to which is close to the mean experimental value (Figure 2a). Figure 4a
shows the numerical and test results plotted as the difference between the values at
cycles #350,000 and #0. A good match is obtained in the circulated area except for
the end points from which the deflection tends to a plateau value around corresponding to the difference in deflection calculated with the two
parameter sets of the UGA layer and the Winkler springs. By using the initial set
of values outside the circulated area in the simulation at 350,000 cycles this
difference would actually vanish, confirming that the decrease of the bearing
capacity is localized under the FABAC loading (water pumping effect). The
simulation results well account for the three peaks observed in the central region
of the ALT pavement section. The two first peaks are due to the presence of
cracks in and whereas debonding is responsible for the third
one. Note that the numerical curve results from the combination of those of
Figure 4b obtained considering as fully bonded or debonded.
(a) (b)
Fig. 4 Difference in FWD deflection between cycle #0 and #350,000. (a) Comparison between
the measurements and the M4-5n simulation, (b) M4-5n results for fully bonded or debonded
behavior of
In Figure 4a the bonded condition is considered when the center of the FWD
loading plate is located between x=-0.2 and x=0.3 m, i.e. in a region

8
encompassing closely that above the geometrical area . This region is also that
for which interpenetration is found at the location in case of debonding. It
seems then logical to switch to the assumption of bonding for these load locations.
4.4 Comparison between experimental and M4-5n results for the
FABAC loads
Figure 5 shows the comparison between the strain gage measurements and the
corresponding computed values in layers 1 and 2 at cycle #0. The abscissa
indicates the location of the FABAC wheels. A fair agreement is obtained
showing contraction at bottom of layer 1 and extension at the bottom of layer 2.
Fig. 5 Comparison between the longitudinal strains measured and computed at cycle #0
Figure 6 shows the same comparison but at cycle #350,000 considering in the
simulation the damage scenario mentioned earlier (Figure 3). In the computations,
debonding is assumed in excepted when the loads are moved right above this
area where in that case full bonding is assumed between the 2 layers. The change
in the contact condition for is taken into account approximately in the
computation of the strain response , at the location of the strain gages, under the
moving loads, using the incremental equations Eq. 1 and Eq. 2:
(1)
(2)

9
in which superscripts denote the bonded and debonded conditions,
respectively. and are the load locations at which the contact condition
is assumed to change from bonding to debonding and vice versa.
Besides, since L11 is crossed by a crack, a pseudo-strain is considered for this
gage. This pseudo-strain is computed as the difference in the horizontal
displacement between both ends of the gage over its length.
Globally, a relatively good agreement is obtained between the change in
longitudinal strains observed experimentally between cycles #0 and #350,000 and
that computed by M4-5n. In particular, the large evolution recorded by L11
between cycles #0 and #350,000 is well described. The change from contraction to
extension for gages L13 and L14 is also well captured numerically by the damage
scenario considered here. Note however that the peak of tensile strain recorded by
L12 which remains almost unchanged in the measurement rather diminishes in the
simulation. In addition, the numerical curve for L12 at cycle #350,000 does not
exhibit a peak of contraction as does the experimental curve prior to the arrival of
the load right above this gage.
Fig. 6 Comparison between the longitudinal strains measured and computed by M4-5n at
cycle #350,000 (the grey curves recall the comparison at cycle #0)
The scenario considered here is probably not fully representative of the reality
even though it allows us to reflect the main features resulting from damaging of

10
the pavement. An appropriate and careful deconstruction of the test section should
help validate and specify the actual cracking/debonding pattern.
5 Conclusion
The M4-5n associated to a Winkler foundation was applied to the numerical
analysis of a FABAC ALT test performed on a pavement composed of two
bituminous layers at the bottom of which a flaw was placed on purpose to initiate
and localize crack growth. The mechanical response of the pavement was
computed for many different damage scenarios taking advantage of the versatility
of M4-FEM to model the geometry of cracking/debonding patterns. One of these
scenarios which led to a satisfactory match with the set of test measurements was
presented in this paper. The future development and implementation of fatigue
criteria will help the selection of scenarios and should also lead to a better
understanding of the fracture mechanisms at play.
References
Aunis J, Balay J-M (1998). An applied research programme on continuous reinforced concrete
pavements: the FABAC project. 8th Int. Symp. on Concrete Roads, Lisbon, 13-16 Sept. 1998.
Buttlar WG, Chabot A, Dave EV, Petit C, Tebaldi G (2018). Mechanisms of Cracking and
Debonding in Asphalt and Composite Pavements – RILEM State-of-the-Art Report Series,
Vol. 28, Springer International Publishing. doi: 10.1007/978-3-319-76849-6
Chabot A (1997). Analyse des efforts à l’interface entre les couches des matériaux composites à
l’aide de Modélisations Multiparticulaires des Matériaux Multicouches (M4). PhD thesis,
ENPC, Paris. Available on https://tel.archives-ouvertes.fr/tel-00197853/
Chabot A, Tran QD, Ehrlacher A (2007). A modeling to understand where a vertical crack can
propagate in pavements. Proc. of the Int. Conf. on Advanced Characterization of Pavement
and Soil Engineering Materials (CRC Press) 1: 431-440, Athens, 20-22 June 2007.
Chabot A, Pouteau B, Balay J-M, De Larrard F (2008). FABAC Accelerated Loading Test of
Bond between Cement Overlay and Asphalt layers. Proceedings (CRC Press) of the 6th Int.
RILEM Conf. Cracking in Pavements, 16-18 June, Chicago, 671-681.
Hecht F (2012). New development in FreeFem++. Journal of Numerical Mathematics 20 (3-4),
251–265. 65Y15. doi 10.1515/jnum-2012-0013
Nasser H, Chabot A (2018). A Half-analytical Elastic Solution for 2D Analysis of Cracked
Pavements. Advances in Engineering Software 17: 107-122. doi:
10.1016/j.advengsoft.2017.06.008
Nasser H, Chupin O, Piau JM, Chabot A (2018). Mixed FEM for solving a plate type model
intended for analysis of pavements with discontinuities. Road Materials and Pavement
Design 19 (3): 496-510. doi: 10.1080/14680629.2018.1418653
Nguyen ML, Chupin O, Blanc J, Piau JM, Hornych P, Lefeuvre Y (2019). Investigation of crack
propagation in asphalt pavement based on APT results and LEFM analysis. ASTM Journal of
Testing and Evaluation 48. doi: 10.1520/JTE20180933


