
UNIVERSITY OF SOUTHERN QUEENSLAND
FACULTY OF HEALTH, ENGINEERING AND SCIENCES
SCHOOL OF AGRICULTURAL, COMPUTATIONAL AND ENVIRONMENTAL SCIENCES
Riparian woodland condition in relation to lippia (Phyla canescens (Kunth) Greene) and fire management,
southern Queensland
A thesis submitted by
Lucy M.E. Galea
In partial fulfilment of the requirements for the degree of Bachelor of Science (Honours)
Submitted: October 2014
i
ABSTRACT
The implementation of inappropriate management regimes encourages alien species invasion
into native ecosystems. Disturbances, such as fire, flooding and grazing, create a unique window
of opportunity for invasive species to colonise areas not previously invaded. Fire regimes can be
changed through the introduction of foreign species and may induce detrimental ecosystem
effects including increased tree mortality, an increase in bare ground and further invasion by
foreign species.
Phyla canescens (lippia) is an invasive introduced species covering over 5.3 million hectares of
the Murray-Darling Basin. Many potential control methods have been attempted. However, the
response of lippia to fire as a potential management tool has not previously been studied.
The general question of this research was: what is the effect of a prescribed fire on lippia, the
vegetation structural components and the soil seed bank of a vegetation remnant in a highly
modified agricultural landscape? This research examined the following specific hypotheses: that
there is no difference in the abundance of lippia between burnt and unburnt treatments, six
months after a prescribed burn; that there is no difference in the abundance of other vegetative
structural components between burnt and unburnt woodlands, six months after a prescribed burn;
that the fire has resulted in no change in the seedling emergence of lippia seeds stores in the soil
seed bank; and, that the fire has resulted in no change of pseudo-species (not taxonomically
identified species) richness within the seed bank.
Ten sites, (5 burnt, 5 unburnt) were sampled within each of the two woodlands: Eucalyptus
camaldulensis and Eucalyptus populnea, six months after a prescribed burn. At each site, a
500 m2 quadrat was established to determine general disturbance measures (using a 0–4 scoring
method) and the abundance and percentage cover of vegetative structural components. Within
each 500 m2 quadrat, the density of the following vegetative structural components were

ii
measured: trees > 20 m; trees 10–20 m; trees < 10 m; standing stags > 20 m; standing stags 10–
20 m; standing stags < 10 m; stumps; logs 6–13 cm; logs 13–35 cm; logs 35–90 cm; and logs
90–150 cm. The percent cover of each of the following vegetative structural components was
also measured: trees; stags; stumps; logs; grasses/sedges; herbs/forbs; lippia; lippia litter; fine
litter; bare ground. Within each 500 m2 quadrat, eight 70 cm2 sub-quadrats were placed along a
16 m transect to determine the cover abundance of lippia, grasses and forbs at a finer scale. Soil
samples were also collected at each site for the glasshouse seed germination trial. Samples were
kept in the glasshouse for 14 weeks to determine total germination and pseudo-species richness
of each site and treatment. Independent T-tests determined whether there were any significant
differences of variables between treatments. The Levene’s Test for Homogeneity was used to
determine homogeneity.
There were no significant differences in the abundance and cover of lippia or vegetation
structural components between burnt and unburnt woodlands, six months after a prescribed burn
at either the broad (500 m2) or finer scale (70 cm2) (T-test, p > 0.05). The only exception to this
finding was a significant difference in forb cover between burnt and unburnt Eucalyptus
populnea woodlands (T-test, p < 0.05). There were no significant differences in seedling
emergence or pseudo-species richness between burnt and unburnt treatments within each
woodland (T-test, p > 0.05).
This research shows that fire may not be a suitable control method for lippia invasion. The
results found for structural components and the seedling germination trial were consistent with
previous literature. Lippia’s response to fire in this study and the lack of positive effect that fire
had on the invasive weed at St Ruth Reserve, has begun to fill an identified knowledge gap in the
control methods for lippia. This study shows that fire may not be a useful management tool for
lippia.

iii
DECLARATION
I certify that the work reported in this thesis is entirely my own effort, except where otherwise
acknowledged. I also certify that the work is original and has not been previously submitted for
assessment in any other course of study at this or any other institution.
…………………………..
Signature of Candidate
…………………………
Date
Endorsement
Supervisor: Dr Andy Le Brocque Co-Supervisor: Dr Kate Reardon-Smith
Name Name
Senior Lecturer in Ecology & Sustainability
Research Fellow, International Centre for Applied Climate Sciences
Position Position
Signature Signature
Date Date

iv
TABLE OF CONTENTS
ABSTRACT ................................................................................................................................. i
DECLARATION ........................................................................................................................ iii
TABLE OF CONTENTS ............................................................................................................ iv
ACKNOWLEDGEMENTS ....................................................................................................... viii
Chapter 1: INTRODUCTION ...................................................................................................... 8
1.0 General Introduction .................................................................................................................. 2
1.1 Alien Species Invasion .............................................................................................................. 4
1.2 Fire, Management & Invasives ................................................................................................. 8
1.2.1 Fire as a Native Vegetation Management Tool .................................................................. 10
1.3 Characteristics of Lippia .......................................................................................................... 13
1.4 Research Hypothesis and Questions .................................................................................... 21
Chapter 2: METHODOLOGY ................................................................................................... 23
2.1 Study Area ................................................................................................................................. 23
2.2 Experimental Design ................................................................................................................ 27
2.3 Field Experiment: Patterns in Vegetation Across Burnt/Unburnt Woodlands ................. 29
2.4 Glasshouse Experiment: Soil Seed Bank Germination Across Burnt/Unburnt Woodlands ............................................................................................................................................ 32
2.5 Statistical Analyses .................................................................................................................. 33
2.5.1 Field Experiment: Patterns in Vegetation Across Burnt/Unburnt Woodlands ................... 33
2.4.2 Glasshouse Experiment: Soil Seed Bank Germination Across Burnt/Unburnt Woodlands 34
Chapter 3: RESULTS .............................................................................................................. 35
3.1 General Results ........................................................................................................................ 35
3.2 Patterns in Vegetation Across Burnt/Unburnt Woodlands ................................................. 36
3.2.1 Cover and density of structural components (at 500 m2 scale) .......................................... 36
3.2.2 Fine Scale Patterns of Frequency and Cover (70 cm2 sub-quadrats) .................................. 43
3.3 Soil Seed Bank Germination Across Burnt/Unburnt Woodlands ...................................... 49
3.3.1 Germinant Emergence ........................................................................................................ 49
3.3.2 Pseudo-Species Richness .................................................................................................... 56
Chapter 4: DISCUSSION ......................................................................................................... 58
4.1 Similarity of Burnt/Unburnt Plots Prior to Fire ...................................................................... 58
4.2 Vegetation Response .............................................................................................................. 58
4.3 Seed Germination Response ................................................................................................. 61

v
4.4 General Discussion .................................................................................................................. 62
4.4.1 Limitations and Future Directions ....................................................................................... 65
4.4.2 Management Implications .................................................................................................. 68
4.5 Conclusion ................................................................................................................................. 69
Chapter 5: REFERENCES ....................................................................................................... 71

vi
LIST OF FIGURES
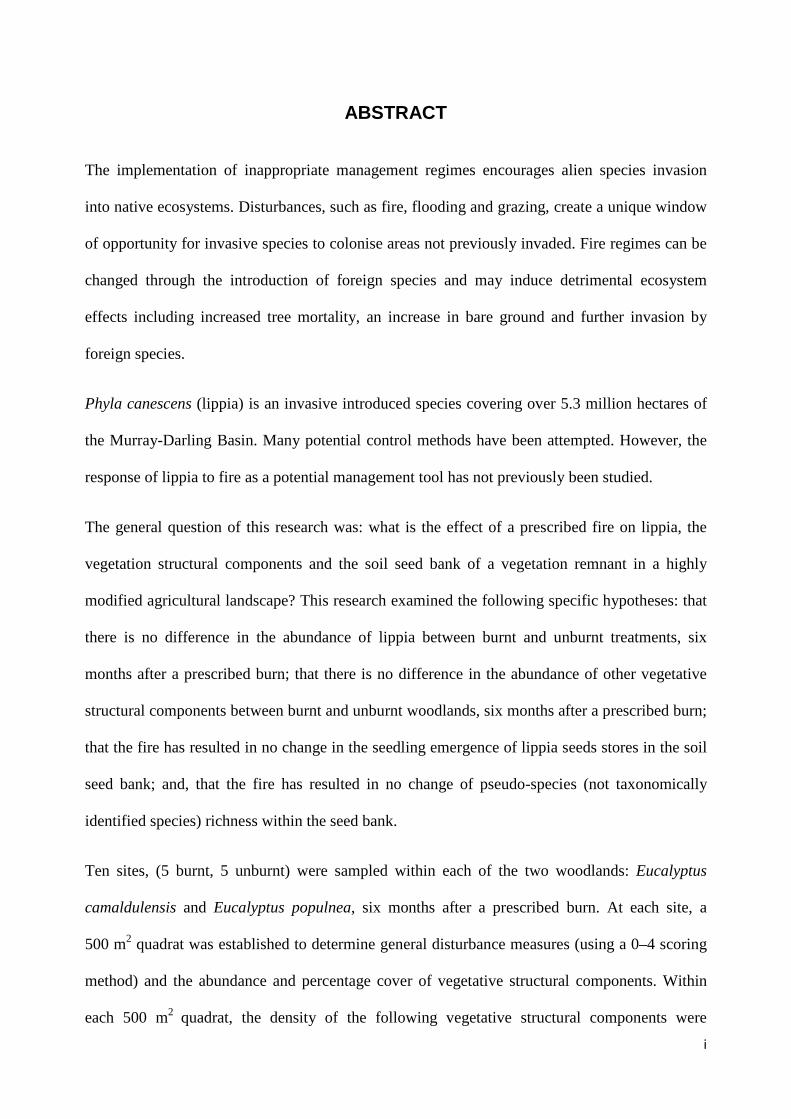
Figure 1: Lippia distribution under (a) current climate, (b) 2070 future
climate using a wetter climate scenario, and (c) 2070 future
climate using a drier climate scenario………………………………………............................
13
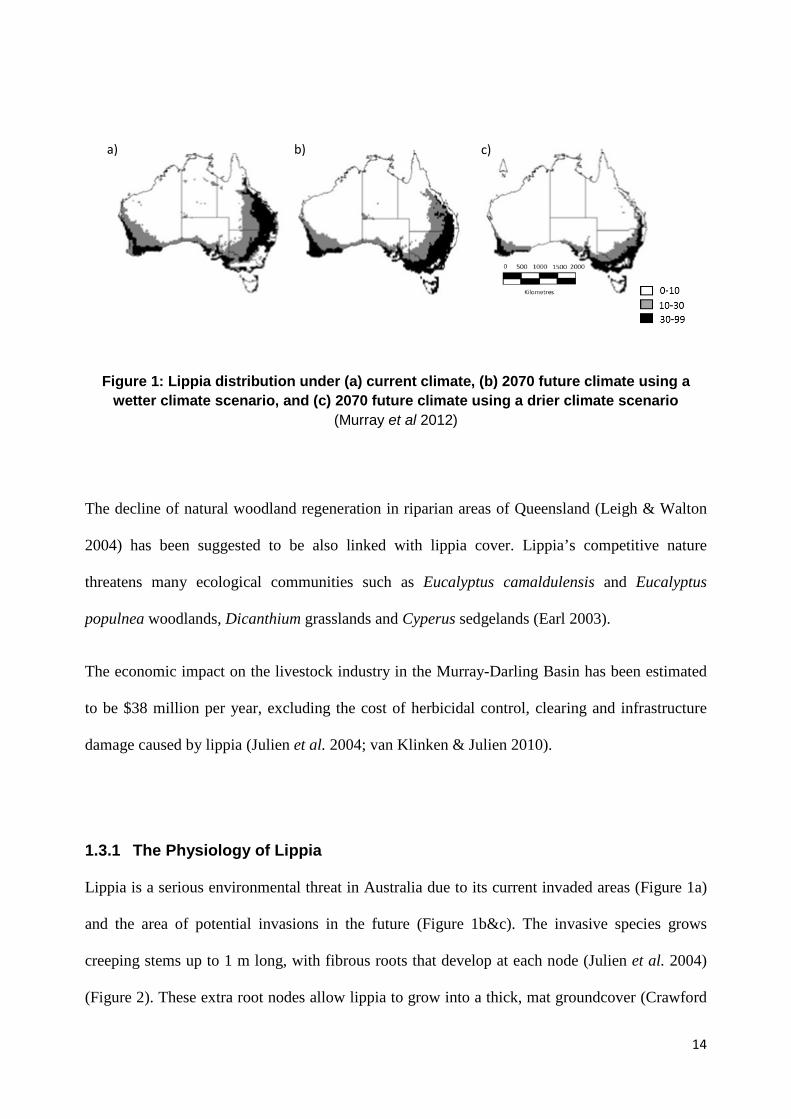
Figure 2: 14 week old lippia seedling………………………………………………................................. 14
Figure 3: Map showing the location of the St Ruth Reserve…………………………………………… 22
Figure 4: Aerial photograph of St Ruth Reserve showing burnt/
unburnt areas in November 2013 and the position of survey
sites…………………………………………………………………………………………………………………….
24
Figure 5: Diagram of experimental design used, showing nesting
burnt/unburnt plots within each woodland…………………………………........................
27
Figure 6: Eucalyptus camaldulensis average count of: a) trees;
b) stags; c) stumps; d) logs………..............................................................................
37
Figure 7: Eucalyptus populnea average count a) trees;
b) stag; c) stump; d) logs…………………………..............................................................
38
Figure 8: Eucalyptus camaldulensis average cover 70 cm2……………………………………………… 44
Figure 9: Eucalyptus populnea average 70 cm2 cover…………………………………………………….. 45
Figure 10: Eucalyptus camaldulensis average germinants of:
a) monocots; b) lippia; c) dicots; e) total minus lippia…………………………………………
50
Figure 11: Eucalyptus camaldulensis average germinants of:
a) monocots; b) lippia; c) dicots; e) total minus lippia…………………………………………
51
Figure 12: Average cumulative number of germinants in
a) E. camaldulensis b) E. populnea woodland soil
samples………………………………………………………………………………………………………………
52
Figure 13: Average cumulative number of lippia germinants in
a) E. camaldulensis b) E. populnea woodland soil samples………………………………….
54
Figure 14: Average Pseudo-Species Richness of each woodland…………………………………… 56

vii
LIST OF TABLES
Table 1: Pianka’s correlates of r- and K- selection………………….……………................ 4
Table 2: Summary of lippia traits……………………………………..……………….............. 16
Table 3: Summary of variables measured at each site………….…………………............. 29
Table 4: Site disturbance score ranges and means in burnt and
unburnt E. camaldulensis and E. populnea woodland………………………………
34
Table 5: Means and standard errors of density data in burnt and
unburnt E. camaldulensis and E. populnea woodland
on a 500 m2 scale………………………………………………………………………..
36
Table 6: Percentage cover average of field variables at
500m2 scale ……………………………………………………………………………..
40
Table 7: Summary data for field variables at a 500 m2 scale ……………….……………... 41
Table 8: Average percent cover at a 70 cm2 scale……………………………………..……. 43
Table 9: Summary Data for field variables at a 70 cm2 scale………………………………. 47
Table 10: Mean and standard error of average germination.……………………………….. 49
Table 11: Summary data for glasshouse germinants in seedbank trial……………………. 53
LIST OF APPENDICES
Appendix A: GPS data points
Appendix B: Toothpick colours for week of emergence
Appendix C: Pseudo-species list
Appendix D: Raw data for disturbance scores
Appendix E: Raw data from 500 m2 scale density and cover data
Appendix F: Statistics for 500 m2 density data
Appendix G: Statistics for 500 m2 cover data
Appendix H: Raw data from 70 cm2 scale
Appendix I: Statistics for 70 cm2 data
Appendix J: Raw data for germination trial
Appendix K: Statistics for germination data
Appendix L: Statistics for pseudo-species data
Appendix M: Average cover of lippia (70 cm2)

viii
ACKNOWLEDGEMENTS
I wish to sincerely thank all the people who have helped me throughout the year and made this
project possible. Firstly, I would like to thank my supervisors, Dr Andy Le Brocque and Dr Kate
Reardon-Smith for their encouragement, guidance and wisdom throughout the year. This thesis
would not have been imaginable without their support and endurance.
I would like to thank everyone who assisted me with my field work, including Jemima Wixted,
Crystal Faulknau, Joanne Diill and Ashton Fagg. A special thanks to Jemima for ensuring that
my glasshouse experiment didn’t die while I was away.
I wish to thank the Western Downs Regional Council, in particular Chris Gaschk, for their
assistance on this project.
On a personal note, I would like to thank my fellow Honours students, Stephanie Piper and
Jemima Wixted, for the many cups of tea, lunch dates and words of wisdom over the year. We
made it! A big thank you to my Dad, Mum and sister Alice for their love and support throughout
my time at USQ and especially throughout this project. Finally, a special thank you to Ashton
Fagg whose endless love, encouragement, patience and proofreading insight has helped me
through many a long day and night.
Chapter 1: INTRODUCTION

2
1.0 General Introduction
Inappropriate management regimes may adversely impact the native vegetation through
composition and structural changes (Lindenmayer & Burgman 2005). The implementation of
inappropriate management regimes can increase the potential for an ecosystem invasion,
especially if the system is highly stressed or sensitive, such as some riparian woodlands (Fisher
et al. 2009).
Invasion occurs when a species establishes in an ecosystem that is not in its native home range.
These species have the potential to have a significant impact on both natural and managed
ecosystems because of the lack of native predators (Hobbs & Mooney 2005). Often, new
colonising species are disturbance specialists and are able to thrive under disturbed conditions.
The r- and K- selection theory and the life histories associated with each selection trait, helps to
explain why invaders are successful colonists (MacArthur & Wilson 1967; Pianka 1970),
particularly in disturbed ecosystems. Disturbances can create a unique window for invasive
species to colonise if the conditions are favourable (Hobbs 1991). Environmental disturbances
such as fragmentation (Laurance et al. 2000), grazing (Earl 2003), flooding (Elderd 2003) and
fire (Masocha et al. 2011) often enhance invasion by alien species. This thesis will
predominantly focus on fire as a management tool in modified remnant vegetation.
Many Australian plants and ecosystems have evolved to withstand the effects of fire (Pausas &
Schwilk 2012). The reproduction of many Australian species, especially eucalypts, requires a
particular fire regime to initiate the reproduction process (Penman et al. 2009). A fire regime is
determined by five main components of fire: intensity, frequency, season, type and extent (Gill
1975; Whelan 1995). If this fire regime is changed through the suppression or introduction of
fire, an ecosystem can experience species diversity decline (Bond & Keeley 2005). The change
of a fire regime can also have other detrimental ecosystem effects such as increased tree

3
mortality (Pettit & Naiman 2007), increase in bare ground (Kutt & Woinarski 2007) and
increased invasion by foreign species (Masocha et al. 2011).
When a fire occurs an ideal window of opportunity is created for invasive grasses, forbs, shrubs
and woody species to colonise areas previously not invaded. This opportunity is created by the
enhancement of light and nutrient availability in the recently burnt ecosystem (Hester & Hobbs
1992). This initiation for invasion can create vast ecosystem changes from just one fire. Invasive
species can either increase or decrease the frequency and intensity of a fire due to their
ecological properties such as moisture content of plants, chemical compositions and fuel load
(Brooks et al. 2004). One invasive that is reported to decrease the risk of fire is lippia (Phyla
canescens (Kunth) Greene) (State Government of Victoria 2011).
Lippia is an invasive species that originated from Argentina and was introduced to Australia in
the 1920s as a ‘no-mow grass’ (Leigh & Walton 2004). It has now invaded over 5.3 million
hectares of the Murray-Darling Basin as well as much of eastern Australia (Earl 2003). The
prostrate species has an extensive root system, which forms a mat that does not allow the
emergence of most species (Earl 2003; Crawford 2008). The decline of natural riparian
woodland regeneration has been linked to lippia cover, which is now threatening many
ecological communities including Eucalyptus camaldulensis (Denh.) and Eucalyptus populnea
(F. Muell.) woodlands (Earl 2003).
Control methods for lippia have been varied and research has included the use of grazing,
mechanical disturbance and flooding. The search for a biological control identified four insects,
two fungi and a mite as potential controls for lippia (van Klinken & Julien 2010). It has been
proposed that Kuschelina bergi, a beetle, be introduced to Australia under quarantine conditions
for research purposes.

4
Although there is no evidence of the use of fire to control lippia, the Western Downs Regional
Council, in southern Queensland, applied a cool, low intensity controlled fire in an attempt to
reduce the impact of lippia within a remnant patch of riparian woodland. This research addresses
the general question: What is the effect of a prescribed fire on lippia, vegetation structural
components and the soil seed bank of a vegetation remnant in a highly modified agricultural
landscape?
This thesis will explore current literature on alien species, theories that help to explain why alien
species successfully invade and thrive in disturbed environments, fire and its effects on the
ecosystem, Phyla canescens’ physiology and control methods previously researched. It will then
provide a detailed description of two studies into the response of vegetative structural
components and the soil seed bank to fire, six months post fire.
1.1 Alien Species Invasion
Biological invasions have caused more extinctions to date than human-induced climate change,
second only to land use change (D'Antonio & Vitousek 1992). The increased movement of
plants and animals across the globe has led to species being exposed to much higher exchanges
of biological material in a relatively short space of time (Mooney 2005). This movement of
organisms has led to the invasion of native areas by alien species. A significant issue is that
although an invasive species may appear innocent in their natural environment, it can cause
ecological chaos when introduced to a new area, due to the absence of native predators and
competitors (Mooney 2005).
Invasive plant species in Australia cost the agricultural industry $3.4 billion annually in impact
and control costs, with farmers spending $1.6 billion during the 2006–2007 year on the control

5
and prevention of foreign species (Pink 2013). This is more than the combined annual cost of
controlling animal pests and alleviating land and soil problems ($1,717 million) (Pink 2013).
A number of theories and frameworks have been proposed or applied to alien species to explain
why these species colonise new environments in such an aggressive way. One theory that has
been applied to invasive species is the r- and K- selection theory (MacArthur & Wilson 1967;
Pianka 1970). The r- and K- selection theory has revealed that successful colonists across taxa
have r-selected life histories with an ability to switch between r- and K- selection strategies
(Sakai et al. 2001). No single organism is clearly r- or K-selected (Pianka 1970). See Table 1 for
a summary of r- and K- selection traits.
Table 1: Pianka’s correlates of r- and K- selection (Pianka, 1970)
r-Selection K-Selection
Climate Variable and/or unpredictable Fairly constant and/or predictable
Mortality Often catastrophic, density independent
Density-dependent
Population size Variable in time, non-equilibrium, well below carrying capacity
Fairly constant in time, equilibrium, at or near carrying capacity
Intra- and interspecific competition
Variable, often lax Usually keen
Relative abundance Does not fit broken stick model Frequently fits broken stick model
Length of life • Rapid development
• High rmax • Early reproduction • Small body size • Single reproduction
• Slower development, greater competitive ability
• Lower resource thresholds • Delayed reproduction • Larger body size • Repeated reproduction
Leads to… Productivity Efficiency

6
1.1.1 Disturbance and Invasive species
Alien species invasion is generally enhanced by environmental and anthropogenic disturbances
(Hobbs 1991). However, there is a careful balance between too many and too few disturbances
(Connell 1978). The intermediate disturbance hypothesis examines this phenomena (Connell
1978). If disturbances occur too frequently or infrequently, species diversity decreases (Connell
1978). If a disturbance, such as a fire, happens too frequently, reproduction may take longer than
the interval between disturbances, with the ecosystem losing species due to a lack of
reproductively mature individuals (Hobbs & Huenneke 1992). If the interval between
disturbance events is too long, community diversity will be reduced by the lack of disturbances
to create new recruitment (Hobbs & Huenneke 1992; Penman et al. 2009).
Therefore, it would be expected that there is a stable point at which diversity would be at a
maximum. However, Connell (1978) hypothesised that a community will never achieve
equilibrium because disturbances, however large or small, are so common that the ecosystem
rarely reaches an ordered state. Species diversity is highest when disturbances are at an
intermediate level in terms of frequency and intensity (Connell 1978).
Disturbances can provide undesirable impacts, such as creating a unique window for invasive
species to colonise if the environment present is amenable (Hobbs 1991). Quite often new
colonising species are disturbance specialists who are able to thrive under disturbed conditions,
even when native species are well adapted to natural disturbance regimes (Hobbs & Mooney
2005).
The disturbance of an ecosystem can occur in a number of different ways including land
transformation. Land transformation frequently brings about an opportunity for biological
invasion, as ecological remnants are often surrounded by potential invaders (Brothers &
Spingarn 1992). The fragmentation of natural ecosystems is often subject to alien species

7
invasion, as the changed microclimate of fragmented edges often promotes a decrease of native
species and an increase in alien species (Laurance et al. 2000).
Brothers and Spingarn (1992) suggest that forest fragmentation could encourage invasions in two
ways: firstly, fragmentation increases the ratio of forest to non-forest and of forest edge to
interior; and secondly, the microclimate changes at fragment edges, which provides entry points
for invasion due to the more open nature of these disturbed habitats. This hypothesis is currently
under extended testing at the Biological Diversity Forest Fragments Program in the Amazonian
rainforest (Laurance et al. 2011). The project has found that both of the potential invasion points
that Brothers and Spingarn (1992) suggested are true (Laurance et al. 2011). Land
transformation can also make way for changes in the usage of land, particularly the introduction
of agricultural practices such as grazing, which may encourage invasion.
Grazing has constituted part of the global landscape over an evolutionary time frame. However,
grazing can still be a disturbance within an ecosystem (Hobbs 2001). Hobbs and Huenneke
(1992) hypothesised that in any situation, a significant change in grazing, either introduced or
withdrawn, will create a disturbance within that particular landscape. Grazing constitutes a
disturbance as it increases the spaces between grass tufts and light penetration to the soil level
(Earl 2003). Grazing can also help invasions when other disturbances may be present within the
ecosystem.
Disturbance by flooding generally occurs in riparian areas. Plants in these ecosystems are able
to survive the repeat impacts of inundation (Elderd & Doak 2006). The flooding of riparian areas
alters site conditions where new species can colonise due to the alteration of micro-ecosystem
conditions (Bendix 1997). This alteration can affect species composition due to woody species
being washed away, allowing additional light penetration to the soil where forbs, both invasive
and native, have an enhanced opportunity to establish (Elderd 2003). However, fragmentation,
flooding and grazing are not the only disturbances to encourage foreign species invasion.

8
Fire is a well-known ecosystem disturbance. It acts as a short-term fertilising agent where
nutrient and light availability is increased post fire (Hobbs & Huenneke 1992). This creates ideal
conditions for invasive species to colonise (Hobbs & Huenneke 1992). The effects of fire will be
further explored in Section 1.2.
1.2 Fire, Management & Invasives
Natural and anthropogenic burning is an ecological disturbance that has led to the diversification
of many landscapes. Human–induced burning of the landscape has been utilised throughout
human evolution as a way to control the natural environment (D'Antonio 2000; Bond & Keeley
2005).
Plants directly reflect the landscapes that fire has changed throughout evolutionary history. It has
been argued that plants have not adapted to fire per se, but have been selected through fire
regimes to have traits that align with being able to withstand the conditions a fire creates, both
during and after a burn (Keeley et al. 2011; Keeley & Brennan 2012; Pausas & Schwilk 2012).
Therefore, fire is seen as an evolutionary pressure shaping plant traits under particular fire
regimes (Keeley et al. 2011). Examples of plant traits that have ensured the survival of many
species appearing in areas with active fire regimes include:
• epicormic and basal sprouting (e.g. Eucalyptus);
• thick bark for protection from heat and fire (e.g. Sequoia and Eucalyptus);
• a dense seed bank that is only activated when smoke or heat triggers germination (e.g.
Acacia); and

9
• holding seed in the canopy of a tree until a fire stimulates the release of seed, also known
as serotiny (e.g. Banksia) (Atwell et al. 1999; Dawson & Lucas 2005; Keeley et al.
2011).
The introduction or suppression of fire within an ecosystem can lead to species diversity loss
(Bond & Keeley 2005). In tropical rainforests where fire is rare, it has been documented that a
single fire can alter the composition and structure of the forest, where both common and rare
species die (Cochrane 2003). The possibility for rainforest regeneration by seed germination is
lost due to much of the seed being stored in the litter layer, which is destroyed in the fire
(Cochrane 2003). Alternatively, when fire is suppressed in tall grass prairies it can lead to loss of
species diversity (Leach & Givnish 1996). Leach and Givnish (1996) found that after fire
suppression over a 32 to 52 year period, between 8 and 60 percent of the original plant species
had vanished from 54 prairie remnants.
If an ecosystem is not adapted to fire then the introduction of fire can also have detrimental
ecological effects including an increase in the mortality of trees, bare ground cover and forbs. A
study by Pettit and Naiman (2007) showed that 33% of riparian trees in a 1.5 km transect had
been killed by fire, with 48% killed if there were accumulations of wood within 5 m of the base
of the tree. Kutt and Woinarski (2007) reported that bare ground was far more extensive in burnt
grazed quadrats of their experiment in north-central Queensland. It was also found that there was
a significant difference in forb cover post fire, with the most extensive cover found in burnt and
grazing quadrats. This increase of forbs post fire is well documented with many studies
presenting similar data (Laughlin et al. 2004; Pettit & Naiman 2007; Masocha et al. 2011).
Fire not only has an effect on the above ground vegetation but also on the below ground soil seed
bank. It has been found that many seeds experience mortality during fire in the first centimetre of
soil, with most emergence occurring from soil 1 to 3 cm into the soil profile (Auld & Denham
2006). It appears that the effect of fire on seeds is dependent on the species. Auld and Denham

10
(2006) found that there was a significant difference in germination post fire in three woody
Australian species (Acacia suaveolens, Grevillea speciosa and Grevillea buxiflora), with fire
having a positive effect on germination and therefore a decline of the seed bank. In contrast,
Davies et al. (2013) found that there was no significant difference in germination between
untreated and heat plus smoke treated soil samples from fragmented Mallee habitat. The
reproduction requirements and maturation times of species should be taken into account when
prescribed burning is being implemented as a management tool, to ensure the highest amount of
biodiversity is retained within the ecosystem.
1.2.1 Fire as a Native Vegetation Management Tool
Vegetation remnants are often located within urban and agricultural landscapes, which can
prevent or stop natural fire regimes. Some ecosystems require fire to maintain growth and
regeneration (Penman et al. 2009). Many Australian ecosystems rely on fires at a particular
frequency, intensity and season to ensure their long term health, continued recruitment and
survival (COAG Standing Council on Environment and Water 2012).
Prescribed burning can often assist in restoring a more natural fire regime to an area (Brockway
et al. 2002). Fires may also promote preferred species such as pasture grasses for grazing
(Border Rivers-Gwydir Catchment Management Authority 2008). This disturbance can be a
valuable native vegetation management tool where an appropriate fire regime is implemented to
maintain the biodiversity of these areas.
An example of fire being used as a native vegetation management tool to maintain the
biodiversity of an area, is the implemented management regime for the endangered grassy balds
in the Bunya Mountains, Queensland. This geographically isolated area exhibits 134 medium to
high altitude grasslands (grassy balds) (Fensham & Fairfax 1996; Queensland Government:

11
Department of National Parks Recreation Sport and Racing 2012). Historic indigenous burning
patterns in the area have created and helped to maintain the balds for a long period of time
(Queensland Government: Department of National Parks Recreation Sport and Racing 2012).
Approximately one-quarter of the Bunya Mountains balds have been degraded over the past fifty
years due to encroachment from surrounding woodland or rainforest (Queensland Government:
Department of National Parks Recreation Sport and Racing 2012). Fire regimes have been
implemented within the area to maintain the existing balds and to help control advances by
woody native species (Queensland Government: Department of National Parks Recreation Sport
and Racing 2012; Queensland Government: Department of Environment and Heritage Protection
2014). The current implemented fire regime includes a low to high intensity fire at any time of
the year after rain, with biennial to triennial burns in areas where woody invasion has occurred
(Queensland Government: Department of Environment and Heritage Protection 2014). A lack of
fire encourages the growth of shrubs/vines as well as encouraging a change in ecosystem type to
a Eucalyptus woodland, notophyll or microphyll vine forest (Queensland Government:
Department of Environment and Heritage Protection 2014). However, sometimes the
introduction or re-introduction of fire to an ecosystem, can have detrimental effects for the
invasion of new species.
1.2.2 Fire and Alien Species Invasion
Fire provides an ideal window of opportunity for invasive grasses, forbs, shrubs and woody
species to colonise areas not previously invaded (Hobbs & Huenneke 1992). This opportunity is
created by the short term enhancement of both light and nutrient availability (Hester & Hobbs
1992). In studies reviewed by D'Antonio (2000), fire reduced or eliminated an introduced species
in some 20% of cases.

12
Much research has documented the vast changes that occur when an alien species invades the
landscape after a fire regime has been altered (Brooks et al. 2004; Pierson et al. 2011; Keeley &
Brennan 2012). A well-documented study of post fire landscape change, is that of the Hawaiian
submontane area. This area was invaded post fire by three alien grass species, Melinis
minutiflora, Andropogon virginicus and Schizachyrium condensatum (Hughes et al. 1991;
D'Antonio et al. 2010). These invasive grasses maintain an extremely high dead to live biomass
ratio throughout most of the year, resulting in high amounts of moisture (80-90%) and fine litter
particles which causes increased fire frequency (Hughes et al. 1991). These introduced species
also exhibit rapid post fire recovery rates (Hughes et al. 1991). Hughes et al. (1991) found that
post-fire, the total cover of exotic grasses increased while the cover and diversity of native
vegetation sharply declined as the native species germinants were not able to grow past the dense
stand of exotic grasses established soon after the fire (Hughes et al. 1991). D'Antonio et al.
(2010) conducted a study 17 years after the Hughes et al. (1991) study to observe native
ecosystem recovery. Sites that were burnt 17 and 37 years earlier, had little native species
recovery, with no evidence of recruitment of the two dominant native tree species that are found
at unburned sites (D'Antonio et al. 2010).
Alien species invasions can change an ecosystem to the extent that it can alter the natural fire
regime of the area (D'Antonio & Vitousek 1992). The modification of the fire regime will
depend on properties possessed by the plants, both native and introduced. The most important
factors that will change a fire regime are the properties of the fuel, both intrinsic and extrinsic
(Brooks et al. 2004). Researchers have identified five factors that can change the fuel of a fire
and consequently the fire regime of the area: 1. moisture content of plant tissues; 2. chemical
composition of the plant tissues; 3. fuel loads; 4. fuel continuity; and 5. fuel packing ratio
(Brooks et al. 2004). These five properties could eventually change the natural fire regime of an
area through either the suppression or enhancement of fire.

13
The promotion of fire has also been documented in invasive woody species such as Hakea
sericea and Acacia saligna due to higher fuel loads and decreased moisture content (Mack &
D'Antonio 1998). However, not all invasive species promote fire. The suppression of fire by
alien species is not well documented, with research involving invasive woody species such as
Mimosa pigra (Mack & D'Antonio 1998). The invasive forb Phyla canescens (lippia) has been
listed in the ‘Victorian Weed Risk Assessment’ as an invasive weed that is able to decrease the
intensity of fire and potentially reduce fire frequency (State Government of Victoria 2011).
Limited literature has been published on the use of fire to manage weeds that are not of a woody
nature. Based on this finding, the current literature does not explore the use of fire on invasive
forbs, in particular lippia. This lack of understanding motivates the contributions that this project
will make to the current literature.
1.3 Characteristics of Lippia
Lippia is an invasive prostrate forb originally from Argentina that has been introduced and
recorded in over thirty-three countries including Australia (Leigh & Walton 2004). The species
was introduced to Australia through multiple introductions (Xu et al. 2010) in the early
nineteenth century as an ornamental plant (Sosa et al. 2008). Lippia’s current distribution covers
all states and territories in Australia, excluding the Northern Territory (Earl 2003). This current
distribution covers an estimated 5.3 million hectares of the Murray-Darling basin alone, with
expansion likely under climate change (Figure 1). Lippia is most abundant in frequently flooded
areas such as wetlands, floodplains and the riparian zone of waterways which includes several
Ramsar and other protected wetlands (van Klinken & Julien 2010). This invasive species
predominately affects pastoral production and mixed farming enterprises (van Klinken &
Lawrence 2008).
14
Figure 1: Lippia distribution under (a) current climate, (b) 2070 future climate using a wetter climate scenario, and (c) 2070 future climate using a drier climate scenario
(Murray et al 2012)
The decline of natural woodland regeneration in riparian areas of Queensland (Leigh & Walton
2004) has been suggested to be also linked with lippia cover. Lippia’s competitive nature
threatens many ecological communities such as Eucalyptus camaldulensis and Eucalyptus
populnea woodlands, Dicanthium grasslands and Cyperus sedgelands (Earl 2003).
The economic impact on the livestock industry in the Murray-Darling Basin has been estimated
to be $38 million per year, excluding the cost of herbicidal control, clearing and infrastructure
damage caused by lippia (Julien et al. 2004; van Klinken & Julien 2010).
1.3.1 The Physiology of Lippia
Lippia is a serious environmental threat in Australia due to its current invaded areas (Figure 1a)
and the area of potential invasions in the future (Figure 1b&c). The invasive species grows
creeping stems up to 1 m long, with fibrous roots that develop at each node (Julien et al. 2004)
(Figure 2). These extra root nodes allow lippia to grow into a thick, mat groundcover (Crawford
a) b) c)

15
2008) which does not allow other ground covers, grasses, shrubs or trees to establish (Earl 2003).
Lippia also grows a deep tap-root, up to 80 cm long (Figure 2), which has the ability to reach
deep moisture reserves (Julien et al. 2004). This extensive root system dries out floodplain clay
soils and causes soil, banks, dam walls and roads to crack and become unstable (Leigh & Walton
2004). This increased erosion may have a flow-on effect in increasing the eutrophication in river
systems as a result of higher nutrient levels in the water (Leigh & Walton 2004).
Figure 2: 14 week old lippia seedling (source: Lucy Galea)
Lippia reproduces both vegetatively and sexually, which allows it to gain an advantage over
other plants in the area (Xu et al. 2012). Both seed and vegetative fragments have the capability
of floating and spreading with floodwaters (Julien et al. 2012b), which helps to distribute lippia
throughout its current range (Taylor & Ganf 2005). Despite vegetative reproduction being a
favoured strategy within local colonies (Price et al. 2011b), field, genetic and morphological data
1cm

16
suggests that sexual reproduction is favoured in the Australian distribution of lippia compared to
the native Argentinian range (Macdonald 2008; Price et al. 2010; Xu et al. 2010). In Australia,
lippia seed bank estimates have been approximated to be 25 439 ± 4901 /m2 seeds directly
underneath adult plants (Price et al. 2011b).
Recent research has shown that lippia seeds require water, light and fluctuating temperatures for
germination (Macdonald et al. 2012). Diurnal temperatures provide enough fluctuation in
temperature to help create the correct germination environment (Macdonald 2008).

17
Table 2: Summary of lippia traits
Lippia trait References
Above-ground growth form - Creeping stems up 1m long
- Thick, mat groundcover
(Julien et al. 2004)
(Crawford 2008)
Below-ground growth form - Up to 80cm-long taproot
- Fibrous roots at each node
(Julien et al. 2004)
(Crawford 2008)
Reproduction - Vegetative fragments dispersed by floodwaters
- Sexual reproduction
(Taylor & Ganf 2005; Julien et al. 2012b)
Flowers - Spring to Autumn
- Small tubular white, pink or lilac
(CSIRO 2007)
(Julien et al. 2004; Crawford 2008)
Seeds - Two seeds – dispersed by natural falling & floodwaters
(CSIRO 2007)
Seed Bank - 25 439 ± 4901 m-2
- Very high density in Australia
(Price et al. 2011b)
(Macdonald et al. 2012)
Pollination - Pollinator needed
- Introduced honeybee (Apis mellifera)
(Gross et al. 2010)
Germination - Requires free water, light & fluctuating temperatures (diurnal temperatures enough)
(Macdonald 2008; Macdonald et al. 2012)
Environmental Impacts - Soil drying to several meters
- Erosion
- Slumping of banks, dam walls & roads
- All caused by deep taproot
(Julien et al. 2004)
(Crawford 2008)
1.3.2 Control Methods for Lippia
The current and potential ranges of lippia highlight the need for an effective lippia control
solution. This control method may potentially involve a combination of multiple control types to
allow managers the best possible opportunity to successfully reduce the invasive species. Current
methods of eradication include pesticides such as Glyphosate, 2,4-D amine and Dichlorprop,
which are not only harmful for the environment but also for animals (Dellow et al. 2010). Many
18
of these herbicides are not suitable for application due to the potential contamination of sensitive
riparian areas, where much of lippia’s range occurs. (Dellow et al. 2010). Herbicides are also not
economically feasible to treat the large areas of land that lippia has invaded. Therefore, it is
necessary that more environmentally friendly methods of restriction are found. The following
sections will examine four previously researched potential control methods.
A potential control method for lippia could be a biological control. Biological control agents
have previously worked for the control of some species, such as the Cactoblastis beetle
(Cactoblastis cactorum) for prickly pear bushes (Opuntia stricta), but not others, such as the
cane toad (Rinella marina) for cane beetles (Dermolepida albohirtum). It is only after careful
research, trialling and testing that a suitable biological control can be released into a new
environment. Currently, research is occurring in Australia to find a suitable biological control for
lippia.
A study was initiated by CSIRO, the United States Department for Agriculture (USDA) and the
University of Bahia Blanca in the native home range of Phyla canescens to examine potential
biological controls for introduction in Australia (Lawrence & van Klinken 2008). Sixteen species
of arthropods and 17 species of fungi were found to be eating or growing on lippia plants
throughout four ecological regions of Argentina over a three and a half year period (van Klinken
& Julien 2010). Out of these species, four insects, two fungi and a mite have been identified as
potential biological control agents (van Klinken & Julien 2010). It has been proposed that the
leaf-feeding beetle, Kuschelina bergi, be tested under quarantine conditions in Australia (van
Klinken & Julien 2010). Australia’s native lippia, Phyla nodiflora, poses a potential problem in
the quest to find a suitable biological control, as it could also be impacted by the introduction of
a lippia eating species (Julien et al. 2012a). It is unclear whether or not funding was reallocated
to this project after its 2012 Phase 2 completion.

19
If Kuschelina bergi or another biological control is to be found effective in the control of lippia
in Australia, it may need to be coupled with other methods of control. Other potential control
methods that have previously been studied include grazing, flooding and mechanical disturbance.
Grazing has been promoted as a lippia control method (Earl 2003). However, it has been found
that grazing is not a suitable control method due to lippia’s lack of palatability to grazers (Price
et al. 2011b). Grazing in fact encourages lippia abundance in invaded pastures/grasslands due to
the reduction of grass root biomass that occurs during grazing (Earl 2003). Earl (2003) suggests
that the most effective method of reducing lippia on a grazing property would be to concentrate
grazing for short periods of time in one area and allowing larger areas to be periodically rested
from grazing, allowing for the regeneration of native grasses and root reserves. However, recent
research suggests that periodic rest from grazing has a limited effect, at least in the short term (<
3 years) (Price et al. 2011a). Seasonally determined rest (rest periods that were determined by
the growing period of the plant) had little to no impact on the biomass of native species over
three different locations (Price et al. 2011a). This shows that resting and grazing may not be
effective solution to reducing lippia cover in grazing areas.
Another method of lippia control that has been investigated is the flooding of areas to encourage
wetland species growth to outcompete lippia. Research in the Gwydir Wetlands, New South
Wales, found that Phyla canescens prefers drier areas, suggesting that a flooding regime may
work to reduce the competitiveness of the species against native wetland plants (Mawhinney
2003). This finding was supported by Price et al. (2010) through field studies in the Gwydir
Wetlands and Macquarie Marshes, New South Wales. However, it should be noted that although
evidence indicates that flooding may reduce lippia abundance, the germination strategies of
lippia (Macdonald 2008) need to be accounted for before any management decision is made to
flood lippia infested areas.

20
The response of lippia to mechanical disturbance was investigated in the PhD thesis of
Macdonald (2008). One of four replicates at each site was disturbed each season with a rotary
hoe, with 5-10 cm of the soil profile being disturbed (Macdonald 2008) to determine the impact
it would have on lippia growth. No seedlings were found in any of the disturbance treatments at
three sites, with emergence observed at the fourth site after a flood (Macdonald 2008). The cover
of lippia recovered relatively quickly in spring and summer from the crowns of surviving roots,
buried plant fragments and vegetative expansion from outside the treatment site (Macdonald
2008). This research indicates that mechanical disturbance is not a suitable control method for
lippia.
A method of control that has not been investigated in relation to lippia is that of prescribed
burning. Some grey literature (Grey 2005; Crawford 2008) lists fire as being used to control
lippia; however, neither author reports on how successful this method was in preventing the
growth and expansion of the lippia. This uncertainty reinforces the need for rigorous, peer
reviewed research into the control of lippia using fire. This knowledge gap will be explored
through this research.
The implementation of inappropriate fire regimes can be detrimental to biodiversity
(Lindenmayer & Burgman 2005), especially in already highly disturbed ecosystems. A study by
Fisher et al. (2009), assessed the use of an altered fire regime in a poor condition, highly invaded
banksia woodland in Western Australia. The study found strong interaction between the number
of fire events, tree canopy cover, community composition and function, and invasion (Fisher et
al. 2009). The continual implementation of inappropriate fire regimes has led to significantly less
(p < 0.01) native species present in sites of poor condition (Fisher et al. 2009). This study shows
how detrimental the implementation of an inappropriate fire regime can be in highly disturbed
ecosystems, such as St Ruth Reserve.

21
1.4 Research Hypothesis and Questions
A review of current literature has indicated that fire as a control method for Phyla canescens has
not been adequately tested. The literature suggests that fire may be detrimental to native species
within the area as fire encourages the invasion and growth of invasive species, particularly forbs,
grasses (D'Antonio et al. 2010) and woody species (Mack & D'Antonio 1998), through changed
fire regimes, increased nutrient, light availability and bare ground (Hobbs & Huenneke 1992).
This research is investigating the following general question:
What is the effect of a prescribed fire on lippia, vegetation structural components and soil seed
bank in a vegetation remnant in a highly modified agricultural landscape?
Specifically, this research project will examine lippia, vegetative structural components and soil
seed banks in burnt and unburnt remnant Eucalyptus camaldulensis and Eucalyptus populnea
woodland at St Ruth Reserve, South East Queensland.
This research project will examine the following specific hypotheses:
1. That there is no difference in the abundance of lippia between burnt and unburnt
treatments, six months after a prescribed burn.
2. That there is no difference in the abundance of other vegetative structural components
between burnt and unburnt woodlands, six months after a prescribed burn.
22
The project will also examine seedling emergence of the post fire soil seed bank of both unburnt
and burnt Eucalyptus camaldulensis and Eucalyptus populnea woodlands through the following
hypotheses:
1. That the burn has resulted in no change in the seedling emergence of lippia seeds stored
in the soil seed bank.
2. That the burn has resulted in no change of pseudo-species richness within the seed bank.
This research will help to fill the knowledge gap of whether fire is a useful tool in the control and
management of lippia whilst contributing to the growing lippia knowledge bank. This study will
help inform farmers and natural resource managers of the type of impact burning may have on
the abundance of lippia. It will also increase our knowledge of the impacts that burning may
have on sensitive riparian ecosystems.

23
Chapter 2: METHODOLOGY
2.1 Study Area
The study was undertaken at St Ruth Reserve, situated along the banks of the Condamine River,
approximately 15 km south of Dalby, southern Queensland (Figure 3). The average minimum
and maximum temperatures for Dalby, the closest town to St Ruth Reserve, are 11.9oC and
26.2oC respectively (Bureau of Meterology 2014). Dalby is 344 m above sea level and receives
a mean annual rainfall of 676.4 mm (Bureau of Meterology 2014).
Figure 3: Map showing the location of the St Ruth Reserve (Source: Google Maps)
St Ruth Reserve
Study Area

24
The Western Downs Regional Council (WRDC) currently manages St Ruth Reserve, a 150 ha
state recreational reserve (Grey 2005). In November 2013, WRDC burnt approximately 50% of
the reserve in a cool, low intensity control (prescribed) burn (Figure 4).
The reserve is a patch of remnant riparian and floodplain grassy woodland which is
predominantly Regional Ecosystem types 11.3.25, 11.3.4 and 11.3.2 (Sattler & Williams 1999).
The predominant species of the reserve are Eucalyptus camaldulensis (River Red
Gum)/Eucalyptus tereticornis (forest red gum), Eucalyptus populnea (poplar box), Acacia
salicina (native willow) and Acacia stenophylla (shoestring acacia) (Crawford 2008).
Until recently, the reserve was held under a grazing lease for grazing cattle (Crawford 2008).
Continual stocking of the reserve resulted in significant changes in the groundcover composition
and structure, resulting in a change from native perennial tussock grasses to a low growing,
lippia-dominant ‘carpet’ (Reardon-Smith 2011). By the late 1990s the reserve was heavily
degraded with gully and river erosion, eucalypt dieback and lippia groundcover dominance
(Crawford 2008). The grazing lease was revoked in 1999 when the reserve was reclassified as a
state recreational reserve (Crawford 2008). Since the cessation of grazing, the reserve has shown
signs of recovery (QMDC 2005). Lippia cover had decreased significantly post grazing
exclusion with an increase in the relative abundance of other species including native perennial
grasses (Reardon-Smith 2011). However, this decline in lippia abundance coincided with a
prolonged drought, which is believed to have contributed to the decrease in abundance (Reardon-
Smith 2011). Since then, the reserve has flooded several times, including 2014, which has seen
lippia return of to all areas of the reserve (pers. obs.). Some small scale trials had been initiated
within the reserve to help reduce lippia cover, but once discontinued the experiments did not
provide an observable, overall impact on lippia cover at St Ruth Reserve (QMDC 2005). One of
the small scale trials implemented was a cool fire in 2001 (QMDC 2005). Other than the 2001
and 2013 fires, there are no records of other fires at St Ruth Reserve.

25
Figure 4: Aerial photograph of St Ruth Reserve showing burnt/unburnt areas in
November 2013 and the position of survey sites (Source: Lucy Galea/Google Maps)
Unburnt E. camaldulensis Burnt E. camaldulensis Burnt Area
Unburnt E. populnea Burnt E. populnea
200m

26
The Darling Downs region is recognised as Queensland’s most fertile agricultural district and
was predominantly used for cattle and sheep grazing from 1840 until about the 1960s from
which time and agriculture and cultivation replaced grazing as the dominant land use (Fensham
1998).
In 2010–2011, the Darling Downs and Maranoa region had a gross agricultural production value
of $2.5 billion (Trestrail et al. 2013). This equated to 26% of the total gross value of agricultural
production in Queensland for 2010 – 2011 (Trestrail et al. 2013). The region’s main agricultural
commodities are cotton (worth $656 million), cattle and calves (worth $505 million) wheat
(worth $297 million) and sorghum (worth $181 million) (Trestrail et al. 2013).
The region is composed of four broad remnant vegetation types: a) red gum woodland; b)
grassland; c) poplar box woodland; d) hill woodland. Red gum woodlands are dominated by E.
camaldulensis or E. tereticornis growing on the floodplains of major water systems (Fensham
1998). Treeless grassland occurs on clay soil plains (Fensham 1998). Poplar box woodland is
defined by E. populnea woodland occupying rock free clay loam soils that are not prone to
flooding (Fensham 1998). Hill woodland is dominated by E. albens, E. crebra, E.. melliodora or
E. orgadophila species on clay loam soils on rocky hilly terrain (Fensham 1998).
Prior to modification the region was dominated by Queensland bluegrass (Dichanthium
sericeum) (Fensham 1998). However, this has been reduced to approximately 1% of its former
area (Fensham 1998). E. tereticornis/E. populnea grassy open woodland has been reduced to
11.39% of its original area since clearing began in the area (Fensham 1997). Remnant native
areas that are remaining on the Darling Downs are mostly in poor condition (Reardon-Smith
2011).
27
2.2 Experimental Design
Study sites were located within two vegetation types within the Reserve:
1. E. camaldulensis/E. tereticornis (river red gum/forest red gum) grassy woodland (from
here referred to as E. camaldulensis woodland)
2. E. populnea (poplar box) grassy woodland
The experimental design was a nested design with burnt/unburnt plots nested within woodland
type (Figure 5). This gave four experimental combinations of: burnt E. camaldulensis (BC),
burnt E. populnea (BP), unburnt E. camaldulensis (UC) and unburnt E. populnea (UP). The
unburnt plots formed the control sites for the experiment. Five replicates of each treatment and
control were used (Figure 4 & 5). This gave a total of 20 total sampling sites for the experiment.
Sites were selected two weeks after the prescribed burn with GPS locations recorded (see
Appendix A). The selection of sites considered surrounding vegetation and external factors to
ensure that confounding effects were minimised. These included avoiding obvious tracks and
gullies within the reserve and selecting sites at least 30 m away from fences and being at least
100 m away from sites of the same type.

28
Figu
re 5
: Dia
gram
of e
xper
imen
tal d
esig
n us
ed, s
how
ing
burn
t/unb
urnt
plo
ts n
este
d w
ithin
eac
h w
oodl
and

29
2.3 Field Experiment: Patterns in Vegetation Across Burnt/Unburnt Woodlands
Field work was undertaken between May and June 2014, six months after the controlled burn. A
brief site description was recorded to account for any nearby potentially confounding influences
such as agricultural land, obvious tracks and the river, as well as how far away these were from
the site. It was also noted if there was evidence of flooding, such as debris in trees, from March
2014.
General site condition was subjectively measured on a five point ‘disturbance’ scale: 0 (no
evidence of disturbance) to 4 (substantial disturbance) at each site. Disturbance variables
measured were grazing, clearing, logging, erosion, weeds, feral animals, soil compaction and
evidence of dieback (as per Batterham 2008) (Table 3).

30
Table 3: Summary of variables measured at each site
Variable Measure Description
Site Condition
Grazing 0–4 Cattle, sheep grazing etc: evidence of scats, hoof prints
Clearing 0–4 Pushing, chaining etc: presence of logs, mechanical soil disturbance
Logging 0–4 Selective logging, firewood gathering: presence of stumps, chopped logs
Erosion 0–4 Sheet, Gully
Weeds 0–4 Introduced pest species, native pests
Feral Animals 0–4 Pigs, goats, horses, foxes, cats etc: evidence of scats, burrows, diggings (pigs)
Soil Compaction 0–4 Physical compaction of soil
Evidence of Dieback 0–4 Stags
500m2 Quadrat
Trees >20m No. and %cover Trees above 20 m high
Trees 10-20m No. and %cover Trees between 10 m and 20 m high
Trees <10m No. and %cover Trees less than 10 m high
Standing Stag >20m No. and %cover Stags above 20m high
Standing Stag 10-20m No. and %cover Stags between 10 m and 20 m high
Standing Stag <10m No. and %cover Stags less than 10 m high
Stumps No. and %cover Stumps
Logs: Thumb – Two Fingers No. and %cover Logs and branches between 6 cm and 13 cm
Logs: 2 Fingers – 2 Hands No. and %cover Logs and branches between 13 cm and 35 cm
Logs: 2 Hands – 1 Arm No. and %cover Logs and branches between 35 cm and 90 cm
Logs: 1 Arm – 2 Arms No. and %cover Logs and branches between 90 cm and 150 cm
Grasses/Sedges %cover Subjective cover of total grasses present
Herbs/Forbs %cover Subjective cover of total herbs/forbs present
Lippia %cover Subjective cover of total alive lippia present
Fine Litter: Leaf Litter/Twigs %cover Subjective cover of total fine litter (leaf litter/twigs) present
Lippia Litter %cover Subjective cover of total fine litter (brown lippia) present
Bare ground %cover Subjective cover of bare ground exposed
70cm2 Quadrat
Lippia %cover Approximate % of quadrat that has green lippia
Lippia Litter %cover Approximate % of quadrat that has brown lippia
Lippia Frequency /64 Squares of quadrat that has lippia growth
Lippia Frequency /81 Point intersections that have lippia underneath them
Grass Frequency /64 Squares of quadrat that has rooted grasses growth
Forbs Frequency /64 Squares of quadrat that has rooted forbs growth
31
At each site a 500 m2 (22.3 m x 22.3 m) quadrat was set out with the initial site marker
approximately in the centre of the quadrat. The number of trees within the quadrat were counted
within three height categories: > 20 m, 10–20 m and < 10 m. A clinometer and tape measure was
used to measure trees thought to be taller than 10 m. The number of standing stags within the
quadrat were also measured using the same height categories. The number of stumps within the
quadrat were also counted. Fallen logs and branches were categorised into four diameter
categories: 6 cm to 13 cm; 13 cm to 35 cm; 35 cm to 90 cm; 90 cm to 150 cm. The percentage
cover of the above variables plus the cover of grasses/sedges, herbs/forbs, lippia, fine litter: leaf
litter/twigs, lippia litter and bare ground were also subjectively assessed.
A 16 m transect was run diagonally across each 500 m2 from the south eastern corner. Along this
transect, a 70 cm2 sub-quadrat was placed at every second metre (8 samples total across transect)
to determine finer scale patterns in lippia cover and other selected variables. The quadrat was
laced with 4 ropes equal distance apart on each side to create a network of 64 squares and 81
point intercepts. Lippia variables measured within each 70 cm2 quadrat included: a subjective
percent cover of lippia and lippia litter (lippia litter is brown/dead lippia); frequency
(presence/absence) for lippia within each of the 64 squares (reported as a proportion); intercept
lippia cover (presence/absence) of lippia at each of the 81 points (reported as a proportion). A
count was made when any part of the lippia plant was found in a square or directly under a point
intercept, respectively. These three estimates were used to determine if there were any
differences in the ability of methods to account for the variable being measured. Frequency at 64
squares (reported as a proportion) was also recorded for grasses and forbs, with the grass or forb
having to be rooted within the square to be counted.

32
2.4 Glasshouse Experiment: Soil Seed Bank Germination Across Burnt/Unburnt Woodlands
Soil samples were collected at each of the sites sampled in Section 2.3 to determine the
germinable seed bank of burnt/unburnt treatments within each woodland. Soil sub-samples were
collected from four points within the 500 m2 quadrat; which were determined using random
numbers between 1 and 10, previously generated by a Random Number Generator application. A
15 cm2 square was outlined using a shovel, and soil was taken from this area to a depth of
approximately 2 cm. The four soil samples for each site were bulked, mixed and placed in paper
bags. After collection, any large root matter, live plant particles and rocks were removed to
ensure that any emergent germinants were only from the seed bank.
In the glasshouse, each bulked soil sample was placed on top of 1 cm of washed river sand in
seed trays. Two trays of sand only were also prepared as a control for the experiment to identify
any contamination from the sand or glasshouse during the experiment. Sample number was
written on each tray for identification. Trays were placed in the greenhouse and watered until
saturation point. Samples were left in the greenhouse for a period of 14 weeks so that
germination could occur. Watering occurred every one to four days, and was dependent on the
dryness of the soil. Trays were situated in two rows within the greenhouse. Rotation of trays
(both swapping of rows and within rows) occurred once a week to minimise any bias due to
variations in sunlight and temperature within the greenhouse. A table of randomised numbers
between 1 and 11, generated by a Random Number Generator application, provided a different
tray rotation within a row each week.
Once a week, trays were checked for new germinants. New germinants were labelled with a
coloured toothpick to indicate the week of emergence (Appendix B). Week one and two
emergence was combined due to field work also being carried out at this time. Germinants of
species that were distinguishable at Week 4 were removed, while others that could not be

33
determined were left in the tray to grow further. Removal of identifiable germinants reduced
competition for light and nutrients, which may have inhibited further germination if these
germinants had not been removed. After Week 14, all seedlings were removed and counted.
Seedlings were separated into monocots and dicots. Species, apart from lippia, were not
identified taxonomically due to time constraints and pseudo species names were given to
distinguish between species and to enable ‘pseudo-species’ richness of each sample to be
determined (Appendix C).
2.5 Statistical Analyses
All analyses were performed using IBM SPSS ® for Windows version 20.0. Independent T-tests
(Sedgewick 2010) were used for all analyses following any necessary data transformations (see
below). The Levene’s Test for Homogeneity was also used to determine whether the samples
were homogeneous (Lim & Loh 1996).
2.5.1 Field Experiment: Patterns in Vegetation Across Burnt/Unburnt Woodlands
Independent T-tests were used to determine if there were any significant differences (p < 0.05) in
measured variables at the 500 m2 quadrat scale between burnt and unburnt plots within each
woodland type. Variables tested were the proportion of trees (total), stags (total), stumps, logs
(total), grasses/sedges, herbs/forbs, lippia, fine litter (leaf litter/twigs), lippia litter and bare
ground. All proportion values were arcsine transformed before analysis to overcome
boundedness (e.g. Masocha et al. 2011). All count data was log10(1+x) transformed prior to
analysis to also overcome non-normality (e.g. Price et al. 2011b)..

34
Any potential significant differences (p < 0.05) between burnt and unburnt sites within each
woodland were also tested by comparing lippia, grass and forb growth within woodlands from
the 70 cm2 quadrat data. Frequency data from the eight 70 cm2 sub-quadrats were converted to
proportions and averaged to obtain mean proportion cover data for the analyses. All proportion
data were arcsine transformed and Independent T-tests were used to determine if there were any
significant differences between means.
2.4.2 Glasshouse Experiment: Soil Seed Bank Germination Across Burnt/Unburnt
Woodlands
Independent T-tests were used to test whether there were any significant differences (p < 0.05) in
seedling emergence, between burnt and unburnt treatments within woodland types. Numbers of
‘monocots’, ‘dicots’, ‘dicots minus lippia’, ‘lippia’, ‘total germinants’ and ‘total germinants
minus lippia’ were all tested for significant differences between treatments.
Independent T-tests were also used to determine any differences (p < 0.05) in pseudo-species
richness between burnt and unburnt treatments from each woodland. As the data was count data,
all values were log10(x+1) transformed prior to analysis (e.g. Price et al. 2011b). The (x+1)
transformation was used to account for weeks where there was no new emergence (i.e. zeros in
the data) (Price et al. 2011b). Data from both Week 3 and Week 14 were analysed. Week 3 data
were analysed because this time period signalled the end of the immediate emergence flush.
Week 14 data were analysed as this was at the end of the experiment.

35
Chapter 3: RESULTS
3.1 General Results
Measures of disturbance were similar across all sites irrespective of treatment or woodland
(Table 4). There was no evidence of erosion or soil compaction, with minimal feral animal
disturbance at any of the sites at either woodland (Table 4). High levels of weed infestation and
dieback were seen across all sites and woodlands (Table 4) (Appendix D).
Table 4: Site disturbance score (0-4) ranges and means in burnt and unburnt
E. camaldulensis and E. populnea woodland at St Ruth Reserve, south-eastern Queensland
Disturbance type Burnt Unburnt
Min Max Mean Min Max Mean
E. camaldulensis
Grazing 1 2 1.6 1 2 1.4
Clearing 1 2 1.2 1 2 1.6
Logging 1 3 1.8 1 3 2
Erosion 0 0 0 0 0 0
Weeds 2 3 2.4 2 4 3
Feral animals 0 0 0 0 1 0.2
Soil compaction 0 0 0 0 0 0
Evidence of dieback 1 3 2 2 3 2
E. populnea
Grazing 0 1 0.8 1 2 1.6
Clearing 1 3 2 1 3 1.8
Logging 2 3 2.2 0 3 2
Erosion 0 0 0 0 0 0
Weeds 2 3 2.6 1 3 1.8
Feral animals 0 1 0.2 0 1 0.2
Soil compaction 0 0 0 0 0 0
Evidence of dieback 2 3 2.4 1 2 1.2
36
3.2 Patterns in Vegetation Across Burnt/Unburnt Woodlands
3.2.1 Cover and density of structural components (at 500 m2 scale)
Across all sites sampled, total tree cover ranged from 0% to 10%. Across the 10 unburnt sample
sites, tree density per 500 m2 ranged from 1 to 21 with an average of 7.5 trees per 500 m2 (SE ±
1.1). The 10 burnt treatment sites had a range of tree density per 500 m2 of 0 to 11 with an
average of 3.8 trees per 500 m2 (SE ± 2.2). Stag and stump density was similar across all
treatments and woodlands, with a range from 0 to 3. The average stag density was 0.6, with the
average stump density of 0.95. There was large variation in log density across the two treatments
and woodlands. Log density ranged from 5 to 187 with an average of 44.25. There were no
major patterns or trends to report from this data.
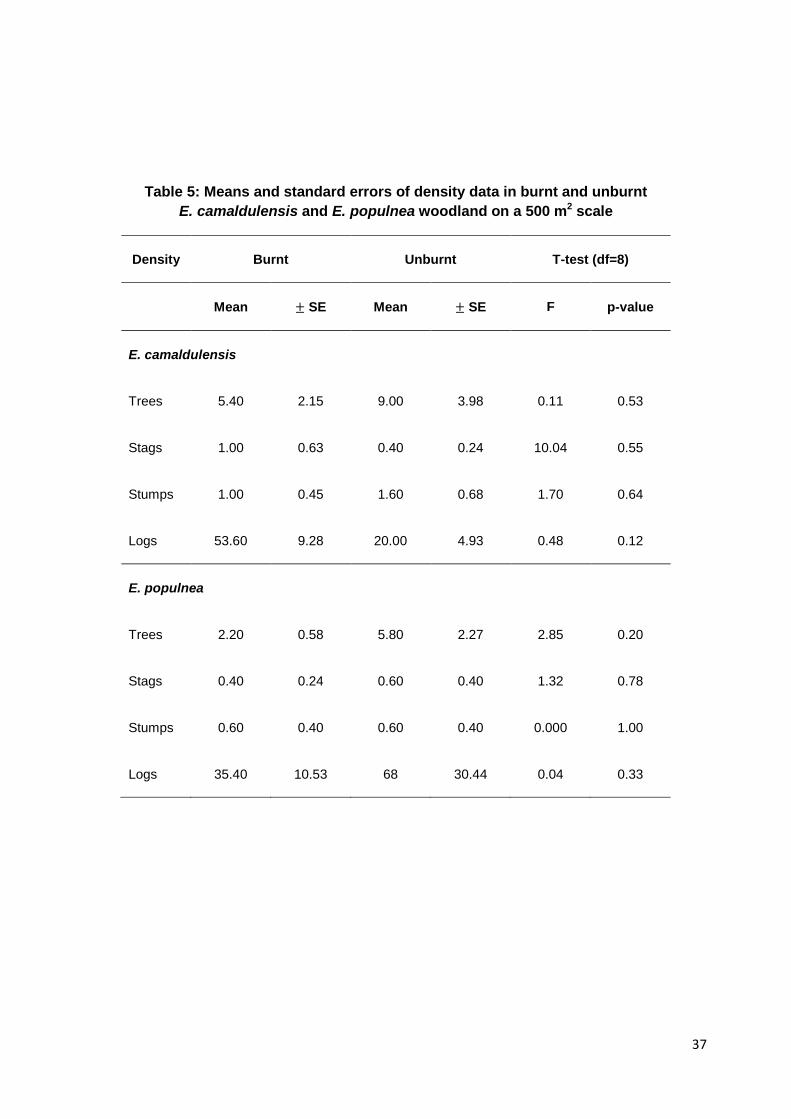
Density of trees, stags and stumps were relatively similar across both burnt and unburnt
treatments in E. camaldulensis and E. populnea woodlands. Tree density was highest in unburnt
woodlands. E. camaldulensis woodlands experiences high log density in burnt patches, while
the highest log density in E. populnea woodlands was observed in unburnt treatments (Table 5;
Figures 6 & 7; Appendix E)
37
Table 5: Means and standard errors of density data in burnt and unburnt E. camaldulensis and E. populnea woodland on a 500 m2 scale
Density Burnt Unburnt T-test (df=8)
Mean ± SE Mean ± SE F p-value
E. camaldulensis
Trees 5.40 2.15 9.00 3.98 0.11 0.53
Stags 1.00 0.63 0.40 0.24 10.04 0.55
Stumps 1.00 0.45 1.60 0.68 1.70 0.64
Logs 53.60 9.28 20.00 4.93 0.48 0.12
E. populnea
Trees 2.20 0.58 5.80 2.27 2.85 0.20
Stags 0.40 0.24 0.60 0.40 1.32 0.78
Stumps 0.60 0.40 0.60 0.40 0.000 1.00
Logs 35.40 10.53 68 30.44 0.04 0.33

38
Figure 6: E. camaldulensis average count of: a) trees; b) stags; c) stumps; d) logs (note different scale)
0
5
10
15
E. camaldulensis
Aver
age
Tree
Cov
er
per 5
00m
2
Burnt Unburnt
0
5
10
15
E. camaldulensis
Aver
age
Stag
Cov
er
per 5
00m
2
Burnt Unburnt
0
5
10
15
E. camaldulensis
Aver
age
Stum
p C
over
pe
r 500
m2
Burnt Unburnt
0
20
40
60
80
100
E. camaldulensis
Aver
age
Log
Cove
r pe
r 500
m2
Burnt Unburnt
a) b)
c) d)

39
Figure 7: E. populnea average count of: a) trees; b) stags; c) stumps; d) logs (note different scale)
Across all treatments and woodlands, percent tree cover ranged from 0% to 10% with an average
cover of 3.5% (SE ± 0.6). Average stag cover was 0.2% (SE ± 0.05), with an average stump
cover of 0.17% (SE ± 0.05). The average log cover across all treatments and woodlands was
1.2% (SE ± 0.8) with a range of 0.5% to 3%. Across both woodlands and treatments, the average
percentage cover of grass/sedge (70 cm2 quadrats) was 53.5% (SE ± 6.1), with a range of 5% to
90%. Fine litter cover ranged from 0.1% to 3%, with an overall average of 0.9% (SE ± 0.2). The
average lippia cover of all treatments was 35.2% (SE ± 6.7) and a range of 0.5% to 85% with
lippia litter having an observed average of 0.1% (SE ± 0.1), ranging from 0% to 1% cover. Bare
ground had an overall average cover of 0.7% (SE ± 0.3), with a range from 0% to 5% (Appendix
E).
020406080
100
E. populneaAv
erag
e Lo
g Co
unt
per 5
00m
2
Burnt Unburnt
0
5
10
15
E. populneaAver
age
Stum
p Co
unt
per 5
00m
2
Burnt Unburnt
0
5
10
15
E. populneaAver
age
Stag
Cou
nt
per 5
00m
2
Burnt Unburnt
0
5
10
15
E. populneaAver
age
Tree
Cou
nt
per 5
00m
2
Burnt Unburnta) b)
c) d)

40
Tree cover was highest in unburnt E. populnea treatments, with bare ground cover highest in
burnt treatments. The average cover of grass was highest in E. camaldulensis unburnt treatments,
with percent lippia consistent over both treatment types. Lippia litter was minimal (Table 6;
Appendix E).
No significant differences (T-tests; p > 0.05) were found between burnt and unburnt treatments
for the average density (Appendix F) or percentage cover of trees, stags, stumps or logs in 500
m2 quadrats (Table 7; Appendix G) within either E. camaldulensis or E. populnea woodlands.

41
Table 6: Percentage cover average of field variables at 500 m2 scale
% Cover Burnt Unburnt
Mean ± SE Mean ± SE
E. camaldulensis
Trees 2.80 1.24 2.40 0.93
Stags 0.20 0.12 0.20 0.12
Stumps 0.3 0.12 0.22 0.12
Logs 1.00 0.27 0.70 0.122
Grasses/sedges 47.00 17.07 59.00 9.66
Herbs/forbs 8.1 6.73 4.6 2.61
Lippia 36.2 19.92 38.8 14.7
Lippia litter 0.00 0.00 0.20 0.20
Fine litter 0.82 0.24 0.60 0.10
Bare ground 0.60 0.10 0.12 0.09
E. populnea
Trees 3.60 1.63 4.12 1.26
Stags 0.20 0.12 0.12 0.09
Stumps 0.12 0.09 0.04 0.02
Logs 1.78 0.49 1.30 0.30
Grasses/sedges 60.00 12.14 48.00 12.00
Herbs/forbs 8.6 4.38 1.72 1.32
Lippia 29 6.40 37.1 13.12
Lippia litter 0.00 0.00 0.34 0.18
Fine litter 1.02 0.52 1.3 0.44
Bare ground 1.72 0.88 0.42 0.18

42
Table 7: Summary data for field variables at a 500 m2 scale (all proportions were arcsine transformed prior to analysis)
Levene’s Test for Homogeneity T-Value df Significance
F stat Sig
E. camaldulensis Woodland
Trees 0.267 0.619 1.096 8 0.305
Standing stags 1.833 0.213 -0.512 8 0.622
Stumps 35.200 0.000 -1.521 8 0.167
Logs 8.395 0.02 1.852 5.2971 0.120
Grasses 0.311 0.592 -0.588 8 0.573
Herbs/forbs 1.336 0.281 -0.982 8 0.355
Fine litter 3.467 0.100 1.565 8 0.156
Lippia 0.391 0.549 -0.147 8 0.887
Lippia litter 0.003 0.958 0.513 8 0.622
Bare ground 1.580 0.244 1.485 8 0.176
E. populnea Woodland
Trees 0.116 0.742 0.391 8 0.706
Standing stags 0.000 1.000 0.000 8 1.000
Stumps 1.833 0.213 -1.152 8 0.282
Logs 7.334 0.027 1.372 6.2131 0.218
Grasses 0.725 0.419 0.539 8 0.604
Herbs/forbs 0.609 0.458 0.050 8 0.962
Fine litter 1.152 0.314 0.352 8 0.734
Lippia 30.448 0.001 -0.526 4.6371 0.623
Lippia litter 0 0 0 0 0
Bare ground 5.914 0.041 1.265 4.1031 0.273 1 T-test statistic for non-homogeneous variances as indicated by Levene’s Test

43
3.2.2 Fine Scale Patterns of Frequency and Cover (70 cm2 sub-quadrats)
Fine scale patterns of lippia, grasses/sedges and herbs/forbs were determined using the
70 cm2 sub-quadrats within each 500 m2 quadrat. Subjective lippia cover ranged from 7.6% to
95.6% over all treatments and woodlands, with an overall percent average of 44.1% (SE ± 5.1).
Sixty-four square frequency of lippia ranged from 38.7% to 100% with an average of 75% (SE ±
3.9). The point-intersect method for lippia had a range of 17.9% to 93.7% with an average of
51.6% (SE ± 4.8). The average grass frequency on a fine scale was 66.92% (SE ± 4.1), with a
range from 22.9% to 95.5%. Average forb frequency was 47.7% (SE ± 3.9) with a range from
20.5% to 81.4%.
Lippia cover was consistently high over the three study methods, with minimal lippia litter
present over both treatments and woodlands. Grass and forb cover were relatively similar over
both E. camaldulensis and E. populnea woodlands (Table 8; Figures 8 & 9; Appendix H).

44
Table 8: Average percent cover at a 70 cm2 scale
Ground Cover (%) Burnt Unburnt T-test (df=8)
Mean ± SE Mean ± SE F p-value
E. camaldulensis
Lippia 56.40 13.21 51.84 11.36 1.21 0.72
Lippia litter 0.06 0.04 2.79 2.08 6.77 0.15 (df=4.105)
Lippia (/64) 80.59 7.37 82.19 6.92 0.13 0.93
Lippia (/81) 72.03 15.76 77.15 11.80 1.11 0.91
Grasses/sedges (/64) 61.21 10.34 68.55 6.88 0.49 0.59
Forbs/herbs (/64) 52.15 9.13 39.49 5.99 1.84 0.26
E. populnea
Lippia 39.88 5.49 28.39 7.58 0.59 0.26
Lippia litter 0.03 0.02 0.37 0.19 15.55 0.154 (df=4.002)
Lippia (/64) 67.03 9.54 71.76 7.05 0.46 0.75
Lippia (/81) 62.73 7.21 49.14 11.88 1.109 0.599
Grasses/sedges (/64) 73.59 6.16 64.34 10.21 1.95 0.03*
Forbs/herbs (/64) 61.37 5.80 37.77 6.72 0.00 0.389
* Denotes significance difference (p < 0.05)
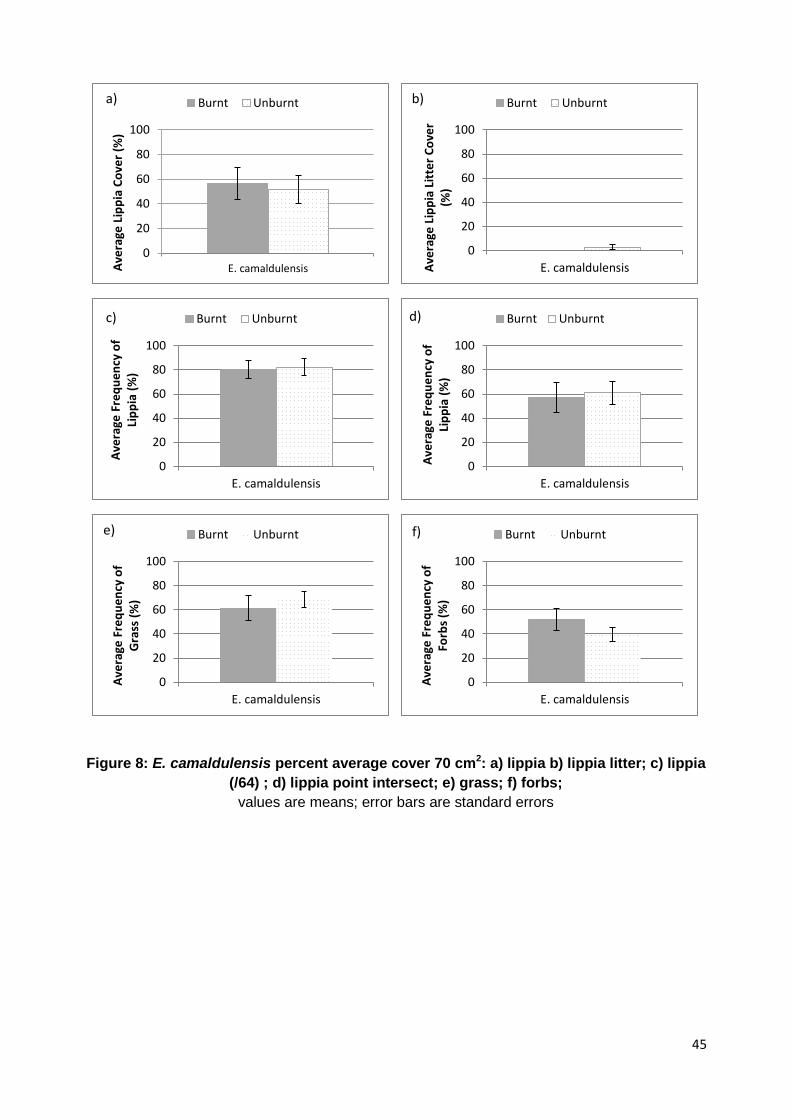
45
Figure 8: E. camaldulensis percent average cover 70 cm2: a) lippia b) lippia litter; c) lippia (/64) ; d) lippia point intersect; e) grass; f) forbs;
values are means; error bars are standard errors
0
20
40
60
80
100
E. camaldulensisAver
age
Lipp
ia C
over
(%)
Burnt Unburnt
0
20
40
60
80
100
E. camaldulensisAver
age
Lipp
ia L
itter
Cov
er
(%)
Burnt Unburnt
0
20
40
60
80
100
E. camaldulensis
Aver
age
Freq
uenc
y of
Li
ppia
(%)
Burnt Unburnt
0
20
40
60
80
100
E. camaldulensis
Aver
age
Freq
uenc
y of
Li
ppia
(%)
Burnt Unburnt
0
20
40
60
80
100
E. camaldulensis
Aver
age
Freq
uenc
y of
G
rass
(%)
Burnt Unburnt
0
20
40
60
80
100
E. camaldulensis
Aver
age
Freq
uenc
y of
Fo
rbs (
%)
Burnt Unburnt
a) b)
c) d)
e) f)

46
Figure 9: E. populnea percent average cover 70 cm2: a) lippia b) lippia litter; c) lippia (/64); d) lippia point intersect; e) grass; f) forbs;
values are means; error bars are standard errors; *significant difference p<0.05
0
20
40
60
80
100
E. populnea
Aver
age
Freq
uenc
y of
Lip
pia
(%)
Burnt Unburnt
0
20
40
60
80
100
E. populneaAver
age
Freq
uenc
y of
Lip
pia
(%)
Burnt Unburnt
0
20
40
60
80
100
E. populneaAver
age
Freq
uenc
y of
Gra
ss
(%)
Burnt Unburnt
0
20
40
60
80
100
E. populneaAver
age
Freq
uenc
y of
For
bs
(%)
Burnt Unburnt
0
20
40
60
80
100
E. populnea
Aver
age
Lipp
ia C
over
(%)
Burnt Unburnt
0
20
40
60
80
100
E. populnea
Aver
age
Lipp
ia L
itter
Cov
er
(%)
Burnt Unburnta) b)
c) d)
e) f)
*

47
There was a significant difference (p < 0.05) in forb frequency between burnt and unburnt
treatments within E. populnea woodland (Figure 9f; Table 7) in the 70cm2 sub-quadrats, with
forb frequency significantly higher in the burnt E. populnea treatment (Figure 9f). There were no
other significant differences (p > 0.05) in frequency and cover variables between burnt and
unburnt treatments of E. camaldulensis and E. populnea woodlands when compared at a fine
scale of 70 cm2 (Table 9; Appendix I).

48
Table 9: Summary Data for Field Variables at a 70 cm2 scale (all proportions were arcsine transformed prior to analysis)
Levene’s Test for
Homogeneity T-Value df Significance
F stat Sig
E. camaldulensis Woodland
Lippia cover (subjective) 1.212 0.303 0.376 8 0.716
Lippia litter cover (subjective) 6.770 0.032 -1.3141 4.002 0.259
Lippia frequency 0.131 0.726 -0.086 8 0.933
Grass frequency 0.488 0.505 -0.569 8 0.585
Forbs frequency 1.836 0.212 1.209 8 0.268
Lippia cover (point intersect) 1.109 0.323 -0.125 8 0.903
E. populnea Woodland
Lippia cover (subjective) 0.590 0.464 1.213 8 0.260
Lippia litter cover (subjective) 15.552 0.004 -1.7451 4.105 0.154
Lippia frequency 0.457 0.518 -0.327 8 0.752
Grass frequency 1.954 0.200 0.547 8 0.599
Forbs frequency 0.000 0.990 2.579 8 0.033*
Lippia cover (point intersect) 1.797 0.217 0.912 8 0.389
1T-test statistic for non-homogeneous variances as indicated by Levene’s Test; * significant difference (p < 0.05)
49
3.3 Soil Seed Bank Germination Across Burnt/Unburnt Woodlands
3.3.1 Germinant Emergence
The average total germinant emergence over the 14 weeks for all treatment and woodland
combinations was 108.6 germinants (SE ± 16.1) with a range from 25 to 305 germinants.
Monocot germination ranged from 0 to 30 germinants across all treatment and woodland
combinations (Appendix J).
Total germinants were higher in unburnt plots than burnt plots over both woodlands. The
germination and emergence of lippia was low over both E. camaldulensis and E. populnea
woodlands and burnt and unburnt treatments. Lippia did not have any significant effect on the
total sample germination, with total germinants minus lippia being minimally less than total
germinants (Table 10; Figures 10 & 11).

50
Table 10: Mean and standard error of average germination
Average Germination Burnt Unburnt
Mean ± SE Mean ± SE
E. camaldulensis
Monocots 1.20 0.49 4.80 1.85
Dicots 102.00 26.84 141.40 44.33
Lippia 1.80 0.97 3.20 0.97
Total germinants 103.20 26.86 146.20 45.90
Total germinants minus
lippia 101.4 27.50 143.00 45.36
E. populnea
Monocots 7.80 5.60 9.8 2.92
Dicots 65.6 13.85 101.6 30.96
Lippia 2.40 1.25 5.00 2.00
Total germinants 73.40 18.48 111.4 33.40
Total germinants minus
lippia 71.00 17.74 106.4 34.30

51
Figure 10: E. camaldulensis average germinants of: a) monocots; b) lippia; c) dicot; d) total; e) total minus lippia (please note scale on all graphs);
values are means; error bars are standard errors
0
5
10
15
E. camaldulensis
Aver
age
Ger
min
ants
Burnt Unburnt
0
5
10
15
E. camaldulensis
Aver
age
Ger
min
ants
Burnt Unburnt
0255075
100125150175200
E. camaldulensis
Aver
age
Ger
min
ants
Burnt Unburnt
0255075
100125150175200
E. camaldulensis
Aver
age
Ger
min
ants
Burnt Unburnt
0255075
100125150175200
E. camaldulensis
Aver
age
Ger
min
ants
Burnt Unburnt
a) b)
c) d)
e)

52
Figure 11: E. populnea average germinants of: a) monocot; b) lippia; c) dicot; d) total; e) total minus lippia (please note scale on all graphs) values are means; error bars are
standard errors
0
5
10
15
E. populnea
Aver
age
Ger
min
ants
Burnt Unburnta
0
2
4
6
8
E. populnea
Aver
age
Ger
min
ants
Burnt Unburntb
0255075
100125150175200
E. populnea
Aver
age
Ger
min
ants
Burnt Unburntc)
0255075
100125150175200
E. populnea
Aver
age
Ger
min
ants
Burnt Unburntd
0255075
100125150175200
E. populnea
Aver
age
Ger
min
ants
Burnt Unburnte

53
Average accumulation curves for both woodland types show that the average number of
germinants per tray plateaued after the initial flush of seedling emergence in the first three weeks
of the trial (Figure 12). There were no significant differences (T-tests; p > 0.05) in seedling
emergence between burnt and unburnt treatments in either woodland type This was true for
seedling emergences for both Week 3 and Week 14 (Table 11; Appendix K).
Figure 12: Average cumulative number of germinants in a) E. camaldulensis and b) E. populnea woodland soil samples; values are means; error bars are standard errors
020406080
100120140160
1+2 3 4 5 6 7 8 9 10 11 12 13 14
Aver
age
Ger
min
ants
Weeks
Average Burnt E. populnea Average Unburnt E. popluneab)
020406080
100120140160
1+2 3 4 5 6 7 8 9 10 11 12 13 14
Aver
age
Ger
min
ants
Weeks
Average Burnt E. camaldulensis Average Unburnt E. camaldulensisa)

54
Table 11: Summary data for glasshouse germinants in seedbank trial (all means were log10(1+x) transformed before analysis)
Levene’s Test for Homogeneity
T-Value df Significance
F stat Sig
E. camaldulensis Woodland (T=3)
Total Germinants 0.13 0.913 -1.617 8 0.145
Total Germinants (minus lippia) 0.013 0.912 -0.521 8 0.617
Lippia Germinants 0.174 0.687 -1.416 8 0.195
E. populnea Woodland (T=3)
Total Germinants 0.007 0.933 -0.600 8 0.565
Total Germinants (minus lippia) 0.44 0.840 -1.243 8 0.249
Lippia Germinants 0.054 0.822 -0.964 8 0.363
E. camaldulensis Woodland (T=14)
Total Germinants 0.007 0.935 -0.636 8 0.542
Total Germinants (minus lippia) 0.008 0.930 -0.619 8 0.396
Lippia Germinants 0.298 0.600 -1.000 8 0.347
E. populnea Woodland (T=14)
Total Germinants 0.040 0.847 -1.086 8 0.309
Total Germinants (minus lippia) 0.318 0.588 -0.729 8 0.487
Lippia Germinants 0.202 0.665 -0.899 8 0.395
T = weeks since start of germination trial

55
Average accumulation of lippia emergence shows a similar pattern to that of the total germinants
(Figure 13). Burnt sites in both woodland types had approximately half the number of lippia
seedlings compared to the unburnt sites. However, when statistically analysed this difference
was not significant (p > 0.05) for either woodland (Table 11). In all treatments and woodland
types there was an eventual plateauing of lippia germination.
Figure 13: Average accumulation curves for lippia in a) E. camaldulensis and b) E. populnea woodlands; values are means; error bars are standard errors
00.5
11.5
22.5
33.5
4
1+2 3 4 5 6 7 8 9 10 11 12 13 14
Aver
age
Ger
min
ants
Weeks
Average Burnt E. camaldulensis Average Unburnt E. camaldulensisa)
0
1
2
3
4
5
6
1+2 3 4 5 6 7 8 9 10 11 12 13 14
Aver
age
Ger
min
ants
Weeks
Average Burnt E. populnea Average Unburnt E. popluneab)

56
3.3.2 Pseudo-Species Richness
Pseudo-species richness ranged from 5 pseudo-species to 25 pseudo-species across both
woodlands and treatments. The average pseudo-species richness of burnt E. camaldulensis was
10.2 pseudo-species (SE ± 2.1) compared to the average pseudo-species richness of unburnt
treatments of 17.8 pseudo-species (SE ± 2.6) (Figure 16a). The average pseudo-species richness
of burnt treatments in E. populnea woodland was 15.4 pseudo-species (SE ± 1.9) compared to
the unburnt richness of 12.6 pseudo-species (SE ± 2.2) (Figure 16b) (Appendix L).
The pseudo-species richness between the burnt and unburnt samples from the E. camaldulensis
woodland was significantly different (p < 0.05), with burnt treatment plots exhibiting lower
pseudo-species richness (see Figure 16a). However, when plot BC5 (n = 5) was removed from
the data and the analysis re-run, the difference between the treatments was no longer significant
(p = 0.091; p > 0.05). Pseudo-species richness was not significantly different (p > 0.05) between
burnt and unburnt samples of the E. populnea woodland (Figure 16b and Appendix L).

57
1.
Figure 14: Average pseudo-species richness of each woodland a) E. camaldulensis; b) E. populnea; values are means; error bars are standard error
0
5
10
15
20
25
E. camaldulensis
Aver
age
Pseu
do-S
peci
es R
ichn
ess
Burnt Unburnta)
0
5
10
15
20
25
E. populnea
Aver
age
Psed
uo-S
peci
es R
ichn
ess
Burnt Unburntb)

58
Chapter 4: DISCUSSION
4.1 Similarity of Burnt/Unburnt Plots Prior to Fire
Disturbance (as determined by the subjective disturbance scores) was relatively uniform across
both burnt and unburnt treatment types of both Eucalyptus camaldulensis and Eucalyptus
populnea woodlands. The broad structural similarity of each site clearly shows that all treatments
and woodlands were structurally similar. The uniformity of disturbance and dominant stand
structure across all sites shows that any potential confounding effects have been reduced and that
any main patterns can be attributed to fire, not experimental errors.
4.2 Vegetation Response
Structural components of the vegetation in both woodlands were not significantly different
across the treatments. Personal observations soon after the fire indicated that tree mortality, stag
mortality and fire scars had increased in burnt woodlands and therefore it was expected that a
significant difference may be found in tree and stag structure. In a study of riparian woodlands
in Kruger National Park, showed that two months after a low intensity fire in a riparian
landscape, 33% of riparian trees had been killed by the burn. Overall, when the data was
collected at St Ruth Reserve, trees were of a higher average frequency in unburnt plots over both
woodlands, with minimal variation in stag cover between burnt and unburnt treatment in either
woodland. No significant difference was found for either variable. The relatively small quadrat
sizes used in the field (500 m2), as well as the low number of replicates for each treatment type,
could be influencing the lack of difference between the treatment types found here. An increase
in the number of replicates, as well as an increase in the quadrat size could help capture any
differences in vegetation response between burnt and unburnt treatments in either woodland.
An increase in bare ground in burnt plots was expected, as Kutt and Woinarski (2007) had found
that bare ground increased significantly in burnt, grazed sites and burnt, ungrazed sites.

59
Schmalzer and Hinkle (1992) found that a prescribed burn in Palmetto scrub in Florida,
increased mean bare ground cover from a 0 to 23 percent. Bare ground cover at St Ruth Reserve
did not increase in burnt treatments as was observed in these other studies: there was no
significant difference between burnt and unburnt treatments in either woodland. This lack of
change could be due to St Ruth Reserve already being a highly disturbed system and therefore
the ecological processes occurring within the reserve, such as increased edge effect in the
remnant patch and fast lippia growth (Macdonald 2008), may have been influential on the cover
of bare ground when the study was taken.
Forb cover has been observed in many studies to increase post fire. Laughlin et al. (2004) found
that annual and biennial forb richness increased post fire with a significantly greater change rate
than unburnt old-growth ponderosa pine forest sites. In a study observing the impact of grazing
and fire on tropical savanna woodland vegetation, Kutt and Woinarski (2007) also found that
there was a significant difference in forb cover over the four treatment combinations of: no fire
and grazing; fire and grazing; no fire and ungrazed; and fire and ungrazed. Forb cover was most
extensive in burnt and grazed treatments (Kutt & Woinarski 2007).
In the present study an increase in forb cover at burnt sites was observed at both the coarse
500 m2 scale and the fine 70 cm2 scale. This change was significant in E. populnea woodlands on
a fine scale but not a coarse scale. The change was not significant on either scale in E.
camaldulensis woodlands even though the average frequency ranged from 12.6 to 48.4 on a fine
scale. It is important to note that lippia was not included in any forb count during this study and
therefore analyses of forb frequency and cover is of forbs excluding lippia. This result agrees
with the literature that shows that fire can change the ground cover abundance of forbs. The
difference between burnt and unburnt forb abundance may have been increased further if Nardoo
was included in the forb cover count rather than being included in the grass cover count. Nardoo,
a fern, was originally included in the grass count due to its rhizomal growing form, similar to
60
many grasses. However, on reflection it is now believed that this plant would have been better
classified as a forb given its possible similar ecological function to that growth form.
A recent study in grasslands at Yarralumla, Australia, showed that there was a significant decline
in native grass cover four months after more than 10% of the area was burnt (Ross & Macris
2012). White and Loftin (2000), whose study was conducted in the semiarid grasslands of New
Mexico, found that although grass cover did decline post fire, it was not a significant decrease. In
contrast, some studies show that there are no significant differences in grass cover between
unburnt and burnt vegetation of sagebrush rangeland and grasslands, regardless of time since fire
(Nelle et al. 2000; Drewa & Havstad 2001). The results of Nelle et al. (2000) and Drewa and
Havstad (2001) are consistent with the results found at St Ruth Reserve as there was no
significant difference in grass cover between burnt and unburnt treatments in either woodland.
The contradictory findings of these studies may be due to the different ecosystem types being
studied, seasonality of study or the type of data collection method being used.
The response of lippia to disturbance was documented in Macdonald (2008) where the soil was
mechanically disturbed to a depth of 10 cm and vegetation cover, including lippia, was removed.
Each season, one replicate at each site was mechanically disturbed. It was found that following
spring disturbances, lippia reached 50% cover within 85 days of disturbance. This was not
significantly different from the control plots (Macdonald 2008). Summer disturbance plots
returned to control levels after 216 days (Macdonald 2008). However, winter disturbed plots
remained significantly lower than control plots, indicating that lippia does not grow well in
cooler conditions (Macdonald 2008). The disturbance in the current study occurred in late spring,
so therefore the results could be correlated with the spring results of Macdonald (2008).
It was noted by Macdonald (2008) that the recovery of lippia cover in disturbed plots came from
the surviving tap-roots, buried plant fragments and vegetative expansion from outside the
disturbance areas. It is likely that these influences were present post fire and helped lead the

61
regeneration of lippia after the November 2013 fire. Lippia is known to reduce the fire risk of
invaded areas (Leigh & Walton 2004). This means that the prescribed fire may not have burnt
the entire landscape as hoped it would, owing to the lack of flammable ground cover species, and
therefore the burn may have resulted in patches of live lippia remaining in the landscape. The
potential for propagule survival would have ensured that enough vegetative material was left
behind for vegetative reproduction to commence as soon as the plant had recovered from the
effects of the fire. The added potential for lippia seed germination could also contribute to the
recovery of lippia cover post fire.
4.3 Seed Germination Response
Research from small fragmented Mallee habitat on Kangaroo Island that had not been burnt for
more than thirty years, found that germination both native and introduced shrubs, grasses, forbs
and non-grass graminoids, was not significantly different between unburnt and heat plus smoke
treated samples (Davies et al. 2013). Although different vegetation types, the broad site ecology,
highly fragmented remnant vegetation in an agricultural matrix, and previous use, grazing and
other land uses, at the Kangaroo Island study are similar to that of St Ruth Reserve and therefore
the findings are reflective of those found at St Ruth Reserve. A study by Auld and Denham
(2006) found that there was a significant difference between the seed bank before and after a fire.
However, the species studied in this study, Acacia suaveolens, Grevillea speciosa and Grevillea
buxiflora (Auld & Denham 2006) were very different to those studied in the current study and in
the Davies et al. (2013) study. These studies show that although there is some similarity
throughout the previous literature to the current study, there are also conflicting studies which
may indicate that seed response is dependent on the species’ requirements for germination.
The post fire species richness of a site is important for the future vegetative composition of the
ecosystem. A previous study found that there was no overall significant trend in species richness

62
as a function of fire regimes or site effects in heathland vegetation (Bradstock et al. 1997). This
result was supported by a study by Pettit and Naiman (2007), who also found no significant
difference in the species richness between burnt and unburnt quadrats in a semi-arid riparian
ecosystem in South Africa.
The current study partially followed this trend, with the pseudo-species richness of E. populnea
plots not significantly different between burnt and unburnt treatments. The initial difference
between burnt and unburnt treatment pseudo-species richness in E. camaldulensis samples was
found to be significant. However, this significance is likely due to an outlier of very low pseudo-
species richness in one replicate (BC5), which had a pseudo-species richness of five. High levels
of lippia (average of 95%; Appendix M) at this site may have prevented other plants from
emerging and setting seed within the area. Ironically, lippia was not one of the species that
emerged in this tray. When the outlier was removed from the dataset and the data was
reanalysed, the E. camaldulensis pseudo-species richness was not significantly different between
burnt and unburnt plots. This result then follows the current literature on species richness post
fire.
Overall, it does not appear that the prescribed burn had any significant effect on either the
germination or pseudo-species richness of the soil seed bank at St Ruth Reserve, consistent with
previous literature.
4.4 General Discussion
The results from this research show that there were no significant effects of the prescribed fire on
lippia cover, vegetation structural components and the soil seed bank in a vegetation remnant in
a highly modified agricultural landscape. The only exception to this conclusion is the significant
increase of forbs in burnt E. populnea woodlands which was anticipated from the prevailing

63
literature. In particular, this study shows that fire may not be a successful management tool to
control lippia abundance.
This study showed that the vegetative structure of both woodlands and treatments at St Ruth
Reserve were the same, even though it was anticipated that the tree and stag cover may have
declined in burnt areas. This result allows the first hypothesis to be accepted, that there was no
difference in vegetation structure post fire.
This study also shows that bare ground, grass or lippia cover were not significantly different in
burnt woodlands compared to unburnt woodlands. The result for bare ground was inconsistent
with previous literature. However, this could be attributed to the already highly disturbed state of
the vegetation at St Ruth Reserve and therefore a difference may not have been detected using
the preliminary study applied here. The literature is generally inconclusive as to whether fire
induces a significant change in grass cover, although the result observed here for lippia was
consistent with other lippia disturbance studies (e.g. Macdonald 2008).
The results of the ground cover study allow the second sub hypothesis, that there is no difference
in the abundance of other ground cover species between burnt and unburnt woodlands, six
months after a prescribed burn to be partially accepted in terms of grass cover. Forb cover at the
fine scale of 70cm2 was significantly different in E. populnea woodland but not in
E. camaldulensis woodland, even though there was a large range of cover. The significant result
was consistent with prevailing literature on forb growth post fire (Masocha et al. 2011).
However, further research is needed on the apparent differential response of components of the
ground cover and woodland differences in the Eucalyptus woodlands at St Ruth Reserve.
These results were reflected in the ex situ germination study. Germination trials showed that
burning did not have any significant impact on the species richness or germination of soil seed
banks, consistent with previous literature (Pettit & Naiman 2007; Davies et al. 2013). However,

64
this could be extended by taxonomically identifying the species that germinated and comparing
them to species found in the field at the same time post fire. The results of the germination trial
allow the third and fourth sub-hypotheses of that there is no significant difference in the seedling
emergence or species richness of seeds stored within the soil seed bank to be accepted.
The low germination of lippia seeds in the glasshouse trials was consistent with Macdonald
(2008), who found that the most successful germination method could only germinate
approximately 27% of seeds being tested. Adding to this hypothesis, approximately half the
seeds (from two sites) used by Macdonald (2008) were not viable. This shows that the quick
regeneration of lippia in summer, in the in situ study is most likely from vegetative fragments
and taproots left behind after the fire (as per MacDonald 2008) and allows the hypothesis: that
vegetative regeneration may be the preferred method of regeneration at St Ruth Reserve, to be
drawn. These results could have an impact on the management decisions to be made regarding
lippia’s control (see Section 4.4.2).
Although this study has provided expected results, there are some experimental limitations. The
study design could be improved by sampling both before and after the fire to achieve the greatest
comparison. A design that would help to improve the current design of the present study is that
of the MBACI design – multiple before, after, control, impact (Keough & Quinn 2000). The
MBACI design increases statistical rigour and power through the use of multiple, randomly
selected control and treatment locations (Miao et al. 2009). In turn, the ability to detect impacts
from the treatments are increased and the confounding effects are minimised (Miao et al. 2009).
However, the opportunistic nature of the present study meant that sampling prior to burning was
not possible. The comparatively simple spatial ‘snap-shot’ approach taken here is relatively
common in fire ecology studies (Gosper et al. 2011; Lewis et al. 2012) although it does limit the
generalisations that can be made (Williams et al. 1999). The nature of this study also meant that

65
there were many time constraints and therefore there are temporal limitations to the study (see
below).
4.4.1 Limitations and Future Directions
The independence of study plots in this study was limited due to each treatment (control and
burnt) being nested within one large treatment plot (St Ruth Reserve). Ideally, the study would
employ the MBACI design (see Section 4.4), multiple, independent sites where half the sites are
burnt and half are kept as controls. More study sites would increase the statistical power and
rigour of the study whilst enabling any differences between treatments to detected (Miao et al.
2009). Vegetative structure, ground cover and floristic surveys would be conducted at all sites
both before and after the fire. As the study was opportunistic, it was not possible to have a
control site, independent to the burnt site of St Ruth Reserve. Therefore, conclusions made from
this study are specifically for St Ruth Reserve and may limit generalisations (Woinarski et al.
2004). This improved experimental design would help to further identify whether fire is not a
successful control method for lippia and whether there are any changes in vegetation structure
and ground cover.
Time-since-fire has an important role in the change of vegetation structure. Morrison et al.
(1995) found that within the first year after a fire, early-colonising annuals comprised half the
vegetation in a Mediterranean-climate chaparral and scrub. Herbs, annuals and small shrubs have
been found to decrease in abundance with increasing-time-since fire, with vegetation moving
back toward the vegetation structure of an unburnt site (Morrison et al. 1995; Keeley et al.
2005). These results show that the time since fire does impact upon the vegetative community.
The ‘snapshot study’ here sampled only six months post fire and therefore may only be
indicative of early colonisers, not the full spectrum of present species or richness. This small
timeframe limits the conclusions able to be made about the full complement of species and
changes that may occur within a lippia invaded ecosystem. However, invasive species such as

66
lippia could potentially stop the natural vegetative progression of the site due to the aggressive
mat growth form and extensive root system of the invasive weed (Earl 2003). This study is a
good indicator of the changes that can occur six months after fire, especially as the results found
in this study were consistent with the previous literature.
The extension of the monitoring time frame would help researchers and managers to understand
the vegetative succession of the reserve post fire. Some studies have extended to a twenty-three
year period (Woinarski et al. 2004), with other studies re-examining sites twelve months (Pettit
& Naiman 2007) or thirty months post fire (Milberg & Lamont 1995). Follow up studies allow
the natural vegetation succession to be followed over a longer period of time, rather than the
snapshot provided in this study.
A successor project would be able to document the changes in lippia growth as well as
vegetation cover and ground cover in respect to time since fire at St Ruth Reserve. The impact of
other environmental factors such as drought and flood, which appear to influence lippia cover
(Macdonald 2008), could also be included in a longer time frame.
The short time frame of this study also limited the length of time that the glasshouse trials could
be run. In previous literature, seedling emergence has been monitored for 24 weeks (Gashaw et
al. 2002) and 30 weeks (Hill & French 2003). After the 24 weeks, Gashaw et al. (2002) removed
all germinants, disturbed the soil and then left the tray for another month for further germination
to occur. Even though germination did plateau in this study, the effect of the season, in particular
the strength of light over the autumn/winter period in which the study was run, may mean that
with changed conditions in spring/summer there may be a period of renewed germination in the
new season. Either 24 or 30 weeks would allow for multiple seasons to occur and for seeds with
varying germination conditions to emerge.

67
To encompass the wider effects of the fire, such as larger changes in ecosystem structure, for
example burnt and fallen stags, a larger quadrat size would be required to encompass all
potential changes post fire. This meant that in this research study, the broad scale vegetation
effects were not able to be determined and are therefore their response to fire is unknown. The
size quadrat used in this study (500 m2) was large enough to encompass coarse changes in this
small area. A common size used in fire studies is 1000 m2 (0.1 ha) (Keeley et al. 2005;
Ainsworth & Kauffman 2013). Larger quadrat sizes have been used including 2500 m2 (0.25 ha)
(Woinarski et al. 2004) and 3600 m2 (0.278ha) (White & Loftin 2000). To enable future studies
to assess as much vegetative structural and broad scale vegetation change post fire as possible, it
is recommended that a much larger study quadrat, such as those used by Woinarski et al. (2004)
and White and Loftin (2000), be used. However, the 500 m2 quadrat used in this study was
sufficient to measure all variables required.
A future study into the floristic composition of the ground cover would allow more subtle
differences between burnt and unburnt treatments to be explored. Floristics studies are often
included in fire ecology studies to determine the full extent and impact of the fire in the field
(e.g. Milberg & Lamont 1995; Bramston 2003)
Taxonomic identification could also be completed if the glasshouse trials were able to continue
beyond the 14 weeks of this study. The continuation of the trial would greatly assist in
determining whether many of the germinated species are in fact native or invasive. After
monitoring seedling emergence for 30 weeks, Hill and French (2003) allowed the trays to be left
in the glasshouse for another eight months to allow plants to flower. This allowed further
identification of the species to occur (Hill & French 2003). If the time was available, this type of
extended glasshouse trial would help to identify what species have emerged as well as whether
the germinants are native or invasive species. The continuation of the glasshouse trials would
then create a broader picture of the seed bank at St Ruth Reserve. The taxonomic identification

68
of the species would also create an opportunity to be able to compare this data to the published
literature more closely than has been possible in this study. This would allow the species
richness and composition of the field study to be compared to the species richness and
composition of the glasshouse trials.
The soil samples used in the germination trials were collected six months after the prescribed
burn, which meant that some species may have had an opportunity to recolonise the seed bank
before the soil was sampled. In a future study it would be beneficial to sample the seed bank
immediately after the fire and then each season after the fire (Gashaw et al. 2002), to determine
if there is a difference in post fire response in relation to time since fire. Given time constraints
for this study and that the vegetation field study was taken at the same time as the soil for the
glasshouse trial, it can be seen that the seed bank is a reflection of the current state of the above
ground vegetation at St Ruth Reserve.
4.4.2 Management Implications
Prescribed fires may not always enhance the native species of the area. Penman and Towerton
(2008) reported that in an autumn fire, only two plots out of forty, reached between 80oC and
100oC, which is considered to be the necessary trigger for germination in many Australian fire-
adapted plants. It has been found that the mean number of species in a study in a Cumberland
Plain Woodland near Sydney, is significantly different in treatments that have been exposed to
80oC heat compared to unheated samples with litter left on top of the seed trays (Hill & French
2003). Grasses, graminoids, herbs and shrubs all germinated in the Hill and French (2003) study.
These findings may provide an insight into the future native species succession or lack thereof, at
St Ruth Reserve. If managers were to continue to burn the reserve, the potential lack of native

69
germinants due to the low temperature of the fire, may increase the number of invasive species in
the area, in particular species that can successfully reproduce vegetatively, such as lippia.
The results for lippia cover at St Ruth Reserve indicate that the use of fire has not been
successful in controlling lippia. The fast growth rate from vegetative reproduction and previous
literature also showing fast vegetative regrowth after disturbance (Macdonald 2008) helps to
support the hypothesis that disturbance such as fire, may not be effective in the management of
this invasive species. Therefore, it is not recommended that the Western Downs Regional
Council continue to pursue the burning of St Ruth Reserve, with the sole purpose of controlling
lippia. The broader ecological impacts that may not have been enumerated in this study,
including the decline of trees and stags post fire (Pettit & Naiman 2007), also need to be
considered if burning is contemplated again.
4.5 Conclusion
This research has shown that there are no significant effects of a prescribed fire on lippia,
vegetation structural components (except for a significant increase of forbs in burnt Eucalyptus
populnea woodlands) or the soil seed bank at St Ruth Reserve. There have been no studies to
date that have documented the change in lippia cover and abundance post fire in Australia. These
results are consistent with previous studies that have examined the effects of fire on vegetation
cover. This study also shows that fire does not have any significant impact on the seedling
emergence or pseudo-species richness of the soil seed bank, six months after a prescribed burn.
These conclusions are significant in that they show that fire is not an effective control method for
lippia and therefore it is not recommended to be used as a management tool within the St Ruth
Reserve in the future until other possible detrimental ecosystem effects are researched. Further
research needs to be conducted to expand this experiment both temporally and spatially so that

70
recommendations and conclusions can be expanded to the wider distribution of lippia and
vegetative remnants.

71
Chapter 5: REFERENCES
Ainsworth, A & Kauffman, JB 2013, 'Effects of repeated fires on native plant community
development at Hawaii Volcanoes National Park', International Journal of Wildland
Fire, vol. 22, no. 8, pp. 1044-54.
Atwell, BJ, Kriedemann, PE & Turnbull, CGN (eds) 1999, Plants in Action: Adaptation in
Nature, Performance in Cultivation, MacMillian Education Australia Pty Ltd, South
Yarra, Victoria.
Auld, TD & Denham, AJ 2006, 'How much seed remains in the soil after a fire?', Plant Ecology,
vol. 187, pp. 15-24.
Batterham, M. 2008, 'The resilience of Eucalyptus populnea woodlands', Unpublished BSc.
(Hons) thesis, University of Southern Queensland, Toowoomba.
Bendix, J 1997, 'Flood disturbance and the distribution of riparian species diversity ',
Geographical Review, vol. 87, no. 4, pp. 468-83.
Bond, WJ & Keeley, JE 2005, 'Fire as a global ‘herbivore’: the ecology and evolution of
flammable ecosystems', Trends in Ecology & Evolution, vol. 20, no. 7, pp. 384-94.
Border Rivers-Gwydir Catchment Management Authority 2008, Border Rivers-Gwydir CMA,
New South Wales State Government,
<http://brg.cma.nsw.gov.au/index.php?page=fire>.
Bradstock, RA, Tozer, MG & Keith, DA 1997, 'Effects of high frequency fire on floristic
composition and abundance in a fire-prone heathland near Sydney', Australian Journal
of Botany, vol. 45, no. 4, pp. 641-55.
Bramston, G. 2003, 'Fire Ecology of Bluegrass Grasslands and the Endangered Perennial Herb
Stemmacantha australis (Asteraceae), Unpublished BSc. (Hons) thesis, University of
Southern Queensland, Toowoomba.

72
Brockway, DG, Gatewood, RG & Paris, RB 2002, 'Restoring fire as an ecological process in
shortgrass prairie ecosystems: initial effects of prescribed burning during the dormant
and growing seasons', Journal of Environmental Management, vol. 65, no. 2, pp. 135-
52.
Brooks, ML, D'Antonio, CM, Richardson, DM, Grace, JB, Keeley, JE, Ditomaso, JM, Hobbs,
RJ, Pellant, M & Pyke, D 2004, 'Effects of invasive alien plants on fire regimes',
BioScience, vol. 54, no. 7, pp. 677-88.
Brothers, TS & Spingarn, A 1992, 'Forest fragmentation and alien plant invasion of Central
Indiana old-growth forests', Conservation Biology, vol. 6, no. 1, pp. 91-100.
Bureau of Meterology 2014, Climate Statistics for Australian Locations, Commonwealth of
Australia, Canberra.
COAG Standing Council on Environment and Water 2012, Australia's Native Vegetation
Framework, Australian Government: Department of Sustainability, Environment,
Water, Population and Communities, Canberra, Australian Capital Territory.
Cochrane, MA 2003, 'Fire science for rainforests', Nature, vol. 421, no. 6926, pp. 913-9.
Connell, JH 1978, 'Diversity in tropical rain forests and coral reefs', Science, vol. 199, no. 4335,
pp. 1302-10.
Crawford, P 2008, Lippia Managment Phyla canescens: Challenges, Opportunities and
Strategies, Greenridge Press, Toowoomba, Queensland.
CSIRO 2007, Researching management and control options for lippia, CSIRO, viewed
31/03/2014, <http://www.csiro.au/en/Outcomes/Food-and-
Agriculture/LippiaBiocontrol.aspx>.

73
D'Antonio, CM & Vitousek, PM 1992, 'Biological invasions by exotic grasses, the grass/fire
cycle, and global change', Annual Review of Ecology and Systematics, vol. 23, no. 1, pp.
63-87.
D'Antonio, CM, Hughes, RF & Tunison, JT 2010, 'Long-term impacts of invasive grasses and
subsequent fire in seasonally dry Hawaiian woodlands', Ecological Applications, vol.
21, no. 5, pp. 1617-28, viewed 2014/04/08.
D'Antonio, CM 2000, 'Fire, Plant Invasions, and Global Changes', in HA Mooney & RJ Hobbs
(eds), Invasive Species in a Changing World, Island Press, Washington, ch 4, pp. 65-91.
Davies, RJP, Whalen, MA, Mackay, DA, Taylor, D & Pisanu, P 2013, 'Does soil seed bank
diversity limit post-fire regeneration in small, fragmented, long-unburnt remnants of fire
adapted vegetation?', Biological Conservation, vol. 158, pp. 287-95.
Dawson, J & Lucas, R 2005, The Nature of Plants: Habitats, Challenges and Adaptations,
Timber Press Inc., Portland, Oregon.
Dellow, J, Motley, K, Storrie, A & Spenceley, J 2010, Lippia (Phyla canescens), NSW
Department of Primary Industries, viewed 31/03/2014,
<http://www.dpi.nsw.gov.au/agriculture/pests-weeds/weeds/profiles/lippia>.
Drewa, PB & Havstad, KM 2001, 'Effects of fire, grazing, and the presence of shrubs on
Chihuahuan desert grasslands', Journal of Arid Environments, vol. 48, no. 4, pp. 429-43.
Earl, J 2003, The Distribution and Impacts of Lippia (Phyla canescens) in the Murray Darling
System, Murray Darling Lippia Working Group, Guyra, New South Wales.
Elderd, BD 2003, 'The impact of changing flow regimes on riparian vegetation and the riparian
species Mimulus guttatus', Ecological Applications, vol. 13, no. 6, pp. 1610-25.

74
Elderd, BD & Doak, DF 2006, 'Comparing the direct and community-mediated effects of
disturbance on plant population dynamics: flooding, herbivory and Mimulus guttatus',
Journal of Ecology, vol. 94, no. 3, pp. 656-69.
Fensham, R & Fairfax, R 1996, 'The disappearing grassy balds of the Bunya Mountains, south-
eastern Queensland', Australian Journal of Botany, vol. 44, no. 5, pp. 543-58.
Fensham, R 1997, 'Options for conserving large vegetation vegetation remnants in the Darling
Downs, south Queensland', in P Hale & L D (eds), Conservation Outside Nature
Reserves, University of Queensland, Brisbane, Queensland.
Fensham, RJ 1998, 'The grassy vegetation of the Darling Downs, south-eastern Queensland,
Australia. Floristics and grazing effects', Biological Conservation, vol. 84, no. 3, pp.
301-10.
Fisher, JL, Loneragan, WA, Dixon, K, Delaney, J & Veneklass, EJ 2009, 'Altered vegetation
structure and composition linked to fire frequency and plant invasion in a biodiverse
woodland', Biological Conservation, vol. 14, pp. 2270-81.
Gashaw, M, Michelsen, A, Jensen, M & Friis, I 2002, 'Soil seed bank dynamics of fire-prone
wooded grassland, woodland and dry forest ecosystems in Ethiopia', Nordic Journal of
Botany, vol. 22, no. 1, pp. 5-17.
Gill, AM 1975, 'Fire and the Australian flora: a review', Australian forestry, vol. 38, pp. 4-25.
Gosper, CR, Yates, CJ, Prober, SM & Williams, MR 2011, 'Fire does not facilitate invasion by
alien annual grasses in an infertile Australian agricultural landscape', Biological
Invasions, vol. 13, no. 3, pp. 533-44.
Grey, A 2005, Case Study: Lippia - Natural Regeneration, Queensland Murray Darling
Committee, Queensland Murray Darling Committee, Toowoomba, Queensland.

75
Gross, CL, Gorrell, L, Macdonald, MJ & Fatemi, M 2010, 'Honeybees facilitate the invasion of
Phyla canescens (Verbenaceae) in Australia – no bees, no seed!', Weed Research, vol.
50, no. 4, pp. 364-72.
Hester, AJ & Hobbs, RJ 1992, 'Influence of fire and soil nutrients on native and non-native
annuals at remnant vegetation edges in the Western Australian wheatbelt', Journal of
Vegetation Science, vol. 3, pp. 101-8.
Hill, SJ & French, K 2003, 'Response of soil seed-bank of Cumberland Plain Woodland to
heating', Austral Ecology, vol. 28, pp. 14-22.
Hobbs, RJ 1991, 'Disturbance of a precursor to weed invasion in native vegetation', Plant
Protection Quarterly, vol. 6, no. 3, pp. 99-104.
Hobbs, RJ & Huenneke, LF 1992, 'Disturbance, Diversity and Invasion: Implications for
Conservation', Conservation Biology, vol. 6, no. 3, pp. 324-37.
Hobbs, RJ 2001, 'Synergisms among habitat fragmentation, livestock grazing, and biotic
invasions in southwestern Australia', Conservation Biology, vol. 15, no. 6, pp. 1522-8.
Hobbs, RJ & Mooney, HA 2005, 'Invasive Species in a Changing World: The Interactions
between Global Change and Invasives', in HA Mooney, et al. (eds), Invasive Species: A
New Synthesis, Island Press, Washington, ch 12, pp. 310-31.
Hughes, F, Vitousek, PM & Tunison, JT 1991, 'Alien grass invasion and fire in the seasonal
submontane zone of Hawaii', Ecology, vol. 72, no. 2, pp. 743-7.
Julien, MH, McFadyen, R & Cullen, J (eds) 2012a, Biological Control of Weeds in Australia,
CSIRO, Melbourne, Australia.
Julien, MH, Storrie, A & McCosker, R 2004, 'Lippia, Phyla canescens, an increasing threat to
agriculture and the environment', in 14th Australian Weeds Conference proceedings of

76
the 14th Australian Weeds Conference BM Sindel & SB Johnson (eds.), Weed Society
of New South Wales, Wagga Wagga, New South Wales.
Julien, MH, Xu, CY, Bourne, A, Gellender, M & De Clerck-Floate, R 2012b, 'Determining the
growth responses of Phyla canescens to shoot and root damage as a platform to better-
informed weed-management decisions', Australian Journal of Botany, vol. 60, no. 4, p.
310.
Keeley, JE, Fotheringham, CJ & Baer-Keeley, M 2005, 'Factors affecting plant diversity during
post-fire recovery and succession of mediterranean-climate shrublands in California,
USA', Diversity & Distributions, vol. 11, pp. 525-37.
Keeley, JE, Pausas, JG, Rundel, PW, Bond, WJ & Bradstock, RA 2011, 'Fire as an evolutionary
pressure shaping plant traits', Trends in Plant Science, vol. 16, no. 8, pp. 406-11.
Keeley, JE & Brennan, TJ 2012, 'Fire-driven alien invasion in a fire-adapted ecosystem',
Oecologia, vol. 169, no. 4, pp. 1043-52.
Keough, MJ & Quinn, GP 2000, 'Legislative vs. practical protection of an intertidal shoreline in
southeastern Australia', Ecological Applications, vol. 10, no. 3, pp. 871-81.
Kutt, AS & Woinarski, JCZ 2007, 'The effects of grazing and fire on vegetation and the
vertebrate assemblage in a tropical savanna woodland in north-eastern Australia',
Journal of Tropical Ecology, vol. 23, no. 01, pp. 95-106, viewed 2007.
Laughlin, DC, Bakker, JD, Stoddard, MT, Daniels, ML, Springer, JD, Gildar, CN, Green, AM &
Covington, WW 2004, 'Toward reference conditions: wildfire effects on flora in an old-
growth ponderosa pine forest', Forest Ecology and Management, vol. 199, no. 1, pp.
137-52.

77
Laurance, WF, Delamonica, P, Laurance, SG, Vasconcelos, HL & Lovejoy, TE 2000, 'Rainforest
fragmentation kills big trees', Nature, vol. 404, no. 6780, p. 836.
Laurance, WF, Camargo, JLC, Luizão, RCC, Laurance, SG, Pimm, SL, Bruna, EM, Stouffer,
PC, Williamson, GB, Benítez-Malvido, J, Vasconcelos, HL, Van Houtan, KS, Zartman,
CE, Boyle, SA, Didham, RK, Andrade, A & Lovejoy, TE 2011, 'The fate of Amazonian
forest fragments: A 32-year investigation', Biological Conservation, vol. 144, no. 1, pp.
56-67.
Lawrence, L & van Klinken, RD 2008, 'An international effort on biological control of lippia in
Australia', Outlooks on Pest Management, vol. 19, no. 5, pp. 236-8.
Leach, MK & Givnish, TJ 1996, 'Ecological determinants of species loss in remnant Prairies',
Science, vol. 273, no. 5281, pp. 1555-8.
Leigh, C & Walton, CS 2004, Lippia (Phyla canescens) in Queensland: Pest Status Review
Series - Land Protection, Queensland Government: Department of Natural Resources
and Mines, Brisbane, Queensland.
Lewis, T, Reif, M, Prendergast, E & Tran, C 2012, 'The effect of long-term repeated burning and
fire exclusion on above- and below-ground Blackbutt (Eucalyptus pilularis) forest
vegetation assemblages', Austral Ecology, vol. 37, no. 7, pp. 767-78.
Lim, T-S & Loh, W-Y 1996, 'A comparison of tests of equality of variances', Computational
Statistics & Data Analysis, vol. 22, no. 3, pp. 287-301.
Lindenmayer, D & Burgman, M 2005, Practical Conservation Biology, CSIRO Publishing,
Collingwood, VIC.
MacArthur, RH & Wilson, EO 1967, The Theory of Island Biogeography, Princeton University
Press, Princeton, New Jersey.

78
Macdonald, MJ 2008, 'Ecology of Phyla canescens (Verbenaceae) in Australia ', PhD thesis,
University of New England, Armidale, Armidale, New South Wales.
Macdonald, MJ, Whalley, WRDB, Julien, MH, Sindel, BM & Duggin, JA 2012, 'Flood-induced
recruitment of the invasive perennial herb Phyla canescens (lippia)', The Rangeland
Journal, vol. 34, no. 3, pp. 269-76.
Mack, MC & D'Antonio, CM 1998, 'Impacts of biological invasions on disturbance regimes',
Trends in Ecology & Evolution, vol. 13, no. 5, pp. 195-8.
Masocha, M, Skidmore, AK, Poshiwa, X & Prins, HHT 2011, 'Frequent burning promotes
inavsions of alien plants into a mesic African savanna', Biological Invasions, vol. 13,
no. 7, pp. 1641-8.
Mawhinney, WA 2003, 'Restoring biodiversity in the Gwydir Wetlands through environmental
flows', Water Science and Technology, vol. 48, pp. 73-81.
Miao, S, Carstenn, S & Nungesser, M (eds) 2009, Real World Ecology: Large-scale and Long-
term Case Studies and Methods, Springer-Verlag New York Inc., New York.
Milberg, P & Lamont, BB 1995, 'Fire enhances weed invasion of roadside vegetation in
southwestern Australia', Biological Conservation, vol. 73, pp. 45-9.
Mooney, HA 2005, 'Invasive Alien Species: The Nature of the Problem', in HA Mooney, et al.
(eds), Invasive Alien Species: A New Synthesis, Island Press, Washington, ch 1, pp. 1-
11.
Morrison, DA, Cary, GJ, Pengelly, SM, Ross, DG, Mullins, BJ, Thomas, CR & Anderson, TS
1995, 'Effects of fire frequency on plant species composition of sandstone communities
in the Sydney region: Inter-fire interval and time-since-fire', Australian Journal of
Ecology, vol. 20, no. 2, pp. 239-47.

79
Nelle, PJ, Reese, KP & Connelly, JW 2000, 'Long-term effects of fire on sage grouse habitat',
Journal of Range Management, vol. 53, pp. 586-91.
Pausas, JG & Schwilk, D 2012, 'Fire and plant evolution', New Phytologist, vol. 193, no. 2, pp.
301-3.
Penman, TD & Towerton, AL 2008, 'Soil temperatures during autumn prescribed burning:
implications for the germination of fire responsive species?', International Journal of
Wildland Fire, vol. 17, no. 5, pp. 572-8.
Penman, TD, Binns, DL, Brassil, TE, Shiels, RJ & Allen, RM 2009, 'Long-term changes in
understorey vegetation in the absence of wildfire in south-east dry sclerophyll forests',
Australian Journal of Botany, vol. 57, no. 7, pp. 533-40.
Pettit, NE & Naiman, RJ 2007, 'Postfire response of flood-regenerating riparian vegetation in a
semi-arid landscape ', Ecology, vol. 88, no. 8, pp. 2094-104.
Pianka, ER 1970, 'On r- and K- selection', The American Naturalist, vol. 104, no. 940, pp. 592-7.
Pierson, FB, Williams, CJ, Hardegree, SP, Weltz, MA, Stone, JJ & Clark, PE 2011, 'Fire, plant
invasions, and erosion events on Western Rangelands', Rangeland Ecology and
Management, vol. 64, no. 5, pp. 439-49.
Pink, B 2013, Year Book Australia, 2009-10, Australian Bureau of Statistics Canberra, Australia.
Price, JN, Gross, CL & Whalley, RDB 2010, 'Prolonged summer flooding switched dominance
from the invasive weed lippia (Phyla canescens) to native species in one small,
ephemeral wetland', Ecological Management & Restoration, vol. 11, no. 1, pp. 61-3.
Price, JN, Whalley, RDB, van Klinken, RD, Duggin, JA & Gross, CL 2011a, 'Periodic rest from
grazing provided no control of an invasive perennial forb', The Rangeland Journal, vol.
33, no. 3, pp. 287-98.

80
Price, JN, Macdonald, MJ, Gross, CL, Whalley, RDB & Simpson, IH 2011b, 'Vegetative
reproduction facilitates early expansion of Phyla canescens in a semi-arid floodplain',
Biological Invasions, vol. 13, no. 2, pp. 285-9.
QMDC 2005, Case Study: lippia, Queensland Murray Darling Committee (QMDC),
Toowoomba, QLD.
Queensland Government: Department of Environment and Heritage Protection 2014, Regional
ecosystem details for 12.8.15, Queensland State Government, viewed 28/04/2014,
<http://www.ehp.qld.gov.au/ecosystems/biodiversity/regional-
ecosystems/details.php?reid=12.8.15>.
Queensland Government: Department of National Parks Recreation Sport and Racing 2012,
Bunya Mountains National Park Management Statement 2012, Queensland State
Government: Department of National Parks Recreation Sport and Racing, Brisbane,
Queensland.
Reardon-Smith, KM 2011, 'Disturbance and resilience in riparian woodlands on the highly
modified Upper Condamine floodplain', Unpublished PhD thesis thesis, University of
Southern Queensland, Toowoomba.
Ross, C & Macris, A 2012, 'Monitoring the effects of fire on the Button Wrinklewort (Rutidosis
leptorrhynchoides)', Australasian Plant Conservation, vol. 20, no. 4, pp. 13-5.
Sakai, AK, Allendorf, FW, Holt, JS, Lodge, DM, Molofsky, J, With, KA, Baughman, S, Cabin,
RJ, Cohen, JE, Ellstrand, NC, McCauley, DE, O'Neil, P, Parker, IM, Thompson, JN &
Weller, SG 2001, 'The population biology of invasive species', Annual Review of
Ecology and Systematics, vol. 32, pp. 305-32.

81
Sattler, P & Williams, R 1999, The Conservation Status of Queensland's Bioregional
Ecosystems, State of Queensland Environment Protection Agency, Brisbane.
Schmalzer, PA & Hinkle, CR 1992, 'Recovery of oak-saw Palmetto scrub after fire', Castanea,
vol. 57, no. 3, pp. 158-73.
Sedgewick, P 2010, 'Independent samples t test', British Medical Journal, vol. 340.
Sosa, AJ, Traversa, MG, Delhey, R, Kiehr, M, Cardo, MV & Julien, M 2008, 'Biological control
of lippia (Phyla canescens): surveys for the plant and its natural enemies in Argentina',
in 12th International Symposium on Biological Control of Weeds: proceedings of the
12th International Symposium on Biological Control of Weeds, M Julien, et al. (eds.),
Commonwealth Agricultural Bureaux International, La Grande Motte, France, pp. 211-
5.
State Government of Victoria 2011, Impact Assessment - Lippia (Phyla canescens), Deparment
of Environment and Primary Industries, State Goverment of Victoria, Melbourne,
Victoria, <http://vro.depi.vic.gov.au/dpi/vro/vrosite.nsf/pages/impact_lippia>.
Taylor, B & Ganf, GG 2005, 'Comparative ecology of two co-occurring floodplain plants: the
native Sporobolus mitchellii and the exotic Phyla canescens', Marine and Freshwater
Research, vol. 56, pp. 431-40.
Trestrail, CM, P., Corrie, K & Franks, I 2013, Agriculture and Forestry in the Darling Downs-
Maranoa region of Queensland 2013, Australian Bureau of Agricultrual and Resource
Economics and Sciences, Australian Government: Department of Agriculture, Fisheries
and Forestry, Canberra
van Klinken, RD & Lawrence, L 2008, 'Search narrows for lippia biocontrol', Farming Ahead,
vol. 201.

82
van Klinken, RD & Julien, M 2010, Biological Control of Lippia, Rural Industries Research and
Development Coporation, Canberra.
Whelan, RJ 1995, The Ecology of Fire, Press Syndicate of the University of Cambridge,
Cambridge, UK.
White, CS & Loftin, SR 2000, 'Response of 2 semiarid grasslands to cool-season prescribed fire',
Journal of Range Management, vol. 52, pp. 52-61.
Williams, RJ, Cook, GD, Gill, AM & Moore, PHR 1999, 'Fire regime, fire intensity and tree
survival in a tropical savanna in northern Australia', Australian Journal of Ecology, vol.
24, no. 1, pp. 50-9.
Woinarski, JCZ, Risler, J & Kean, L 2004, 'Response of vegetation and vertebrate fauna to
23 years of fire exclusion in a tropical Eucalyptus open forest, Northern Territory,
Australia', Austral Ecology, vol. 29, no. 2, pp. 156-76.
Xu, CY, Julien, MH, Fatemi, M, Girod, C, Van Klinken, RD, Gross, CL & Novak, SJ 2010,
'Phenotypic divergence during the invasion of Phyla canescens in Australia and France:
evidence for selection-driven evolution', Ecology Letters, vol. 13, no. 1, pp. 32-44.
Xu, CY, Schooler, SS & Van Klinken, RD 2012, 'Differential influence of clonal integration on
morphological and growth responses to light in two invasive herbs', PLoS One, vol. 7,
no. 4.

Appendices

Appendix A: GPS data points for sites
South East
BC1 Burnt E. camaldulensis rep 1 27o20'0.3722" 151o14'38.037" BC2 Burnt E. camaldulensis rep 2 27o20'0.140" 151o14'43.766" BC3 Burnt E. camaldulensis rep 3 27o20'8.91" 151o14'46.6" BC4 Burnt E. camaldulensis rep 4 27o19'58.577" 151o14'34.784" BC5 Burnt E. camaldulensis rep 5 27o19'49.711" 151o14'45.254" UC1 Unburnt E. camaldulensis rep 1 27o19'45.522" 151o14'47.527" UC2 Unburnt E. camaldulensis rep 2 27o19'42.642" 151o14'11.198" UC3 Unburnt E. camaldulensis rep 3 27o19'51.845" 151O14'13.55" UC4 Unburnt E. camaldulensis rep 4 27o19'59.232" 151o14'17.177" UC5 Unburnt E. camaldulensis rep 5 27o20'3.230" 151o14'20.346" BP1 Burnt E. populnea rep 1 27o20'8.5" 151o14'50.83" BP2 Burnt E. populnea rep 2 27o20'6.621" 151o14'54.819" BP3 Burnt E. populnea rep 3 N/A N/A BP4 Burnt E. populnea rep 4 27o19'52.867" 151o14'59.619" BP5 Burnt E. populnea rep 5 27o19'46.995" 151o14'59.08" UP1 Unburnt E. populnea rep 1 27o19'43.94" 151o14'49.089" UP2 Unburnt E. populnea rep 2 27o19'47.255" 151o14'38.830" UP3 Unburnt E. populnea rep 3 27o19'44.471" 151o14'33.142" UP4 Unburnt E. populnea rep 4 27o19'46.039" 151o14'28.957" UP5 Unburnt E. populnea rep 5 27o19'37.853" 151o14'23.142"
Appendix B: Toothpick colours for week of emergence
Toothpick Colour Week No Colour 1&2 Purple 3 Purple & Red 4 Watermelon 5 Red 6 Fluoro Orange 7 Devine 8 Green 9 Nude 10 Gold 11 Gold & Purple 12 Red & Green 13 No Toothpick 14

Appendix C: Pseudo-species list
Pseudo-species name Stumpy Bright Green Weed Chive Thing Big Segmented Fern Lippia Eucalypt Frilly Weed Segmented Leaf Upright Woolley Milk Weed Look-a-Like Red/Green Tree Fuzzy Thin Leaf Little Bright Green Carrot Top Weird Succulent Woolley Tree Milk Weed Thick Stem Dark Green Weed 4 o'clock Small Clover Daisy Large Clover Lime Green Weed Singled Leaf Thick Dark Green Carrot Top Dew Rooty Tall Sword Plant Thorny Weed Unidentified Dicot 4 o'clock Woolley Weed Purple Backed Thistle Sage Purple Carrot Top Wahlenbergia Small Clover Smells Like Rosemary Rose Weed Thick Carrot Top Thin Woolley Upright Woolley with Flower Fluffy with Weird Flower Red/Green Succulent Grasses Tall Skinny Leaf Upright Woolley with Flower Thick Woolley Segmented Leaf Purple Single Leaf Thin Woolley with Flowers Purple Backed Thistle Woolley (dead) Smells Like Rosemary Furry Small Tree Thorned Strawberry Heavily Segmented Fern Glossy Green Weed Cabbage Weed Maple Carrot Rambling Oak Chive Thing Upright Woolley Rose Weed Little Bright Green Dark Green Fuzzy (with Flowers)
Fluffy Carrot Top with Weird Flower
Appendix D: Raw data from disturbance scores
Site Grazing Clearing Logging Erosion Weeds Feral Animals
Soil Compaction
Evidence of
Dieback BC1 2 2 2 0 3 0 0 2 BC2 1 1 2 0 2 0 0 2 BC3 2 1 3 0 2 0 0 3 BC4 2 1 1 0 2 0 0 2 BC5 1 1 1 0 3 0 0 1 UC1 2 2 3 0 3 0 0 1 UC2 1 1 3 0 3 0 0 3 UC3 1 2 1 0 2 0 0 3 UC4 1 2 1 0 4 1 0 2 UC5 2 1 2 0 3 0 0 1 BP1 1 3 2 0 2 0 0 3

BP2 1 1 2 0 3 0 0 3 BP3 0 2 2 0 3 1 0 2 BP4 1 2 3 0 2 0 0 2 BP5 1 2 2 0 3 0 0 2 UP1 2 2 3 0 1 0 0 1 UP2 2 3 3 0 3 1 0 2 UP3 2 2 2 0 2 0 0 1 UP4 1 1 2 0 1 0 0 1 UP5 1 1 0 0 2 0 0 1

Appendix E: Raw data from 500 m2 quadrat - Raw Data
Tree
s >2
0m
Tree
s 10
-20
m
Tree
s <1
0m
Tota
l Tre
es
Tree
Cov
er
Stan
ding
St
ag >
20m
Stan
ding
St
ag 1
0-20
m
Stan
ding
St
ag <
10m
Tota
l Sta
gs
Stum
ps
Stag
Cov
er
Stum
p C
over
Logs
: T-2
F1
Logs
: 2F-
2H1
Logs
: 2H
-1A
1
Logs
: 1A
-2A
1
Tota
l Log
s
Log
Cov
er
Gra
sses
/ Se
dges
Her
bs/F
orbs
Lipp
ia
Fine
Litt
er
Lipp
ia L
itter
Bar
e gr
ound
Units Density (no. per 500 m2) % Density (no. per 500 m2) % % Density (no. per 500 m2) % % % % % % %
BC1 0 1 8 9 4 1 0 1 2 0 0.5 0 20 21 19 4 64 2 10 1 85 1.5 0 0.5 BC2 0 0 0 0 0 0 1 2 3 2 0.5 0.5 23 18 8 0 49 0.5 55 35 4 0.1 0 1 BC3 0 1 0 1 1 0 0 0 0 0 0 0 5 5 2 1 13 1 90 2 4 1 0 0.5 BC4 1 0 5 6 2 0 0 0 0 1 0 0.5 17 2 3 1 23 0.5 75 2 3 0.5 0 0.5 BC5 0 3 8 11 7 0 0 0 0 2 0 0.5 89 24 5 1 119 1 5 0.5 85 1 0 0.5 UC1 0 1 0 1 1 1 0 0 1 3 0.5 0.1 2 5 12 3 22 1 30 1 85 0.5 1 0 UC2 1 2 0 3 2 0 0 0 0 3 0 0.5 5 2 4 4 15 0.5 50 3 25 0.5 0 0.1 UC3 0 0 4 4 1 0 0 0 0 2 0 0.5 2 1 1 1 5 0.5 85 2 4 1 0 0.5 UC4 0 1 20 21 6 0 0 1 1 0 0.5 0 4 14 2 3 23 1 55 2 60 0.5 0 0 UC5 0 1 15 16 2 0 0 0 0 0 0 0 24 6 3 2 35 0.5 75 15 20 0.5 0 0 BP1 1 0 0 1 2 0 0 1 1 0 0.5 0 12 6 0 4 22 3 60 10 25 0.5 0 1 BP2 1 0 0 1 1 0 0 1 1 1 0.5 0.1 4 1 0 1 6 1 85 2 10 1 0 2 BP3 1 2 0 3 10 0 0 0 0 0 0 0 19 13 1 2 35 3 85 1 30 3 0 5 BP4 2 0 0 2 2 0 0 0 0 0 0 0 34 6 4 2 46 0.9 50 5 30 0.1 0 0.1 BP5 0 1 3 4 3 0 0 0 0 2 0 0.5 42 23 2 1 68 1 20 25 50 0.5 0 0.5 UP1 0 1 0 1 2 0 0 0 0 0 0 0 12 6 0 0 18 0.5 60 7 60 0.5 0.5 0.1 UP2 1 0 1 2 3.1 0 0 0 0 1 0 0.1 10 16 4 2 32 1 30 0.5 70 1 0.1 1 UP3 0 2 11 13 4 0 0 0 0 0 0 0 159 20 7 1 187 2 30 0.5 15 1 0.1 0.5 UP4 0 1 3 4 2.5 0 0 1 1 2 0.1 0.1 19 13 16 8 56 2 90 0.5 0.5 1 0 0 UP5 0 1 8 9 9 0 0 2 2 0 0.5 0 25 13 6 3 47 1 30 0.1 40 3 1 0.5
1These measurements have now been converted to the following: T–2F = 6 –13 cm; 2F–2H = 13–35 cm; 2H – 1A = 35–90 cm 1A– 2A = 90 – 150cm
Appendix F: Statistics from 500m2 density data

Levene’s test for equality of
variances T-test for Equality of Means
F Sig. t df Sig.
(2-tailed) Mean
Difference Std. Error Difference
95% Confidence Interval of the
Difference
Lower Upper
Tree –
E. camaldulensis Equal variances assumed .105 .754 .659 8 .528 .18992 .28815 -.47456 .85441
Trees –
E. populnea Equal variances assumed 2.846 .130 1.410 8 .196 .24861 .17631 -.15796 .65517
Stags –
E. camaldulensis Equal variances not assumed 10.036 .013 -.625 6.229 .554 -.09542 .15263 -.46560 .27475
Stags –
E. populnea Equal variances assumed 1.317 .284 .285 8 .783 .03522 .12367 -.24997 .32041
Stumps –
E. camaldulensis Equal variances assumed 1.703 .228 .485 8 .641 .08519 .17579 -.32018 .49057
Stumps –
E. populnea Equal variances assumed .000 1.000 .000 8 1.000 .00000 .14041 -.32379 .32379
Logs –
E. camaldulensis Equal variances assumed .477 .509 -1.747 8 .119 -.36738 .21025 -.85222 .11746
Logs –
E. populnea Equal variances assumed .044 .839 1.039 8 .329 .24689 .23758 -.30097 .79476
Appendix G: Statistics for 500m2 cover data
Levene’s Test for Equality of Variances T-test for Equality of Means

F Sig. t df Sig. (2-tailed)
Mean Difference
Std. Error Difference
95% Confidence Interval of the Difference
Lower Upper
Trees – E. camaldulensis Equal variances assumed .267 .619 1.096 8 .305 .01722 .01571 -.01900 .05344
Trees – E. populnea Equal variances assumed .116 .742 .391 8 .706 .00802 .02053 -.03931 .05535
Stags – E. camaldulensis Equal variances assumed 1.833 .213 -.512 8 .622 -.00080 .00156 -.00440 .00280
Stags – E. populnea Equal variances assumed .000 1.000 .000 8 1.000 .00000 .00173 -.00399 .00399
Stumps – E. camaldulensis Equal variances not assumed 35.200 .000 -1.521 4.357 .197 -.00180 .00118 -.00498 .00138
Stumps – E. populnea Equal variances assumed 1.833 .213 -1.152 8 .282 -.00180 .00156 -.00540 .00180
Logs – E. camaldulensis Equal variances not assumed 8.395 .020 1.852 5.297 .120 .00600 .00324 -.00219 .01419
Logs – E. populnea Equal variances not assumed 7.334 .027 1.372 6.213 .218 .00780 .00569 -.00600 .02160
Grass – E. camaludlensis Equal variances assumed .311 .592 -.588 8 .573 -.11947 .20319 -.58802 .34908
Grass – E. populnea Equal variances assumed .725 .419 .539 8 .604 .14001 .25952 -.45845 .73847
Herbs/Forbs – E. camaldulensis Equal variances assumed 1.336 .281 -.982 8 .355 -.02890 .02945 -.09681 .03900
Herbs/Forbs – E. populnea Equal variances assumed .609 .458 .050 8 .962 .00406 .08190 -.18480 .19292
Lippia – E. camaldulensis Equal variances assumed .391 .549 -.147 8 .887 -.03351 .22840 -.56020 .49318
Lippia – E. populnea Equal variances not assumed 30.448 .001 -.526 4.637 .623 -.13123 .24931 -.78751 .52504
Lippia litter – E. camaldulensis Equal variances assumed .003 .958 .513 8 .622 .00140 .00273 -.00490 .00770
Lippia litter – E. populnea N/A
Fine Litter – E. camaldulensis Equal variances assumed 3.467 .100 1.565 8 .156 .00700 .00447 -.00331 .01732
Fine Litter – E. populnea Equal variances assumed 1.152 .314 .352 8 .734 .00200 .00568 -.01110 .01510
Bare ground – E. camaldulensis Equal variances assumed 1.580 .244 1.485 8 .176 .00300 .00202 -.00166 .00766
Bare ground – E. populnea Equal variances not assumed 5.914 .041 1.265 4.103 .273 .01120 .00885 -.01314 .03555
Appendix H: Raw data from 70 cm2 quadrats
Quadrat Q1 Q2 Q3 Q4 Q5 Q6 Q7 Q8 BC1 Lippia % 95 60 99 98 85 95 90 15

Lippia litter % 0 0 0 0 0 0 0 0 Lippia (/64) 64 63 64 64 64 64 64 45 Lippia (/81) 69 53 76 71 68 76 65 27 Grasses (/64) 46 26 31 11 24 40 60 64 Forbs (/64) 15 41 16 11 27 45 28 10 BC2 Lippia % 10 30 30 80 15 0.1 25 40 Lippia litter % 0 0.1 0 0 0.1 0 0.5 0.5 Lippia (/64) 26 42 37 64 31 6 59 59 Lippia (/81) 10 25 23 55 15 1 22 29 Grasses (/64) 30 25 41 43 61 57 62 64 Forbs (/64) 59 55 51 59 14 67 26 56 BC3 Lippia % 25 10 80 75 30 65 55 10 Lippia litter % 0 0 0 0 0 0 0 0 Lippia (/64) 44 24 56 60 34 59 63 41 Lippia (/81) 29 15 65 45 27 59 52 16 Grasses (/64) 61 56 42 34 45 25 30 51 Forbs (/64) 13 29 30 62 61 57 60 28 BC4 Lippia % 50 25 6 3 0 10 85 95 Lippia litter % 0 0 0 0 0 0 0 0 Lippia (/64) 52 38 45 40 0 51 64 64 Lippia (/81) 38 15 18 9 0 30 59 75 Grasses (/64) 42 35 44 59 64 64 61 52 Forbs (/64) 60 52 46 48 42 6 17 12 BC5 Lippia % 98 98 97 99 99 100 99 75 Lippia litter % 0.1 0 0 0 0 0 0 1 Lippia (/64) 64 64 64 64 64 64 64 64 Lippia (/81) 79 79 78 78 73 79 76 65 Grasses (/64) 7 5 23 5 9 8 16 44 Forbs (/64) 2 1 17 20 28 17 16 UC1 Lippia % 95 40 90 95 90 70 98 70 Lippia litter % 0 3 5 2 7 3 0.1 5 Lippia (/64) 64 64 64 64 64 64 64 64 Lippia (/81) 71 60 70 67 62 60 78 61 Grasses (/64) 33 45 36 38 8 34 9 12 Forbs (/64) 19 2 32 21 8 3 6 14 UC2 Lippia % 85 25 25 30 45 40 5 0.1 Quadrat Q1 Q2 Q3 Q4 Q5 Q6 Q7 Q8 Lippia litter % 0 40 15 15 10 1 5 0 Lippia (/64) 63 32 59 56 57 57 18 20 Lippia (/81) 69 28 50 51 52 47 12 8 Grasses (/64) 29 32 42 45 55 64 64 64 Forbs (/64) 19 48 36 44 33 29 20 2 UC3
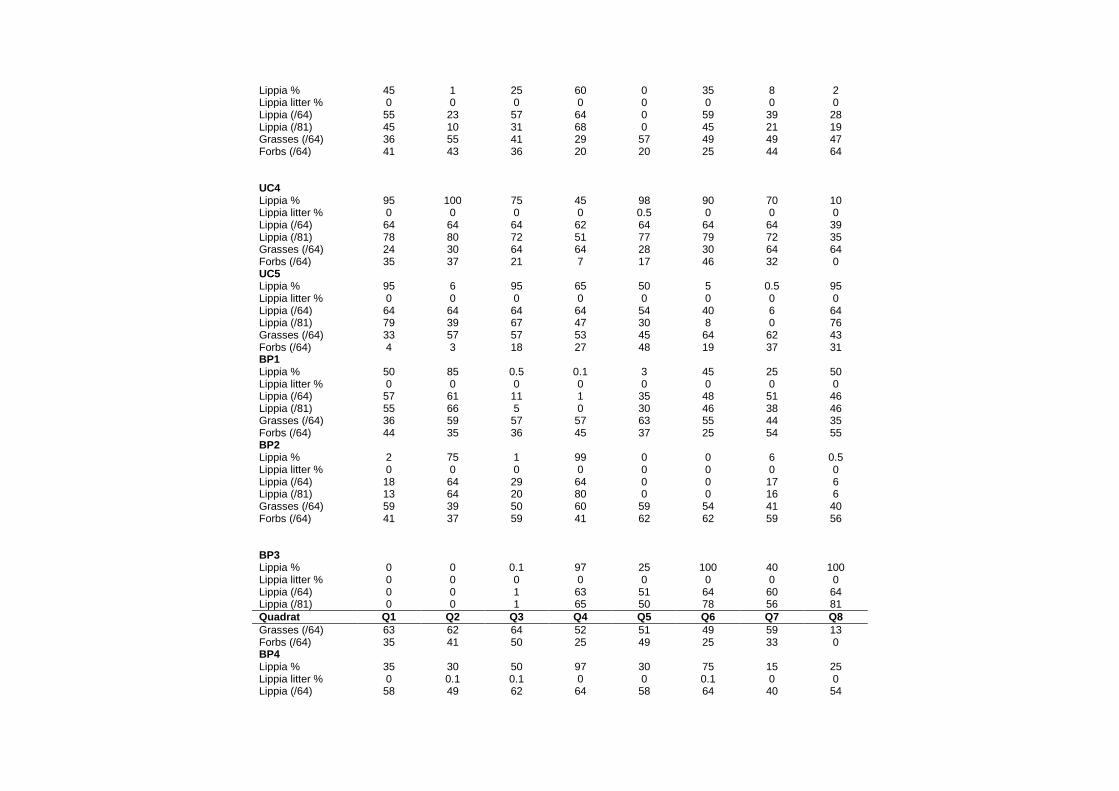
Lippia % 45 1 25 60 0 35 8 2 Lippia litter % 0 0 0 0 0 0 0 0 Lippia (/64) 55 23 57 64 0 59 39 28 Lippia (/81) 45 10 31 68 0 45 21 19 Grasses (/64) 36 55 41 29 57 49 49 47 Forbs (/64) 41 43 36 20 20 25 44 64 UC4 Lippia % 95 100 75 45 98 90 70 10 Lippia litter % 0 0 0 0 0.5 0 0 0 Lippia (/64) 64 64 64 62 64 64 64 39 Lippia (/81) 78 80 72 51 77 79 72 35 Grasses (/64) 24 30 64 64 28 30 64 64 Forbs (/64) 35 37 21 7 17 46 32 0 UC5 Lippia % 95 6 95 65 50 5 0.5 95 Lippia litter % 0 0 0 0 0 0 0 0 Lippia (/64) 64 64 64 64 54 40 6 64 Lippia (/81) 79 39 67 47 30 8 0 76 Grasses (/64) 33 57 57 53 45 64 62 43 Forbs (/64) 4 3 18 27 48 19 37 31 BP1 Lippia % 50 85 0.5 0.1 3 45 25 50 Lippia litter % 0 0 0 0 0 0 0 0 Lippia (/64) 57 61 11 1 35 48 51 46 Lippia (/81) 55 66 5 0 30 46 38 46 Grasses (/64) 36 59 57 57 63 55 44 35 Forbs (/64) 44 35 36 45 37 25 54 55 BP2 Lippia % 2 75 1 99 0 0 6 0.5 Lippia litter % 0 0 0 0 0 0 0 0 Lippia (/64) 18 64 29 64 0 0 17 6 Lippia (/81) 13 64 20 80 0 0 16 6 Grasses (/64) 59 39 50 60 59 54 41 40 Forbs (/64) 41 37 59 41 62 62 59 56 BP3 Lippia % 0 0 0.1 97 25 100 40 100 Lippia litter % 0 0 0 0 0 0 0 0 Lippia (/64) 0 0 1 63 51 64 60 64 Lippia (/81) 0 0 1 65 50 78 56 81 Quadrat Q1 Q2 Q3 Q4 Q5 Q6 Q7 Q8 Grasses (/64) 63 62 64 52 51 49 59 13 Forbs (/64) 35 41 50 25 49 25 33 0 BP4 Lippia % 35 30 50 97 30 75 15 25 Lippia litter % 0 0.1 0.1 0 0 0.1 0 0 Lippia (/64) 58 49 62 64 58 64 40 54
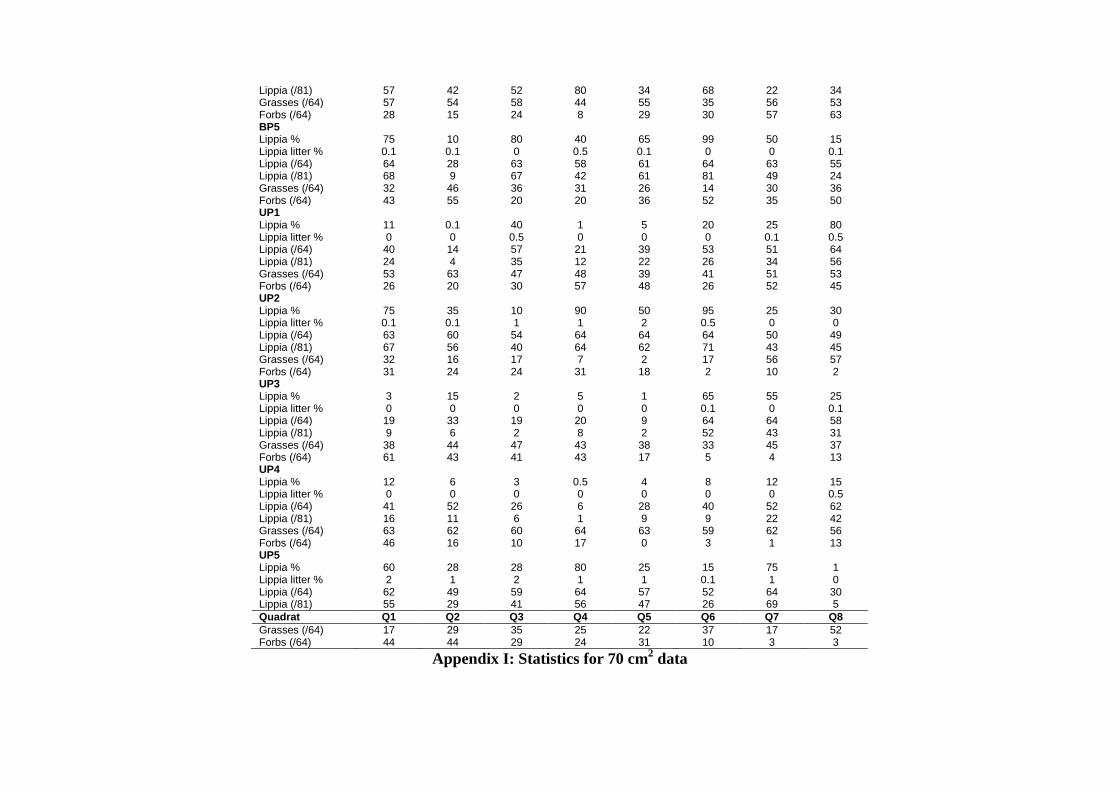
Lippia (/81) 57 42 52 80 34 68 22 34 Grasses (/64) 57 54 58 44 55 35 56 53 Forbs (/64) 28 15 24 8 29 30 57 63 BP5 Lippia % 75 10 80 40 65 99 50 15 Lippia litter % 0.1 0.1 0 0.5 0.1 0 0 0.1 Lippia (/64) 64 28 63 58 61 64 63 55 Lippia (/81) 68 9 67 42 61 81 49 24 Grasses (/64) 32 46 36 31 26 14 30 36 Forbs (/64) 43 55 20 20 36 52 35 50 UP1 Lippia % 11 0.1 40 1 5 20 25 80 Lippia litter % 0 0 0.5 0 0 0 0.1 0.5 Lippia (/64) 40 14 57 21 39 53 51 64 Lippia (/81) 24 4 35 12 22 26 34 56 Grasses (/64) 53 63 47 48 39 41 51 53 Forbs (/64) 26 20 30 57 48 26 52 45 UP2 Lippia % 75 35 10 90 50 95 25 30 Lippia litter % 0.1 0.1 1 1 2 0.5 0 0 Lippia (/64) 63 60 54 64 64 64 50 49 Lippia (/81) 67 56 40 64 62 71 43 45 Grasses (/64) 32 16 17 7 2 17 56 57 Forbs (/64) 31 24 24 31 18 2 10 2 UP3 Lippia % 3 15 2 5 1 65 55 25 Lippia litter % 0 0 0 0 0 0.1 0 0.1 Lippia (/64) 19 33 19 20 9 64 64 58 Lippia (/81) 9 6 2 8 2 52 43 31 Grasses (/64) 38 44 47 43 38 33 45 37 Forbs (/64) 61 43 41 43 17 5 4 13 UP4 Lippia % 12 6 3 0.5 4 8 12 15 Lippia litter % 0 0 0 0 0 0 0 0.5 Lippia (/64) 41 52 26 6 28 40 52 62 Lippia (/81) 16 11 6 1 9 9 22 42 Grasses (/64) 63 62 60 64 63 59 62 56 Forbs (/64) 46 16 10 17 0 3 1 13 UP5 Lippia % 60 28 28 80 25 15 75 1 Lippia litter % 2 1 2 1 1 0.1 1 0 Lippia (/64) 62 49 59 64 57 52 64 30 Lippia (/81) 55 29 41 56 47 26 69 5 Quadrat Q1 Q2 Q3 Q4 Q5 Q6 Q7 Q8 Grasses (/64) 17 29 35 25 22 37 17 52 Forbs (/64) 44 44 29 24 31 10 3 3
Appendix I: Statistics for 70 cm2 data
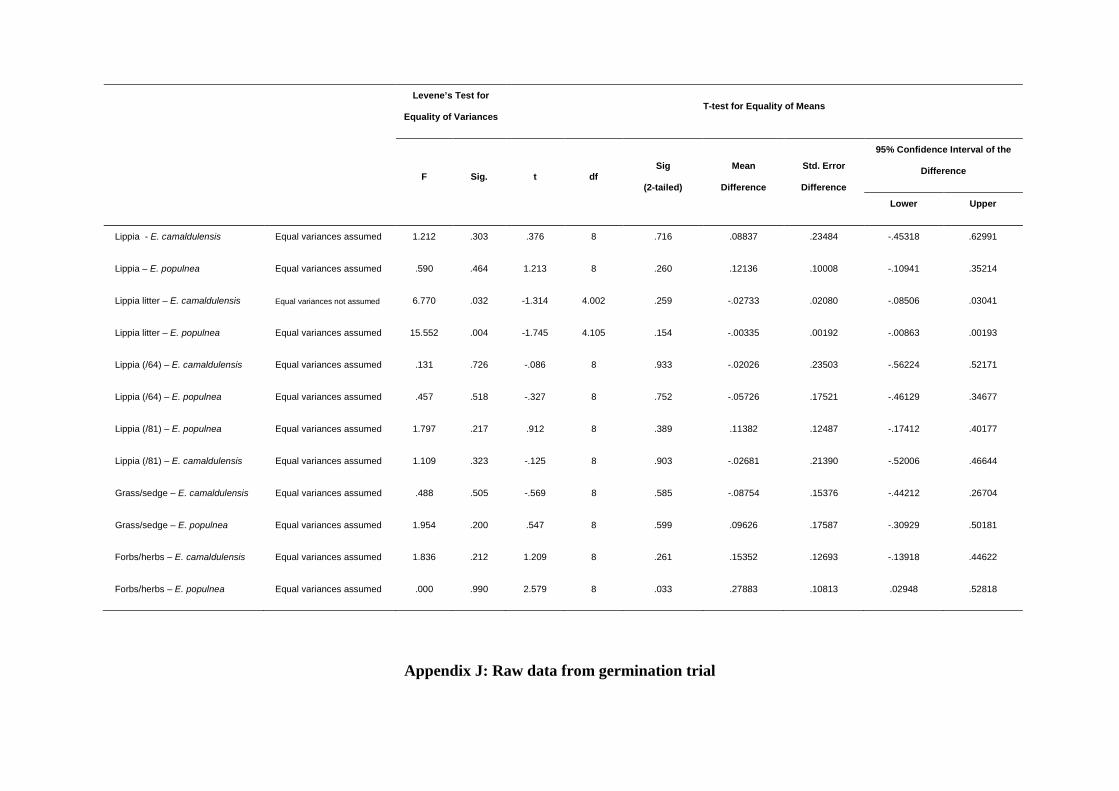
Levene’s Test for
Equality of Variances T-test for Equality of Means
F Sig. t df Sig
(2-tailed)
Mean
Difference
Std. Error
Difference
95% Confidence Interval of the
Difference
Lower Upper
Lippia - E. camaldulensis Equal variances assumed 1.212 .303 .376 8 .716 .08837 .23484 -.45318 .62991
Lippia – E. populnea Equal variances assumed .590 .464 1.213 8 .260 .12136 .10008 -.10941 .35214
Lippia litter – E. camaldulensis Equal variances not assumed 6.770 .032 -1.314 4.002 .259 -.02733 .02080 -.08506 .03041
Lippia litter – E. populnea Equal variances assumed 15.552 .004 -1.745 4.105 .154 -.00335 .00192 -.00863 .00193
Lippia (/64) – E. camaldulensis Equal variances assumed .131 .726 -.086 8 .933 -.02026 .23503 -.56224 .52171
Lippia (/64) – E. populnea Equal variances assumed .457 .518 -.327 8 .752 -.05726 .17521 -.46129 .34677
Lippia (/81) – E. populnea Equal variances assumed 1.797 .217 .912 8 .389 .11382 .12487 -.17412 .40177
Lippia (/81) – E. camaldulensis Equal variances assumed 1.109 .323 -.125 8 .903 -.02681 .21390 -.52006 .46644
Grass/sedge – E. camaldulensis Equal variances assumed .488 .505 -.569 8 .585 -.08754 .15376 -.44212 .26704
Grass/sedge – E. populnea Equal variances assumed 1.954 .200 .547 8 .599 .09626 .17587 -.30929 .50181
Forbs/herbs – E. camaldulensis Equal variances assumed 1.836 .212 1.209 8 .261 .15352 .12693 -.13918 .44622
Forbs/herbs – E. populnea Equal variances assumed .000 .990 2.579 8 .033 .27883 .10813 .02948 .52818
Appendix J: Raw data from germination trial

Plot Week Plant Number BC1 1+2 Stumpy Bright Green Weed 1
Lippia 1
Segmented Leaf 1
Red/Green Tree 1
Carrot Top 75
Milk Weed 5
Small Clover 6
Lime Green Weed 1
3 Dew Rooty Tall 1
Milk Weed 1
Carrot Top 5
Lippia 1
4 Small Clover 1
Carrot Top 15
Unidentified Dicot 1
5 Carrot Top 3
6 Carrot Top 4
Segmented Leaf 1
7 Carrot Top 1
8 Milk Weed 1
10 Carrot Top 4
11 Lippia 1
13 Unidentified Dicot 1
Total Germinants 132 Total Species Count 9 BC2 1+2 Purple Backed Thistle 1
Wahlenbergia 1
Rose Weed 1
Unidentified Dicot 2
Carrot Top 99
Upright Woolley with Flower 5
Grasses 1
Thick Woolley 3
Thin Woolley with Flowers 3
Smells Like Rosemary 6
Heavily Segmented Fern 5
Small Clover 2
Maple Carrot 2
Milk Weed 1
3 Smells Like Rosemary 3
Carrot Top 20
Red/Green Tree 2
Unidentified Dicot 1
Upright Woolley 1
Dew Rooty Tall 1
Grasses 1
4 Carrot Top 9
Red/Green Tree 2
Sage 1
Unidentified Dicot 3
5 Carrot Top 1
Sage 1
Plot Week Plant Number
7 Carrot Top 1
8 Carrot Top 1
11 Carrot Top 1

Unidentified Dicot 1
Total Germinants 182 Total Species Count 18 BC3 1+2 Segmented Leaf 1
Lippia 1
Chive Thing 1
Wahlenbergia 7
Unidentified Dicot 1
4 Cabbage Weed 1
Wahlenbergia 1
Red/Green Tree 2
Carrot Top 4
5 Carrot Top 5
6 Chive Thing 1
Carrot Top 2
Unidentified Dicot 3
Cabbage Weed 1
7 Unidentified Dicot 1
12 Unidentified Dicot 1
14 Unidentified Dicot 1
Total Germinants 34 Total Species Count 9 BC4 1+2 Stumpy Bright Green Weed 1
Segmented Leaf 1
Thick Woolley 1
Carrot Top 52
Small Clover 2
Milk Weed 2
3 Sage 1
Red/Green Tree 1
Carrot Top 2
Grasses 2
Small Clover 2
Carrot Top 15
4 Carrot Top 6
5 Carrot Top 3
Milk Weed 1
6 Carrot Top 3
7 Carrot Top 1
8 Carrot Top 1
9 Carrot Top 2
11 Carrot Top 2
13 Unidentified Dicot 1
14 Unidentified Dicot 7
Total Germinants 109 Total Species Count 10 BC5 1+2 Eucalypt 1
Grasses 2
Carrot Top 11
Small Clover 1
4 Lippia 2
5 Small Clover 1
Carrot Top 3
Plot Week Plant Number
Lippia 2
7 Carrot Top 1
8 Lippia 1

Total Germinants 25 Total Species Count 5 BP1 1+2 Upright Woolley 5
Upright Woolley with Flower 2
Wahlenbergia 11
Milk Weed 1
Small Clover 1
Carrot Top 44
3 Thick Woolley 7
Wahlenbergia 1
Fuzzy Thin Leaf 1
Grasses 1
Carrot Top 1
4 Unidentified Dicot 1
5 Carrot Top 1
6 Weird Succulent 1
Unidentified Dicot 1
7 Unidentified Dicot 1
13 Lippia 1
Total Germinants 81 Total Species Count 13 BP2 1+2 Wahlenbergia 1
Thin Woolley with Flowers 2
Smells Like Rosemary 3
Sage 1
Upright Woolley with Flower 1
Thick Woolley 2
Upright Woolley 1
Cabbage Weed 2
Thick Stem Dark Green Weed 1
4 Carrot Top 4
Upright Woolley 2
Unidentified Dicot 1
Grasses 1
5 Upright Woolley 3
7 Carrot Top 1
11 Carrot Top 1
Unidentified Dicot 1
12 Unidentified Dicot 2
Total Germinants 30 Total Species Count 12 BP3 1+2 Stumpy Bright Green Weed 3
Red/Green Tree 4
Weird Succulent 6
Daisy 3
Lippia 5
Smells Like Rosemary 5
Wahlenbergia 5
Segmented Leaf 3
Grasses 3
Singled Leaf 2
Sword Plant 1
Dark Green Fuzzy (with Flowers) 1
Plot Week Plant Number
4 o'clock 1
Small Clover 1
Carrot Top 18

Thick Carrot Top 1
Milk Weed 1
3 Grasses 3
Fluffy Carrot Top with Weird Flower 1
Stumpy Bright Green Weed 1
Carrot Top 3
Small Clover 1
Red/Green Tree 3
Lippia 1
4 Carrot Top 4
Smells Like Rosemary 1
Red/Green Tree 2
Tall Skinny Leaf 1
5 Chive Thing 1
Grasses 2
Red/Green Tree 4
Carrot Top 1
Unidentified Dicot 1
7 Lippia 1
Grasses 1
Segmented Leaf 1
Unidentified Dicot 1
8 Unidentified Dicot 1
11 Unidentified Dicot 1
14 Carrot Top 1
Total Germinants 100 Total Species Count 22 BP4 1+2 Lippia 2
Thick Woolley 2
Smells Like Rosemary 3
Wahlenbergia 3
Tall Skinny Leaf 2
Unidentified Dicot 1
Grasses 1
3 Weird Succulent 1
Grasses 4
Carrot Top 1
Lippia 1
4 Weird Succulent 2
Small Clover 1
Stumpy Bright Green Weed 1
Thick Dark Green Carrot Top 1
Unidentified Dicot 2
Red/Green Tree 1
Wahlenbergia 2
Grasses 5
Carrot Top 15
5 Grasses 4
Dark Green Carrot Top 1
Wahlenbergia 1
6 Grasses 4
7 Grasses 5
8 Grasses 1
Plot Week Plant Number
Unidentified Dicot 1
9 Grasses 2
Dark Green Carrot Top 1

Carrot Top 1
10 Unidentified Dicot 1
Total Germinants 73 Total Species Count 13 BP5 1+2 Lippia 1
Daisy 2
Purple Backed Thistle 1
Furry Small Tree 1
Stumpy Bright Green Weed 1
Glossy Green Weed 1
Smells Like Rosemary 15
Thin Woolley with Flowers 3
Thick Woolley 13
Unidentified Dicot 4
Grasses 1
3 Thick Woolley 1
Unidentified Dicot 1
4 Carrot Top 1
Small Clover 1
Grasses 1
Unidentified Dicot 2
Red/Green Tree 1
6 Red/Green Tree 1
Milk Weed 1
8 Carrot Top 1
14 Grasses 1
Total Germinants 55 Total Species Count 17 UC1 1+2 Smells Like Rosemary 1
Small Furry Tree 1
Red/Gree Tree 2
Thin Woolley 3
Segmented Leaf 2
Unidentified Dicot 1
Thick Dark Green Carrot Top 1
Small Clover 3
Carrot Top 8
3 Lippia 1
Grasses 1
Red/Green Tree 2
Unidentified Dicot 1
Small Clover 1
4 Lippia 3
Red/Green Tree 1
Grasses 1
5 Grasses 1
6 Lippia 2
Grasses 1
Thick Woolley 1
Total Germinants 38 Total Species Count 12 UC2 1+2 Stumpy Bright Green Weed 1
Carrot Top 31
Plot Week Plant Number
Dark Green Carrot Top 2
Heavily Segmented Fern 1
Purple Backed Thistle 2

Thick Carrot Top 6
Milk Weed 3
Small Clover 1
3 Lippia 1
Weird Succulent 1
Carrot Top 9
Segmented Leaf 1
Dark Green Carrot Top 1
Grasses 1
Milk Weed 1
Thick Carrot Top 1
4 Lippia 1
Stumpy Bright Green Weed 1
Carrot Top 21
Dark Green Carrot Top 1
5 Carrot Top 7
Stumpy Bright Green Weed 1
6 Carrot Top 4
Unidentified Dicot 1
8 Carrot Top 2
13 Lippia 1
14 Unidentified Dicot 1
Total Germinants 104 Total Species Count 13 UC3 1+2 Thin Woolley with Flowers 2
Carrot Top 64
Stumpy Bright Green Weed 1
Segmented Leaf 1
Red/Green Tree 2
Rambling Oak 1
Upright Woolley 1
Sage 3
Smells Like Rosemary 7
Unidentified Dicot 1
Small Clover 2
Milk Weed 1
Large Clover 3
Grasses 1
Thick Dark Green Carrot Top 13
3 Carrot Top 6
Sage 1
Thick Woolley 1
Red/Green Tree 1
4 Smells Like Rosemary 2
Red/Green Tree 2
Unidentified Dicot 4
Carrot Top 19
5 Carrot Top 9
Thick Dark Green Carrot Top 1
6 Carrot Top 6
Red/Green Tree 1
Grasses 1
7 Carrot Top 2
Plot Week Plant Number
8 Carrot Top 2
9 Carrot Top 2
Thick Dark Green Carrot Top 1

11 Unidentified Dicot 1
14 Unidentified Dicot 2
Total Germinants 167 Total Species Count 16 UC4 1+2 Rambling Oak 3
Rose Weed 4
Purple Carrot Top 5
Little Bright Green 1
Carrot Top 27
Segmented Leaf 3
Red/Green Tree 2
Stumpy Bright Green Weed 1
Lippia 2
Heavily Segmented Fern 2
Thorned Strawberry 1
Big Segmented Fern 1
Dew Rooty Tall 1
Thick Carrot Top 26
Frilly Weed 4
Small Clover 2
Grasses 2
Thick Dark Green Carrot Top 1
Milk Weed 1
Milk Weed Look-a-Like 1
3 Little Bright Green 1
Rambling Oak 1
Lippia 1
4 Carrot Top 2
Purple Carrot Top 1
Rambling Oak 2
Grasses 4
Milk Weed 1
Woolley Tree 1
Small Clover 1
Little Bright Green 1
5 Rambling Oak 1
6 Small Clover 1
Carrot Top 2
Rambling Oak 1
Grasses 2
Purple Carrot Top 1
Milk Weed 1
Unidentified Dicot 1
7 Little Bright Green 2
Rambling Oak 1
Grasses 1
8 Red/Green Tree 1
Carrot Top 1
Little Bright Green 1
Purple Carrot Top 3
9 Thick Dark Green Carrot Top 1
11 Grasses 1
Carrot Top 1
Plot Week Plant Number
Unidentified Dicot 1
Total Germinants 130 Total Species Count 23

UC5 1+2 4 o'clock 2
Thin Woolley 1
Segmented Leaf 2
Maple Carrot 14
Carrot Top 28
Large Clover 3
Lippia 3
Small Clover 51
Red/Green Tree 3
Smells Like Rosemary 7
Rambling Oak 4
Rose Weed 19
Grasses 3
Heavily Segmented Fern 39
Purple Carrot Top 6
Thorny Strawberry 1
Thick Dark Green Carrot Top 40
Milk Weed 4
Thorny Weed 3
Thick Carrot Top 28
3 Carrot Top 6
Rose Weed 3
Heavily Segmented Fern 3
Lippia 1
Grasses 1
Sage 1
Milk Weed 1
Maple Carrot 2
Small Clover 1
Rambling Oak 2
Thorny Milk Weed 1
4 Thick Dark Green Carrot Top 1
5 Unidentified Dicot 1
Grasses 2
Carrot Top 3
Large Clover 2
Heavily Segmented Fern 1
6 Unidentified Dicot 2
Carrot Top 1
Grasses 2
7 Heavily Segmented Fern 1
Milk Weed 2
Thorny Milk Weed 1
Segmented Leaf 1
Unidentified Dicot 1
8 Unidentified Dicot 1
Total Germinants 305 Total Species Count 25 UP1 1+2 Lippia 3
Segmented Leaf 3
Thin Woolley with Flowers 1
Thick Woolley 4
Grasses 2
Plot Week Plant Number
Milk Weed 3
Woolley Weed 27
Carrot Top 22

Small Clover 2
Frilly Weed 1
3 Smells Like Rosemary 2
Upright Woolley 1
Carrot Top 2
Woolley Weed 3
4 Grasses 1
Lippia 1
Carrot Top 1
5 Grasses 1
Thick Woolley 1
6 Grasses 3
Thick Woolley 1
Total Germinants 85 Total Species Count 12 UP2 1+2 Segmented Leaf 3
Stumpy Bright Green Weed 1
Smells Like Rosemary 3
Small Clover 1
Lippia 7
Thin Woolley with Flowers 2
Thick Woolley 2
Sage 11
Weird Succulent 8
Unidentified Dicot 1
Carrot Top 9
Grasses 4
Thick Dark Green Carrot Top 5
3 Unidentified Dicot 1
Sage 1
Weird Succulent 2
Carrot Top 1
Small Clover 1
Upright Woolley with Flower 1
Red/Green Tree 1
Dark Green Carrot Top 1
5 Thin Woolley 1
Carrot Top 1
Small Clover 1
Upright Woolley with Flower 1
Red/Green Tree 1
6 Lippia 1
Unidentified Dicot 2
10 Dark Green Carrot Top 1
11 Unidentified Dicot 1
13 Grasses 1
14 Grasses 1
Total Germinants 78 Total Species Count 19 UP3 1+2 Grasses 5
Weird Succulent 166
Fluffy Carrot Top with Weird Flower 1
Smells Like Rosemary 5
Plot Week Plant Number
Thin Woolley 1
Red/Green Succulent 1
Thick Dark Green Carrot Top 14

Unidentified Dicot 3
3 Weird Succulent 17
Smells Like Rosemary 1
Unidentified Dicot 2
4 Grasses 1
Weird Succulent 3
Thick Dark Green Carrot Top 1
Unidentified Dicot 2
5 Grasses 4
Unidentified Dicot 1
7 Weird Succulent 1
Unidentified Dicot 1
Plot Week Plant Number
12 Grasses 4
Unidentified Dicot 2
Total Germinants 236 Total Species Count 8 UP4 1+2 Lippia 2
Segmented Leaf 1
Smells Like Rosemary 3
Upright Woolley with Flower 10
3 Unidentified Dicot 1
Upright Woolley with Flower 2
4 Unidentified Dicot 2
Small Clover 1
Carrot Top 1
5 Carrot Top 2
Milk Weed 1
Total Germinants 26 Total Species Count 8 UP5 1+2 Unidentified Dicot 2
Sage 2
Upright Woolley with Flower 1
Smells Like Rosemary 6
Segmented Leaf 2
Thin Woolley with Flower 2
Lippia 5
Weird Succulent 4
Purple Single Leaf 3
Little Bright Green 2
3 Little Bright Green 9
Segmented Leaf 1
Lippia 2
Woolley (dead) 1
Unidentified Dicot 1
Carrot Top 1
4 Thick Dark Green Carrot Top 1
Purple Single Leaf 1
Little Bright Green 1
Sage 1
Carrot Top 1
Lippia 2
Woolley Tree 1
Plot Week Plant Number
5 Unidentified Dicot 2
Lippia 1
Grasses 2

6 Carrot Top 1
7 Grasses 1
Little Bright Green 1
8 Unidentified Dicot 1
Lippia 1
Total Germinants 62 Total Species Count 16
Appendix K: Statistics for germination data
Levene’s Test for Equality of Variances
T-test for Equality of Means
F Sig. t df Sig. (2-tailed)
Mean Difference
Std. Error Difference
95% Confidence Interval of the Difference
Lower Upper T=3
Lippia – E. camaldulensis Equal variances assumed .174 .687 -1.416 8 .195 -.22499 .15892 -.59145 .14147
Lippia – E. populnea Equal variances assumed .054 .822 -.964 8 .363 -.22743 .23582 -.77124 .31638
Total minus lippia – E. camaldulensis Equal variances assumed .013 .912 -.521 8 .617 -.12565 .24130 -.68209 .43079
Total minus lippia – E. populnea Equal variances assumed .044 .840 -1.243 8 .249 -.20678 .16633 -.59033 .17678
Total – E. camaldulensis Equal variances assumed .016 .903 -.544 8 .601 -.13081 .24029 -.68491 .42330
Total – E. populnea Equal variances assumed .013 .913 -1.617 8 .145 -.25015 .15474 -.60698 .10667
T=14
Lippia – E. camaldulensis Equal variances assumed .298 .600 -1.000 8 .347 -.21339 .21337 -.70541 .27863
Lippia – E. populnea Equal variances assumed .202 .665 -.899 8 .395 -.22046 .24520 -.78589 .34497

Total minus lippia – E. camaldulensis Equal variances assumed .008 .930 -.619 8 .553 -.14158 .22867 -.66890 .38573
Total minus lippia – E. populnea Equal variances assumed .318 .588 -.729 8 .487 -.12547 .17217 -.52250 .27156
Total – E. camaldulensis Equal variances assumed .007 .935 -.636 8 .542 -.13634 .21428 -.63046 .35778
Total – E. populnea Equal variances assumed .040 .847 -1.086 8 .309 -.16954 .15607 -.52945 .19036
Appendix L: Statistics for pseudo-species data
Levene’s Test for Equality of Variances
T-test for Equality of Means
F Sig. t df Sig.
(2-tailed) Mean
Difference Std. Error Difference
95% Confidence Interval of the Difference
Lower Upper
Species Richness –
E. camaldulensis Equal variances assumed .106 .754 -1.957 7 .091 -.17710 .09050 -.39109 .03688
Species Richness –
E. populnea Equal variances assumed 1.228 .300 1.114 8 .297 .09386 .08422 -.10034 .28806
Appendix M: Average lippia cover
Lippia (subjective)
BC1 79.625

BC2 28.7625 BC3 43.75 BC4 34.25 BC5 95.625 UC1 81 UC2 31.8875 UC3 22 UC4 72.875 UC5 51.4375 BP1 32.325 BP2 22.9375 BP3 45.2625 BP4 44.625 BP5 54.25 UP1 22.7625 UP2 51.25 UP3 21.375 UP4 7.5625 UP5 39


