Report of the Intermodal Passenger
Transportation Subcommittee
Citizens Advisory Committee Transportation Funding Task Force
July 21, 2008

Report of the Intermodal Passenger Transportation Subcommittee
Public Act 221 of 2007, created the Transportation Funding Task Force to “review the adequacy of surface transportation and aeronautics service provision and finance” in Michigan. The task force’s mission applies to roads, transit, & aviation It is supported by Michigan Department of Transportation (MDOT) staff and assisted by Citizens’ Advisory Committee (CAC). The primary focus of the task force is to examine alternatives to the portion of transportation funding that has fuel taxes as a source and to suggest or recommend alternative revenue collection systems funded through user pay methods or methods other than user pay methods. The task force shall include an analysis of the feasibility of alternative methods. The task force may make recommendations for implementation of pilot programs to test feasible alternatives to replace the portion of transportation funding that comes from fuel taxes. The task force shall make a preliminary recommendation on pilot programs by October 31, 2008. The following members of the Citizens Advisory Committee to the Transportation Funding Task Force served on the CAC Intermodal Passenger Subcommittee:
Linda M. Atkinson General Public Channing, MI
Gretchen D. Driskell, CAC Chair Michigan Municipal League
Saline, MI
Sylvester Payne, Intermodal Passenger Subcommittee, Chair Michigan Public Transit Association
Freeland, MI
Kirk T. Steudle Michigan Department of Transportation
Lansing, MI

EXECUTIVE SUMMARY ____________________________________________________________ 1
Introduction ________________________________________________________________________ 1
Overall Summary of Results ___________________________________________________________ 2
SECTION ONE: LOCAL TRANSIT, INTERCITY BUS AND PASSENGER RAIL ______________ 6
System Overview (existing) ____________________________________________________________ 6
Local Transit ........................................................................................................................................... 6
Intercity Bus............................................................................................................................................ 7
Intercity Passenger Rail......................................................................................................................... 7
Current Trends______________________________________________________________________ 8
Economic and Other Life Benefits _______________________________________________________ 9
Economic Benefits.................................................................................................................................. 9 Public Transportation in Michigan as an Economic Development Tool_________________ 9 Attracting Millennial Knowledge Workers ________________________________________ 11 Local Bus System Benefits ______________________________________________________ 12 Local Rail System Benefits ______________________________________________________ 12
Intercity Passenger Rail Benefits ...................................................................................................... 15
Quality of Life Benefits ...................................................................................................................... 16
Environmental Benefits ...................................................................................................................... 16
Congestion Mitigation ....................................................................................................................... 17
Leveraging Additional Federal Funds.............................................................................................. 17
Current State Funding _______________________________________________________________ 18
Comprehensive Transportation Fund .............................................................................................. 18
State Transit Funding Throughout the U.S. ..................................................................................... 18
Investment Scenarios ________________________________________________________________ 19
Assumptions for Investment Scenarios ............................................................................................ 20
State versus Local Revenues .............................................................................................................. 21
Investment Scenarios Overview ........................................................................................................ 22
Current Investment Level (i.e., Do Nothing)................................................................................... 23
Good Investment Level....................................................................................................................... 25
Better Investment Level ...................................................................................................................... 26
Mode‐by‐Mode Analysis: Local Transit, Intercity Bus and Passenger Rail ______________________ 28
Local Transit ......................................................................................................................................... 28

Report of the Intermodal Passenger Transportation Subcommittee
Current Local Transit Investment________________________________________________ 29 Good Local Transit Investment__________________________________________________ 31 Better Local Transit Investment _________________________________________________ 32 $692.9 Million State Revenues, Leveraging Between $189.9 Million and $496.9 Million in Federal Funds. _______________________________________________________________ 32
INTERCITY BUS.................................................................................................................................. 34 Current Intercity Bus Investment ________________________________________________ 35 $2.2 Million in State Revenues Leveraging up to $2.2 Million in Federal Funds _____________ 35 Good Intercity Bus Investment __________________________________________________ 36 $8.7 Million in State Revenues; Leveraging up to $2.5 Million in Federal Funds _____________ 36 Better Intercity Bus Investment__________________________________________________ 37
INTERCITY PASSENGER RAIL........................................................................................................ 37 Current Passenger Rail Investment ______________________________________________ 39 Good Passenger Rail Investment ________________________________________________ 40 Better Passenger Rail Investment ________________________________________________ 41
Conclusions – Local Bus, Intercity Bus and Passenger Rail __________________________________ 43
SECTION TWO: CARPOOL PARKING LOT PROGRAM AND BICYCLE AND PEDESTRIAN TRANSPORTATION _______________________________________________________________ 44
Carpool Parking Lot Program__________________________________________________________ 44
Introduction.......................................................................................................................................... 44
Investment Scenarios........................................................................................................................... 44 Current Carpool Parking Lot Investment Level ____________________________________ 45 Good Carpool Parking Lot Investment Level ______________________________________ 45 Better Carpool Parking Investment Level _________________________________________ 46 Best Carpool Parking Lot Investment Level _______________________________________ 46
Local Agency Capital Needs ‐ Bicycle and Pedestrian Transportation __________________________ 48
Introduction.......................................................................................................................................... 48
Investment Assumptions.................................................................................................................... 48
Investment Scenarios........................................................................................................................... 49 Current Bicycle and Pedestrian Investment Level (i.e., Do Nothing) __________________ 50 Good Bicycle and Pedestrian Investment Level ____________________________________ 50 Better Bicycle and Pedestrian Investment Level____________________________________ 52 Best Bicycle and Pedestrian Investment Level _____________________________________ 52
APPENDIX A: The Comprehensive Transportation Fund APPENDIX B: Local Bus, Intercity Bus and Passenger Rail Maps APPENDIX C: Public Transportation in Michigan: An Economic Development Tool Whose
Time Has Come

Executive Summary ES‐1
EXECUTIVE SUMMARY
Introduction As directed by the Michigan Transportation Funding Taskforce, the Intermodal Passenger Subcommittee of the Citizens Advisory Committee met over the past several months to solicit information from Michigan’s businesses, organizations, citizenry, governmental entities, transit providers, and various stakeholder groups on Michigan’s intermodal passenger transportation system. Over this time period, five public meetings were held to research and collect data on the needs in each of the following areas:
Intercity Bus Intercity/Interstate Passenger Rail Local Transit Carpool Lots Bicycle and Pedestrian Transportation.
The purpose of this report is to describe the current state investment level in these five passenger transportation modes and describe the needs associated with a “good” and “better” level of investment. Section One provides the results for the following passenger transportation modes, which are supported with state funding from the Comprehensive Transportation Fund and federal transit funds, primarily awarded by the Federal Transit Administration.
Intercity Bus Intercity/Interstate Passenger Rail Local Transit
Both appendices pertain to Section One. Appendix A provides information about the Comprehensive Transportation Fund. Appendix B provides maps for these modes. Section Two provides the results of the analysis with recommendations for the following passenger transportation modes, which are supported by local, state, and federal highway funds.
Carpool Lots Bicycle and Pedestrian Transportation

Report of the Intermodal Passenger Transportation Subcommittee
Overall Summary of Results Based on the information collected by the CAC Intermodal Passenger Committee, it is clear that current state funding available for Michigan’s intermodal passenger transportation system has not and will not keep pace with the needs of Michigan’s passenger transportation systems. Michigan residents are demanding more transportation options, both in terms of additional service and additional modes. Rising gas prices and the aging population are significant factors contributing to this demand, but the importance of modern public transportation systems to attracting young, college educated workers to our urban centers, cannot be overlooked as a critical reason to invest in passenger transportation options. Urban centers across the country are seeing economic development benefits associated with rapid transit systems and Michigan needs to get “on board.” Status quo (current) investment in passenger transportation is a recipe for a bleak future, highlighted by inadequate mobility for Michigan residents and visitors, minimal multi‐modal connectivity and significant lost federal revenue. The current investment level provides limited transportation options, bankrupts state and local passenger transportation programs and increases congestion and pollution. Additionally, it will not maximize the State’s unique character or sense of place in our communities, and creates little to no economic development/retention potential. To achieve the preferred transportation vision outlined or address the needs identified in the MI Transportation Plan (Michigan’s Long Range Transportation Plan), and to begin to address the goals set forth in the plan, at minimum, a “good” level of investment is required. Only at this level of investment will Michigan be able to modernize and expand the passenger transportation system to provide users with increased multi‐modal choices, including local bus service, regional and local rapid transit, interstate passenger rail, bike and pedestrian systems. A “better” level of investment would move us even further along the multi‐modal spectrum, enabling the State to maintain some competitive advantage with other states but will still underfund the intermodal transportation system.

Report of the Intermodal Passenger Transportation Subcommittee
INTERMODAL PASSENGER TRANSPORTATION INVESTMENT LEVEL TOTALS
State Program and Maximum Federal Funds Leveraged Program Current Good Better Local Transit, Intercity Bus and Passenger Rail
$240,756,700 $772,731,734 $1,335,930,112
Carpool Parking Lots $1,600,000 $2,350,000 $4,850,000 Bicycle and Pedestrian $9,600,000 $131,000,000 $304,900,000 Current Investment Levels – With only current revenues, local transit services and intercity passenger rail service (Amtrak) will be reduced, intercity bus services to rural areas will be eliminated, modernization of transit facilities and replacement of buses would be curtailed, federal funds will be lost, existing carpool lots will deteriorate, maintenance of multi‐use trails will be reduced, with the possibility of closing some trails due to user safety concerns. The current investment scenario would significantly erode the intermodal passenger system infrastructure and reduce transportation choices for Michigan residents and visitors across all passenger transportation modes (Intercity Bus, Intercity/Interstate Passenger Rail, Local Transit, Carpool Lots, and Bicycle and Pedestrian Transportation). There will be no ability for improvement, i.e., no increase in quality or quantity of services. Good Investment Levels – This scenario would allow the expansion of local transit service including the introduction of regional, rapid transit in Grand Rapids and metro Detroit, with improved quality of life for Michigan residents and distinct environmental and economic development benefits. Intercity bus services would be maintained and intercity passenger rail services would be expanded over a 10‐year period. New multi‐modal passenger facilities for intercity bus and passenger rail services will be possible. Additional transportation services to
Local Transit, Intercity Bus and Passenger Rail with Current Investment
Service levels decline for both urban and rural bus systems
No new regional or rapid transit in Michigan’s urban areas
Rural Michigan communities lose access to the national intercity bus and rail passenger network
Intercity passenger rail routes are eliminated with the potential for losing all existing passenger rail service in Michigan.
Report of the Intermodal Passenger Transportation Subcommittee
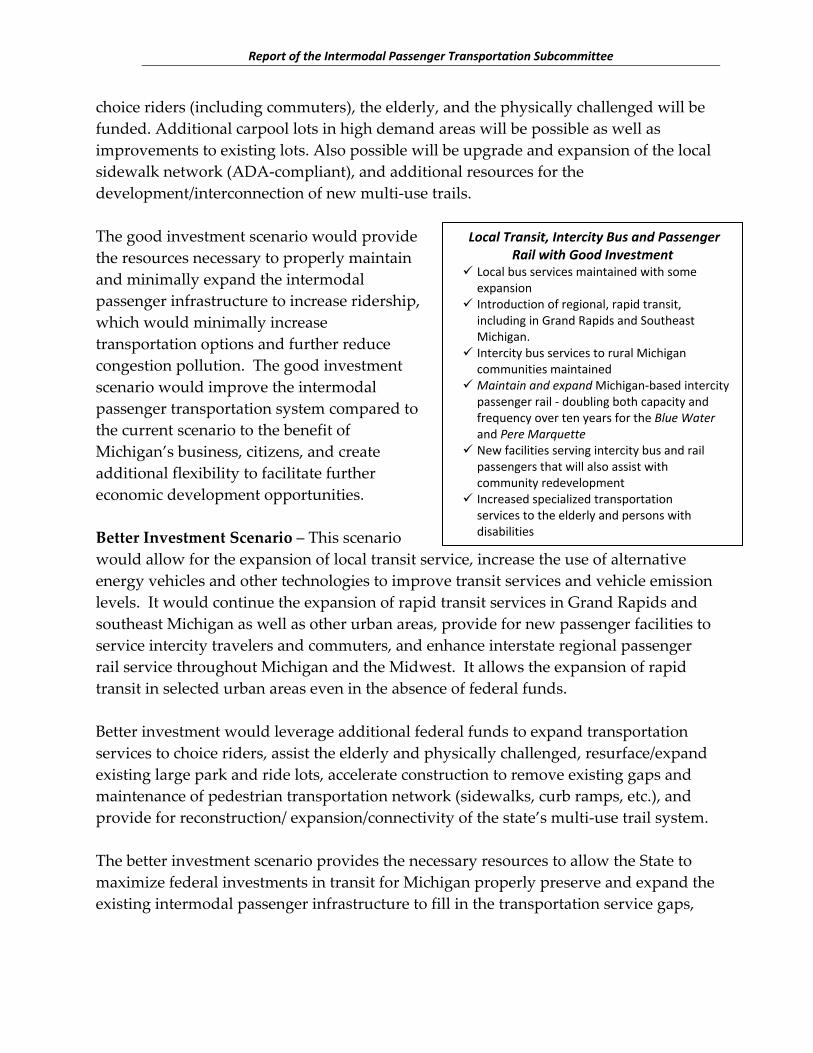
choice riders (including commuters), the elderly, and the physically challenged will be funded. Additional carpool lots in high demand areas will be possible as well as improvements to existing lots. Also possible will be upgrade and expansion of the local sidewalk network (ADA‐compliant), and additional resources for the development/interconnection of new multi‐use trails. The good investment scenario would provide the resources necessary to properly maintain and minimally expand the intermodal passenger infrastructure to increase ridership, which would minimally increase transportation options and further reduce congestion pollution. The good investment scenario would improve the intermodal passenger transportation system compared to the current scenario to the benefit of Michigan’s business, citizens, and create additional flexibility to facilitate further economic development opportunities. Better Investment Scenario – This scenario would allow for the expansion of local transit service, increase the use of alternative energy vehicles and other technologies to improve transit services and vehicle emission levels. It would continue the expansion of rapid transit services in Grand Rapids and southeast Michigan as well as other urban areas, provide for new passenger facilities to service intercity travelers and commuters, and enhance interstate regional passenger rail service throughout Michigan and the Midwest. It allows the expansion of rapid transit in selected urban areas even in the absence of federal funds. Better investment would leverage additional federal funds to expand transportation services to choice riders, assist the elderly and physically challenged, resurface/expand existing large park and ride lots, accelerate construction to remove existing gaps and maintenance of pedestrian transportation network (sidewalks, curb ramps, etc.), and provide for reconstruction/ expansion/connectivity of the state’s multi‐use trail system. The better investment scenario provides the necessary resources to allow the State to maximize federal investments in transit for Michigan properly preserve and expand the existing intermodal passenger infrastructure to fill in the transportation service gaps,
Local Transit, Intercity Bus and Passenger Rail with Good Investment
Local bus services maintained with some expansion
Introduction of regional, rapid transit, including in Grand Rapids and Southeast Michigan.
Intercity bus services to rural Michigan communities maintained
Maintain and expand Michigan‐based intercity passenger rail ‐ doubling both capacity and frequency over ten years for the Blue Water and Pere Marquette
New facilities serving intercity bus and rail passengers that will also assist with community redevelopment
Increased specialized transportation services to the elderly and persons with disabilities

Report of the Intermodal Passenger Transportation Subcommittee
resulting in further increases in transportation choices, ridership and reductions in congestion and pollution. The better investment scenario will allow a greater degree of interconnection between the intermodal passenger network and other modes of transportation to maximize services to businesses and citizens, which would further augment the state’s ability to improve business creation, expansion, and related economic development opportunities. Best Investment Levels ‐ The best investment scenario is difficult to describe, much less quantify. The best investment scenario would provide for a passenger intermodal system that is innovative, recognized internationally as a model that provides choices for all urban trips. Some minimal elements would include a quality local bus service, comprehensive metropolitan transit systems (with a transit master plan), metro commuter rail, transit advantaging infrastructure, non‐motorized infrastructure developed in support of public transit, intercity passenger rail and high speed rail between Detroit and Chicago. Innovative technologies involving passenger intermodal systems developed by our leading universities would be tested and implemented in partnership with state and local governments. Michigan would once again be recognized as the leader in transportation systems.
Local Transit, Intercity Bus and Passenger Rail with Better Investment
Local bus services expanded, including increased use of alternative fuel vehicles and customer information technologies
More county‐wide bus systems to assist with cross‐county access for work and medical trips
Significantly expanded rapid transit in Michigan's urban centers, including development of rapid transit in key corridors that are not competitive for federal grants
Existing intercity bus services maintained including sufficient revenues to contract for additional service if additional routes are abandoned by the private sector
Modern intercity passenger facilities, including park and ride lots with passenger amenities
Innovative public/private partnerships for shuttle bus services that increase regional transportation options Significantly enhanced regional (interstate) passenger rail service through federal and state investments by Michigan and other Midwest states.
Expansion of targeted services for the elderly, persons with disability and low income workers, through increased state investment and leveraging additional federal funds

Report of the Intermodal Passenger Transportation Subcommittee
Section One: Local Transit, Intercity Bus and Passenger Rail One‐6
SECTION ONE: LOCAL TRANSIT, INTERCITY BUS AND PASSENGER RAIL
System Overview (existing)
Local Transit
79 local transit systems and 40 specialized services agencies • Serving 94 million passengers in FY2007 • Double digit increases in transit use the first half of 2008
The current local transit system in Michigan includes community and county level bus systems, several multi‐county bus systems, one fixed guideway system (the Detroit People Mover) and many small non‐profit services that provide targeted (often client based) services for the elderly and persons with disabilities
• 3,410 passenger vehicles • All 83 counties have some level of demand response service • 18 counties have fixed‐route service • Countywide service in 60 counties
Provides access to jobs, medical care, education, shopping, recreation, and other needed services
80 percent of our population has access to local transit services via county‐wide or community‐based transit system
Michigan uses the current local transit system. • Michiganders took 95,171,484 trips on local transit in 2007. This is a growth of
over 1.33 percent from Fiscal Year (FY) 2006, and a 10.81 percent increase from FY2005 to FY2007.
• DDOT and SMART have experienced a 6.51 percent increase from FY 2005 to FY 2007. SMART is posting record ridership, with more than 12 million passengers annually.
• The Detroit People Mover continues to see increases in passengers. In FY2007 the DTC had 2,367,875 passengers, a growth of over 1.17 percent from FY2006 and growth of 51.92 percent from FY 2005.
• Michigan’s large urban systems (Ann Arbor, Lansing, Flint, and Grand Rapids) have experienced a 5.92 percent increase from FY 2006 to FY 2007 and 21.37 percent increase from FY2005 to FY2007.
Report of the Intermodal Passenger Transportation Subcommittee
Section One: Local Transit, Intercity Bus and Passenger Rail One‐7
• In Grand Rapids, The Rapidʹs FY2007 ridership topped a record 8.1 million, with weekday fixed route ridership up 14.7 percent.
• The Mass Transportation Authority’s (Flint/Genesee County) urban ridership increased 37 percent from 2005 to 2007.
• Initial ridership data for the first half of FY2008 show double digit increases throughout the state. MDOT anticipates greater increases when a full year of data is available.
Within the next several years, local transit will also need to include bus rapid transit, light rail and/or commuter rail at the community, county and/or regional level, countywide coverage of demand response services, a comprehensive fixed route transit service in all urban areas and enhanced intermodal connections
Through the Comprehensive Transportation Fund (CTF), MDOT shares in operating and capital costs as mandated under Act 51 of 1951.
Intercity Bus
Three private‐sector carriers – Indian Trails., Greyhound Lines and Megabus Service to 120 Michigan communities, many of which have no other forms of intercity public transportation.
Essential transportation services for significant segments of our population, including students, families, and seniors, and prevents isolation of small and medium sized communities.
MDOT uses CTF to contract for over one million miles of scheduled route service reaching over 90 Michigan communities that would not have any intercity bus service in the absence of MDOT contracts.
MDOT uses CTF to make infrastructure investments that supports the entire intercity bus network.
Intercity Passenger Rail
One carrier ‐ National Railroad Passenger Corporation (Amtrak) Three Passenger Rail Routes in Michigan: • Services between Grand Rapids and Chicago ‐ Pere Marquette • Service between Port Huron and Chicago ‐ Blue Water • Service between Pontiac, Detroit and Chicago – Wolverine • Total passengers for FY2007: 681,568. • Passenger rail ridership and passenger revenue are at all time highs.

Report of the Intermodal Passenger Transportation Subcommittee
Section One: Local Transit, Intercity Bus and Passenger Rail One‐8
Services link 22 southern lower Michigan communities to the Amtrak intercity rail system covering the United States.
Complements Michigan’s tourism industry; important links for several of Michigan’s largest higher learning institutions, and provides the business traveler with an alternative to highway and air travel.
MDOT uses CTF to contract for the Pere Marquette and Blue Water, which are not part of Amtrak’s national network.
MDOT uses CTF for capital improvements to support the entire network.
Current Trends In Michigan and across the United States, transit usage is up significantly, for both local transit and intercity services. In early 2008, local transit and intercity passenger rail services are experiencing increases of 10 to 20 percent or more. There are many factors that account for this change. Ridership increased over 10 percent from 2005 through 2007. The most obvious and pressing reason for increased ridership is the dramatic increase in gas prices. The price of gasoline has increased by nearly 114 percent in the past year. Diesel fuel increases have been more dramatic with an increase of nearly 182 percent during the same period.1 However, choice riders, whether they are commuting for employment or education or traveling to tourist destinations have also increased. Michigan’s desire to attract a young creative class of knowledge workers is hampered because this group prefers area with a high quality of life that includes alternatives to the automobile. They often select a place to live prior to finding employment. The state’s aging population has also increased the demand for transit alternatives. Between 2000 and 2007, the State’s population over 85 is estimated to have increased by nearly 25 percent.2 By the year 2030, the senior population (over 65) will have doubled. Many are able to also choose where to live based on amenities that are offered such as transportation choices. This population is living longer and requires the ability to remain active.
1 According to the Energy Information Administration, official energy statistics from US Government.
2 Annual Estimates of the Population by Sex and Five‐Year Age Groups for the United States: April 1, 2000 to July 1, 2007 (NC‐EST2007‐01)

Report of the Intermodal Passenger Transportation Subcommittee
Section One: Local Transit, Intercity Bus and Passenger Rail One‐9
Nationally, there is a growing recognition of the importance of a truly intermodal transportation system. In July 2007 the American Association of State Highway and Transportation Officials (AASHTO) released its “New Vision for the 21st Century.” In preparing the report, 150 transportation leaders identified steps that must be taken to transform our transportation system. Among the top ten was: “Aggressively invest in making public transportation an attractive choice across America. Within 15 years, a fully functioning, high‐quality, high‐capacity system should be in place in every metropolitan region.” Public transit is a key piece to the puzzle of providing an effective, efficient, environmentally and economically sound transportation system. Bus transit is the backbone of any public transit system and in that regard Michigan has an excellent foundation on which to build. However, rail — light rail, commuter rail and intercity rail — are vital to building an effective system in the 21st century and this is an area where Michigan needs to focus considerable attention. As shown in the section below on economic benefits, investment in rail results in substantial economic investment along these corridors.
Economic and Other Life Benefits Investments in passenger transportation systems have definitive economic, quality of life and environmental benefits. Numerous studies and project results demonstrate the benefits of all forms of passenger transportation. This includes the investments being made in Michigan’s current system of local bus transit, passenger rail and intercity bus, as well as the benefits of the Michigan’s future system that will include local and regional rapid transit and enhanced intercity passenger rail.
Economic Benefits
Public Transportation in Michigan as an Economic Development Tool In early 2008, State Representative Marie Dongian released, “Public Transportation in Michigan: An Economic Development Tool Whose Time Has Come. A Report/Working Document from the Chair of the Public Transit Subcommittee, A Subcommittee of the

Report of the Intermodal Passenger Transportation Subcommittee
Section One: Local Transit, Intercity Bus and Passenger Rail One‐10
House Standing Committee on Transportation.” (See Appendix C) Over the course of 2007 and 2008, the Public Transit Subcommittee held 18 hearings with government agencies, advocates, transit operators, and private partners. Week after week, the Subcommittee heard testimony about the economic development potential of modern and efficient public transportation. Economic and other benefits identified in the report include:
Business recruitment and job creation has been hampered by Michigan’s lack of transportation options.
Michigan is competing with other states that have modern public transportation systems.
The Michigan Municipal League has identified transit as its number one legislative priority.
Strengthening Michigan’s cities is essential for Michigan’s economic recovery. Testimony revealed that a dollar invested in transit leads to $6 in related economic activity.
The experience of other cities indicates that transit is not a silver bullet but that modern transit, like good schools, universities and vibrant cities is a common denominator that defines America’s most successful regions. Experience and data gathered from visits to other states and cities leads many people to believe that a serious investment in modern transit is not an option for Michigan — it’s an urgent necessity.
Transit Oriented Development (TOD) is high density and multi‐use and is being developed in cities that have viable transit. Developers want the option in Michigan, young people use it, and it is good land‐use policy.
Planned transit projects in Grand Rapids have already increased property values along the proposed route.
Universities need modern transit — the cost to build and maintain parking lots is not cost effective. Michigan’s lack of modern public transit limits student recruitment.
Public transit is the best non‐regulatory way to reduce dependence on foreign oil. Transit centers in Flint, Traverse City, and Grand Rapids are LEED (Leadership in Energy and Environment Design) certified for operating “Green Buildings.”

Report of the Intermodal Passenger Transportation Subcommittee
Section One: Local Transit, Intercity Bus and Passenger Rail One‐11
The Detroit/Southeast Michigan’s tourism effort, The D, has identified transit’s role in making Southeast Michigan a desirable place to live and visit, attracting young working people to the region to live, work and play. Tourism in Michigan will suffer unless vital tourism destinations, sports facilities, events, and downtowns are connected by modern and efficient transit.
Michigan’s railroads can improve efficiency, speed and on time performance, thereby making rail travel more attractive to Michigan residents and to visitors.
Attracting Millennial Knowledge Workers
A 2008 project conducted by The University of Michigan Ross School of Business on behalf of Michigan Future3 identified the means by which Michigan can attract Millennial (or Generation Y) Knowledge Workers to the city of Detroit. Through significant research and data collection, the report identified the key housing and neighborhood characteristics that young professionals demand. One of trends identified was that Millennial Knowledge Workers have a strong preference for urban walkability. Young talent wants to satisfy most of their everyday needs (such as school, shopping, parks, friends, and even employment) by walking or utilizing mass transit. Survey respondents demonstrated a strong preference for walkable attributes. Eighty‐two percent of respondents would prefer to commute to work by foot, bike or public transportation.
“When we look at regions around the country, the places that have focused exclusively on car‐based transportation are getting choked‐up with traffic. And employers are feeling that they canʹt ensure that their employees can get to work on time. Theyʹre having a harder time attracting whatʹs often thought of as the creative class — people who are knowledge‐based workers. So transit helps people get to work on time, it gives more options to people who have mobility challenges, and it is now seen in the development community as a very important amenity that they want to build in.”4
3 A non‐partisan, non‐profit organization focused on being a source of new ideas on how Michigan's people, enterprises and communities can succeed in the Information Age
4 The (Racine) Journal Times On Line, January 2007 interview with Shelley Poticha, President/CEO Reconnecting America a national non‐profit organization that is working to integrate transportation systems and the communities they serve,.

Report of the Intermodal Passenger Transportation Subcommittee
Section One: Local Transit, Intercity Bus and Passenger Rail One‐12
Local Bus System Benefits Two recent studies report the economic benefits of largely bus‐based local transit systems that currently exist in Michigan. A study published in May 2006, developed a benefit‐cost analysis to evaluate various levels of state investment in transit services in Wisconsin.5 The study was commission by the Wisconsin Department of Transportation to judge the present value of benefits of transit in fours areas (healthcare; employment; education and retail, tourism and recreation) against the present value of operating and capital costs. The study included an estimation of the relationship between public funding to the level of transit service and subsequently transit ridership, a key determinant of transit benefits. The study calculated a return on investment in Wisconsin transit of between 6:1 and 6.5:1 over the study period of 2005‐2024. This study was based on the Wisconsin transit system as it existed in 2004. In 2004, Wisconsin had about 70 transit agencies with services that ranged from commuter rail, serving large metropolitan areas, to shared‐ride taxi service in small communities. Operating and maintenance costs totaled $251.5 million, with over 39 percent ($98.6 million) of those costs funded by the state. The scope of Wisconsin’s system is comparable to Michigan’s existing local transit, with the exception of commuter rail. Based on a recent Florida State University study, investments in bus‐based transportation services for the transportation‐disadvantaged, such as Michigan’s specialized services program, program, yields an 852 percent return on investment.
Local Rail System Benefits While there are economic benefits for Michigan’s current system, more significant economic benefits can result from expanding Michigan’s passenger transportation system to include local and regional rail. A 2006 study 6 investigated the impacts of rail transit on urban transportation system performance. In the study, U.S. cities7 were divided into three categories:
5 The Socio‐Economic Benefits of Transit in Wisconsin Phase II: Benefit Cost Analysis, May 2006, HDR/HLB Decision Economics Inc. 6 Rail Transit In America: A Comprehensive Evaluation of Benefits. August 2006. By Todd Litman, Victoria Transport Policy Institute. Produced with support from the American
Public Transportation Association

Report of the Intermodal Passenger Transportation Subcommittee
Section One: Local Transit, Intercity Bus and Passenger Rail One‐13
1. Large Rail – Rail transit is a major component of the transportation system. 2. Small Rail – Rail transit is a minor component of the transportation system. 3. Bus Only – City has no rail transit system.
When these groups are compared, large rail cities are found to have significantly better transport system performance. When compared with bus‐only cities, large rail cities have:
400 percent higher per capita transit ridership 14 percent lower per capita consumer transportation expenditures 19 percent smaller portion of household budgets devoted to transportation 33 percent lower transit operating costs per passenger‐mile 58 percent higher transit service cost recovery
These benefits cannot be attributed entirely to rail transit. They partly reflect the larger average size of large rail cities. But taking size into account, cities with large, well‐established rail transit systems still perform better in various ways than cities that lack rail systems. These benefits result from rail’s ability to help create more accessible land use patterns and more diverse transport systems. Although large rail cities have higher per capita congestion costs, this occurs because congestion tends to increase with city size. Taking city size into account, rail transit turns out to significantly reduce per capita congestion costs. Matched pair analysis indicates that Large Rail cities have about half the per capita congestion costs as other comparable size cities. The study acknowledged that U.S. rail transit services requires significant annual public subsidy. However, it also noted that the economic benefits — in terms of congestion cost savings, parking cost savings and consumer cost savings — more than repay the subsidies. Rail transit also tends to provide economic development benefits, increasing business activity and tax revenues. It can be a catalyst for community redevelopment. Additional, potentially large benefits include improved mobility for non‐drivers, increased community livability and improved public health. The study concluded that rail transit provides significant benefits, particularly if implemented with supportive
7 Seven U.S. cities were classified as “Large Rail,” meaning that more than 20 percent of commutes are by transit, and more than half of transit passenger‐miles are by rail Large
Rail: New York, Washington DC, Boston, San Francisco, Chicago, Philadelphia, Baltimore. Small Rail cities included: Pittsburgh, Seattle, Atlanta, Buffalo, NY, New Orleans,
Cleveland, Portland, Los Angeles, St. Louis, Miami, Denver, Dallas‐Fort Worth, Sacramento, San Diego, San Jose, Salt Lake City.

Report of the Intermodal Passenger Transportation Subcommittee
Section One: Local Transit, Intercity Bus and Passenger Rail One‐14
transport and land use policies. In many situations, rail transit is the most cost‐effective way to improve urban transportation. Other reports and data which speak to the economic benefits of rail transit investment include:
The American Public Transportation Association has reported benefit to cost ratios for specific transit projects as high as 9:1.
A 2003 University of North Texas study showed that Dallas Area Rapid Transit (DART) rail stations added value to nearby properties, particularly residential and office. According to the study, office properties near suburban DART rail stations increased in value 53 percent more than comparable properties not served by rail, and values of residential properties rose 39 percent more than a group of control properties not served by rail. Between 1997 and 2001, the mean value of 47 office properties near DART increased 24.7 percent, compared with an increase of 11.5 percent for 121 properties not near the stations, giving the DART office buildings the 53 percent advantage. The mean value of 3,262 residential properties near DART increased 32.1 percent versus an increase of 19.5 percent in the mean value of 4,393 properties not near the stations, for the 39 percent advantage, the study found.8
According to the Urban Land Institute, residential properties for sale near commuter rail stops in California consistently enjoy price premiums. 9
In Denver, Colorado, new light rail corridors are yielding the following development benefits: • 10,999 residential units (7.5 percent growth) • 3,729 hotel rooms (17.6 percent growth) • 2.8 million square feet of retail (4.3 percent growth) • 4.0 million square feet of office space (7.2 percent growth) • 1.6 million square feet of government space • 2.3 million square feet of convention/sports space10
8 DART Light Rail.s Effect on Taxable Property Valuations and Transit‐Oriented Development, Prepared for Dallas Area Rapid Transit, University of North Texas Center for
Economic Development and Research, January 2003
9 Ibid
10 From “Transit‐Oriented Development Status Report 2007” RTD Fastracks, December 2007

Report of the Intermodal Passenger Transportation Subcommittee
Section One: Local Transit, Intercity Bus and Passenger Rail One‐15
A seven‐mile street car loop in Portland, Oregon has resulted in over $2.8 billion being invested within three blocks of service; over 7,200 new residential units have been built and more than 4.6 million square feet of new commercial development.11
In Boston, Massachusetts the first phase of its Silver Line Bus Rapid Transit line opened in July 2002. Since planning process began, over $450 million invested in commercial and residential development in the corridor.12
U.S. cities (including those with populations less than Detroit) have rail transit systems and are enjoying the economic benefits that Michigan cities are forgoing.
Light Rail Cities: Little Rock, Salt Lake City, Minneapolis, Los Angeles, Sacramento, San Diego, San Francisco, Santa Clara, Denver, Tampa, New Orleans, Boston, Baltimore, Minneapolis, Saint Louis, Charlotte, Newark, Buffalo, Cleveland, Portland, Philadelphia, Pittsburgh, Memphis, Dallas, Galveston, Houston, Seattle, Kenosha
Commuter Rail Cities: Anchorage, Los Angeles, Oakland, Oceanside, San Carlos, San Joaquin, Stockton, New Haven, Pompano Beach, Chicago, Chesterton (IN), Boston, Baltimore, Newark, Santa Fe, New York, Harrisburg, Philadelphia, Dallas, Alexandria, Seattle, Portland (ME)
Heavy Rail Cities: San Francisco, Cleveland, Anchorage, Los Angeles, Washington DC, Miami, Atlanta, Chicago, Boston, Baltimore, Jersey City, Lindenwold (NJ), New York, Philadelphia
Airports with Direct Rail Access: Atlanta, Baltimore, Chicago, Cleveland, Los Angeles, Minneapolis, New York, Newark, Philadelphia, Portland (OR), Saint Louis, San Francisco, South Bend, Washington
Intercity Passenger Rail Benefits 13 The expansion of intercity passenger rail will improve Michigan’s transportation system by reducing congestion on other modes and offering mobility options to travelers. It will also address important national goals related to climate change and energy use. National data indicate that passenger rail is more energy efficient than air and auto transport and that its expansion will reduce CO2 emissions, which contribute to global warming.
Intercity passenger rail can:
Relieve highway and airway congestion Improve public safety and air quality Reduce fuel consumption per passenger mile, potentially reducing the nation’s dependence on imported oil
11 From PowerPoint “Portland Streetcar Development Impacts” Richard Brandman, Deputy Planning Director, Metro, Portland, OR, December 2006
12 As reported on APTA website
13 Report prepared by the Passenger Rail Working Group for the National Surface Transportation Policy and Revenue Study Commission in December 2007.

Report of the Intermodal Passenger Transportation Subcommittee
Section One: Local Transit, Intercity Bus and Passenger Rail One‐16
Help mitigate the negative impacts of short or prolonged energy supply disruptions and energy price increases
Provide land use and travel pattern changes that could improve air and water quality, as well as aesthetic appeal
Provide mobility and economic development opportunities to smaller communities with little or no other access to public transport
Assure a redundant transportation mode for use in emergency situations Provide a mobility option for individuals who do not drive or fly
Quality of Life Benefits 14
Public transportation facilities and transportation corridors are “natural focal points for communities” that serve to encourage economic and social activities and help create strong neighborhood centers that are economically stable, safe, and productive.
When commuters ride public transportation or walk, their contact with neighbors tends to increase, which helps bring a community closer together.
Public transportation has a major impact on land use development patterns. In many situations, improved accessibility can stimulate development location and type. As a strategy in relieving congestion, public transit can be more effective with policies and actions that expand transit‐oriented development or provide for mixed‐use and pedestrian design in development of major public transportation corridors.
Transit‐friendly, walkable communities reduce reliance on cars and promote higher levels of physical activity.
Environmental Benefits 15
Using only half the fuel burned by cars, SUVs and light trucks per passenger mile, public transit saves the nation 45 million barrels of oil each year — enough to heat, cool and operate one‐fourth of its households — and spares the atmosphere from
14 Unless otherwise noted, APTA Website 15 Conserving Energy and Preserving the Environment: The Role of Public Transportation,' commissioned by the American Public Transportation Association.

Report of the Intermodal Passenger Transportation Subcommittee
Section One: Local Transit, Intercity Bus and Passenger Rail One‐17
another 745,000 tons of carbon monoxide (CO), 7.4 million tons of carbon dioxide (CO2) and large volumes of other pollutants. If Americans took transit for their daily needs at the European rate of roughly 10 percent, they would secure much greater economic and air quality benefits and cut reliance on foreign oil by more then 40 percent, which is almost equivalent to the annual import amount from Saudi Arabia.
Congestion Mitigation 16
Public transportation helps alleviate congestion on our nation’s increasingly crowded network of roadways. According to the 2007 Texas Transportation Institute (TTI) Annual Urban Mobility Report, public transportation reduces traffic delays and costs in America’s urban areas. The study also found that public transportation services in America’s most congested cities saved travelers 541 million hours in travel time. Without public transportation, travel delays would have increased 13 percent.
Leveraging Additional Federal Funds While funding constraints hold Michigan back from implementing rapid transit in urban areas, federal funds available for rapid transit are going to other states.
About $4.4 billion ‐ more than half of all federal funds spent on transit ‐ went to the six states that had the largest state investments.
Examples of recent Congressional allocations being made to other regions of the country include: • In Dallas, Texas, a Northwest/Southeast light rail project received $12 million in
FY2006; $80 million in FY2007 and $84 million in FY2008. • Two separate light rail corridor projects in Denver, Colorado metropolitan area,
received between $35 million and $80 million a year in each of FYs 2006, 2007 and 2008.
• In the Salt Lake City area, light rail bus rapid transit and commuter rail projects received in total $102 million in FY2008 New Start allocations.
• Light rail and commuter rail projects in Minnesota received nearly $64 million in FY2008 federal allocations.
16 APTA Website

Report of the Intermodal Passenger Transportation Subcommittee
Section One: Local Transit, Intercity Bus and Passenger Rail One‐18
Current State Funding
Comprehensive Transportation Fund (Also see Appendix A for more information about the CTF) Michigan has provided state funding for public transportation since the Comprehensive Transportation Fund (CTF) was created in the 1970s. The CTF supports debt service; MDOT operations and three major program areas as defined in Public Act 51 of 1951, as amended. As of January 2008, the total FY2008 CTF appropriation (adjusted for revenue projections as of January 2008) was $238,242,800. This included:
Debt Service/MDOT Operations ‐ $ 35,629,200 Local Transit Operating Assistance ‐ $166,624,000 Public Transportation Development‐ $19,382,500 Intercity (bus and rail) Passenger and (rail) Freight ‐ $13,792,900
Primary CTF revenue sources are: Gas taxes via Act 51‐mandated transfers from the Michigan Transportation Fund State sales tax on automotive‐related items
Local transit, intercity bus and passenger rail also are supported by the remaining proceeds from 2002 and 2003 CTF bond issues. These revenues are not included in this report, since bonding against the CTF is not considered a viable source of long‐term revenue. These modes, in particular local transit, also are supported by toll revenue credits. Toll revenue credits are also not included in this report, since they are not an actual source of funds and are limited in amount. (See Appendix A for more information on toll revenue credits).
State Transit Funding Throughout the U.S. State funding is critically important to transit in Michigan and elsewhere in the country. Collectively, the states spend more on transit than the federal government. According to the 2007 Survey of State Funding for Public Transportation, conducted on behalf of the American Association of State Highway Officials, the American Public Transportation

Report of the Intermodal Passenger Transportation Subcommittee
Section One: Local Transit, Intercity Bus and Passenger Rail One‐19
Association and the U.S. Department of Transportation, in 2006, states provided $11.1 billion in transit funding, while federal funds totaled $8.1 billion. The 2007 survey results indicated that total transit funding by state varies widely across the nation, ranging from zero dollars in funding to $2.573 billion. Three states—Alabama, Hawaii, and Utah—do not fund transit at the state level. On the other hand, states such as New York, California, Massachusetts, New Jersey, Pennsylvania, Maryland, and Illinois, among others, have made large state investments in transit ranging from $489 million to $2.573 billion. The six largest contributors — New York, California, Massachusetts, New Jersey, Pennsylvania, and Illinois — collectively allotted $8.2 billion in state funding, while the remaining 45 allotted $2.9 billion. In terms of total state funding, Michigan ranked 12th in the U.S. in 2006 with $200 million.
In terms of per capita funding levels, Michigan ranked 16th in 2006 at $19.91 per capita. However, many of the 15 states ahead of Michigan make a considerably larger annual investment, ranging from $20.41 to $364.81 per capital, with an average of $92.6.
The most utilized sources for state transit funding are:
Gas taxes (used by 19 states) General funds (used by 12 states) Bond proceeds (used by 10 states) Motor vehicle/rental car sales taxes (used by 10 states) General sales taxes (used by nine states) Registration/license/title fees (used by 10 states), and Interest income (used by six states).
Investment Scenarios This section provides an overview of three possible investment scenarios for local transit, intercity bus and passenger rail — continuing the current investment levels, a good investment level and a better investment level. Information about the federal funds that will or may be leveraged at each investment level is also provided.
Report of the Intermodal Passenger Transportation Subcommittee
Section One: Local Transit, Intercity Bus and Passenger Rail One‐20
Assumptions for Investment Scenarios The current investment is based on the FY2008 CTF appropriations (adjusted for revenue projections as of January 2008). CTF revenues are projected to remain static or decline in future years. The current federal funds are those leveraged by CTF appropriations. Federal funds leveraged by nearly exhausted CTF bond revenues or toll revenue credits are not included. The “Good” and “Better” investment levels in this report were developed by the Michigan Department of Transportation (MDOT) Bureau of Passenger Transportation, in consultation with representatives from each mode. They represent the average annual investment needed for the period of FY2009 to FY2013. MDOT recently completed its long range transportation plan —MI Transportation Plan: Moving Michigan Forward (MITP). The MITP guided MDOT in determining the level of “Good” and “Better,” MDOT was guided by in two ways. First, during development of the MITP, more than 3,000 Michigan residents told us what they wanted in a future transportation system. Another 2,600 participated on‐line. Some 3,300 households were called, an economic advisory group was consulted, and 42 stakeholder groups weighed in. What the public told us is this: “we want more travel choices.” Specifically, the “Preferred Transportation Vision” includes the following statement: The transportation system in 2030 will be responsive to the public’s demand for more transit and non‐motorized choices. Second, the recommended investments in the passenger transportation system are focused on these four goals from the MITP:
Stewardship: Preserve transportation system investments, protect the environment, and utilize public resources in a responsible manner.
System Improvement: Modernize and enhance the transportation system to improve mobility and accessibility.
Efficient and Effective Operations: Improve the efficiency and effectiveness of the transportation system and transportation services and expand MDOT’s coordination and collaboration with partners.
Safety and Security: Continue to improve transportation safety and ensure the security of the transportation system.

Report of the Intermodal Passenger Transportation Subcommittee
Section One: Local Transit, Intercity Bus and Passenger Rail One‐21
In determining the level of “Good” and “Better” investment, the following decision‐principles were used:
Consistent the MITP “Preferred Transportation Vision” and its goals, a good level of investment should preserve, modernize and expand the passenger transportation system to provide users with increased transit options. Specifically, a good level of investment should: • Support the introduction of regional/rapid transit systems in Michigan’s urban
areas that will yield significant economic and environmental benefits. • Maintain and expand passenger rail services. • Ensure continuation of existing intercity bus services. • Ensure existing local bus services and infrastructure are maintained • Ensure all available federal funds are captured.
A better level of investment should expand the system further and capture even more federal funds. In addition, it should provide for an expanded passenger transportation system even in the absence of federal grants, by providing for 100 percent state investment to expand and modernize key components of the system when federal funds are not available.
State versus Local Revenues The “Good” and “Better” scenarios include needs that could — in the future — be met with a combination of state and/or local revenues. However, if the needs are to be met with local revenues, changes to state law might be needed for the local funds to be generated, which is why they are included in this report. In Michigan, the CTF plays a role in funding capital costs that in other states is played by local or regional revenue tools, in particular local or regional sales taxes, that are not currently possible in Michigan. The role of the CTF is similar a mechanism used in California. In FY2006, California was one of only three states that claimed an annual state investment of over $1.0 billion in public transit. Nearly 60 percent of California’s $2.2 billion state investment was ¼ cent of the 7¼ cent retails sale tax flowing through a “local transit fund.” Revenues are collected by the state and returned to each county according to the amount collected by that county and as such could be characterized as local revenues or state revenues. In selecting revenue mechanisms Michigan will use in the future, both state and local tools should be considered.

Report of the Intermodal Passenger Transportation Subcommittee
Section One: Local Transit, Intercity Bus and Passenger Rail One‐22
Investment Scenarios Overview
PASSENGER TRANSPORTATION ‐ TOTAL POSSIBLE PROGRAM State Program and Maximum Federal Funds Leveraged
Current/Do Nothing (Declining Revenues) Good Better
State Program $192,890,000 $507,636,734 $778,635,112 Maximum Federal Funds
Leveraged $47,866,700 $265,095,000 $557,295,000
TOTAL PROGRAM $240,756,700 $772,731,734 $1,335,930,112
AVERAGE ANNUAL PROGRAM (FY2009 - FY2013) - PASSENGER TRANSPORTATION(Local Transit, Intercity Bus, Passenger Rail)
$778.6M
$507.6M
$192.9M
$47.9M
$192.4M
$177.3M
$78.2 M
$307.0M
$9.6 M
$57.9 M
$0$2
00$4
00$6
00$8
00$1
,000
$1,2
00$1
,400
Current Good Better
in m
illio
ns
Leveraged Federal Funds - ProposedLeveraged Federal Funds - Potential/ CompetitiveLeveraged Federal Funds - Existing/FormulaState Funds
$1.3 B
$773 M
$241 M
Explanation of Federal Funds Leveraged: Some state revenues leverage federal funds, and when they do, the total program is increased. For the good and better scenarios, the total size of the program will depend on whether the federal funds can be leveraged. Three “categories” of federal funds are shown in the chart above.
Existing/Formula ‐ Federal transit funds apportioned or earmarked to Michigan every year and are generally predictable. With increased state revenues, leveraging these federal funds is nearly certain. Generally, federal funds are assumed to be provided for 80 percent of the total project cost.
Potential/Competitive ‐ Federal funds transit providers can seek Congressional earmarks and then compete for FTA approvals. Availability of state revenues to match the federal funds is an essential factor in competing for the funds, however increased state revenues does not ensure the federal funds will be awarded.
Proposed ‐ Within the intercity passenger rail area, there are new federal funding programs that are being discussed within Congress, but for which there may not yet be an identified federal funding source and/or authorizing legislation. While it is prudent to determine the state revenues needed to effectively compete for these federal funds when they become available, in the absence of additional federal action, the state revenues will not actually leverage federal funds. Federal funds are assumed to be provided for 50 percent of the total project cost.

Report of the Intermodal Passenger Transportation Subcommittee
Section One: Local Transit, Intercity Bus and Passenger Rail One‐23
The results of each of investment scenario are somewhat generalized because no single entity directly or completely controls the final investment decisions. The final system outcomes that will result from each investment scenario, such as service reductions under “current” revenues or service expansions under “Good” or Better,” will be the cumulative result of the priorities established by local and state governments, decisions made by individual providers (local transit agencies, intercity bus companies, etc.,) and the local and federal revenues available to supplement the state revenues. Therefore, the scenarios outline what is possible at each investment level; however the final system outcomes will depend on the priorities, policies and decisions yet to be made.
Current Investment Level (i.e., Do Nothing) Due to CTF revenue constraints, the current level of investment will not be sufficient to maintain the existing passenger transportation systems at a time when demand and ridership are at record highs. As costs increase faster than revenues, the following will result:
Reductions in local transit services (while ridership demands are increasing) • The average state share of operating costs falls each year to less than 20
percent by 2013 (down from 35 percent in 2008, down from 43 percent in 2000).
Intercity passenger rail service will be lost (while ridership demands are increasing) • Current revenues are projected to cover less than 60 percent of the cost of
maintaining the existing intercity passenger rail network through FY2013. • The increased costs of maintaining MDOT contracts for passenger rail service
— as has been projected by Amtrak — cannot be supported. • Infrastructure improvements needed to maintain existing system
performance will not be possible, because Michigan will not be able to provide the match to access federal funds being proposed by Congress.

Report of the Intermodal Passenger Transportation Subcommittee
Section One: Local Transit, Intercity Bus and Passenger Rail One‐24
Rural intercity bus service will be lost • Current revenues are projected to cover less than half the cost of maintaining the
existing intercity bus network through FY2013. MDOT will have to reduce the number of intercity bus routes under contract.
• Intercity bus motor coaches will not be replaced in a timely manner, starting in FY2009. Failure to replace buses when they become eligible increases the operating costs of the carriers and subsequently increase state costs to maintain existing route service.
Rapid/regional transit in Michigan’s urban areas will not be possible • The CTF cannot provide the matching funds or operating assistance needed
for Michigan to access federal grants for several projects that have or are close to receiving federal approval.
Replacement of aging transit buses with more fuel efficient/lower emission models and modernization of passenger facilities will slow down • Michigan will no longer be able to leverage annual federal capital grants that are
the primary source of maintaining and modernizing the existing transit infrastructure.
• Current revenues are projected to cover less than one‐third of the matching funds needed through FY2013.
Only minor maintenance will be possible for some of the 44 terminals/ stations that serve intercity bus and/or passenger rail. No new terminals/stations will be supported with state funds.
Federal Funds will be lost. • For each dollar in state funds provided for local transit capital, the federal
government provides a four dollar match. • Congress is considering new passenger rail capital programs that will provide a
one‐to‐on match for state investments • Insufficient state funds will result in federal funds being left on the table for
local transit and passenger rail.
Report of the Intermodal Passenger Transportation Subcommittee
Section One: Local Transit, Intercity Bus and Passenger Rail One‐25
Good Investment Level
Local bus agencies will be able to maintain and potential expand and enhance services with more stable state operating assistance.
Four new rapid and/or regional transit projects necessary for Michigan cities to be economically competitive with other metropolitan areas will be able to proceed. They include: • Bus rapid transit in the Grand Rapids area • Light rail transit in the Woodward Avenue corridor • Commuter rail (demonstration) between Ann Arbor to Detroit • Commuter rail between Ann Arbor and Howell
Michigan will enjoy the economic and environmental benefits associated with rail transit in its urban areas.
Intercity bus services that are dependent on state financial assistance will be maintained, with sufficient revenue to respond to increasing costs.
Intercity passenger rail services that are dependent on state contracts will be maintained, with sufficient revenues to respond to increasing contract amounts based on recent cost estimates provided by Amtrak (not yet accepted by MDOT).
Intercity passenger rail service will be expanded by doubling both capacity and frequency over 10 years, assuming 100 percent state funded operations and 50 percent state funded capital (at 50 percent assuming a federal program were established).
One moderate intercity bus terminal project and one moderate intercity passenger rail station (new facility or major reconstruction) will be possible every two to three years.
ADA improvements at selected passenger rail platforms will enhance intercity passenger services.

Report of the Intermodal Passenger Transportation Subcommittee
Section One: Local Transit, Intercity Bus and Passenger Rail One‐26
Transportation services that are targeted at Michigan’s senior population (which will double over the next 25 years) will be expanded through increases funding for the State’s specialized services program.
Alternatives to single‐car commuting will be expanded through rideshare and vanpool programs.
Better Investment Level
Existing local bus services will be maintained and expanded. Provides sufficient revenues to support: • Increase use of low emission/alternative fuel vehicles • Increase use of customer information technologies • More county‐wide bus systems to assist with cross‐county access for work
and medical trips
Significantly expanded rapid transit in Michiganʹs urban centers is made possible with state operating assistance and capital match. This investment level leverages between $160 million/yr and $320 million in additional (above “Good”) “potential” federal funds (at 80/20), including the option of overmatching federal grants to make selected Michigan projects more competitive for federal funding.
Development of rapid/rail transit in corridors that may not be federally competitive, through 100 percent state funds (up to $70 million a year) for rapid/rail transit projects.
All existing intercity bus services will be maintained including the possibility that the state may need to respond to additional private sector abandonment by putting portion of a southern Michigan route under state contract.
Modern intercity passenger facilities with the ability for one large or several moderate‐to‐small intercity bus terminal projects a year, including park and ride lots that serve intercity passenger and one large or two moderate intercity passenger rail stations a year.

Report of the Intermodal Passenger Transportation Subcommittee
Section One: Local Transit, Intercity Bus and Passenger Rail One‐27
Innovative public/private partnerships for shuttle bus services that provide new regional transportation options, including intermodal connections.
Significantly enhanced intercity and interstate passenger rail service, including investments made by other Midwestern states, to resolve congestion/bottlenecks that limit the effective of Michigan passenger rail service.
Expansion of targeted services for the elderly, persons with disabilities and low‐income workers, through increased state investment and leveraging additional federal funds.

Report of the Intermodal Passenger Transportation Subcommittee
Section One: Local Transit, Intercity Bus and Passenger Rail One‐28
Mode-by-Mode Analysis: Local Transit, Intercity Bus and Passenger Rail Additional Information on CTF programs that supports each mode can be found in
Appendix A.
Maps depicting existing service levels for each mode are provided in Appendix B
Local Transit Local transit systems served 94 million passengers in FY2007, providing access to jobs, medical care, education, shopping, recreation, and other needed services. At this time, local transit in Michigan consists of community and county level bus systems, several multi‐county bus systems, one fixed guideway system (the Detroit People Mover) and many small non‐profit services that provide targeted (often client‐based) services for the elderly and persons with disabilities. In the future, local transit will include bus rapid transit, light rail and/or commuter rail at the community, county or regional level. The needs of both the current system and the future system are covered. The current and needed state revenues for LOCAL TRANSIT are as follows: Current Local Transit: $184.3 million in state revenues leveraging $45.7 million in federal funds.
Good Local Transit: $448.4 million in state revenues; leveraging between $174.8 and $253 million in federal funds
Better Local Transit: $692.9 million state revenues, leveraging between $189.9 million and $496.9 million in federal funds

Report of the Intermodal Passenger Transportation Subcommittee
Section One: Local Transit, Intercity Bus and Passenger Rail One‐29
$692.9M $448.4M
$184.3M
$189.9M
$174.8M
$45.7M
$307M
$78.2M
$0
$200
$400
$600
$800
$1,000
$1,200
Current Good Better
in m
illio
ns
Leveraged Federal Funds - Potential/Competitive
Leveraged Federal Funds - Existing/Formula
State Funds
$1.19B
$701.4M
$230M
AVERAGE ANNUAL PROGRAM (FY2009 - FY2013) - LOCAL TRANSIT
Each scenario is described further below.
Current Local Transit Investment
$184.3 Million in State Revenues Leveraging $45.7 Million in Federal Funds
On annual basis, the results of the current level of investment include:
Reductions in local transit services in response to declines in state assistance levels. The largest portion of operating assistance is the Act 51 mandated state operating assistance for 79 local transit agencies. In FY 2008, transit agencies providing service in urbanized areas over 100,000 population are receiving 31 percent of their eligible expenses and urbanized areas under 100,000 population and nonurbanized areas are receiving 36 percent of their eligible expenses. The average — 36 percent in 2007 — is down from 54 percent in 1998. With local costs increasing between five and nine percent each year (increased fuel and health insurance costs; expansion of local services and the entrance of additional eligible agencies) at the current funding level the state’s share in operating local transit systems will continue to fall and could fall to less than 20 percent by 2013.

Report of the Intermodal Passenger Transportation Subcommittee
Section One: Local Transit, Intercity Bus and Passenger Rail One‐30
LOCAL TRANSIT OPERATING ASSISTANCE CURRENT AND PROJECTED STATE SHARE
AT CURRENT REVENUE LEVELS
48.90%41%
33.48% 32.52%28.44%
23.94%18.49%
58.68%
49.13%
39.91% 38.62%34.13%
28.73%22.18%
0.00%10.00%
20.00%30.00%40.00%50.00%
60.00%70.00%
1998 2000 2005 2007 2008 2010 2013
Urban Nonurban
1998 - 2007 actual; 2008 - 2013 projected
Transit buses will not be replaced when they reach their useful life, passenger facilities will not be upgraded and expanded, new technologies will not introduced, and preventative maintenance will be reduced. All because at current CTF revenue levels, Michigan will begin to lose federal funds needed to maintain the existing transit infrastructure. Prior to FY 2005, MDOT was able to provide the 20 percent local match for all federal transit funds using CTF revenues, but with increased federal funds coming to Michigan under TEA‐21 and SAFETEA‐LU and constrained CTF revenues, the CTF has not been able to keep up with federal match obligations. The CTF’s match obligations for FY2008 were $30 million, as compared to the CTF appropriation of $10.3 million. This represents an annual shortfall in the CTF that has been masked with bond proceeds and toll revenue credits. (See Appendix A for more information.)
Several regional, rapid transit projects that have or are close to receiving FTA approval will not be able to proceed because the CTF cannot provide the match needed to access federal grants. Federal funds will continue to go to other states.
Report of the Intermodal Passenger Transportation Subcommittee
Section One: Local Transit, Intercity Bus and Passenger Rail One‐31
Good Local Transit Investment
$448.4 Million in State Revenues; Leveraging Between $174.8 and $253 Million in Federal Funds
On an annual basis, this level of investment will result in the following:
Local bus transit operators will be able to maintain and enhance services and infrastructure, including increased service frequency, expanded service areas and/or increased use of alternative fuel technologies and information technologies to provide better customer information. • The “Good” level of investment immediately increases the amount of state
funding available for transit operating assistance (to the 50 and 60 percent maximums allowed for in Act 51). However, it assumes operating costs will grow 5 percent a year, which is a low growth rate when compared to rising fuel and labor costs and the increased demand for transit services. Over time, the good level of investment is not likely to not sustain an increased state share of operating costs.
• The “Good” level of investment ensures matching funds are available to access the federal grants that provide for routine replacement and modernization of the existing transit infrastructure.
Michigan’s largest urban areas will be economically competitive with other metropolitan areas through the introduction of rapid, regional transit to the State. By matching federal funds and providing state operating assistance, the following projects will be able to proceed: • New rapid transit in the Grand Rapids area, an FTA‐approved project • New light rail transit being planned by the Detroit Department of
Transportation for Woodward Avenue corridor between the State Fairgrounds to the Central Business District
• New commuter rail (demonstration) between Ann Arbor to Detroit, scheduled for start up in 2010 as a first step to accessing $100 million in federal funds allocated to the project under SAFETEA‐LU.
• New commuter rail between Ann Arbor to the Howell area being planned by local and regional officials with MDOT assistance.

Report of the Intermodal Passenger Transportation Subcommittee
Section One: Local Transit, Intercity Bus and Passenger Rail One‐32
Public transportation services aimed at the Michigan’s aging population will increase via expansion of the specialized services program and growth of the program it at a level that will keep up with increases in Michigan’s senior population. Funding for this program has been relatively static and MDOT has not conducted an unmet needs assessment. For a “Good” level of investment, the size of this program will be brought into line with the overall CTF program, using the federal Section 5310 program as a benchmark.
Continuation, restoration and possible expansion of programs aimed at proving commuting alternatives. • Continuation of MDOT’s vanpool program including replacement of federal
CMAQ funds (which are currently funding operations as a demonstration project) with state funds. If federal funds continue past the demonstration period, allows for expansion of the vanpool program into non CMAQ‐eligible areas, to help meet an increasing demand for van pool services in smaller urban and rural areas.
• Restoration of the rideshare program (which was lost due to CTF cuts in FY2005) to supplement the limited federal funds currently available, allowing for placement of rideshare offices in non‐CMAQ eligible areas and to expand the role of rideshare offices to include mobility management services for local transit providers.
Increase transportation to work services aimed at low‐income individuals by providing the matching funds needed to leverage an average of $6 million/year in federal funds available.
Better Local Transit Investment
$692.9 Million State Revenues, Leveraging Between $189.9 Million and $496.9 Million in Federal Funds.
On an annual basis, this level of investment will:
Spur growth of existing transit systems to provide countywide transit in every county needed to achieve seamless public transportation objectives. This level of investment will ensure a stable and predictable state share of operating expenses for Michigan’s 79 existing transit systems. The “Better” scenario,

Report of the Intermodal Passenger Transportation Subcommittee
Section One: Local Transit, Intercity Bus and Passenger Rail One‐33
includes the revenues to support a nine percent annual growth rate in eligible transit expenses, thus providing greater funding stability needed to spur growth. While the “Better” scenario provides for a higher annual growth rate in expenses than the “Good” scenario, it could still be understated. With the rising demand for transit services, an increase in state assistance levels could lead to an unprecedented growth in existing systems.
Expand/enhance the infrastructure of existing transit systems, including increased use of innovative technologies and expansion to countywide transit throughout state via increased ability to match federal funds.
Provide for rapid transit in Michiganʹs urban centers. The rapid/regional transit projects provided for under the “Good” scenario are the furthest along in the planning process and will represent significant progress. However, to remain economically competitive, Michigan must expand transit services beyond those four projects. Since the cost of building and operating a state‐of‐the‐art transit system in all urban centers has not been determined, the needs of a “Better” scenario are being represented by range of the costs outlined in the SEMCOG’s 2001 Framework for Action. This 2001 transit plan outlined the costs of bringing 259 miles of rapid transit on 12 regional corridors, with associated bus support service, to southeast Michigan. • The “Better” scenario leverages between $160 million and $320 million a year
in additional (above “Good”) “potential” federal funds (at 80/20), and provides sufficient revenue to overmatch some federal grants to make Michigan projects more competitive for federal funding. [Note: the “Better” scenario includes providing the match for the four projects under “Good” and for the proposed system for “Better” come to fruition within the same timeframe.]
• The “Better” scenario also provides 100 percent state funds (up to $70 million a year) for rapid transit in corridors that may not be federally competitive.17 Experiences in other regions of country indicate some portion of a regional rapid transit system will have to be constructed without federal funds, either to demonstrate feasibility and make the project more competitive for federal funds or to complete portions of the system that may not meet strict federal criteria.
17 Assuming, 10 miles of rapid transit over 5 year. While costs vary widely from system to system , $35 m per mile for LRT is a much used figure

Report of the Intermodal Passenger Transportation Subcommittee
Section One: Local Transit, Intercity Bus and Passenger Rail One‐34
New vessels for each of the two marine passenger systems by providing a portion of the match (10 percent) to “potential” federal grants; leveraging $17 million in federal (competitive program) and local funds.
For services to targeted populations, expands Transportation to Work program by 30 percent, either as overmatch to federal funds or as a supplemental state program and matches/leverages additional federal funds (an average of $3.9 million a year in the federal “New Freedom” program)
INTERCITY BUS Intercity bus provides essential transportation services for significant segments of our population, including students, families, and seniors, and prevents isolation of small and medium sized communities. Prior to deregulation in 1982, 11 major carriers provided intercity bus service to more than 550 Michigan communities. Today, there are only three carriers, (including the new Megabus.com express service) serving 120 communities. The current and needed state revenues for INTERCITY BUS are as follows: Current Intercity Bus: $2.2 million in state revenues leveraging up to $2.2 million in federal funds.
Good Intercity Bus: $5.1 million in state revenues; leveraging up to $2.5 million in federal funds
Better Intercity Bus: $8.7 million state revenues, leveraging up to $2.5 million in federal funds (Note: Federal Funds for intercity bus are limited. Additional state funds are not expected to leverage additional federal funds.)

Report of the Intermodal Passenger Transportation Subcommittee
Section One: Local Transit, Intercity Bus and Passenger Rail One‐35
$2.2M
$5.1M
$8.7M
$2.2M
$2.5M
$2.5M
$0
$2
$4
$6
$8
$10
$12
$14
Current Good Better
in m
illio
ns
Leveraged Federal Funds - Existing/Formula
State Funds
$11.2 M
$7.6 M
$4.4 M
AVERAGE ANNUAL PROGRAM (FY2009 - FY2013) - INTERCITY BUS
Each scenario is described further below.
Current Intercity Bus Investment
$2.2 Million in State Revenues Leveraging up to $2.2 Million in Federal Funds On an annual basis, the current level of investment results in the following:
Reduction in intercity bus services. • The current revenue levels will not support the increased cost of maintaining
existing state contracts for intercity bus service. All five current intercity service contracts will be rebid in FY2009. In the absence of sufficient revenues to maintain all five routes, the state will need to reduce the number of routes under contract with a resulting loss of service to rural Michigan communities.
• Current revenues will not support routine replacement of all 30 motor coaches that support 2.8 million miles of scheduled route service a year and help stabilize the private intercity bus system in Michigan. Current revenue projections indicate the funds available for motor coach replacements could be 1/5th the amount needed to replace motor coaches on a timely basis. Failure to replace motor coaches increases the operating costs of the carriers and subsequently increases state costs to maintain existing route service.

Report of the Intermodal Passenger Transportation Subcommittee
Section One: Local Transit, Intercity Bus and Passenger Rail One‐36
Only minor maintenance of some of the 44 terminals/stations that serve intercity bus and/or passenger rail. • The current revenue stream for intercity terminals (match federal funds when
available and for 100 percent state funded projects when federal funds are not available) has been greatly reduced in the last five years as constrained CTF revenues have been redirected to support local transit and intercity operations.
• The FY2004 CTF appropriation for intercity terminals was $2.8 million; the available FY2008 appropriation is $300,000. In prior years, CTF revenues were able to support intercity terminals that have had significant transportation and economic development benefits.
• Prior year investments included the new intermodal passenger facility in Grand Rapids where a $2.5 million investment of CTF intercity terminal funds was combined with other state and federal funds as part of a $22.7 million project. The CTF also invested in a major renovation/expansion of a historic train station/ intermodal bus terminal in Kalamazoo, where a $2.0 million CTF intercity terminal investment was combined with other state and federal funds as part of a $13 million project.
• Due to CTF revenue reductions, the only terminal projects proceeding at this time are those scheduled to be completed with remaining 2002/2003 CTF bond proceeds.
Good Intercity Bus Investment
$8.7 Million in State Revenues; Leveraging up to $2.5 Million in Federal Funds On an annual basis, this level of investment will:
Preserve existing state supported intercity bus services, including sufficient revenue to maintain all current contracts that provide for over one million miles of scheduled route service. At the “Good” investment level, revenues will support an eight percent increase in operating costs per year.
Ensure routine replacement of 30 motor coaches that support an additional 2.8 million miles of scheduled route service a year.
Restore the intercity terminal program with the potential for one moderate terminal project (new facility or major reconstruction) every two to three years.

Report of the Intermodal Passenger Transportation Subcommittee
Section One: Local Transit, Intercity Bus and Passenger Rail One‐37
Better Intercity Bus Investment
$5.1 Million in State Revenues; Leveraging up to $2.5 Million in Federal Funds
This level of investment will provide:
Preserve all existing intercity bus service via one of the following: • Ability to maintain existing state contract routes if costs escalate at higher than
eight percent per year, or • Ability to respond to additional private sector abandonment by putting portion
of a southern Michigan route under state contract.
Ability to add two to four motor coaches to the state supported fleet.
Expansion of the intercity terminal program, with the ability for one large or several moderate‐to‐small terminal projects (including park and ride lots with passenger facilities) every year.
New program to provide capital assistance to innovative public/private partnerships for shuttle bus services that provide new regional transportation options, including modal connections.
INTERCITY PASSENGER RAIL Intercity passenger rail services between Grand Rapids and Chicago (Pere Marquette), Port Huron and Chicago (Blue Water), and Pontiac, Detroit and Chicago (Wolverine) link 22 southern lower Michigan communities to the Amtrak intercity rail system covering the United States. These services complement Michigan’s tourism industry, are important links for several of Michigan’s largest higher learning institutions, and provide the business traveler with an alternative to highway and air travel. MDOT contracts for the Pere Marquette and the Blue Water services. FY 2007 ridership on the Pere Marquette (Grand Rapids‐Chicago) was 104,819 and the ridership on the Blue Water (Port Huron Chicago) was 127,642 passengers. The Wolverine service, part of Amtrak’s national system, is comprised of a 283‐mile federally designated high
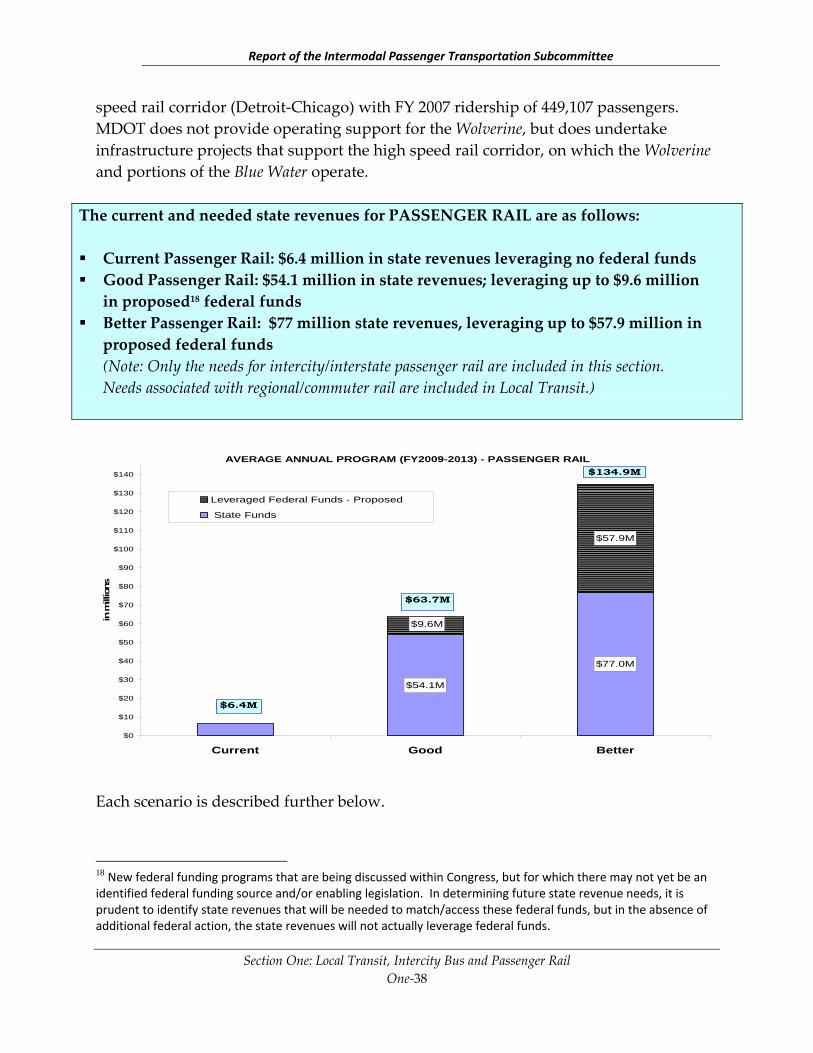
Report of the Intermodal Passenger Transportation Subcommittee
Section One: Local Transit, Intercity Bus and Passenger Rail One‐38
speed rail corridor (Detroit‐Chicago) with FY 2007 ridership of 449,107 passengers. MDOT does not provide operating support for the Wolverine, but does undertake infrastructure projects that support the high speed rail corridor, on which the Wolverine and portions of the Blue Water operate.
The current and needed state revenues for PASSENGER RAIL are as follows: Current Passenger Rail: $6.4 million in state revenues leveraging no federal funds Good Passenger Rail: $54.1 million in state revenues; leveraging up to $9.6 million in proposed18 federal funds
Better Passenger Rail: $77 million state revenues, leveraging up to $57.9 million in proposed federal funds (Note: Only the needs for intercity/interstate passenger rail are included in this section. Needs associated with regional/commuter rail are included in Local Transit.)
AVERAGE ANNUAL PROGRAM (FY2009-2013) - PASSENGER RAIL
$54.1M
$77.0M
$9.6M
$57.9M
$0
$10
$20
$30
$40
$50
$60
$70
$80
$90
$100
$110
$120
$130
$140
Current Good Better
in m
illio
ns
Leveraged Federal Funds - Proposed
State Funds
$134.9M
$63.7M
$6.4M
Each scenario is described further below.
18 New federal funding programs that are being discussed within Congress, but for which there may not yet be an identified federal funding source and/or enabling legislation. In determining future state revenue needs, it is prudent to identify state revenues that will be needed to match/access these federal funds, but in the absence of additional federal action, the state revenues will not actually leverage federal funds.

Report of the Intermodal Passenger Transportation Subcommittee
Section One: Local Transit, Intercity Bus and Passenger Rail One‐39
Current Passenger Rail Investment
$6.4 Million in State Revenues Leveraging No Federal Funds
On an annual basis, the current level of investment results in:
Loss of existing intercity passenger rail service • The increased costs of existing MDOT contracts with Amtrak for the Pere Marquette and Blue Water – as has been projected by Amtrak – will not be supported under the current revenue scenario.
• Some or all of the service to 14 Michigan communities with 232,000 passengers in FY2007 and providing connections to the national rail network in Chicago will be lost.
Only minor maintenance of some of 44 terminals/stations that serve intercity bus and/or passenger rail. • The current revenue stream for intercity terminals (match federal funds when
available and for 100 percent state funded projects when federal funds are not available) has been greatly reduced in the last five years as constrained CTF revenues have been redirected to support local transit and intercity operations.
ο The FY2004 CTF appropriation for intercity terminals was $2.8 million, whereas the available FY2008 appropriation is $300,000 (shared by intercity bus and passenger rail programs). The only rail station proceeding at this time is a new bus/rail facility in Pontiac which is dependent on remaining 2002/2003 CTF bond revenues.
The existing rail passenger infrastructure will not be maintained resulting in declining system performance.
Report of the Intermodal Passenger Transportation Subcommittee
Section One: Local Transit, Intercity Bus and Passenger Rail One‐40
Good Passenger Rail Investment
$54.1 Million in State Revenues; Leveraging up to $9.6 Million in Federal Funds
On annual basis, this level of investment provides for:
Preservation of existing state supported intercity passenger rail services, including increasing contract amounts based on recent cost estimates provided by Amtrak (but not yet accepted by MDOT).
One moderate intercity passenger rail station project every two to three years. Major station improvements totaling over $48 million (in current year funds) have been identified and include new stations for Dearborn; Troy; Jackson: Detroit/ New Center and Grand Rapids. This investment could also assist with ADA improvements that may be mandated at rail platforms. (Note: Federal funds are not readily available for intercity rail passenger stations.)
Expansion of the existing Michigan passenger rail service by doubling both capacity and frequency over ten years, assuming 100 percent state‐funded operations and 50 percent state funded capital (at 50 percent assuming a federal program were established). The result of this investment will be to: • Increase the Wolverine service from three round trips to six round trips and the
Pere Marquette from one round trip to two round trips and the Blue Water from one round trip by adding a second round trip between Port Huron and Kalamazoo. However, this level of investment does not resolve performance issues resulting from congestion in Indiana and Illinois.
• Leverage $7.0 million in proposed federal funds.
Preservation of the existing intercity passenger rail infrastructure (track, ITCS, etc.) to maintain existing system performance. $2.6 million a year to could leverage another $2.6 million in federal funds (at 50/50) if a federal program were established as being considered in Congress.
In the absence of a federal matching program to expand passenger rail service in Michigan, this level of investment might be needed to maintain existing passenger rail service in the state. Under Amtrak’s Strategic Pricing Initiative,

Report of the Intermodal Passenger Transportation Subcommittee
Section One: Local Transit, Intercity Bus and Passenger Rail One‐41
they would pass on that portion of the costs currently borne by Amtrak for intercity passenger rail service in Michigan to the state, increasing the state’s obligations by at least $20 million a year to maintain existing service levels.
Better Passenger Rail Investment
$77 Million in State Revenues; Leveraging up to $57.9 Million in Federal Funds
On an annual basis, this level of investment provides for:
One large or two moderate intercity passenger rail station projects a year. An additional $4.0 million a year (above the “Good” scenario) for major station improvements.
Implementation of Michiganʹs portion of the Midwest Regional Rail Initiative (MWRRI) over 10 years. The MWRRI has a travel time goal for the Wolverine
service in the range of 3.5 to 4.0 hours between Detroit and Chicago, which can be accomplished with a maximum speed of 110 mph. The projected ridership at that

Report of the Intermodal Passenger Transportation Subcommittee
Section One: Local Transit, Intercity Bus and Passenger Rail One‐42
speed is approximately 2.7 million passengers. This ridership growth is estimated based on natural growth and diversion of travelers away from the I‐94 corridor. The overall results would be significantly increased frequency, feeder bus service, high speed, and better on‐time performance.
Under the “Better” scenario, $55.3 million a year in state funds is available to leverage $55.3 million a year (50/50) in “proposed” federal funds (no existing federal program) to implement Michigan’s portion of the MWRRI. However, implementation of the MWRRI is also dependent on a sufficiently sized new federal program that all states in the region will access, resulting in system‐wide improvements. Improvements in Indiana and Illinois — funded with federal and state funds in those states — must be made for Michigan to achieve the results of the MWRRI. The initiative also assumes self‐supporting operations, which may not be valid.

Report of the Intermodal Passenger Transportation Subcommittee
Section One: Local Transit, Intercity Bus and Passenger Rail One‐43
Conclusions – Local Bus, Intercity Bus and Passenger Rail Current available state funding for Michigan’s local transit, intercity bus and passenger rail has not and will not keep pace with the needs of Michigan’s residents for transportation options and the needs of Michigan communities to compete for economic development. Status quo (current) investment is a recipe for a bleak future, highlighted by minimal multi‐modal connectivity and significant lost federal revenue. The current investment level provides limited transportation options, bankrupts state and local passenger transportation programs and increases congestion and pollution. Additionally it will not maximize the state’s unique character or sense of place in our communities, and creates little to no economic development/retention potential. To achieve the preferred transportation vision outlined or address the needs identified in the MI Transportation Plan and to reach the goals set forth in the plan, at minimum, a “good” level of investment is required. This will enable Michigan to modernize and expand the passenger transportation system to provide users with increased multi‐modal choices, including local public bus transit, local and regional rapid transit, and interstate rail. A “better” level of investment would move us even further along the multi‐modal spectrum, enabling Michigan to maintain a competitive advantage with other states.

Report of the Intermodal Passenger Transportation Subcommittee
Section Two: Carpool, Bicycle and Pedestrian Two‐44
SECTION TWO: CARPOOL PARKING LOT PROGRAM AND BICYCLE AND PEDESTRIAN TRANSPORTATION
Note: The dollar amounts in this section have been included in the
Highway Road and Bridge needs analysis, Section 5 of the Highway Road and Bridge Report. Carpool information is included in "Highway Other" and Bicycle and Pedestrian (non‐motorized) information
is folded into various roadway categories.
Carpool Parking Lot Program
Introduction The Michigan Carpool Parking Lot Program was initiated during the energy crisis of the early 1970’s, to provide safe and convenient parking facilities for Michigan carpoolers. With the establishment of this program, MDOT made a commitment to the conservation of limited energy resources while responding to the needs of the stateʹs travelers. Subsequent concern about air quality and congestion has led to continued program expansion and the systematic improvement of existing facilities. It is estimated that in 2006, the carpool lot program saved Michigan motorists 2.5 million gallons of fuel or approximately six million dollars. There are 231 carpool parking lots located across the state. Based on 2008 counts, approximately 3,900 vehicles park in these facilities on an average weekday; nearly 70 percent of the lots are located along congested routes, such as I‐75, I‐94, US‐23, and I‐96, in southern lower Michigan.
Investment Scenarios This section describes the current state investment level in the passenger transportation modes and describe the needs associated with a “good” and “better” level of investment.

Report of the Intermodal Passenger Transportation Subcommittee
Section Two: Carpool, Bicycle and Pedestrian Two‐45
Current Good Better
Preservation $600,000 $850,000 $1,350,000 Expansion $500,000 $1,000,00 $3,000,000 CMAQ $500,000 $500,000 $500,000
Intermodal X X
25 percent Contribution from transit agencies
Current Carpool Parking Lot Investment Level The current investment in carpool parking lots includes $600,000 for paving or repaving the existing lots across the state and $500,000 for carpool lot expansion. The preservation program resurfaces an average of 20 lots with 10 to 50 spaces per year. The expansion program constructs one or two lots per year in locations where real estate is readily available. At this level of funding, the state is unable to resurface existing large lots or construct new lots in developed areas. Ninety percent of the lots are currently rated “fair” to “good” however increases to the carpool lot fund are not keeping up with inflation. As a result, the condition of the carpool lot system will degrade if funding is not increased. There are not currently sufficient funds to purchase right of way for new lots in the locations where carpooling is in highest demand. According to 2008 usage counts, 27 lots were identified as either over capacity or approaching capacity (75 percent occupied or greater). It will not be possible to increase capacity at these lots at the current funding level. The program is increasingly reliant on Congestion Mitigation and Air Quality (CMAQ) funds for any new project in non‐attainment counties. In the following scenarios we assume that the CMAQ fund will continue to supplement the carpool lot program approximately $500,000 per year.
Good Carpool Parking Lot Investment Level In order to maintain a ‘good’ carpool lot network, an additional $250,000 is needed to improve the condition of eight of our lowest rated, small‐to medium‐sized, lots and $500,000 additional for right‐of‐way purchase and lot expansion at two lots in high‐demand areas that experience overflow parking.

Report of the Intermodal Passenger Transportation Subcommittee
Section Two: Carpool, Bicycle and Pedestrian Two‐46
Better Carpool Parking Investment Level To provide the residents of Michigan with a ‘better’ carpool lot network, the program would need an additional $500,000 to resurface three to five large lots (depending on size). An additional $2,000,000 would allow construction of four to five multi‐modal park and ride facilities needed to meet expected demand for new facilities due to rising gas prices. Constructing new lots at this level will accommodate the larger turning radius for buses and more capacity for transit rider parking.
Best Carpool Parking Lot Investment Level The ‘best’ scenario for carpooling in Michigan would provide commuters and recreational travelers with a variety of options. These include satellite lots around cities served by transit, suburban carpool lots conveniently located near services and major roads or freeways, and rural carpool lots at intersections of key highways that would serve long distance commutes and recreational travel. These lots would be well‐lit, easy to find, well maintained, and serviced by a variety of transportation modes (such as sidewalks, bike lanes, or buses). Local transit agencies would also contribute funds to supply the lots with such amenities as bus shelters and concrete pads to accommodate transit service and reduce pavement deterioration. Enforcement of parking regulations and lighting maintenance require the local units of government to be active partners with the carpool lot program. Long range planning would engage metropolitan planning organizations and municipalities to ensure a fully connected and carpool lot program.

Report of the Intermodal Passenger Transportation Subcommittee
Section Two: Carpool, Bicycle and Pedestrian Two‐47

Report of the Intermodal Passenger Transportation Subcommittee
Section Two: Carpool, Bicycle and Pedestrian Two‐48
Local Agency Capital Needs - Bicycle and Pedestrian Transportation The state portion of investment needs for bicycle and pedestrian travel are accounted for in the Estimated State Trunkline Program Needs and Investment Scenarios developed by the Road and Bridge Citizens Advisory Committee. The needs include expanding trunkline road shoulders to accommodate bicycle and pedestrian use, upgrading trunkline sidewalk curb ramps and signals for ADA compliance, and replacing special pavement markings for school crossings on trunkline roads to increase pedestrian safety. The Road and Bridge Citizens Advisory Committee report also addressed local roads and pedestrian accommodations on bridges, but it did not address bicycle and pedestrian needs on city and village streets ,or on county roads, as data is not readily available.
Introduction The following narrative outlines, in the broadest context, some local investment needs as well as some “special initiatives” or projects that would supplement the investment scenarios developed by the Road and Bridge Citizens Advisory Committee. These special initiatives and projects, when implemented, would increase the use, safety and connectivity of bicycle and pedestrian facilities, systems, and routes within Michigan.
Investment Assumptions The following scenarios were based on these assumptions and estimates.
• Current practice: The scenarios presented are based on current MDOT and FHWA practices and policies and are subject to change if alternative approaches to accommodating all modes of transportation are adopted. These alternatives could include effort to increase the use of “road‐diets” (four‐lane to three‐lane conversions), complete streets, or efforts to reduce carbon emissions. Depending on the breadth of these alternatives the estimates would likely change.
• Pedestrian/ADA Curb Ramps: The Estimated State Trunkline Program Needs and Investment Scenarios calculate that MDOT has jurisdiction over nearly 500,000 sidewalk curb ramps on 8,453 miles of non‐freeway state trunkline, resulting in an average of approximately 59 sidewalk curb ramps per mile at

Report of the Intermodal Passenger Transportation Subcommittee
Section Two: Carpool, Bicycle and Pedestrian Two‐49
intersections and driveways. Most of these curb ramps are located in cities or villages that would have jurisdiction over them. Applying the average of 59 curb ramps per mile to the 20,914 miles of streets maintained locally in cities and villages, generates a conservative estimate of 1,236,000 curb ramps under local jurisdiction. Assuming 75 percent (927,000) of those are not in compliance with established ADA standards and are in need of replacement, the local investment need is estimated at between $556,207,200 and $927,012,000, using costs from the Estimated State Trunkline Program Needs and Investment Scenarios.
• Sidewalks: Costs associated with correcting sidewalk segments that are deficient
and deteriorating to a point where they are no longer safe or where they may be non‐compliant with ADA standards must also be considered. Assuming sidewalks exist on both sides of a local road it can be assumed that there are roughly 41,828 miles of sidewalk. Assuming conservatively that 25 percent of those sidewalks should be replaced, the cost would be around $552,129,600 (estimated at $10/linear foot). Many local agencies have the mechanisms to cover some of these costs through millages or special assessments.
Investment Scenarios The paragraphs below portray the range of local agency investment needed to accommodate bicycle and pedestrian travel.
LOCAL BICYCLE AND PEDSTRIAN TRANSPORTATION PROGRAM Annual Average Investment 2010‐2015
Current
(Do Nothing) Good Better
Pedestrian Only Facilities (Sidewalks & ADA Curb Ramps)
$9,600,000 $19,000,000 $48,000,000
New Multi‐Use Pathways $0.00 $112,000,000 $211,000,000Reconstruction of Existing Multi‐Use Pathways
$0.00 $0.00 $45,900,000
TOTAL $9,600,000 $131,000,000 $304,900,000

Report of the Intermodal Passenger Transportation Subcommittee
Section Two: Carpool, Bicycle and Pedestrian Two‐50
Current Bicycle and Pedestrian Investment Level (i.e., Do Nothing) Determining the status quo spending on bicycle and pedestrian facility at the local level is difficult to quantify because data is not readily available. One measure that can be quantified relates to the requirement that local agencies must spend a minimum of one percent of their Michigan Transportation Fund (MTF) monies on non‐motorized facilities and services intended for bicyclists or pedestrians. While the actual amount varies from year to year, for fiscal 2006‐2007, one percent of the local MTF distribution equaled nearly $9.6 million. The estimated expenditure for local agencies to maintain the current one‐percent spending for 2010‐2015 would be approximately $57.6 million. This level of investment would only maintain current funding levels and do little to address the overall needs of maintaining or expanding the local pedestrian transportation networks. Current funding levels are insufficient to assist the counties, cities and villages in achieving an ADA compliant system in a reasonable timeframe. Current funding also is insufficient to cover the costs associated with maintenance and reconstruction of the existing system of multi‐use trails. In 2008, nearly 425 miles of trail were nearing the end of their estimated service life of 20 to 25 years and will soon require major repairs or even reconstruction due to deterioration. By 2015, it is estimated that another 810 miles of trails will near the end of their service life and will require extensive maintenance or reconstruction. If these facilities are not reconstructed, trails will continue to deteriorate to a point where they may need to be closed to ensure user safety. There are currently no funds available for this type of investment.
Good Bicycle and Pedestrian Investment Level This scenario builds upon the status quo and doubles the funding for local agencies to $19 million annually or $115 million between 2010‐2015. Doubling the amount of funds available to local agencies will assist in making the necessary upgrades and expansions to the local sidewalk networks and increase the rate of ADA compliance.

Report of the Intermodal Passenger Transportation Subcommittee
Section Two: Carpool, Bicycle and Pedestrian Two‐51
This scenario also provides funding for the development of new multi‐use trails to complete gaps between long distance trails. Many of the existing trails were developed along utility corridors, abandoned railroad beds, or along state or local roads but stop short of connecting to major population centers, attractions or other multi‐use trails. Filling the gaps in the existing system and creating a connected network of multi‐use trails can enhance their use for transportation, in addition to providing recreation, tourism, local economic and personal health benefits. With the construction of an additional 98 miles of trails, it would be possible to connect dozens of communities and complete a north‐south trail between Traverse City and Kalamazoo. The construction of another 90 miles of trails makes it possible to develop an east‐west route connecting South Haven and Marine City. The estimated cost of filling these gaps, creating two cross state trails is estimated at approximately $112.0 million. The creation of an interconnected network of trails can also help facilitate and leverage the local agencies ability to secure other sources of funding for trail maintenance through local foundations, Friends Groups, partnerships with the DNR or other agencies, millages or other creative opportunities such as naming rights.
Kalamazoo to Traverse City Trail
Michigan Airlines Trail

Report of the Intermodal Passenger Transportation Subcommittee
Section Two: Carpool, Bicycle and Pedestrian Two‐52
Better Bicycle and Pedestrian Investment Level The “Better” investment scenario increases funding to upgrade to the local system of bicycle and pedestrian accommodations to $48.0 million ($288.0 million between 2010‐2015) and an additional $144.0 million for continued expansion and regional connectivity of the existing multi‐use trails system or reconstruction of deteriorating trails. An investment in bicycle and pedestrian accommodations at this level has been determined to be one that is adequate to community needs. At the local level, this scenario allows the local agencies to accelerate the maintenance of the existing sidewalks, curb ramps, signals and pavement markings as necessary for safe travel. The additional $144.9 million in funding for trail construction ($99 million) and reconstruction ($45.9 million) would result in improvements to the 425 miles of multi‐use trail constructed prior to 1992 that are nearing the end of their design life or were constructed using now antiquated design standards. The funding would also help fill gaps in an existing multi‐use trail system that would ultimately connect Muskegon to Owosso.
Best Bicycle and Pedestrian Investment Level The “Best” investment scenario increases funding to a level that will allow local agencies to upgrade the entire systems of sidewalks, curb ramps and other pedestrian accommodations to ADA compliance by 2015, as legally required. That scenario is difficult to quantify due to the lack of accurate base data. This scenario also would provide funding at levels sufficient to meet the local needs to create bike lanes and multi‐use trails within communities, and connections to existing (or proposed) local and regional trails. Funding for the maintenance of already established trails could supplement local funding from millages, other state funding, or funds from foundations and Friends Groups that currently support many local multi‐use trails.

Report of the Intermodal Passenger Transportation Subcommittee
Section Two: Carpool, Bicycle and Pedestrian Two‐53
2007 Rails to Trails System


