
12 Soil Erosion
Jerry C. Ritchie
USDA-ARS Hydrology Laboratory, BARe-West, Bldg-007, Beltsville, MD 20705 USA
12.1 Introduction
Soil erosion is a natural procds caused by water, wind, and ice that has affected the earth's surface since the beginning of time. Soil erosion and its off-site, downstream damages are major concerns around the world (Lal 1994b) causing losses in soil productivity and degradation oflandscape (Walling 1983). Many of man's activities have accelerated soil erosion (Sombroek 1995; Walling 1983). Oldeman (1994) has estimated that human-induced soil degradation has affected 15% of the world's arable land surface. Estimates of global soil erosion rates range from 0.088 rom yr-l (Walling 1987) to 0.30 rom yr-l (Fournier 1960). These values led to estimates of 17.4 to 58.1 x 10⁹ Mg of soil loss from the land surface (Walling 1990) which is carried downstream into lakes, reservoirs and estuaries where it reduces storage capacity and affects water quality, navigation, and biological productivity. On the land surface, soil erosion decreases organic matter, fme grained soil particles, water holding capacity, and rooting depth leading to loss of soil productivity and quality. The economic consequences from soil erosion on loss of productivity, land degradation, and off-site, downstream damages from eroded soil particles on water quality are a major concern. Pimentel et al. (1995) estimated the economic cost of soil erosion and subsequent sediment deposition to be $400 billion per year worldwide. While this economic estimate of the cost of erosion has been questioned (Sombroek 1995), concerns about soil loss and the estimated cost point to the need for new and improved methodologies and techniques for monitoring and quantifYing soil erosion effectively and efficiently across the landscape so that effective land management practices can be applied to the land surface to control and reduce soil erosion.
Determining spatially distributed soil erosion on the landscape using classical soil erosion measurement techniques is difficult, time consuming, and expensive (Brakensiek et al. 1979; LalI994a). These techniques involve field studies with experimental plots to establish basic principles and measure rates of erosion. Small unit-source catchments are used for relating these plot studies to larger areas (Mutchler et al. 1994). These types of studies involve continuous measurements of soil and water movement from plots/catchments and require long time periods (years) of data collection to provide statistically significant results. Such studies are limited to establishing information about processes and rates and can seldom be used to
G. A. Schultz et al. (eds.), Remote Sensing in Hydrology and Water Management© Springer-Verlag Berlin Heidelberg 2000
272 J.C. Ritchie
determine spatial patterns of soil erosion. Others techniques involve measuring sediment loads at the outlet of catchments and relating these measured sediment loads to soil erosion on the catchment using sediment delivery ratios (Walling 1983). However, estimating soil erosion rates from sediment loads by sediment delivery ratios has long been recognized as a problem (Roehl 1962; Walling 1983) and provides no information on spatial patterns. Radioactive fallout (I37Cesium) and naturally occurring radioactive elements (i.e., 21Opb) have also been used to measure soil erosion and sediment deposition (Ritchie and McHenry 1990). The use of radionuclides allows the measurement of both eroding and depositing sites within a field and thus provides better information on actual soil loss from a field and the spatial patterns of erosion and deposition within a field. Detailed information on classical field techniques for measuring soil erosion can be found in a field manual of methods for agricultural hydrology (Brakensiek et al. 1979) and a recent review of soil erosion measurement techniques is presented by La} (l994a).
In addition to field measurements of soil erosion, empirical and process-based mathematical equations/models have been developed to estimate soil erosion (Foster 1991; Lane et al. 1992). The most widely used soil erosion model is the Universal Soil Loss Equation (USLE) which is an empirically based equation developed from data collected from standard soil erosion plots on "typical" soils of the United States east of the Rocky Mountains (Wischmeier and Smith 1978). The USLE has been extensively used and ,,misused" in the United States and around the World. Even with its limitations, the USLE is the most widely used, powerful and practical management tool for estimating sheet and rill erosion on agricultural landscapes. A Revised Universal Soil Loss Equation (RUSLE) using the same form and factors with revised coefficients is available with applications to a wider range of conditions and locations than the original USLE but is still based on empirical relationships (Renard et al. 1991, 1997). The form of the equation for the RUSLE (and USLE) is:
A=RKLSCP
Where A is the average annual soil loss per unit area; R, the rainfall factor; K, the soil erodability factor; L, the slope length factor; S, the slope steepness factor; C, the crop management factor; and P, the soil erosion control practice factor. Numerical coefficients for these factors were determined empirically from field and laboratory data (Wischmeier and Smith 1978; Renard et al. 1997). Many other efforts to develop empirical and physically-based models of soil erosion and its off-site effects have been made that have had varying degrees of success and applications in management and research. A general discussion of soil erosion models with a more in depth view of their applications and limitations is given by Foster (1991), Lane et al. (1992) and Lal (1994a).
The limitations of current measurement techniques and models to provide information on the spatial and temporal distribution of soil erosion across catchments and on the movement of eroded particles into streams limit our ability to develop costeffective land management strategies for erosion control. Such limitations point to the need to investigate other techniques to supplement current techniques for monitoring

12 Soil Erosion 273
and quantifying soil erosion rates and patterns and the need for techniques that can identify potential as well as actual source areas of soil erosion on the landscape.
Soil erosion causes both physical (i.e., gullies, rills) and visible (i.e., exposure of different colored soil layers) changes in the surface properties of soils on the landscape. Such changes can be measured both spatially and temporally using remote sensing techniques with a variety of sensors and sensor platforms. Remote sensing techniques can measure qualitative and quantitative information on changes in the soil surface roughness and on visible features. Remote sensing techniques to measure eroded material once it leaves the land surface and enters a stream or a water body are discussed in Chap. 13 of this book.
12.2 Basis for using Remote Sensing
Cihlar (1987) concluded that assessing and monitoring soil erosion occurs in two dimensions that he called stage and time. He uses stage to refer to the type of soil erosion (i.e., sheet, rill, or gully) and time to refer to actual or potential soil erosion. It is important to evaluate both the stage and time dimension if we are to develop management plans to reduce or control soil erosion. Both the stage and time of erosion can affect the physical and spectral properties of soil surfaces. Since remote sensing techniques measure spectral and physical properties, we can use remote sensing to provide information on these changes in surface properties of the soil caused by erosion. Remote sensing techniques can provide spatial and temporal data on these properties that will allow us to develop better management plans for large areas to reduce soil erosion.
Remote sensing techniques that measure the spectral properties of the landscape are most commonly applied to study soil erosion patterns and rates. Ground-based and aerial photographs are still the most popular remote sensing technique used to study and map soil erosion using either photo interpretation or photogrammetric techniques. These techniques provide information on spectral differences in the soil surface and are interpreted to delineate areas affected by soil erosion. Photointerpretation of images made from digital radiance data from satellite sensors (Landsat, SPOT, IRS, A VHRR, etc.) is also widely used to map areas of soil degradation. Photographs and digital imagery have been used for mapping actual/potential soil erosion areas, for determining spectral patterns and differences in the surface soils related to soil erosion, and for determining land cover and conservation practices for input to soil erosion models.
Photogrammetric techniques are used with stereo photographs to measure physical changes (i.e., roughness) in soil surface elevation. Sequential photographs can be used to determine changes in areas of erosion or deposition over time. Ground-based and airborne lasers are also used to measure landscape surface roughness and topography. These laser systems can measure physical changes in the soil surface to within a few millimeters from ground platforms and within a few centimeters,from aerial platforms allowing estimates of soil loss or estimates of surface roughness that allow us to better understand soil erosion. Synthetic aperture radar (SAR) also has been used to measure

274 J.C. Ritchie
the landscape topography and may have potential applications for evaluating largescale soil erosion patterns and rates.
While remote sensing data can be used alone to access soil erosion rates and patterns, a combination of remote sensing data, soil erosion models, and Geographic Information Systems (GIS) has much to offer in understanding and measuring the effects of soil erosion on the landscape. GIS tools allow researchers or decision makers to combine the spectral, spatial, and temporal characteristics of remotely sensed data with ancillary data about the landscape and use these many sources as input to erosion models to quantify rates and patterns of soil erosion. GIS tools provide the spatial pattern of erosion needed by decision makers for carrying out management practices to reduce soil erosion on the landscape.
Many early applications of remote sensing for mapping soil erosion and degradation patterns were discussed by Dubucq (1986). He found publications from 1973 using Landsat Multispectral Scanner (MSS) data to map soil erosion prone areas. Most of the papers cited by Dubucq used photointerpretation techniques to make maps of potential and actual eroded areas.
12.3 Applications
Photo interpretation remains the most commonly applied remote sensing technique for studying and mapping soil erosion across the landscape. Photointerpretation has been defmed as the science of identifying and describing objects imaged on a photograph and determining their significance (Philipson 1997). Some argue that this is as much art as science. Photo interpretation is based on the ability of the observer to identify and delineate objects based on pattern, texture, and color from a photograph. Photointerpreted objects are often noted on the photograph and later transferred to maps. Such maps are analyzed to determine the eroding area and changes in eroding area (or other interpreted objects). These changes in eroded area can be determined by photointerpreting sequential images and plotting changes on a map. More information about photo interpretation can be obtained from many sources (e.g. Philipson 1997).
Photogrammetry is also widely use for studying and mapping soil erosion. Photogrammetry has been defmed as the science, art, and technology of obtaining reliable information about physical objects and the environment from photographs (Greve 1996). The principle of the photogrammetric technique is shown in Fig. 12.1. Photogrammetry has been widely used to measure changes in landscape surfaces for topographic mapping and to determine gully erosion, rill development, and erosional losses. Using photogrammetric techniques on sequential photographs allows the determination of eroding and depositing area on the landscape. More information about photogrammetric techniques can also be obtained from many sources (e.g. Greve 1996).
A wide range of digital data with differing spectral and spatial resolution are available from aircraft and satellite platforms. These data can be used to make images for photo interpretation or can be analyzed spectrally to evaluate soil erosion rates and patterns. These digital data need to be georeferenced and corrected for atmospheric interference for best results. Computer software programs are available to correct,

12 Soil Erosion 275
H
Fig. 12.1. Basic principles for using stereo photographs to develop stereomodel (adapted from WeIch et al. 1983)
analyze, and classify the digital spectral data based on spectral properties into information about the characteristic of the landscape surface properties related soil erosion rates and patterns. Image classification and vegetation indices are widely used for applications in hydrology and erosion. Other sources (e.g. Jensen 1996) are available that discuss classification technique in detail.
Ground and airborne laser distancing systems can provide data on the physical properties of the landscape surface which can be analyzed to provide information on the erosional properties of the soil surface. Both profile and imaging laser systems are available that can be use in erosion research (Ritchie 1996). Synthetic Aperture Radar can also provide data related to topography which can be used as input for erosion models. As techniques improve for analyzing laser and SAR data, these data will allow the development of improved digital elevation models (D EM) for use in erosion modelling, research and management.
Once remotely sensed data is georeferenced and classified it can be used for mapping or as input for a data layer in a Geographical Information System (GIS). Figure 12.2 shows schematically how different remote sensors might provide data to be used
276 J.e. Ritchie
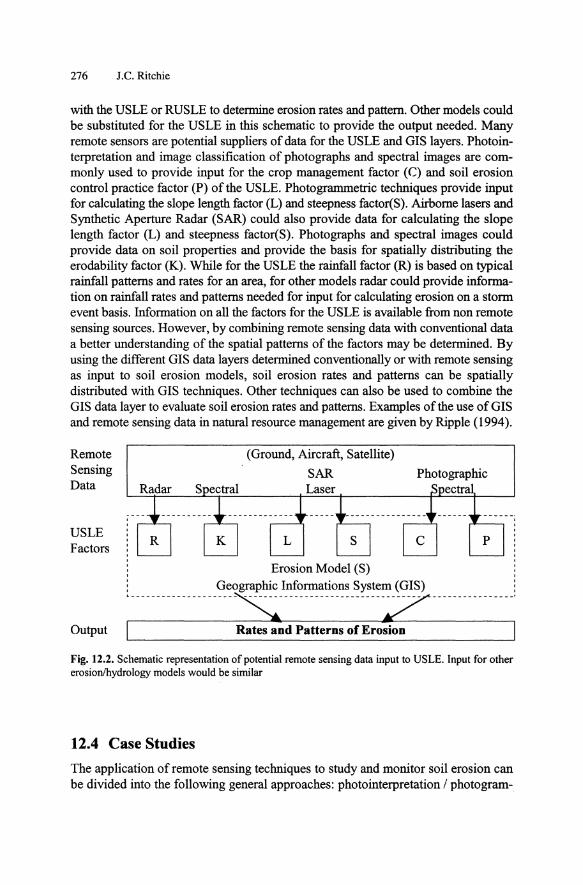
with the USLE or RUSLE to determine erosion rates and pattern. Other models could be substituted for the USLE in this schematic to provide the output needed. Many remote sensors are potential suppliers of data for the USLE and GIS layers. Photointerpretation and image classification of photographs and spectral images are commonly used to provide input for the crop management factor (C) and soil erosion control practice factor (P) of the USLE. Photogrammetric techniques provide input for calculating the slope length factor (L) and steepness factor(S). Airborne lasers and Synthetic Aperture Radar (SAR) could also provide data for calculating the slope length factor (L) and steepness factor(S). Photographs and spectral images could provide data on soil properties and provide the basis for spatially distributing the erodability factor (K). While for the USLE the rainfall factor (R) is based on typical rainfall patterns and rates for an area, for other models radar could provide information on rainfall rates and patterns needed for input for calculating erosion on a storm event basis. Information on all the factors for the USLE is available from non remote sensing sources. However, by combining remote sensing data with conventional data a better understanding of the spatial patterns of the factors may be determined. By using the different GIS data layers determined conventionally or with remote sensing as input to soil erosion models, soil erosion rates and patterns can be spatially distributed with GIS techniques. Other techniques can also be used to combine the GIS data layer to evaluate soil erosion rates and patterns. Examples of the use of GIS and remote sensing data in natural resource management are given by Ripple (1994).
Remote Sensing Data
USLE Factors
(Ground, Aircraft, Satellite)
SAR
Erosion Model (S)
Photographic ectra
: Geographic Informations System (GIS) : ,- -------------------s--------------------Z ----------------' Output I Rates and Patterns of Erosion I
Fig. 12.2. Schematic representation of potential remote sensing data input to USLE. Input for other erosionihydrology models would be similar
12.4 Case Studies
The application of remote sensing techniques to study and monitor soil erosion can be divided into the following general approaches: photo interpretation / photo gram-

12 Soil Erosion 277
metry, model/GIS inputs, spectral properties, and topographic measurements. Examples of studies will be used to describe each approach.
12.4.1 PhotointerpretationlPhotogrammetry
Photointerpretation techniques have been used extensively to map soils, vegetation cover, drainage patterns, soil degradation, and other erosion related factors. Many of these applications have been used for mapping erosion patterns and estimating erosion rates. The Food and Agriculture Organization (FAO 1979) routinely uses photointerpretation techniques with aerial photographs and satellite images to assess and map soil degradation in developing countries around the world. The F AO maps are used to determine areas of critical erosion and soil degradation in a series of 1 :50000 and 1 : 100000 scale maps for developing countries.
Aerial photographs and satellite images were used to map changes in the shape and size of the Rosetta promontory in the Nile Delta (EI-Raey et al. 1995). Analyses of data from 1955 to 1991 found that photographs/satellite imagery could be used to follow the erosion and deposition patterns and changes in the size of the promontory that agreed with ground measurements. They concluded that the Rosetta promontory had been eroding since the building of the Aswan High Dam. They also found that remote sensing techniques were a more accurate, efficient, and cost effective tool for monitoring such changes than were ground measurements. Samarakoon et al. (1993) used Landsat TM images in a similar manner to monitor areas susceptible to landslides and concluded that TM data was a useful tool for monitoring and mapping potential landslide areas.
Panchromatic and Color Infrared (CIR) aerial photographs (see Color Plate 12.A) have been used to identify and map rill and gully soil erosion (i.e., Morgan et al. 1978; Frazier and McCool 1981; Stephens and Cihlar 1982; Cihlar 1987). Many different photographic scales have been used. Frazier et al. (1983) used ground (see an example of their photography, Color Plate 12.B) and aerial photographs taken with a 35-mm camera to assess and map rill development and soil erosion patterns in the steep hills of Palouse area of the western United States. They found that aerial photographs were the most effective tool to study the development of rill and soil erosion patterns and to determine the effectiveness of management practice for erosion control. Aerial photographs allowed them the overview that was necessary for mapping rill development that was not possible from the ground. Using stereoscopic photointerpretation techniques, Stephens (Stephens and Cihlar 1982) established an erosional classification system and mapped erosion patterns for 100 km2 area in New Zealand using 1: 10,000 aerial photographs. He found that remote sensing techniques were more accurate and cost 30% less. Using the same technique in Canada, Stephens and Cihlar accurately mapped rill and gully erosion cost effectively. Several researchers (Stephens et al. 1982; Cihlar 1987) have used sequential photographs taken over periods of weeks to years to map and study the changing patterns of rill development and soil erosion. By comparing maps prepared from these sequential aerial photographs, changes in the pattern of erosion and estimates of rates were determined.
278 J.C. Ritchie
Cihlar (1987) describes techniques for using satellite data (MSS, TM, SPOT) for monitoring potential sheet and rill soil erosion and conservation practices on agriculturallands. However, he found that image-specific predictive relationships were required to achieve accurate quantitative results. In most studies, photointerpretation of satellite images has been most useful for repetitive monitoring and large area reconnaissance (Johannsen and Barney 1981; Johannsen and Saunders 1984) rather than gathering infonnation about specific sites. Phillips et al. (1986) discuss the many potential applications of the Thematic Mapper (TM) to conservation assessment and concluded that TM is a valuable tool for managing the landscape. With the improving spectral and spatial resolution of current satellites, satellite data will become even more important for monitoring pattern and rates of soil erosion across the landscape.
Pelletier and Griffin (1988) used photointerpretation of aerial photographs to identifying conservation practices on agricultural lands. They concluded that CIR aerial photographs were most useful (see Color Plate 12.A for an example of one of the photographs used). They estimated that more than 90% of the soil conservation practices used in the United States could be identified at a photographic scale of I: 10000 and that 29% could still be identified at a scale of I :80000. Stephens and Cihlar (1982) provided an interpretation key to identify agricultural practice and soil erosion features from CIR photographs taken in Canada. They also concluded that most conservation practices could be identified. Wilson et al. (1989) concluded that SPOT panchromatic data (10 meters) could be visually interpreted to develop an effective potential soil loss map while TM imagery could be used to update crop management practices during the growing season. Such monitoring of conservation practices with remotely sensed data provides a basis for evaluating the effectiveness of conservation practices, managing soil erosion control practices on the landscape, and providing data for input for soil erosion models.
Photogranunetric techniques applied to ground and aerial photographs have been used to measure changes in surface topography and quantify soil loss rates. Welch and others (Welch and Jordan 1983; Welch et al. 1983; Thomas and Welch 1988) describe the application of photogranunetric techniques to quantify soil loss using ground and aerial photographs. They estimated that photogranunetric techniques (Fig. 12.1)with aerial stereo-pairs could provide X, Y, and Z terrain coordinates with vertical accuracies of ±25 mm at contour intervals of 150 mm. In a three-year study, they made quantitative estimates of the amount and pattern of soil eroded or deposited in a 5.34 ha field. The same photogranunetric techniques have been used to measure stream channel degradation (Collins and Moon 1979) and the development of rills and ephemeral gullies in agricultural fields (Thomas and Welch 1988).
Photogranunetic techniques were used with photographs taken at 15 to 30 m above the ground (Spomer and Mahurin 1984; Spomer et al. 1986) to quantify gully development and hillslope soil erosion. They measured elevation with an accuracy of ±l5 cm and estimated net soil displacement (erosion minus deposition) to be 46,260, and 605 Mg ha-1 respectively for 1972-1974, 1974-1978, and 1978-1984. They estimated that sediment delivery at the end of the catchment was 53% based of the photogranunetric study as compared with 21 % computed from USLE estimates. They concluded that remote sensing provided better estimates of soil loss. Using sequential

12 Soil Erosion 279
photographs, Spomer and Mahurin (1984) developed topographic maps of an expanding gully area and estimated soil loss of 14 tonne yr-l for a nine-year period from the area. Dymond and Hicks (1986) used the same photogrammetric principles on a series of historical aerial photographs for a period between the early 1940's and 1980 and estimated total catchment soil erosion for areas in New Zealand. Several studies (Sneddon and Lutze 1989; Kirby 1991) have used close range photogrannnetry techniques to quantify soil erosion rates.
These selected examples show the application and benefits of photointerpretation and photogrannnetric techniques in mapping and quantifying patterns and changes in patterns of soil erosion on the landscape. Such applications have provided information that has helped to develop a better understanding oft-h.e soil erosion process.
12.4.2 Model/GIS Inputs
Remotely sensed data have temporal, spatial, and spectral characteristics that can provide information on landscape variables needed for input to soil erosion and other natural resource models (Foster 1991; Lane et al. 1992; Agassi 1995). Pelletier (1985) reviewed the principles of the application of remotely sensed data to USLE. Traditionally, most inputs for soil erosion models (and other natural resource models) have come from historical records, soil surveys, and field surveys ofland use and conservation practices. Remotely sensed data, digitized soils data, DEM, and ancillary data used for input to erosion models in a GIS framework can provide valuable insights for understanding and managing soil erosion, water quality, and natural resources. Studies in recent years have shown that many inputs for these models can be derived from aerial photographs or satellite data (Fig. 12.2). As spatially distributed models of the erosion process become available, remote sensing techniques may be the only way to collect the spatially distributed data necessary for input. Many recent studies have shown the potential for using remote sensing data for input to soil erosion models. A few examples are be given.
Stephens et al. (1985) used aerial CIR to delineate homogeneous soil erosion areas and to estimate the cropping factor (C), management practice factor (P), slope factors (L, S), and soil factors (K) for input in the USLE. Using CIR they were able to estimate soil loss faster and with the accuracy (88 ± 1.2%) needed for farm planning. Cihlar (1987) used Landsat TM and SPOT data to determine cropping practice factors (C) for input to the USLE.
Jakubauskas et al. (1992) discussed the application of remotely sensed data for soil erosion model and used remotely sensed data for input to the Agricultural Nonpoint Source (AGNPS) model. They concluded that SPOT multispectral data with supervised classification was the most cost effective source of data for catchments greater 141 lan2• Photointerpretation of aerial photographs was best for catchment less than 141 km2• They also concluded that only on larger catchments does the use of digital satellite data become economically effective. Fraser et al (1995) concluded that classification of Landsat TM data provide a rapid, objective technique and an attractive alternative to photointerpretation for developing data bases for large catchments. Other researchers have used either photographs or satellite data to

280 J.C. Ritchie
detennine inputs for soil erosion models with good success (i.e., Wilson et a!. 1989; Morgan and Nalepa 1982).
Pelletier (1985) provided a framework for combining soil erosion models with remotely sensed data in a Geographic Information System to expand the applications of soil erosion models and to improve our understanding of soil erosion processes across the landscape. Pelletier showed that remotely sensed data could be used more objectively and efficiently with a GIS to evaluate the landscape for problem areas of soil erosion.
Jiirgens and Fander (1993) use the USLE, remote sensing data, and a GIS to develop soil erosion risk maps (see Color Plates 12.C and 12.D). Using their system they simulated soil protection measures on the landscape and detennine their effectiveness based on their soil risk maps. They concluded that remote sensing data in combination with GIS was the most efficient way to simulate soil protection measures and select sites for agricultural production with the least soil erosion risk. Similarly, Hession and Shanholtz (1988) used the USLE, remote sensing data, and a GIS to estimate sediment loading from the Chesapeake Bay catchment and developed a method for targeting efforts on the catchment where soil conservation practices should be placed to reduce soil erosion.
12.4.3 Spectral Properties
Soil erosion removes the surface soil layer exposing different layers with different spectral properties. Based on this concept, Robinove et a!. (1981) proposed using albedo differences between Landsat overpasses to monitor arid land soil erosion and degradation. They calculated albedo from Landsat MSS digital data and found that decreases in albedo was related to improved land use patterns (more soil moisture, organic matter, and increased vegetation productivity) and increases in albedo related to soil degradation (erosion, low soil moisture, organic matter, and productivity). Using albedo difference between different Landsat images they were able to identify areas of soil degradation and erosion in cold desert areas of the southwestern United States. Frank (1984) also used albedo differences from Landsat to assess change in the surface characteristics of a semiarid rangeland in Utah and reached the same conclusion as Robinove. Landsat radiance parameters have also been used to distinguish soil erosion, stability, and degradation in arid central Australia (Pickup and Chewing 1988). These techniques have been used extensively by international organizations (F AO) to map soil degradation in developing countries.
Seubert et a!. (1979) used laboratory measurements of spectral properties of the surface soil to distinguish between slightly, moderately, and severely eroded areas in agricultural lands. Latz et al (1984) expanded on this study and showed that these spectral differences were due to the amounts of iron oxide and organic matter in the soil surface. They found that the differences in spectral intensity were related to the severity of soil erosion and suggested that Landsat data would be useful in detecting soil erosion. Pelletier and Griffm (1985) used Landsat data to map soil erosion by using spectral data to identifying areas with higher iron oxide concentration (reddish color) of the subsoil soil. They used the presence of iron oxide to map eroded areas

12 Soil Erosion 281
(subsoil soil at the surface). They found this technique to be useful for bare soils but severely limited under condition with significant vegetation.
Price (1993) in a study of Pinyon-Juniper woodland found that spectral measurements from TM were better indicators of soil erosion patterns than estimates from USLE. He concluded that spectral properties of remotely sensed data gave an integrated view of soil erosion of the landscape and that remotely sensed data should be considered when developing soil erosion models for broad geographic areas of semiarid and arid land.
While such simple relationship between radiance measured in a satellite band have been related to soil erosion, most studies have used a vegetation index (i.e., NDVI, BI) or other band ratios or combinations to estimate soil erosion areas from satellite data. Mathieu et al. (1997) using SPOT data found that bands and band ratios provided a reliable means of determining a soil surface affected by erosion. However, they were not able to extrapolate these fmdings into predictive indicators of erosion. In a study in Norway, Leek and Solberg (1995) used CIR, SPOT, and ERS-l SAR data to monitor autumn tillage and concluded that remotely sensed data was useful for monitoring soil exposed to rainfall soil erosion. They also found that a combination of optical and microwave data was effective in monitoring tillage areas because the microwave allowed data collection during cloud cover. By mapping these bare soil, they were able to delineate areas of potential soil erosion problems.
Since surface soil erosion is highly correlated the amount of surface residue, techniques to estimate residue cover are needed to better determine soil loss. Daughtry et al (1996) have shown that reflectance and fluorescence can be used to determine the amount of residue on the soil surface. They concluded the fluorescence techniques were better and have developed methods to estimate surface residue in the field. Whiting et al. (1987) used small format photographs to estimate residue cover and concluded that the technique was useful for monitoring conservation tillage and soil exposed to rainfall soil erosion. They found the method could reduce field time needed to monitor surface residue and soil erosion. Biard and Baret (1997) developed an algorithm (CRIM - Crop Residue Index Multiband) to estimate surface residue. They showed "reasonably good" estimates of residue using field measurements of reflectance in the TM bands. The algorithm could be used with any set of wave bands. Biard and Baret (1997) also provide a good background on studies on residue measurements using spectral data from ground and satellite sensors.
12.4.4 Topographic Measurements
Topographic maps have long been used in studies of soil erosion. However, the need for more up-to-date, accurate and rapid measurements and assessments ofland surface terrain features to estimate land surface roughness, water movement, and soil erosion has led to the application oflaser distancing technology for in situ measurements of soil surfaces from a laser mounted 10-20 cm above the surface (Bertuzzi et al. 1990; Huang and Bradford 1990). These in situ studies have been used to quantify soil loss from rill and sheet soil erosion with high accuracy (millimeter accuracy) and to study

282 J.C. Ritchie
development of rills on the landscape. These studies are leading to a better understanding of the mechanism of soil particle detachment and movement.
The same laser techniques have been used with an airborne laser altimeter (Ritchie 1996) to study soil erosional features of the landscape. Landscape features related to soil erosion such as topography, stream channels, gullies, and canopy cover can be measured. The airborne laser measurements provide quick and accurate data on the morphology and roughness of the landscape surface (Ritchie and Jackson 1989). Laser altimeter data are valuable for measuring gully (Fig. 12.3) and channel crosssections and roughness, for assessing soil loss from gullies and channels, for providing input to understand gully and stream channel dynamics, and for measuring soil surface roughness (Ritchie et al. 1994). Data related to changes in landscape topography, both micro and macro changes, provide basic information for determining soil erosion rates and patterns. Any remote sensor that will allow topographic observations to be updated accurately and easily will aid in the estimation of soil erosion.
12.5 Future Directions
In a few of the applications discussed, photogrammetric techniques and laser distancing techniques were used with ground or aerial photographs to quantify the actual amount of soil erosion. However in most applications, actual soil erosion was not measured directly from remotely sensed data but changes in land use or soil surface properties/conditions were used as a surrogate for delineating areas with soil erosion
401.2
~ 400.4 ~ ~
399.6
o 8
GULL Y CROSS SECTION
16 METERS
24 32
Fig. 12.3. Measurement of cross-section measured with an airborne laser. Airplane was at 300 m above the land surface. Calculated area of the gully is 16.3 m2

12 Soil Erosion 283
or to estimate a variable for input into a soil erosion model. Future uses of remote sensing data for delineating areas with soil erosion and estimating variables should increase as new sensors (e.g. EarlyBird, Resources2l, etc.; Corbley 1996) with higher spatial (1-2 meters) and spectral (100+ wavebands) resolutions are launched. The higher spatial resolution will permit measurements on smaller areas that are most important for understanding and quantifying the processes of soil erosion at the field level. Better spectral resolution may allow us to derive spectral signatures for eroded areas that are specific for degraded soils and allow better delineation of soil erosion patterns across the landscape. However, spectral patterns for eroded soils may be site specific and require a definition of soil properties to be successfully used.
The continued development of scanning laser technology with higher spatial and vertical accuracies will provide another source of data on topography that will be useful in measuring centimeter difference due to soil erosion. Krabill et al. (1995) used a scanning laser altimeter to measure the surface terrain of the Greenland ice sheet and estimated accuracies of -20 cm for several 1000 kilometers of flight lines. These measurements were used to study the dynamics of the Greenland ice sheet. Hug (1996) used a similar scanning laser system to measure urban topography. A scanning laser altimeter is schedule to be launched on a space platform in 2002. With such measurements and updating of changes in topography, we can better quantifY soil loss and have data for understanding the dynamics of water and wind flow across the landscape.
The fast developing field of Synthetic Aperture Radar (SAR) interferometry (Gens and van Genderen 1996) with applications to topographic mapping and digital elevation modeling (DEM) also holds great promise for providing a new source of data for quantifying soil erosion. SAR data are available from aircraft and satellite (ERSlIERS2) instruments to begin research. Again the updating of changes in topography is key for quantifying soil erosion.
Combining these new sources of data with Geographic Information Systems should provide many new insights into the problems of soil erosion and provide a basis for quantifying soil loss using remotely sensed data. The future has much to offer in application of remote sensing data to understanding the role of soil erosion on the landscape. New sensors and tools will allow the researchers and decision makers to use improved spectral, spatial, and temporal characteristics of remotely sensed data and ancillary data with models and GIS for understanding and quantifying patterns of soil erosion. Management decisions can be based on actual soil erosion rates thus allowing efforts to reduce soil erosion to be targeted to critical soil erosion areas in the catchment.
References Agassi, M. (ed.): Soil erosion, conservation and rehabilitation, New York, Marcel Dekker, Inc (1995) Biard, F., Baret, F.: Crop residue estimate using multiband reflectance. Remote Sens, Environ. 59,
530-536 (1997) Bertuzzi, P., Caussignac, J.M., Stengel, P., Morel, G., Lorendeau, J.Y., Pelloux, G.: An automated,
noncontact laser profile meter for measuring soil roughness in situ. Soil Sci. 149, 169-178 (1990)

284 J.C. Ritchie
Brakensiek, D.L., Osborn, H.B., Rawls, W.J.: Field manual for research in agricultural hydrology. Washington, DC: USDA Agriculture Handbook No. 224 (1979)
Cihlar, J.: A methodology for mapping and monitoring soil erosion. Canadian J. Soil Sci. 67,433-444 (1987)
Collins, S.H., Moon, G.C.: Stereometric measurement of strearnbank soil erosion. Photogrammetric Engr. Remote Sens. 45,183-190 (1979)
Corbley, K.. Remote sensing skies filling with satellite plans. EOM The Magazine for Geographic, Mapping and Earth Information 5, 26-28 (1996)
Daughtry, C.S.T., McMurtrey ill, J.E., Chappelle, E.W., Hunter, W.J., Steiner, J.L.: Measuring crop residue cover using remote sensing techniques. Theor. Appl. Climatol. 54, 17-26 (1996)
Dubucq, M.: Teledetection spatiale et soil erosion des sols Etude Bibliographique Cab. ORSTOM, Ser. Pedol. Vol. XXII, nO 2,1986,247-258 (1986)
Dymond, J.R., Hicks, D.L.: Steepland soil erosion measured from historical aerial photographs. J. Soil Water Conserv. 41, 252-255 (1986)
EI-Raey, M., Nasr, S.M., EI-Hattab, M.M., Frihy O.E.: Change detection of Rosetta promontory over the last forty years. Internat. J. Remote Sens. 16, 825-834 (1995)
F AO: Methodology for soil degradation assessment. Rome, Italy: Food and Agriculture Organization, United Nations (1979)
Foster, G.R.: Advances in wind and water soil erosion prediction. J. Soil Water Conserv. 46, 27-29 (1991)
Fournier, F.: Climat et soil erosion. Paris: Presses Universitaires de France (1960) Frank, T.D.: Assessing change in surficial character of a semiarid environment with Landsat residual
image. Photogrammetric Engr. Remote Sens. 50, 471-480 (1984) Fraser, R.H., Warren, M.V. Barten, P.K..: Comparative evaluation ofland cover data sources for soil
erosion prediction. Water Resour. Bull. 31, 991-1000 (1995) Frazier, B.E., McCool, D.K..: Aerial photography to detect rill soil erosion. Trans. Amer. Soc. Agric.
Engr. 24,1168-1176 (1981) Frazier, B.E., McCool, D.K.., Engle, C.J.: Soil erosion in the Palouse: an aerial perspective. J. Soil
WaterConserv. 38, 70-74 (1983) Gens, R., van Genderen, J.L. SAR interferometry - issues, techniques, applications. IntI. J. Remote
Sens. 17, 1803-1835 (1996) Greve, C.W. (ed.): Digital Photogrammetry: An Addendum to the Manual of Photogrammetry.
Bethesda, MD: American Society of Photo gramme try and Remote Sensing (1996) Hession, W.C.,Shanholtz, V.O.: A geographic information system for targeting nonpoint-source
agricultura1 pollution. J. Soil Water Conserv. 43, 264-266 (1988) Huang, C., Bradford, J.M.: Portable laser scanner for measuring soil surface roughness. Soil Sci. Soc.
Amer. J. 54,1402-1406 (1990) Hug, C. Urban topography survey with the scanning laser altitude and reflectance sensor (SCALARS).
Proc. Second IntI. Airborne Remote Sens. Conf. and Exhibition, pp. 1-429 to 1-438 (1996) Jakubauskas, M.E., Whistler, J.L. Dillworth, M.E., Martinko, E.A.: Classifying remotely sensed data
for use in an agricultural nonpoint-source pollution model. J. Soil Water Conserv. 47, 179-183 (1992)
Jensen, J.R.: Introductory digital image processing: A remote sensing perspective. Englewood Cliffs, NJ: Prentice-Hall, Inc (1996)
Johannsen, C.J., Barney, T.W.: Remote applications for resource management. J. Soil Water Conserv. 37,128-131 (1981)
Johannsen, C.J., Sanders, J.L. (eds.): Remote sensing for resource management, Ankeny, Iowa: Soil Conservation Society of America (1984)
Jiirgens, M., Fander, M.: Soil erosion assessment and simulation of SGEOS and ancillary digital data Internat. J. Remote Sens. 14,2847-2855 (1993)
Kirby, R.B.: Measurement of surface roughness in desert terrain by close range photogrammetry. Photogrammetric Record 13, 855-875 (1991)

12 Soil Erosion 285
Krabill, W.B., Thomas, R.H., Martin, C.F., Swift, R.N., Frederick, E.B.: Accuracy of airborne laser altimetry over the Greenland ice sheet. Internat. J. Remote Sens. 16, 1211-1222 (1995)
Lal, R. (ed.): Soil erosion. Ankeny, lA, Soil and Water Conservation Society (1994a) La!, R.: Soil erosion by wind and water: Problem and prospects, In: Lal, R. (ed.), Soil erosion, Ankeny,
lA: Soil and Water Conservation Society, pp. 1-9 (I 994b) Lane, L.J., Renard, K.G., Foster, G.R., Laflen, J.M.: Development and application of modem soil
erosion prediction technology - The USDA experience. Australian J. Soil Res. 30, 893-912 (1992) Latz, K., WeismilIer, R.A., Van Scoyoc, G.E., Baumgardner, M.F.: Characteristics variations in
spectral reflectance of selected eroded afisols. Soil Sci. Soc. Am. J. 48, 1130-1134 (1984) Leek, R., Solberg, R.: Using remote sensing for monitoring of autumn tillage in Norway. Internat. J.
Remote Sens. 16,447-466 (1995) Morgan, K.M., Lee, G.B., Kiefer, R.W., Daniel, T.C., Bubenzer, G.D., Murdock, J.T.: Prediction of
soil loss on cropland using remote sensing. J. Soil Water Conserv. 33, 291-293 (1978) Morgan, K.M., Nalepa, R.: Application of aerial photographic and computer analysis to the USLE for
area wide soil erosion studies. J. Soil Water Conserv. 37, 347-350 (1982) Mutchler, CK, Murphree, C.E., McGregor, K.C.: Laboratory and field plots for soil erosion research,
In: Lal, R. (ed.), Soil erosion. Ankeny, lA: Soil and Water Conservation Society, pp.II-37 (1994) Oldeman, L.R.: The global extent of soil degradation, In: Greenland, DJ. and I. Szaboles (eds.), Soil
resilience and sustainable land use, Wallingford, UK: CAB International, pp. 99-118 (1994) Pelletier, R.E.: Evaluating nonpoint pollution using remotely sensed data in soil erosion models. J. Soil
Water Conserv. 40, 332-335 (1985) Pelletier, R.E., Griffin II, R.H.: An evaluation of photographic scale in aerial photography for
identification of conservation practices. J. Soil Water Conserv. 43, 333-337 (1988) Phillips, K.M., Morgan, K., Newland, L., Koger, D.G.: Thematic mapper data: a new land planning
tool. J. Soil Water Conserv. 41, 301-303 (1986) Philipson, W. (ed.): The Manual of Photographic Interpretation. Bethesda, MD: American Society of
Photogrammetry and Remote Sensing (1997) Pickup, G., Chewings. V.H.: Forecasting pattemsof soil erosion in arid lands from Landsat MSS data.
Internat. J. Remote Sens. 9, 69-84 (1988) Pimentel, D., Harvey, C., Resosudarmo, P., Sinclair, K., Kut:Z, D., McNair, M., Crist, S., Shipritz, L.,
Fitton, L., Saffouri, R., Blair, R.: Environmental and economic cost of soil erosion and conservation benefit. Sci. 267,1117-1123 (1995)
Price, K.P.: Detection of soil erosion within Pinyon-Juniper woodlands using Thematic MapperCTM) data. Remote Sens. Environ. 45, 233-248 (1993)
Ripple, W.: The GIS Applications Book: Examples in Natural Resources: A Compendium. Bethesda, MD: American Society of Photo gramme try and Remote Sensing (1994)
Renard, K.G., Foster, G.R., Weesies, G.A., Porter, J.P.: RUSLE Revised Universal Soil Loss Equation. J. Soil Water Conserv. 46, 30-33 (1991)
Renard, K.G., Foster, G.R., Weesies, G.A., McCool, D.K., Yoder, D.C. Predicting soil erosion by water: a guide to conservation planning with the Revised Universal Soil Loss Equation (RUSLE). Washington, DC, USDA Agriculture Handbook No. 537, (1997)
Ritchie, J.C.: Remote sensing applications to hydrology: airborne laser altimeters. Hydrological Sci. J. 41, 625-636 (1996)
Ritchie, J.C., Grissinger, E.H., Murphey, J.B., Garbrecht, J.D.: Measuring channel and gully cross-sections with an airborne laser altimeter. Hydrological Processes J. 7, 237-244 (1994)
Ritchie, J.e., Jackson, T.J.: Airborne laser measurement of the topography of concentrated flow gulli@s. Trans. Amer. Soc. Agric. Engr. 32, 645-648 (1989)
Ritchie, J.e., McHenry, J.R.: Application of radioactive fallout cesium-137 for measuring soil erosion and sediment accumulation rates and patterns: a review. J. Environ. Qual. 19,215-233 (1990)
Robinove, CJ., Chavez, P.S., Gehring, D., Holmgren, R.: Arid land monitoring using Landsat albedo difference images. Remote Sens. Environ. 11, 133-156 (1981)
Roehl, J.E.: Sediment source areas, delivery ratios and influencing morphological factors. Wallingford, England: International Association of Hydrological Sciences, Pub. No. 59, 202-213 (1962)

286 J.C. Ritchie
Samarakoon, L., Ogawa, S., Ebisu, N., Lapitan, R., Kohki, Z.: Inferences oflandslide susceptible areas by Landsat Thematic Mapper data. Wallingford, England: International Association of Hydrological Sciences, Pub. No. 217, 83-90 (1993)
Seubert, C.E., Baumgardner, M.F. Weismiller, R.A., Kirschner, F.R.: Mapping and estimating areal extent of severely eroded soil of selected sites in northern Indiana 1979 Symposium on Machine Processing of Remotely Sensed Data, West Lafayette, Indiana: Purdue University (1979)
Sneddon, J., Lutze, T.A.: Close-range photograrnmetic measurement of soil erosion in course-grained soils. Photograrnmetric Engr. Remote Sens. 55, 597-600 (1989)
Sombroek, W.: Soil degradation and contamination: A global perspective. Soil and Environ. 5, 3-13 (1995)
Spomer, R.o., Mahurin, R.L.: Time-lapse remote sensing for rapid measurement of changing landforms. J. Soil Water Conserv. 39,397-401 (1984)
Spomer, R.G., Mahurin, R.L., Piest, R.F.: Soil erosion, deposition and sediment yield from Dry Creek, Basin, Nebraska Trans. Amer. Soc. Agric. Engr. 29,489-493 (1986)
Stephens, P.R., Cihlar, J.: Mapping soil erosion in New Zealand and Canada In: Johannsen, C.J., Sanders, J.L. (eds) Remote sensing for resource management, Ankeny, Iowa: Soil Conservation Society of America, pp. 232-242 (1982)
Stephens, P.R., MacMillian, J.K., Daigle, J.L., Cihlar, J.: Use of sequential aerial photographs to detect and monitor soil managernent changes affecting cropland soil erosion. J. Soil Water Conserv. 37, 101-105 (1982)
Stephens, P.R., MacMillian, J.K., Daigle, J.L., Cihlar, J.: Estimating Universal Soil Loss Equation factor values with aerial photography. J. Soil Water Conserv. 40, 293-296 (1985)
Thomas, A.W., Welch, R.: Measurernent of ephemeral gully soil erosion. Trans. Amer. Soc. Agric. Engr. 31, 1723-1728 (1988)
Walling, D.E.: The sediment delivery problem. J. Hydro!. 65, 209-237 (l983) Walling, D.E.: Rainfall, runoff, and soil erosion of the land: a global review, In: Gregory, K.J. (ed.),
Energetics of the Physical Environment, Chichester, England: J. Wiley and Sons, Ltd., pp. 89-117 (1987)
Walling, D.E.: Sediment yield investigations: A perspective 011 recent developments and future needs. Proc. Fourth International Symposium on River Sedimentation, Beijing, China (1990)
Welch, R., Jordan, T.R.: Analytical non-metric close-range photogrammetry for monitoring stream channel soil erosion. Photogrammetric Engr. Remote Sens. 49, 367-374 (1983)
Welch, R., Jordan, T.R., Thomas, A.W., Ellis, J.W.: Photograrnmetric techniques for monitoring soil erosion. Department of Geography, University of Georgia, Athens, GA. Research Report No. IRC 093083 (1983)
Whiting, M.L., DeGloria, S.D. Benson, A.S., Wall, S. L.: Estimating conservation tillage residue using aerial photography. J. Soil Water Conserv. 42, 130-132 (1987)
Wilson, D.A., McCourt, M.L., Humes, T.M.: Multi-ternporalland use analyses for soil erosion in selected Prince Edwards Island (P.E.I.) Watersheds. International Geoscience and Remote Sensing Symposium 1989, pp. 1979-1985 (1989)
Wischmeier, W.H., D.O. Smith, D.O.: Predicting rainfall soil erosion losses. Agr. Handbook No. 537, Washington, DC: USDA (1978)


